Abstract
The objective of this study was to analyze the relationship between economic sanctions and regional differences within Russia from three perspectives: regional favoritism of the political elite, industry development, and trade costs. Using the nighttime lights in Russia, we found a correlation between economic sanctions and regional differences. First, as sanctions increased, the lights of Moscow, St. Petersburg, and provincial capitals were brighter than those of the rest of the country. Second, the lights of manufacturing cities were brighter as sanctions increased. However, under the influence of sanctions, the lights of mining areas of Russia were dimmer than those of other areas. Finally, there were relatively more economic activities in areas close to the Chinese border. The lights of Blagoveshchensk were brighter than that of the rest of the country. In addition, the relationship between economic sanctions and the brightness of lights had the characteristics of stages. There was a negative correlation with the brightness of Russian lights in the early stages of economic sanctions. However, this negative correlation disappeared in the later stages.
1. Introduction
Economic sanctions have become one of the most important tools of statecraft in international politics [1], aiming to change certain policies of target countries by causing economic losses [2]. In March 2014, western countries imposed economic sanctions on Russia in response to the Crimean crisis. Because the government of the Russian Federation did not implement the Minsk Agreement and interfered in the U.S. election and the Amesbury nerve agent incident, western countries have expanded and strengthened economic sanctions against Russia. Although the period of economic sanctions imposed on Russia by the west has been relatively short, it is possible to answer these questions initially: how effective are the economic sanctions imposed on Russia by western countries? How do economic sanctions affect the regional development of Russia? Do economic sanctions promote Russian import substitution industrialization?
The research on the impact of western sanctions on Russia has mainly been from the macro perspective of GDP, trade, exchange rate, and FDI. For example, Tuzova and Qayum confirmed that sanctions had an adverse effect on Russian economic growth [3]. The International Monetary Fund (IMF) in 2015 reported that sanctions may cause Russia’s short-term GDP to drop by 1.0–1.5% and that the medium-term accumulated loss may reach 9.0% of GDP [4]. Economic sanctions affect not only GDP but the investment environment. In 2014, Russia’s net private capital outflows totaled 152 billion USD [5]. Crozet and Hinz analyzed the impact of sanctions on Russian trade and found that the Russian Federation lost US$53 billion under western sanctions [6]. Kholodilin and Netsunajev showed that economic sanctions impacted not only on Russia’s economic growth but the real effective exchange rate [7].
Unlike in most macro studies. Ahn and Ludema used company-level survey data. They showed that target companies lost about one-third of their operating income and more than half of their assets compared with companies that were not sanctioned [8]. Golikova and Kuznetsov, based on the latest survey of manufacturing companies, confirmed that sanctions were harmful not only to target companies but to all companies that performed better in foreign trade with the E.U. and Ukraine [9]. Shida further confirmed that about half of the corporate managers interviewed felt the negative impact of sanctions to a certain extent. Moreover, there were no regional differences in the impact of sanctions on companies. The sanctions even had impacts on companies close to the Asia–Pacific region with close ties with Asian countries [10].
Previous studies mainly analyzed the impact of economic sanctions from the macroeconomic level and the micro level of the company. The sanctions against North Korea provide a good example. During the sanctions, the brightness of lights in the capital and provincial capitals was relatively bright because of the close connection of these cities with the ruling elite [11]. However, as an external shock, the impact of economic sanctions on Russian internal economic differences has not been effectively verified. The relationship between economic sanctions and regional differences can be explained from several perspectives. First is regional favoritism. Political elites allocate limited resources to regions they deem important. Second, economic sanctions usually act as protective tariffs and promote the development of import substitution industries [12], which in turn affect economic activities in manufacturing areas. Finally, sanctions may also affect regional differences through trade costs.
In this paper, we attempted to empirically examine the relationship between economic sanctions and the brightness of Russian lights and contribute to the literature in three ways. First, the target countries of previous sanctions were usually small [13,14,15]. However, the target for this time is the country with the largest territories and one that was once a superpower in the world. Moreover, Russia is rich in natural resources and relatively sound industrial types. Studying economic sanctions against Russia may increase understanding of the effectiveness of economic sanctions. Second, measuring the sanctions index is a challenge for the academic community. This paper built a comprehensive sanctions index based on Russia’s sanctioned economic sectors and incorporated economic sanctions into the model to test the impact of sanctions. Finally, early research focused on the relationship among economic growth, oil prices, exchange rates, trade, corporate earnings, and economic sanctions. Little attention has been paid to the relationship between sanctions and the internal regions of the target country. Therefore, this paper analyzed the impact of economic sanctions on Russia from the perspective of the internal regions of the target country, making up for the deficiencies of previous research.
In fact, research on regional economic differences has always faced data problems. The first reason is that core economic statistics such as GDP may be artificially interfered with. On the one hand, there are problems such as inconsistent statistical standards and inaccurate price indices for GDP. On the other hand, political pressure from local governments can lead to falsified GDP figures [16]. Second, it is difficult to calculate the economic data of specific regions, cities, or subdivision geographic units within a country. This makes it difficult to break the administrative unit to reflect internal regional economic activities within a country. The nighttime lights are not interfered with by human factors relative to the GDP data. They can reflect some information that is difficult to include in the GDP data, such as the informal economy or underground economy, which are accurately recorded [17]. In addition, the nighttime lights have a high geographic spatial resolution, providing more abundant and accurate geographic unit information [18]. Prior research has used nighttime lights for socioeconomic analysis [19,20,21]. Therefore, this paper used nighttime lights to measure the level of regional development and analyzed the impact of economic sanctions on the brightness of lights in Russia by constructing an economic sanctions index.
The results of this paper are as follows. There was a negatively correlation with the brightness of Russian lights in the early stages of economic sanctions. However, this negative correlation disappeared under continuous sanctions. From the perspective of Russia’s internal regional differences, we found that the lights in Moscow, St. Petersburg, and provincial capitals were brighter than those in the rest of the country. This shows that under the effect of regional favoritism, political elites allocated limited resources to Moscow and St. Petersburg, forming a unique economic geographic structure. In addition, as sanctions increased, the lights in manufacturing cities became relatively brighter, indicating that economic sanctions promoted the development of import substitution industries. However, our research also found that as sanctions increased, the brightness of the lights in Russia’s domestic mineral areas dimmed. Finally, as sanctions increased, the Russian city of Blagoveshchensk near the Chinese border became relatively brighter. This shows that under continuous economic sanctions, China–Russia economic and trade relations grew closer. However, in areas closely related to the sanctions-sending countries, the lights of the Kaliningrad Oblast, west port city, and west port area did not dim.
Our analysis is organized as follows: the second section introduces the theory and hypotheses, as well as analysis of the relationship between economic sanctions and regional differences from three perspectives. The third section introduces data and methods. The fourth section presents the estimation results, including the tests of robustness. The final section presents conclusions.
2. Theoretical Analysis and Research Hypothesis
2.1. Regional Favoritism
One explanation for the relationship between economic sanctions and regional differences in Russia may be regional favoritism. Some political leaders choose preferential policies for their favorite regions, which is regional favoritism. In the acquisition and distribution of resources, the regions favored by political leaders have a promoting effect in infrastructure investment [22], project approval [23], and transfers [24,25]. Because of the economic sanctions of western countries and falling oil prices, Russia’s domestic economy began to experience a severe recession. Moscow and St. Petersburg are more important than other cities in the Russian Federation. In addition, Moscow and St. Petersburg have gathered many companies from different economic areas, including many companies sanctioned by western countries, which constitute key sectors of the Russian economy. In addition, Moscow and St. Petersburg are closely connected with political elites. The government of the Russian Federation is at the top of this political and economic system [26]. In the process of fighting crisis, resources can be allocated to areas deemed important by the political leadership through a series of administrative and institutional means. Therefore, Moscow and St. Petersburg naturally receive more policy and financial support. Ades and Glaeser further explained the determinants leading to the absolute dominance of big cities. They believed that high tariffs, high-cost domestic trade, and low-level international trade had further strengthened the population concentration of large cities and shaped the unique economic geographic structure in which large cities dominate in closed economies [27].
Although western countries have imposed sanctions on Russia’s economic elites and key industries, these sanctions may affect the economic well-being of citizens by slowing economic growth more generally. In 2012, Russia resumed direct elections of local chief executives [28]. Therefore, votes of ordinary people are increasingly important to local political elites. Most provincial capital cities have a larger population and a better economic foundation than other cities in the state. To revive the state’s economy and gain support from local voters for the government, local political elites transferred limited resources to the area around their provincial capitals. Therefore, following hypothesis was presented:
Hypothesis 1 (H1):
When sanctions increase, Russia’s domestic political elites allocate limited resources to large cities and provincial capitals. The estimated results of Moscow, St. Petersburg, and provincial capitals should be positive.
2.2. Industry Development
Another explanation for the relationship between economic sanctions and regional differences in Russia is the industrial development. Import substitution usually refers to the protection and development of domestic manufacturing by restricting the import of industrial manufactured products, promoting domestic industrialization [29,30]. Selden argued that economic sanctions usually act as protective tariffs and lead to import substitution industrialization [12]. In 2014, the Crimean crisis led to western countries imposing economic sanctions on Russia. A senior Russian official stated that economic sanctions may become a powerful impetus for Russia to develop its industry and find economic and trade partners [31]. Russia cannot obtain military technology or energy-related equipment or technology from western countries, even slightly more sensitive civilian technologies. Therefore, Russia’s national security is threatened. In response, Russian government officials formulated economic policies and developed import substitution industries to reduce the impact of western sanctions. The government committee on import substitution was established in August 2015. Subsequently, a detailed import substitution plan was proposed, initially including more than 2000 projects in 19 economic fields. This increased resource allocation to areas targeted by western sanctions, such as the national defense and oil and gas equipment industries. In addition, relevant policy support was provided to enterprises participating in import substitution. These policies included preferential loans, preferential access to national procurement funds, and financial support for import substitution in the form of tax cuts [26]. Historically, Zimbabwe has adopted an import substitution strategy that could make the country prosper even in the face of severe economic sanctions [32].
For the Russian energy sector, western countries’ restrictions on Russian energy extraction technology affect not only the development of new oil and gas wells but the oil production efficiency of oil wells. In addition, financial restrictions on the Russian energy sector affect the operations of energy companies. Although economic sanctions have stimulated the development of Russia’s import substitution industry, Russia cannot replace energy extraction technology and equipment of western countries with domestic products in the short term. The long-term development of Russian energy sector has been affected by technological constraints and financial sanctions. Therefore, we proposed the following hypothesis:
Hypothesis 2 (H2):
When sanctions are increased, compared with other areas of the country, the lights in manufacturing cities should be brighter. However, the lights in mining areas should be dimmer than that in other parts of the country.
2.3. Trade Cost
Trade costs may be an important factor in explaining the relationship between economic sanctions and regional differences in Russia. Economic sanctions can be considered as prohibitive tariffs [33], increasing the relative trade costs of the target and sender country. Meanwhile, they reduce the relative trade costs of the target country and the countries not involved in the sanctions. Therefore, economic sanctions have changed the trade costs in different regions, which in turn has caused differences in regional economic development. For example, after Mexico and the United States signed a free trade agreement, trade tariffs between the United States and Mexico were reduced, and Mexico’s production activities near the U.S. border increased [34]. Economic sanctions have strained relations between Russia and western countries. To seek new impetus for the national development, Russia began to accelerate the pace of eastward advancement [35] and strengthen cooperation with Asia–Pacific countries including China, the world’s largest emerging economy. This was to make up for the economic losses caused by the recent deterioration in relations with western countries [10].
Russia is the third largest trading partner of the E.U., and the E.U. is Russia’s largest trading partner and most important foreign investor [36]. Gould-Davies showed that if the sanction sender country and the target country were partners rather than opponents in the past, and there was a strong trade relationship between them, then the sanctions would be more likely to have an effect [37]. In fact, EU sanctions against Russia are limited to trade in specific commodities. The traded goods subject to sanctions include an arms embargo, prohibiting the export of dual-use goods, and restricting Russia’s access to certain sensitive technologies and services that can be used in oil production and exploration [38]. Other countries have successively introduced similar sanctions. However, the EU has not imposed trade restrictions on Russia’s core economic sectors, mainly the export of oil, natural gas, and raw materials [39]. The sanctions imposed by the EU have a limited effect on the increase in trade costs and only selectively increase trade costs. Therefore, the following hypothesis was presented:
Hypothesis 3 (H3):
Economic sanctions have increased Russia’s trade ties with nonsanctioning countries and should therefore brighten the lights in areas that have trade ties with nonsanctioning countries. The scope of E.U. trade sanctions against Russia is narrow, and the increase in trade costs is limited. Therefore, sanctions in regions with close trade relations with the E.U. may not dim the lights.
3. The Data and Methods
3.1. Data
The data of nighttime lights were from the Visible Infrared Imaging Radiometer Suite (VIIRS) Day/Night Band (DNB) produced by the Earth Observations Group (EOG) (https://eogdata.mines.edu/nighttime_light/annual/v20/ (accessed on 28 May 2021)). This version of the nighttime lights eliminates temporary burning, aurora, volcano and other background noises. We set the negative DN value of grid cells to 0 and finally obtained the annual nighttime lights. Then, we transformed the processed nighttime lights into an Albers equal-area projection. In this paper, we took the arithmetic mean of each 2 × 2 grid cells as a 1 × 1 grid and used it as the geographic unit for analysis. This process generated 6,447,786 grid cells in Russia. Existing studies have used nighttime lights to study the impact of sanctions on the Rostov region. Brock showed that despite sanctions, Rostov’s rural areas and cities near the Ukrainian border still showed good economic performance because of active military activities and import substitution policies [40]. The administrative division data in this paper were from the OMS [41]. We identified the manufacturing cities based on the Russian atlas and related data [42,43]. The port data were from Humdata [44]. The port area with the largest area was the center on the port, with a radius of 2 km to determine the port area. The U.S. Geological Survey provided the coordinate information for the mining areas. In this paper, the area within 3 km of the coordinates was identified as the mining area. The oil and gas areas were from the U.S. Geological Survey [45]. There may have been overlaps between oil and gas areas and urban areas. Therefore, we used Liu to identify oil and gas areas that overlapped with urban areas [46].
According to the territorial characteristics of Russia, the administrative hierarchy of cities, and Lee [11], this paper divided Russia into many areas: Moscow, St. Petersburg, provincial capitals, other cities (excluding municipalities, provincial capitals, manufacturing cities, and port cities), manufacturing cities, mining areas, port cities, port areas, and the Kaliningrad Oblast. We merged the nighttime lights with Russia’s administrative boundaries through Geographic Information System (GIS) software to identify the province and county of each grid cell. Grid cells were further identified by dummy variables indicating grid cells of Moscow, St. Petersburg, provincial capitals, other cities, manufacturing cities, mining areas, Russian border areas close to China, port cities, and port areas. It is worth explaining Blagoveshchensk and Kaliningrad Oblast. Blagoveshchensk is the largest city on the border between China and Russia. With western countries imposing sanctions on Russia, the economic and trade exchanges between China and Russia have increased. Kaliningrad Oblast is a region in the westernmost part of Russia. It is completely disconnected from the Russian mainland and has relatively close economic and trade relations with Europe. Economic sanctions from western countries can reduce economic and trade ties with the region. However, the Russian government can pay more attention to Kaliningrad Oblast because of its special geographical location. We divided the port cities and port areas into two parts to distinguish the impact of sanctions on port city and port areas in different regions.
3.2. Sanctions Index
As a result of the referendum in March 2014, Crimea declared independence from Ukraine and then joined the Russian Federation. In the same month, western countries announced that they would impose sanctions on Russian and Ukrainian officials who were responsible for the “breaking the sovereignty of Ukraine” by the Russian government. Since then, western countries have imposed sanctions on Russia. The development of sanctions can be roughly divided into three stages.
The first stage was the warning sanctions stage. In March 2014, U.S. President Barack Obama signed Executive Orders 13660, 13661, and 13662 to impose sanctions on specially designated nationals and blocked persons (SDN). These included Russian politicians, military officers, separatists, and oligarchs who endangered the territorial integrity and the sovereignty of Ukraine. The United States adopted restrictive measures to prohibit travel and freeze the assets of certain individuals and groups. Subsequently, U.S. allies also adopted similar sanctions. Diplomatic sanctions included the cancellation of the G8 meeting held in Sochi, Russia and the suspension of Russia’s membership in the G8.
The second stage was the substantive sanctions stage. The United States Department of the Treasury’s Office of Foreign Assets Control (OFAC) imposed sectoral sanctions on 16 July 2014 targeting the finance, energy, and defense sectors of Russia. The financial sanctions restricted Russian financial institutions’ access to U.S. capital markets for financing. They also shortened the maturity of new bonds issued by six Russian banks from 90 days to 30 days. Energy-related sanctions prohibited U.S. companies from cooperating with important Russian energy companies and prohibited Russian from obtaining certain sensitive technologies and services that can be used for oil production and exploration. The export of dual-use goods to Russia was prohibited, and the assets of Russian defense companies in the United States were frozen. Similar sanctions were imposed by Australia, Canada, Japan, Norway, Switzerland, and Ukraine.
The third stage was the expansion and strengthening stage. In 2016, Russia intervened in the U.S. election, and the United States increased economic sanctions against Russia. The U.S. Treasury Department announced the freezing of the assets of dozens of large Russian entities in the United States. In August 2018, the United States strengthened its sanctions against Russia because Russia used nerve agents to assassinate British citizen Sergei Skripal and his daughter Yulia Skripal. The sanctions included ending arms sales and financing restrictions on arms sales and expanding export restrictions on specific commodities.
Constructing a reasonable sanction index is a challenge for scholars. Dreger first attempted to evaluate the impact of economic sanctions on Russia by constructing a sanctions index [47]. Kholodilin and Netsunajev and Bali conducted further research [7,48]. Dreger divided sanctions into (1) sanctions against individuals, (2) sanctions against specific entities, and (3) sanctions against the entire economic sector and then set weights of 1, 2, and 3 according to their degree of impact [47]. However, this weight setting may be too subjective because the sanctions against the economic sector are implemented through sanctions on entities in this sector. For example, sanctions against specific entities, with a weight of 2, include those against military–industrial entities. However, the military entity belongs to the defense sector, and the weight should be set to 3. The target areas of western countries’ sanctions against Russia have mainly been concentrated in the financial, energy, and defense sectors, which are very important to Russia’s domestic economy. Therefore, from the perspective of the target country, this paper constructed a comprehensive sanctions index by classifying the sanctioned sectors of the target. This method can better measure the impact of economic sanctions on the target country. Although the sanctions index constructed in this paper is not perfect, it can provide a reference for studying the impact of sanctions on a country. The sanctions index in this paper was constructed as follows. The sanctions index refers to the cumulative sum of the number of sanctions events each year. The Suomi National Polar-Orbiting Partnership (NPP) Satellite with VIIRS sensor was launched in October 2011. NPP was a new satellite used to monitor nighttime light. Limited by light data availability, we set 2012 as the first year in this study, with a sanctions index of zero. The sanctions index is
According to the sector on which sanctions were imposed on Russia by western countries, sanctions were divided into financial sector sanctions , military sector sanctions , energy sector sanctions , and other sanctions . Other sanctions refer to sanctions from western countries on individuals and entities that are not in the financial, military, or energy sectors. represents the sender country. We first took financial sanctions as an example. If there are any financial-related sanctions in year t in the United States, the European Union, Canada, Australia, etc., the financial sanction value increases by 1. If there is no new financial sanction in year t, the financial sanction value is 0. If financial sanctions are reduced in the t year, the financial sanction value is reduced by 1. In addition, this paper constructed a sanction index in the form of 0 and 1 to test its robustness. Statistical information on sanctions against Russia is shown in Table A1 of Appendix A.
It is worth noting that the sanctions index was constructed without considering sanction threats and Russian countersanctions. There were two reasons why. First, the United States is the leader in economic sanctions against Russia, and other countries and organizations are followers. Although Washington announced that it would impose sanctions on Russia, the formal sanctions against Russia were signed shortly afterwards. Therefore, it was difficult to eliminate the threats of sanctions. Second, Russia’s main countersanction is to restrict the import of agricultural products and food from sender countries, and the effect of this on the brightness of the lights is negligible. Therefore, the threat of sanctions against Russia and Russian countersanctions were not considered in this paper.
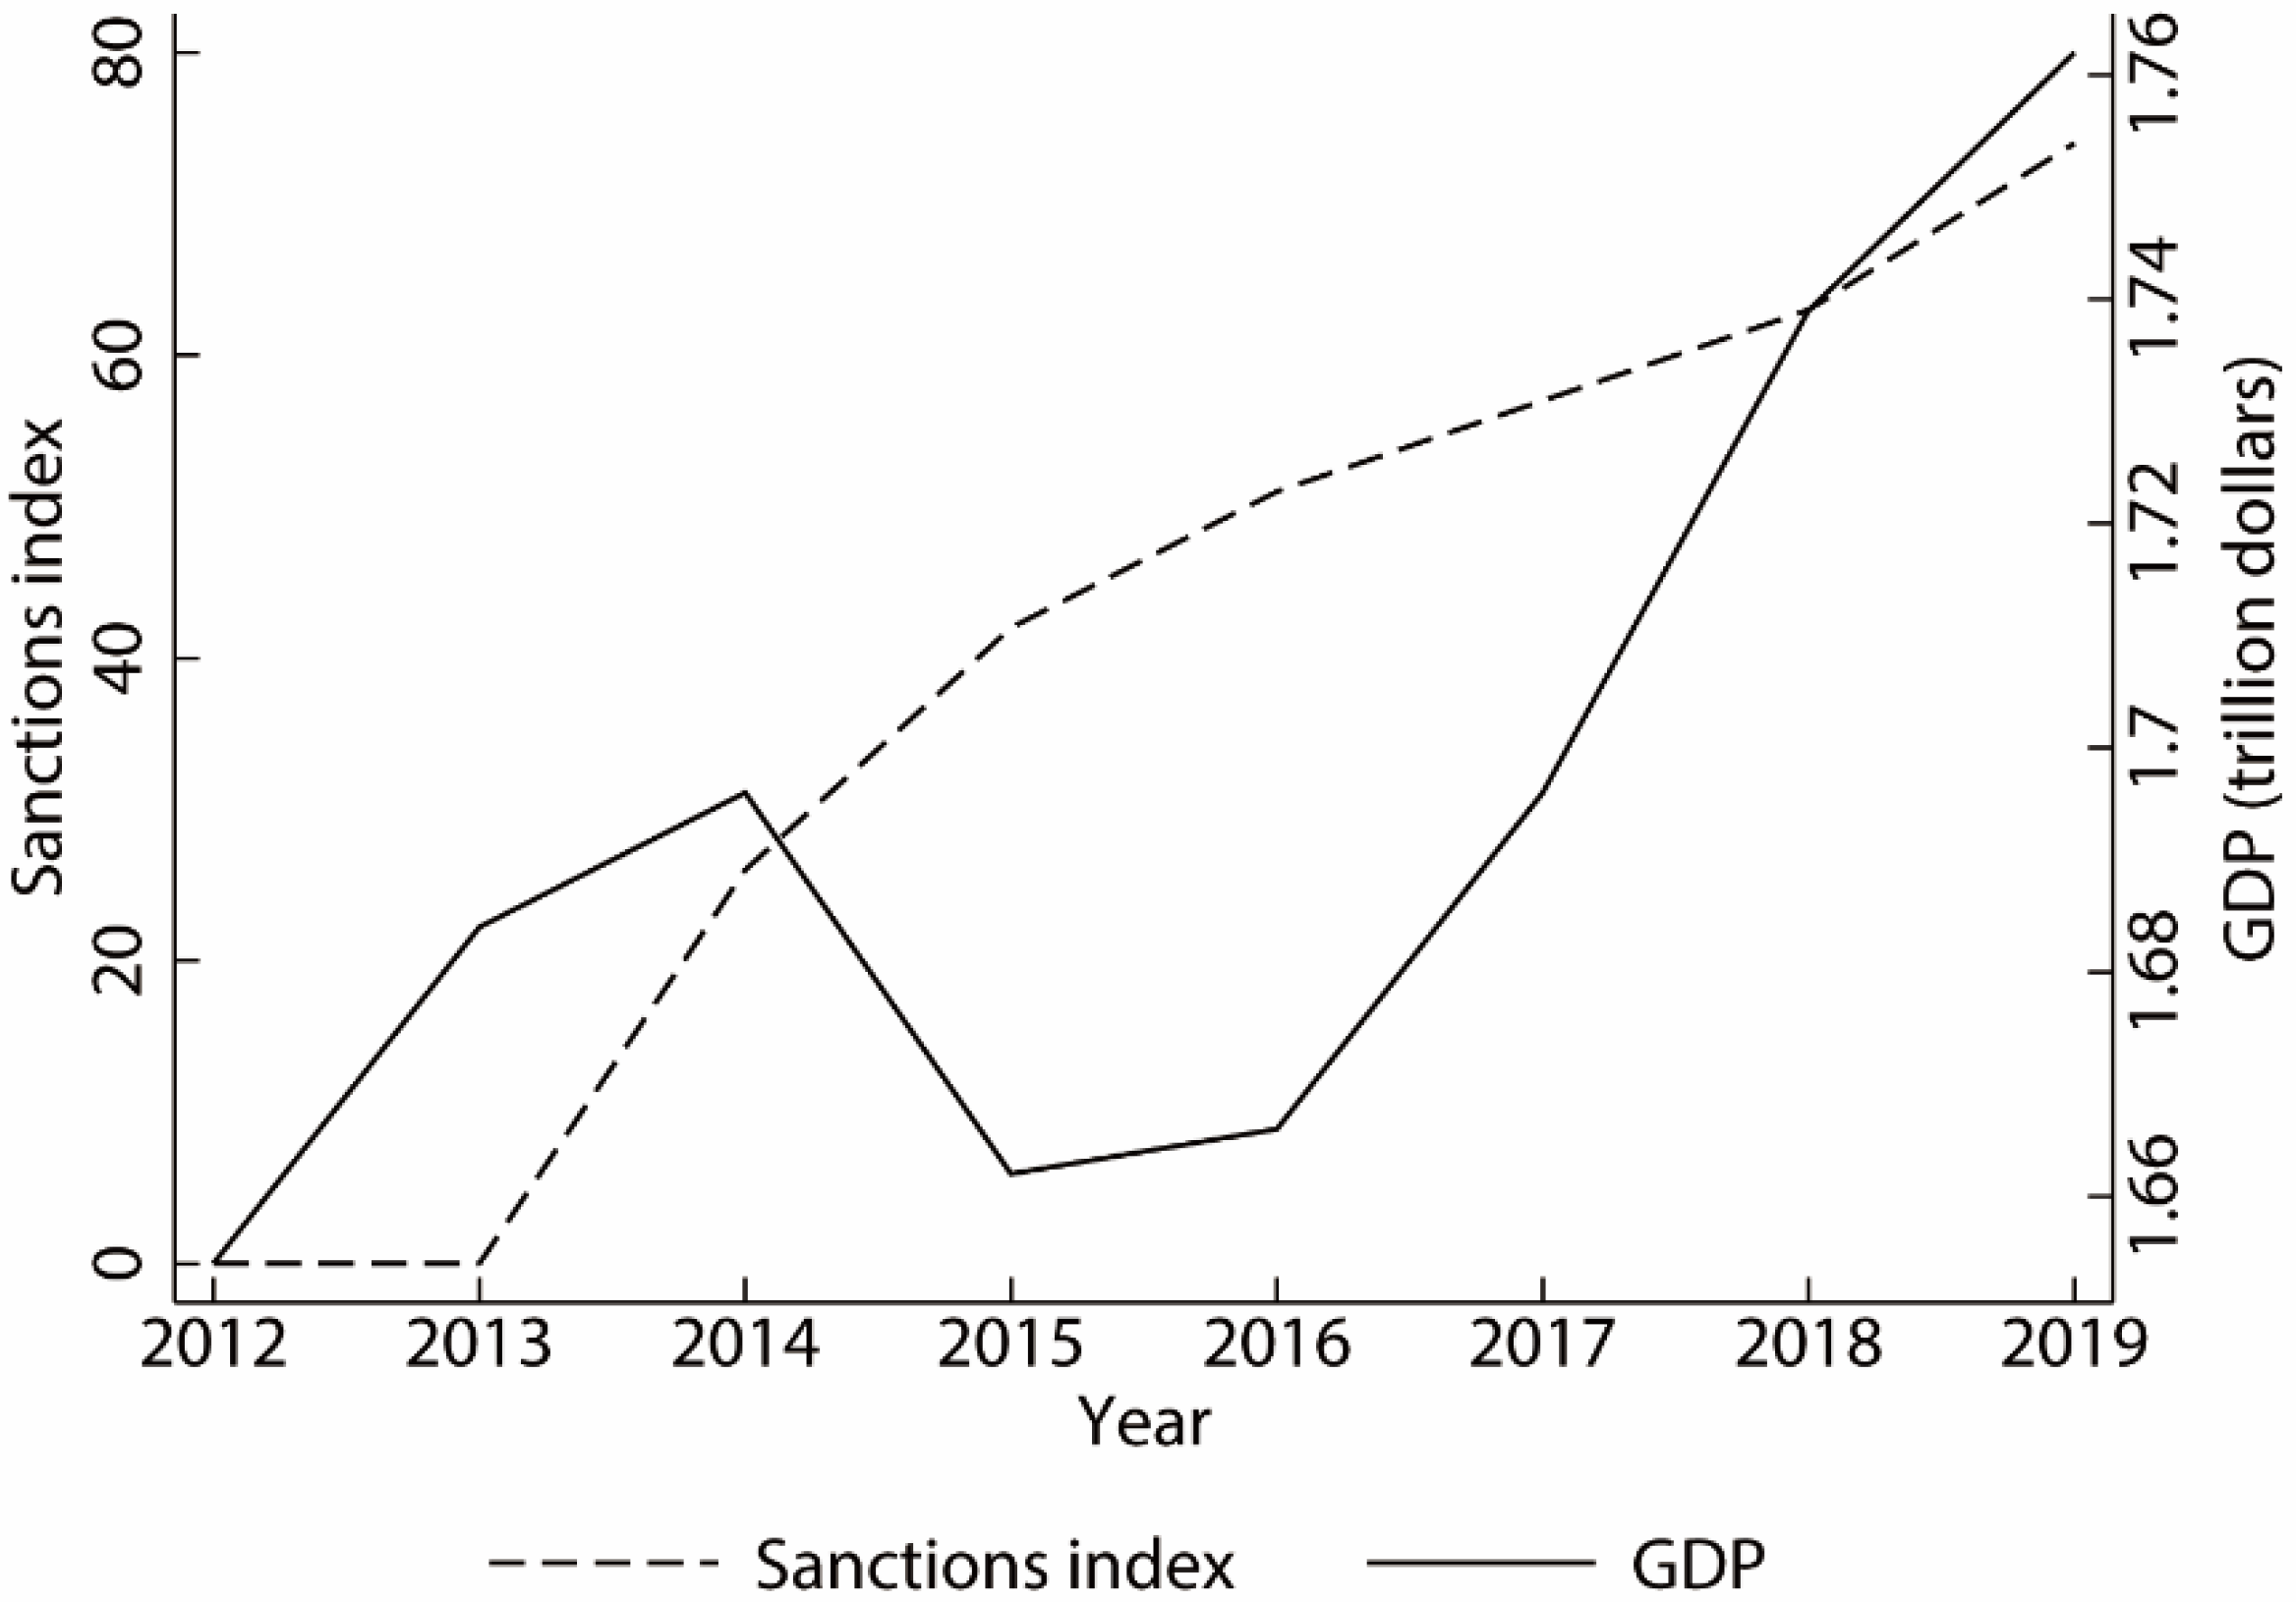
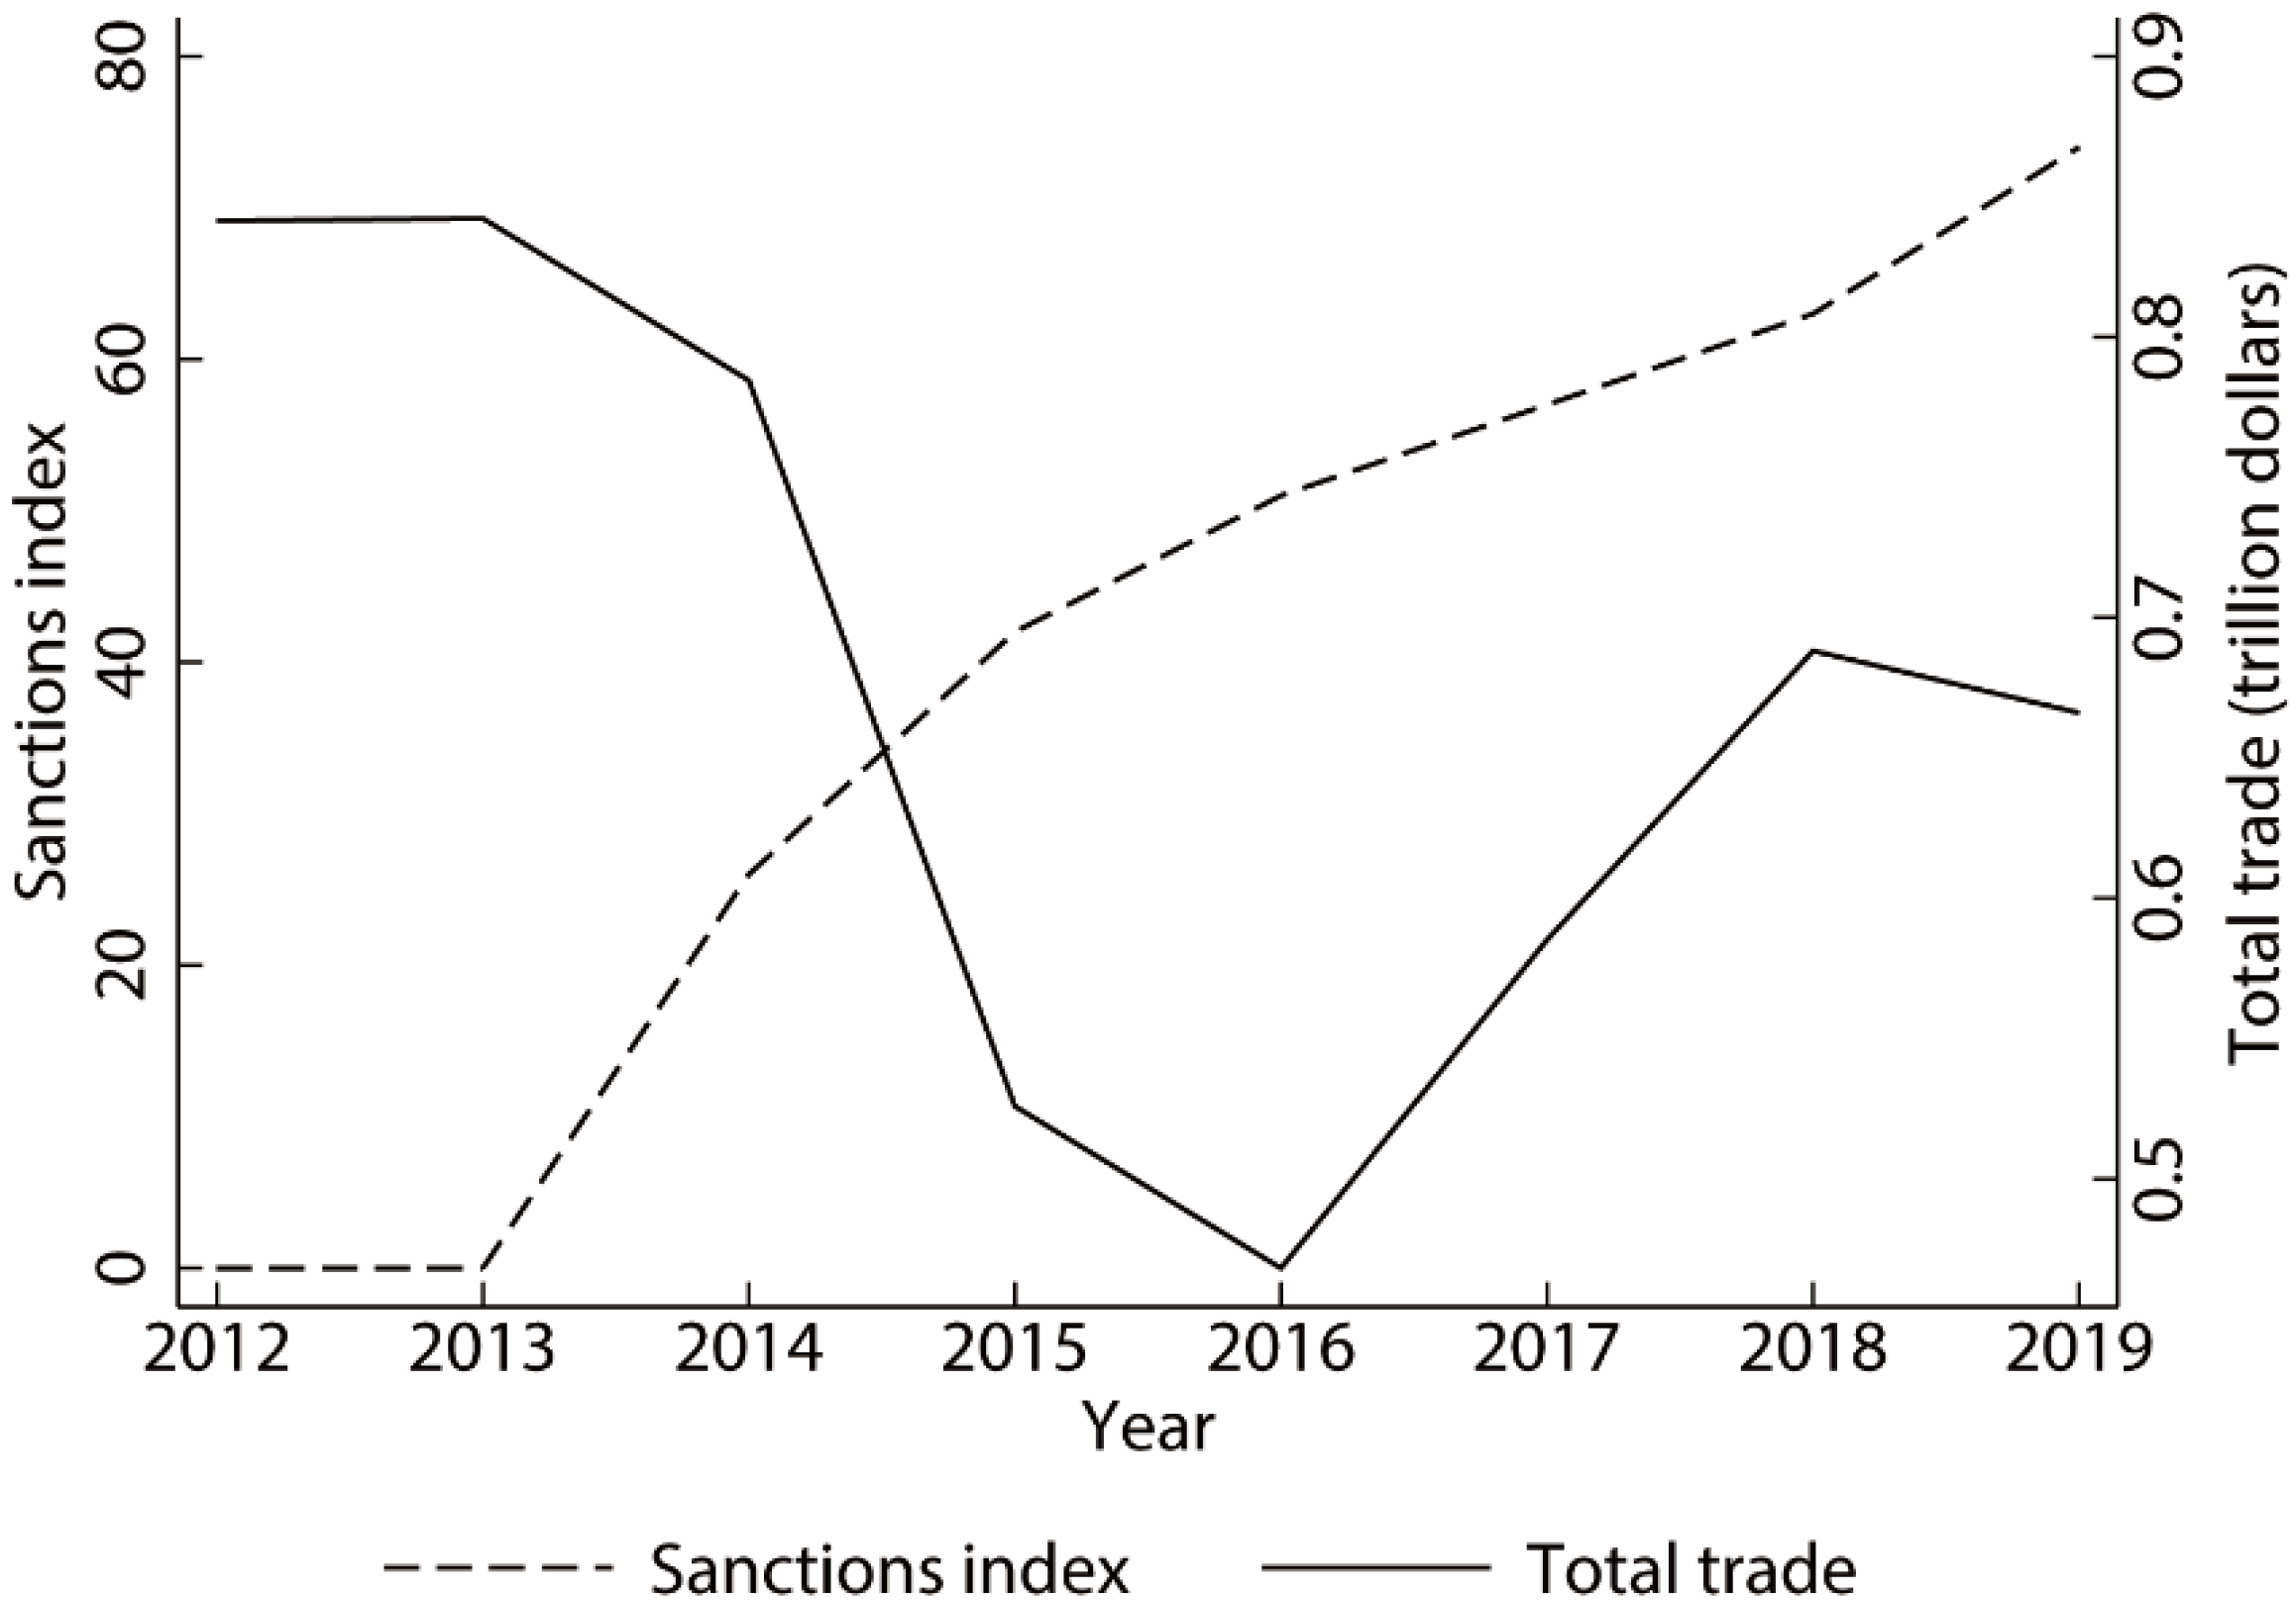
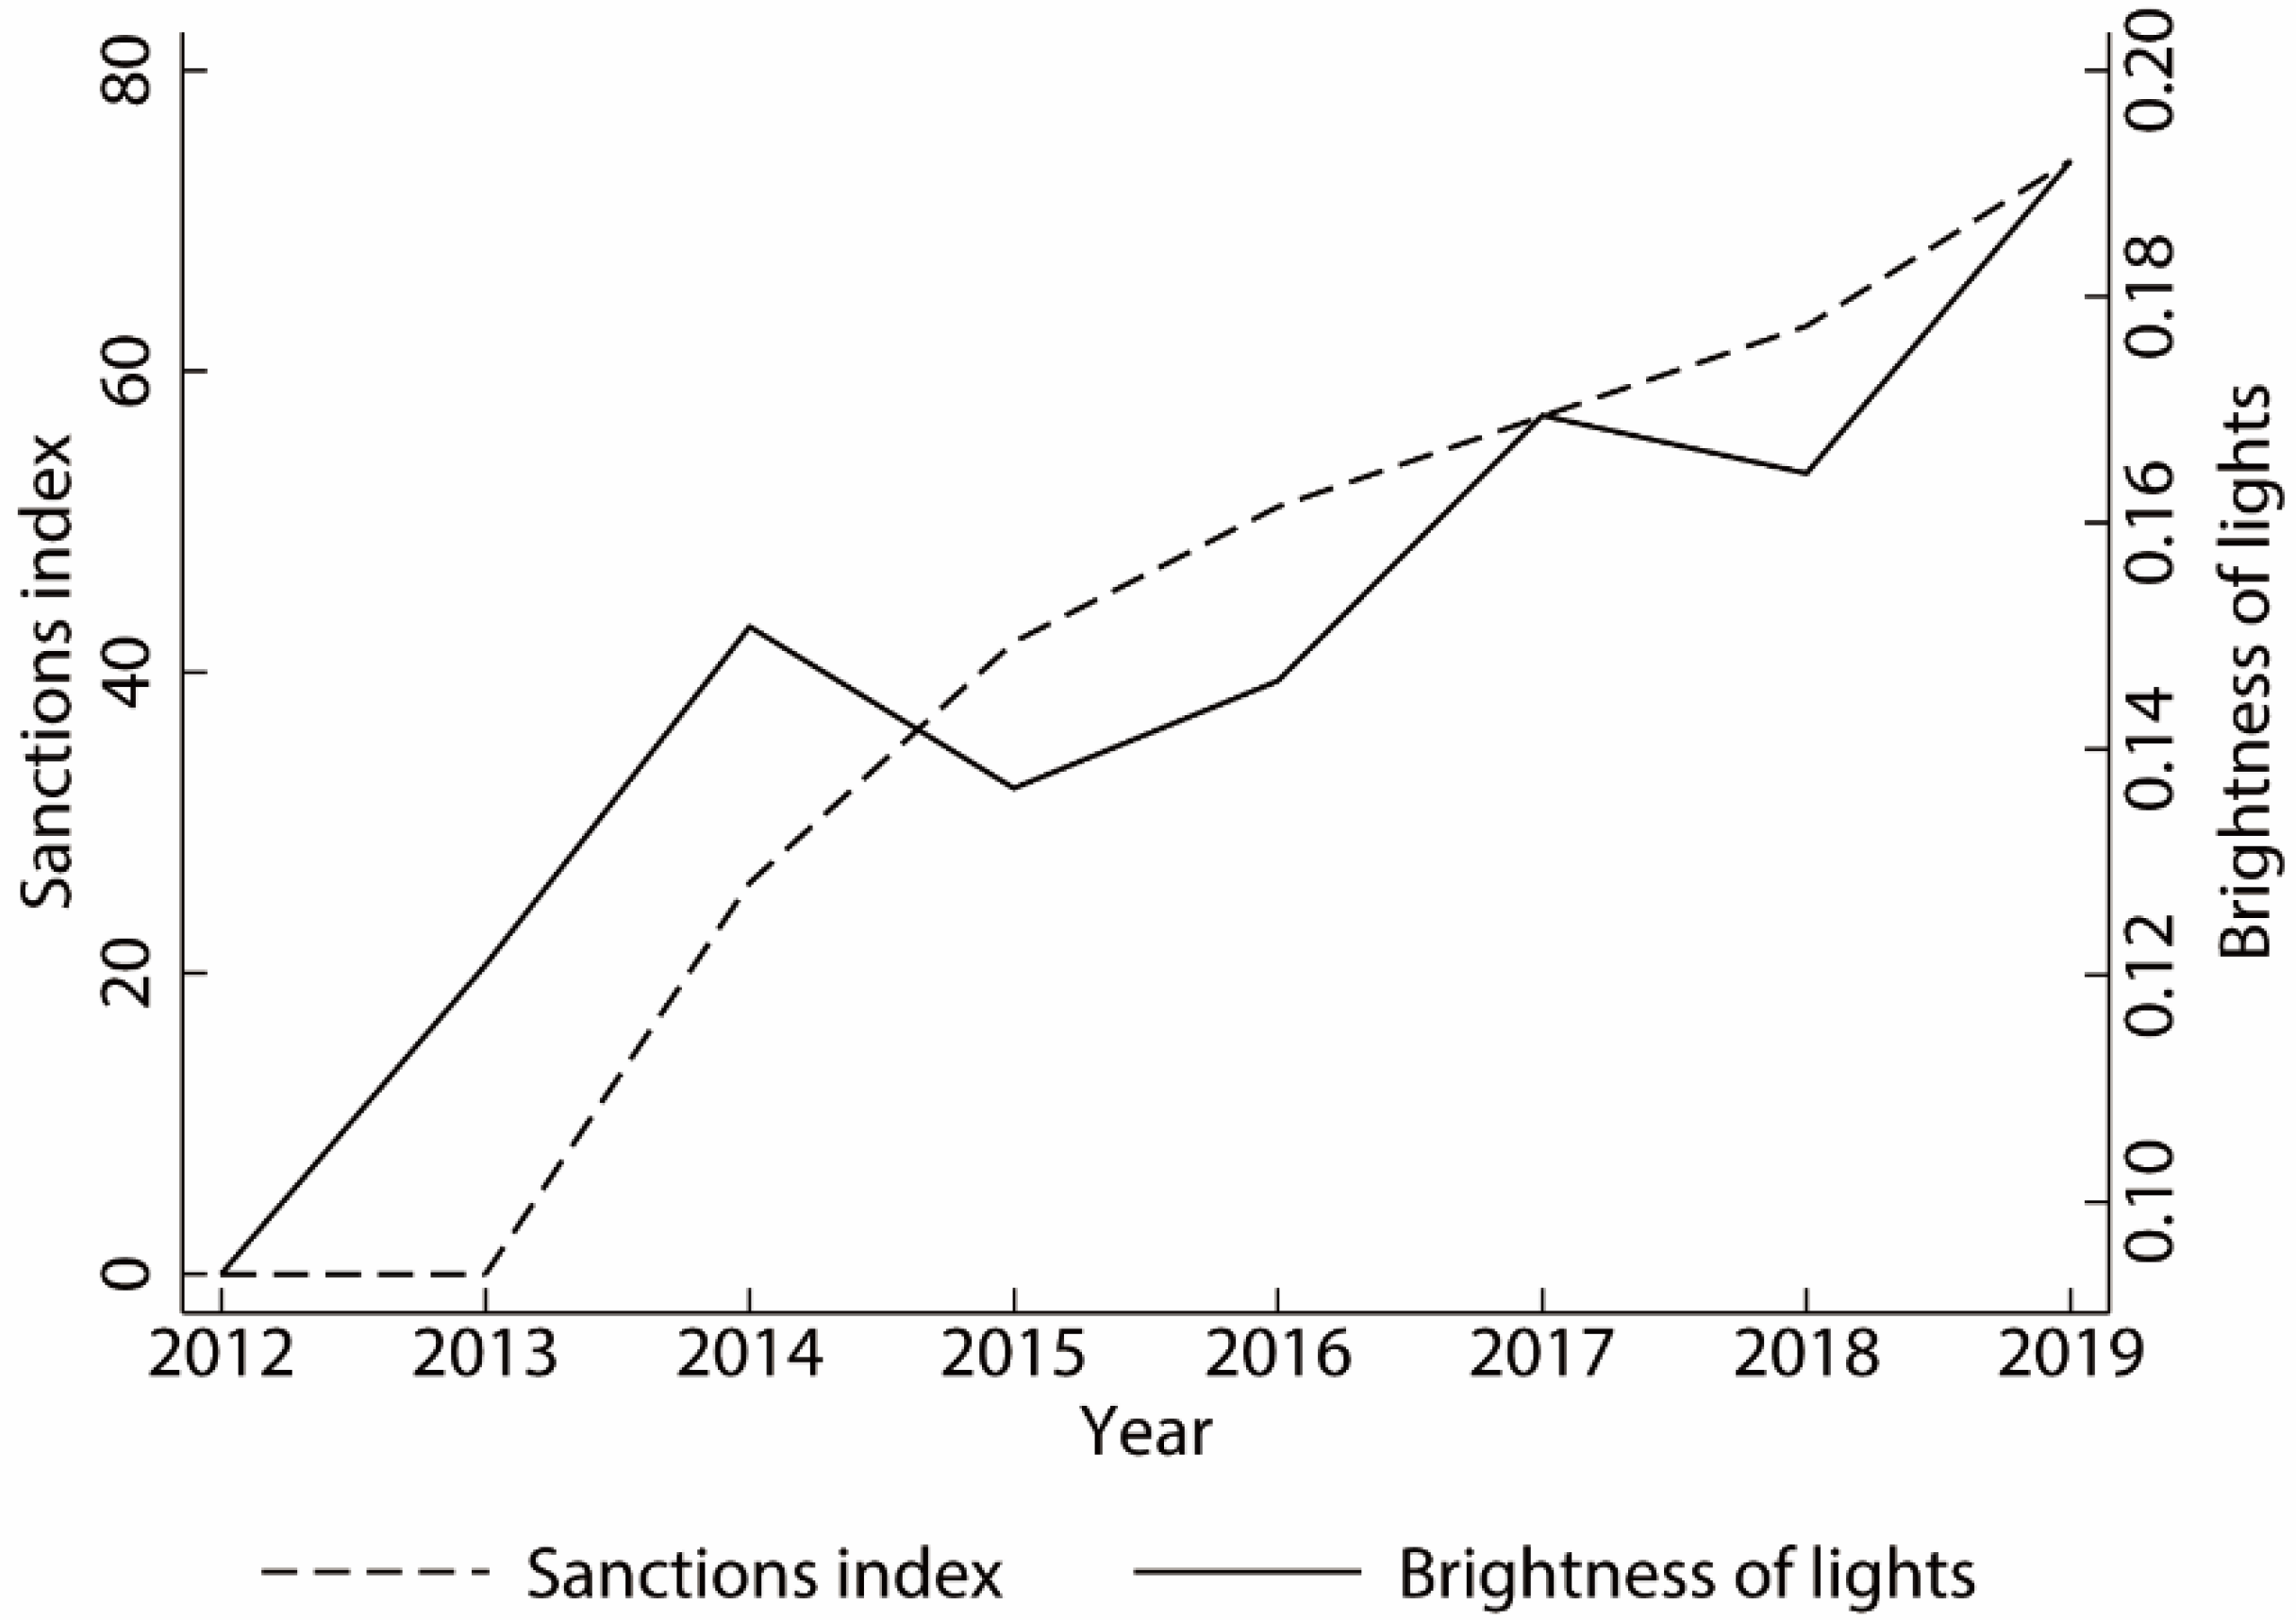
The relationship between the sanctions index and the Russian GDP during the sample period is shown Figure 1. Since western countries imposed sanctions on Russia in 2014, Russia’s GDP growth has slowed. During the sample period, Russia’s GDP reached its lowest point in 2015. After 2016, Russia’s GDP began to grow. The relationship between the sanctions index and total Russian trade during the sample period is shown in Figure 2. Before the sanctions, Russia’s foreign trade was already in recession. Economic sanctions accelerated the decline in Russian trade. From 2017 to 2019, Russia’s total foreign trade began to slowly recover. The relationship between the sanctions index and the brightness of lights in Russia is shown in Figure 3. Because western countries imposed sanctions on Russia in 2014, the average brightness was dimmer than that in the previous year. However, the average light brightness value of Russia began to fluctuate and rise in 2016. The change in the brightness of lights was basically similar to changes in GDP.
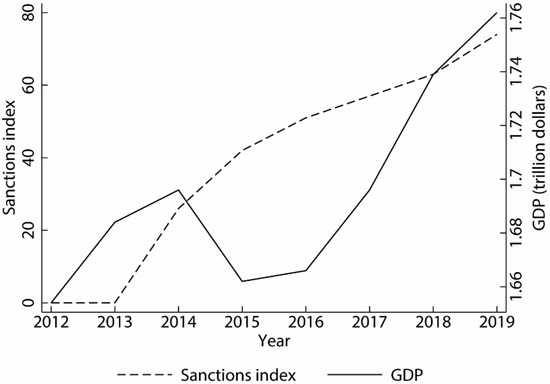
Figure 1.
Sanctions index and GDP. Data source: World Bank, GDP (2010 constant price USD).
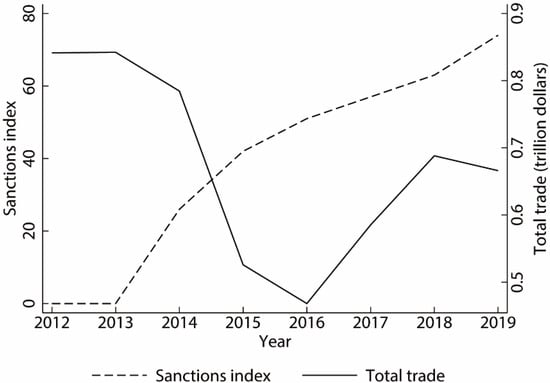
Figure 2.
Sanctions index and Russia’s trade. Data source: IMF.
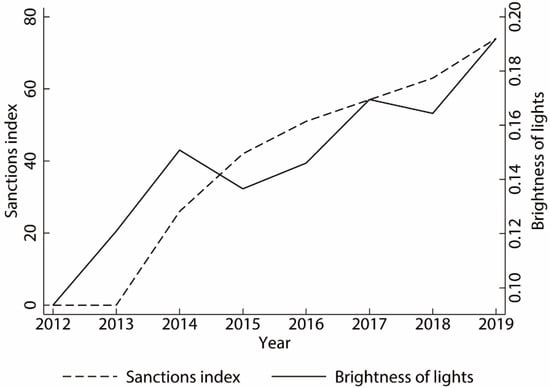
Figure 3.
Sanctions index and the brightness of lights of Russia.
3.3. Methodology
This paper used a panel model to study the relationship between economic sanctions and regional differences. The basic regression was
where lightit is the light-brightness value of each grid cell i in year t. Since a substantial share of the value of grid cells in Russia was zero, we followed the literature and added 0.01 before taking natural logarithms to avoid removing a large number of 0-valued cells [49]. = {,,…} is the set of dummy variables that identify grid cell characteristics. In the base regression, included dummy variables equal to 1 if the grid cells were in Moscow, Saint Petersburg, a provincial capital, another city, a manufacturing city, a mining area, a port city, or a port area. Because of the time-lag effect of sanctions on the brightness of lights in Russia, this paper lagged the sanctions index by one period. Furthermore, this avoided a reverse causal relationship between sanction and brightness. indicates that the sanctions index lags one period, and the coefficient of interest is . If the lights in a specified region are brighter than those in other areas as the sanctions increase, is positive. It is worth noting that Russia’s crude oil exports account for more than half of its total exports, nearly 7.6% of Russia’s GDP. The significant changes in oil prices during our study may have resulted in regional differences. Therefore, the oil price was controlled in the model: represents the oil price, and the coefficient is . This paper used Brent crude oil prices to represent the international crude oil price, because they are used to set the price of most of the world’s internationally traded crude oil supplies. It is worth noting that Russia’s fiscal budget is based on the price of crude oil in the previous year. However, during the sanctions period, international crude oil prices fluctuated significantly, and Russia timely adjusted its fiscal budget to reduce fiscal expenditures based on changing international crude oil prices. Therefore, this paper did not lag the international oil prices.
Taking into account the impact of other factors on the brightness of lights, combined with the availability of data, we controlled the population size (pop), road length (road), fixed assets (assets), and regional economic scale in the model. represents the aforementioned control variable. The population size is expressed by the total population of the area. Anderson found that there was a correlation between population and the brightness of lights [50]. The length of the road is expressed by the total length of the illuminated part of the street, lane, and embankment at the end of the year. The longer the illuminated road, the brighter the lights may be in that area. Fixed assets are represented by the total fixed assets of commercial and noncommercial organizations. Fixed assets include houses, buildings, transportation vehicles, and other equipment related to production and business activities. Therefore, the greater the total fixed assets, the more brightness is produced. The above data came from the Federal State Statistics Service (https://www.gks.ru/dbscripts/munst/ (accessed on 1 May 2021)). The size of the regional economy is an important factor affecting the brightness of the lights. However, the Russian Federal Statistical Office lacks GDP data for the municipal areas. Wang believed that there was a significant positive correlation between night light intensity and regional GDP. This indicates that night light intensity can replace GDP under certain conditions [51]. Therefore, this paper used the regional average value of light brightness (avgntl) to replace the economic level of the municipal area to control the economic scale of the region. The financial expenditure of local governments may affect the brightness of lights in the region. However, the financial revenue of local governments is affected by economic sanctions and oil prices. This paper did not consider the financial expenditures of local governments to prevent commonality. The year fixed effects control the unobserved satellite characteristics as well as unobserved annual patterns in the data. The grid cell fixed effects control for time-invariant, location-specific factors. Standard errors were clustered at the municipal district level to study the correlations between grid cells within the region and across time. All regression estimates were based on Stata 15. The descriptive statistics of the variables are shown in Table 1.

Table 1.
Descriptive statistics.
4. Empirical Results
4.1. Benchmark Regression Results
The basic regression results are shown in Table 2. Columns (1) and (2) are pool regression results. The Hausmann test results in columns (3) to (6) rejected the assumption of random effects, so the fixed effects were used in this paper. Columns (3) to (6) report the regression results for the entire sanctions period from 2012 to 2019. We added control variables in column (4) and a lag term for the brightness of the light in column (6).
Table 2.
Basic regression results.
First, column (3) of Table 2 examines the relationship between sanctions index and the brightness of the lights. Column (3) of Table 2 shows that the sanctions index was positive and significant at the 1% level. As sanctions increased, the brightness of the lights in Russia did not dim because the target country reduced the impact of economic sanctions on the brightness of lights through the adjustment of economic structure [52]. Column (5) of Table 2 shows the impact of economic sanctions on the brightness of lights in different regions of Russia. The results showed that the estimated coefficients of the interactive terms in Moscow, St. Petersburg, and provincial capitals were positive and significant at the 1% level. The coefficient estimates of interactive terms in other cities were positively correlated with the brightness of lights. However, there was no statistical significance. This result verified Hypothesis 1. Political elites allocate limited resources and public goods to areas they deem important according to their private political and economic interests, widening the gap in the brightness of lights between Moscow, St. Petersburg and capital cities and other areas of the country.
Column (5) of Table 2 shows that the coefficient estimates of interactive terms in manufacturing cities were positive and significant at the 1% level. The difference in the brightness of lights between manufacturing cities and other areas of the country increased with sanctions. This was consistent with Hypothesis 2. Economic sanctions prompted the reallocation of resources to domestic industries and the development of import substitution industries, thereby reducing Russia’s foreign dependence [53]. The estimated coefficients of the interactive terms in mining areas were negative and statistically significant. On one hand, the sanctions on energy technology affected not only the development of new “frontier” oil deposits (such as the Bazhenov and Domanik formations in Western Siberia and the Urals) but technology used in enhanced recovery of oil in “brownfield” deposits. On the other hand, financial restrictions impacted the operations of Russian energy firms [54]. Under the dual constraints of technical sanctions and financial restrictions, the long-term development of Russia’s energy sector has been affected. Therefore, when the sanctions increased, the brightness of the lights in the mining area became dimmer relative to other areas of the country. This result verified Hypothesis 2.
Column (5) shows that the coefficient estimate of interactive terms in Blagoveshchensk was positive and significant at the 1% level. Economic sanctions reduced the relative trade costs with nonsanctioning countries, and economic activities in regions with close trade ties with nonsanctioning countries relatively increased. Therefore, the brightness of Blagoveshchensk’s lights became brighter. This was consistent with Hypothesis 3. As economic sanctions increased, the coefficient estimates of the interactive terms in Kaliningrad Oblast, west port cities, and west port areas were positive and statistically significant. This result was consistent with previous Hypothesis 3. E.U. trade sanctions against Russia were limited to dual-use goods and energy exploration equipment and had little impact on other trade, especially in raw materials, oil and gas. Therefore, the brightness of the lights in the Kaliningrad Oblast, west port cities, and west port areas did not dim.
Additionally, one can naturally assume the autoregressive process of nighttime lights data where the current value depends past values. We examined the dynamic changes in nighttime lights in column (6) of Table 2 by additionally controlling for one-year lagged lights. Although the lag term that included the brightness value of the night light reduced the magnitude of the estimation, except that the coefficient of the interaction term of west port areas was not significant, the other interaction terms had similar estimation results and statistical significance as the previous ones.
4.2. Robustness
We added 0.01 before taking natural logarithms of the nighttime lights in previous estimated results. Because most of the grid cells were zero, we added different values to affect the estimation results before taking the logarithm. In columns (1), (2), (4), and (5) of Table 3, we added 0.05 and 0.1 to the independent values of the function before calculating the logarithm. The results were statistically and qualitatively similar to those in column (5) of Table 2. Although the value of 0.01 was quite different from those of 0.05 and 0.1, the regression results were still robust.
Table 3.
Robustness test: main regression results.
After Russia annexed Crimea in 2014, western countries began to impose sanctions on Russia. After 2014, the government of Russian Federation made Far East development an important part of the national strategy. This may have led to differences in the spatial distribution of the domestic economy. In column (6) of Table 3, we controlled for the Russian Far East. The results showed that the interaction terms in the Far East are positive and statistically significant. The regression coefficients of other interaction terms have not changed because of the addition of the interaction terms in the Far East, and the results are still robust.
Blagoveshchensk and the area within 10 km of the Chinese border were not included in column (7) of Table 3. By excluding these regions, this paper focused on regions that were unlikely to be affected by economic spillovers from China and across borders. Excluding the regions within 10 km of the Chinese border and Blagoveshchensk in column (7) of Table 3, the regression results showed that there was no change in other interaction terms. We obtained similar results to those in column (5) of Table 2. The results were still robust.
The sanctions index was calculated by accumulating documents issued by the countries sending sanctions. There were omissions in our collection of documents from countries sending sanctions against Russia. We thus transformed the sanctions index into a dummy variable, that is, the sanctions index is 1 after 2014. Columns (3) and (8) of Table 3 show the regression results using dummy variables to replace the sanction index. Despite replacing the sanction index with dummy variables, we obtained similar results to those in column (5) of Table 2. The results were still robust.
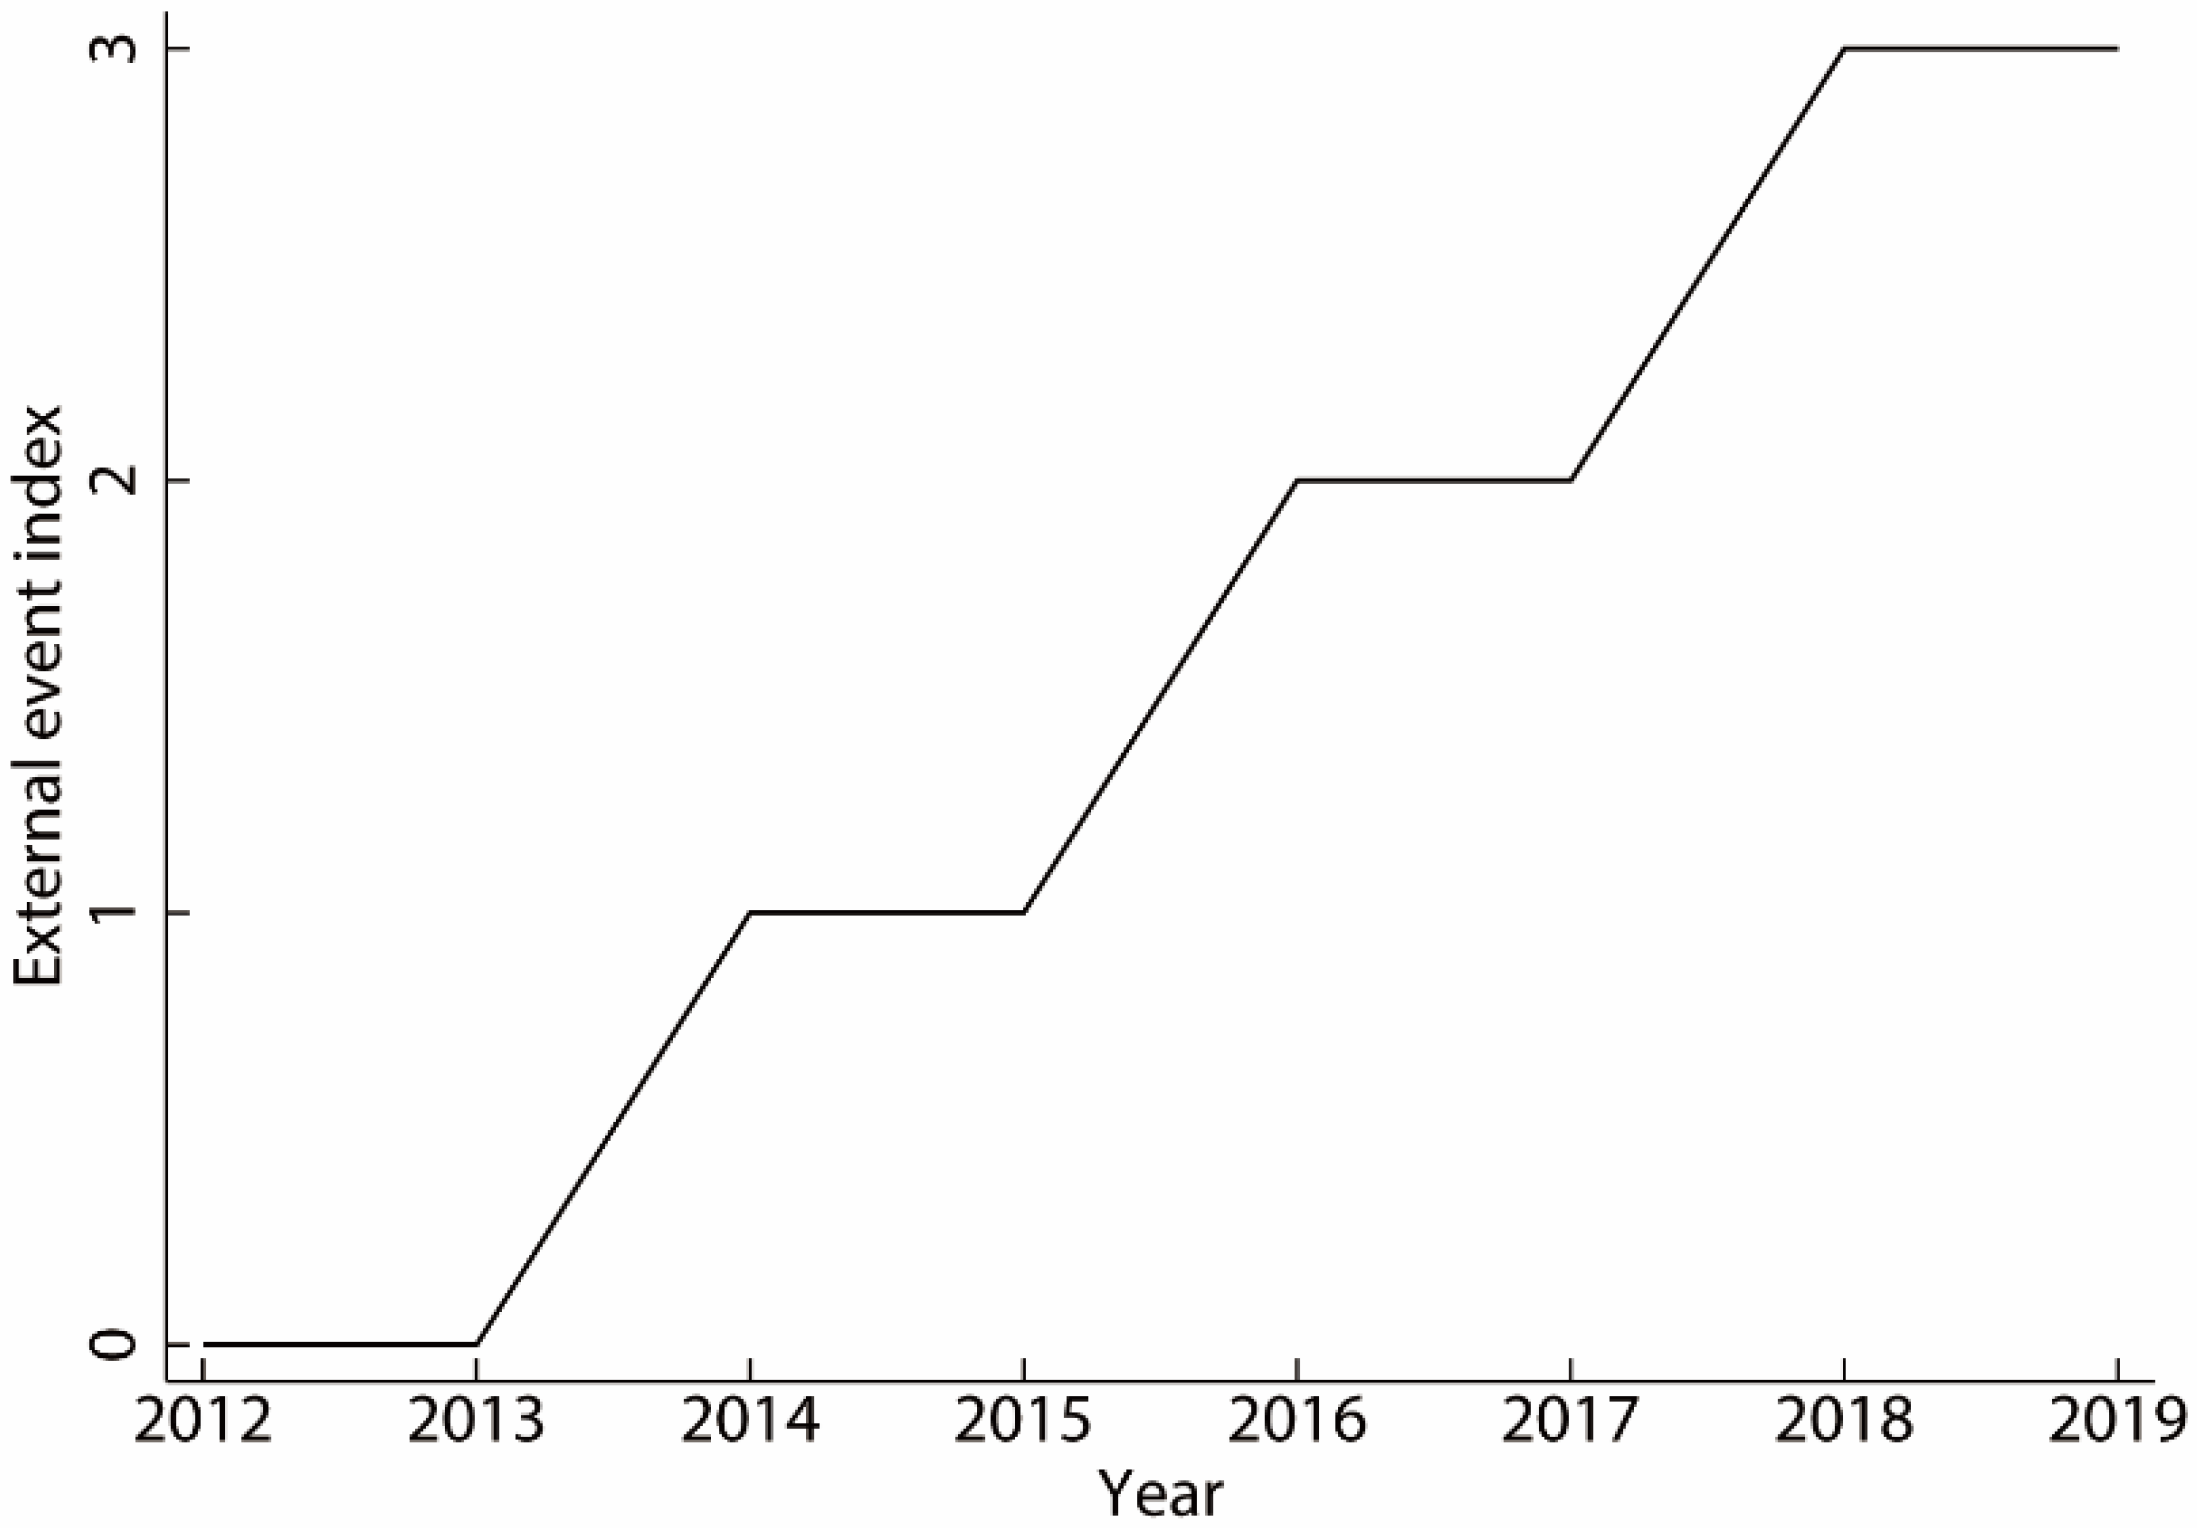
Finally, missing variables can lead to errors in the estimation results. This paper adopted a fixed-effect model and added a set of control variables that may have affected the brightness of the light. However, the impact of economic sanctions on the brightness of the light may still have endogenous interference with missing variables. Therefore, we introduced instrumental variables to further alleviate concerns about endogenous interference. External events directly led to the imposition of economic sanctions by western countries on Russia. External events included intervention in the sovereignty and territorial integrity of Ukraine, intervention in the U.S. election, and the poisoning of Sergei and Yulia Skripal. These events were driven mainly by Russian diplomacy rather than regional economic conditions within Russia. Therefore, we constructed a simple index to accumulate the number of external events. This external event index was used as an instrumental variable for the sanctions index. The external event index is shown in Figure A1 in the Appendix A. In practice, we used the regional dummy × instrumental variable in the regression as the instrumental variable of the regional dummy × sanction index. In column (9) of Table 3, the Cragg–Donald Wald F value was 2.0 × 10⁷, and the Kleibergen–Paap rk Wald F value was 3562, which was much greater than 10 [55]. The null hypothesis could be rejected, and there was no weak instrumental variable problem. Column (9) shows the regression results of the second stage of 2SLS. The results were similar to the regression results in column (5) of Table 2. The results were still robust.
4.3. Results for Different Periods
In this section, we examined the impact of economic sanctions on the brightness of lights in Russia at different periods. Columns (1) and (2) of Table 4 are the regression estimation results at the early stages of sanctions (2012 to 2015). Columns (3) and (4) of Table 4 are the regression estimation results at the later stages of sanctions (2016 to 2019). The regression results in column (1) show that in the early stage of sanctions, the sanction index was negatively correlated with the brightness of lights. Column (3) shows that in the later stages of sanctions, the sanctions index was positively correlated with the brightness of lights. All of the above results were significant at the 1% level. The regression result in column (2) shows that various regions were affected by the negative impact of sanctions in the early stages of sanctions. Column (4) shows that this negative influence gradually disappeared in the later stages of sanctions. Our research results were consistent with the research of Dizaji and van Bergeijk. Sanctions are more harmful in the early stages because during that time, the target country has not yet found a way to adjust its economy [52].
Table 4.
Results for different time periods.
In the early stages of sanctions, the coefficient of Moscow’s interaction term was negative. In the later stages of sanctions, the coefficient was positive. The coefficients of the interaction term in St. Petersburg were positive in both in the early and later stages of sanctions. In the early stages of sanctions, the coefficients of the interaction term in provincial capitals and other cities were negative. In the later stages of sanctions, the coefficients were positive. Moscow and St. Petersburg are the first and second largest cities in Russia, respectively. They are important economic centers of Russia with relatively complete industrial types. Studies have shown that diversified industrial structures are more resistant to external shocks [56]. However, Moscow has about half of all financial institutions in the country [57]. Economic sanctions affect the commercial activities of financial institutions by restricting financing, directly or indirectly affecting the regions where financial institutions are located. In addition, most of the sanctioned companies were located in Moscow [58]. Therefore, sanctions had a negative impact on the brightness of Moscow’s lights in the early stages. Because the industrial structure of cities such as provincial capitals is not as robust as that of St. Petersburg, their ability to withstand economic sanctions is relatively weak. Therefore, sanctions had a negative impact on the brightness of lights in provincial capitals and other cities in the early stages.
In the early stages of sanctions, the coefficient of interaction terms in manufacturing cities is negative. In the later stages of sanctions, the coefficient of interaction terms in manufacturing cities was positive. This result further proves that economic sanctions promoted the development of Russia’s import substitution industry. Western countries’ sanctions on Russia’s energy sector mainly hit the long-term development of Russia’s energy industry. In the early stages of sanctions, sanctions had minimal impact on Russian oil production [59]. Therefore, the coefficient of the interaction term in the mining area was positive in the early stages of the sanctions. The coefficient estimate of the interaction term in mining areas was negative in the later stages of sanctions.
The sanctions imposed by western countries because of the Ukraine crisis separated Russia from the West. This accelerated the reorientation of economic and foreign policy, as well as diplomatic relations, towards the East [35,60,61]. In particular, this strengthened economic and trade cooperation with China. Therefore, the brightness of lights in Blagoveshchensk and east port cities became brighter than that in other areas in the later stages of sanctions. For the interaction items of Russia close to the border with China, the coefficient was positive in the early stages of sanctions and negative in the later stages of sanctions. This shows an unexpected result that we need to explain carefully. Affected by the spillover of the Chinese economy, the coefficient of the interaction term in the areas within 10 km of the Chinese border was positive at the beginning of the sanctions. As economic growth in Northeast China slowed, the spillover effect weakened. In addition, in the context of severe population loss in the Far East [54], economic sanctions can lead to an accelerated shrink in the Russian population close to the Chinese border. Therefore, as the sanctions increased, the coefficient of the interaction term in the areas within 10 km of the Chinese border became negative.
For the interaction items of Kaliningrad Oblast, west port cities, and west port areas, the estimated result was negative at the early stages of sanctions because sanctions increased trade uncertainty. However, the estimated result was positive at the later stages of sanctions. In response to the uncertainty caused by sanctions, foreign companies may have been overly cautious and interrupted business relations with all Russian partners, even those partners who were not clearly sanctioned [62]. This inadvertently affected the export of nonembargoed products from western countries to Russia [6]. Therefore, in the early stages of sanctions, sanctions had a negative impact on the brightness of lights in the Kaliningrad Oblast, west port cities, and west port areas. Trade uncertainty caused by sanctions fades over time, and western countries gradually resumed trade with Russia. Therefore, the coefficient of the interaction term in Kaliningrad Oblast and west port were positive in the later stages of sanctions.
4.4. Results for Different Sectors of Sanctions
The regression results for different sanctions are shown in Table 5. This paper divided the sanctions against Russia into financial, energy, military, and other sanctions to examine the impact of different types of sanctions on the brightness of Russia. The results showed that different types of sanctions obtained similar results, as shown in Table 5. A possible reason why is that the different types of sanctions were interrelated. Therefore, it was difficult to attribute regional differences to certain sanctions [11].
Table 5.
Results using different sectors of sanctions.
5. Conclusions
Since March 2014, western countries have imposed economic sanctions on Russia for more than seven years. In addition, the period has been extended, and sanctions against Russia have also increased. The impact of economic sanctions on Russia’s domestic economy is a matter of concern for not only the target country but the sending countries. This paper used nighttime lights and constructed a sanctions index, which can increase the understanding of the impact of economic sanctions on Russia.
First, we found a complex relationship between economic sanctions and the brightness of lights in Russia. There were negative correlations with the brightness of Russian lights in the early stages of economic sanctions. However, the government of the Russian Federation took measures to gradually adapt to the economic sanctions, and this negative relationship disappeared as the sanctions continued. This shows that long-term sanctions do not necessarily change the political process [47]. Therefore, from the perspective of resolving the Ukrainian crisis, the effectiveness of sanctions is questionable.
Second, this study improves our understanding of the relationship between international policies and regional differences. In particular, it provides evidence for studying the relationship between economic sanctions and regional differences within Russia. The regression results show a very clear picture. Moscow, St. Petersburg, and provincial capitals are the political and economic centers of Russia. As sanctions increased, the brightness of the light in those areas was brighter than that in other areas in the country. Russia’s import substitution industrialization was promoted as economic sanctions increased. The lights in manufacturing cities became relatively brighter. However, the results also showed that the brightness of the lights in Russia’s natural resource areas dimmed because of the impact of sanctions. The lights in Blagoveshchensk were brighter than those in other areas as economic sanctions increased. However, in areas closely related to the sanction-sending countries, the lights of Kaliningrad Oblast, west port cities, and west port areas did not dim. We explained the relationship between economic sanctions and regional differences from the following three perspectives: (1) regional favoritism of political elites, i.e., political elites allocating limited resources and public goods to regions that they deem important; (2) sanctions affecting regional economic activities through industry development; and (3) sanctions changing the relative trade costs between countries, and trade shifting to the regions that benefit the most.
The relationship between regional differences and sanctions is well established. In particular, sanctions have widened the development gap between regions. This shows that the impact of sanctions on the economy of the target country exceeds the expected political goals. Even if the affected economies returned to the expected economic growth trajectory after the sanctions were lifted, it would become an additional burden to address the growing regional differences. This may slow down recovery efforts [63] and hinder the sustainable development of the Russian domestic economy. This paper empirically analyzed the relationship between economic sanctions and regional differences in Russia. This provides empirical support for the formulation of Russian regional sustainable development policies.
The results in this paper are important for us to understand the impact of economic sanctions on Russia, but there were some limitations. This paper took Russia as an example to analyze the relationship between economic sanctions and various regions in the country. Because of the uniqueness of Russia, the conclusions of this paper cannot be applied to all countries that are subject to sanctions. In addition, this paper used only a fixed-effects panel data model to study the relationship between economic sanctions and the brightness of lights in Russia. We assumed that the current light-brightness value depended on the past value. The basic principle of GMM is to use the lag terms of a set of explanatory variables as instrumental variables of the relevant variables in the equation, according to theory and experience. However, this paper involved panel data with a sample size of 6,458,212 × 8, and it was difficult for this paper to use GMM estimator for dynamic estimation, because the sample size was too large and exceeded the computing power of ordinary computers. Shida indicated that the difficulty of evaluating the Russian economy lay in the complexity of the influencing factors, such as the external shocks of economic sanctions, the drop in crude oil prices, and the high dependence of the internal industrial structure on natural resources [10]. These factors are intertwined and interact, making it difficult to quantify the impact of sanctions separately from other impacts. However, this paper provides a useful attempt to analyze the impact of economic sanctions on Russia’s domestic regional differences by constructing a sanctions index, controlling for international crude oil prices and other control variables, and using the nighttime lights. The current research was based on a panel of data covering only 8 years, with a relatively short timescale. However, it often takes a long time to show the impact of industrial upgrading. Therefore, the impact of economic sanctions on Russian industrial upgrading is a direction for future research. In addition, this paper used the nighttime lights to analyze the impact of economic sanctions on regional development at a macro level. However, we did not consider the impact of economic sanctions on Russian residents and the income of different groups in Russia. Studying the impact of economic sanctions on the income of Russian residents will be another focus of future research.
Author Contributions
Conceptualization: Z.L. and T.L.; methodology: Z.L.; software: Z.L.; writing—original draft preparation, Z.L.; writing—review and editing, Z.L. and T.L.; supervision, Z.L. and T.L.; project administration, T.L.; funding acquisition, T.L. All authors have read and agreed to the published version of the manuscript.
Funding
This work was supported by the Natural Science Fund of China under Grant 41201109 and the Humanities and Social Sciences Key Research Base of major projects of the Ministry of Education in China under Grant 17JJDGJW006.
Institutional Review Board Statement
Not applicable.
Informed Consent Statement
Not applicable.
Data Availability Statement
Not applicable.
Acknowledgments
The authors are grateful to the three reviewers for their helpful comments.
Conflicts of Interest
The authors declare no conflict of interest.
Appendix A
Table A1.
Chronology of the sanctions on Russia.
Table A1.
Chronology of the sanctions on Russia.
| Year | Sender | Content | Finance | Energy | Military | Other |
|---|---|---|---|---|---|---|
| 2014 | AUS | Asset freeze and travel restrictions of specific persons/entities; sanctions on financial entities: Bank Rossiya, Invest Capital Bank, and SMP Bank; sanctions on defense entities: Almaz-Antey. | + | + | + | |
| 2014 | CAN | Asset freeze and travel restrictions of specific persons/entities; sanctions on energy entities: OAO Novatek, prohibition of export of equipment related to oil exploration or production; sanctions on financial entities: Gazprombank OAO, VEB, Bank of Moscow, Russian Agricultural Bank, VTB Bank OAO, and Sberbank; sanctions on defense entities: Almaz-Antey, Bazalt, JSC Concern Radio-Electronic Technologies, JSC Concern Sozvezdie, JSC MIC NPO Mashinostroyenia, and others. | + | + | + | + |
| 2014 | CHE | Asset freeze and travel restrictions of specific persons/entities; sanctions on financial entities: Gazprombank, Rosselkhozbank, Sberbank, Vnesheconombank, and VTB Bank; sanctions on energy entities: Rosneft, Transneft, and Gazprom Neft; restrictions on export to Russia of certain items for use in petroleum exploration and production; sanctions on defense entities: Uralvagonzavod, United Aircraft Corporation, OPK Oboronprom, and others. | + | + | + | + |
| 2014 | EU | Asset freeze and travel restrictions of specific persons/entities; restrictions on access to E.U. primary and secondary capital markets for certain financial institutions: Sberbank, VTB Bank, Gazprombank, Vnesheconombank, and Rosselkhozbank; sanctions on energy entities: Chernomorneftega, Rosneft, Gazpromneft, and Transneft; restrictions on transactions to defense entities: Oboronprom, United Aircraft Corporation, Uralvagonzavod, Almaz Antey, Bazalt, and others. | + | + | + | + |
| 2014 | JPN | Sanctions on five state-owned banks in Russia: Sberbank, VTB Bank, Vnesheconombank, Gazprombank, and Russian Agricultural Bank; arms embargo. | + | + | ||
| 2014 | NOR | Asset freeze and travel restrictions of specific persons/entities; sanctions on five state-owned banks in Russia: Sberbank, VTB Bank, Vnesheconombank, Gazprombank, and Russian Agricultural Bank; sanctions on defense entities: Oboronprom, United Aircraft Corporation, Uralvagonzavod, JSC Sirius, Bazalt, and others; sanctions on energy entities: Rosneft, Transneft, and Gazprom Neft; prohibition of exports of certain technologies used in the petroleum industry. | + | + | + | + |
| 2014 | UKR, ALB, ISL, MNE | Asset freeze and travel restrictions of specific persons/entities. | + | |||
| 2014 | USA | Asset freeze and travel restrictions of specific persons/entities; sanctions on financial entities: Bank of Moscow, Gazprombank OAO, Russian Agricultural Bank, Sberbank, VEB, and VTB Bank; prohibition of export of certain technologies used in the petroleum industry; sanctions on energy entities: Novatek, Rosneft, Vnesheconombank, and Gazprombank; sanctions on defense entities: Almaz-Antey, Rostec, Bazalt, and others. | + | + | + | + |
| 2015 | AUS | Restrictions on export to or import from Russia of arms and related materiel; restrictions on export to certain technologies used in the petroleum industry; restrictions on commercial dealing with certain capital financial market instruments issued by certain Russian state-owned entities. | + | + | + | |
| 2015 | CAN | Asset freeze and travel restrictions of specific persons/entities; sanctions on defense entities: JSC United Aircraft Corporation and Rostec subsidiaries; restrictions on financing of energy entities: Rosneft, OJSC Gazprom, OJSC Gazprom Neft, OJSC Surgutneftegas, and Transneft OAO. | + | + | + | |
| 2015 | CHE | Asset freeze and travel restrictions of specific persons/entities; prohibition of import of firearms and their components, accessories, ammunition, and ammunition components from Russia. | + | + | ||
| 2015 | EU | Asset freeze and travel restrictions of specific persons/entities. | + | |||
| 2015 | UKR | Asset freeze and travel restrictions of specific persons/entities; sanctions on financial entities: Moscow Bank, Gazprom Bank, Genbank, Adelantbank, Smartbank, Marshall Capital Partners, Russian National Commercial Bank, Tempbank, and others; sanctions on defense entities: Russian Helicopters, Almaz-Antey, Helicopter Service Company, Ulan-Ude Aviation Plant, and others. | + | + | + | |
| 2015 | USA | Asset freeze and travel restrictions of specific persons/entities; sanctions on financial entities: VTB Bank subsidiaries and Sberban subsidiaries; sanctions on energy entities: subsidiaries of Rosneft; sanctions on defense entities: subsidiaries of Rostec, Izhevsk y Mekhanichesky Zavod JSC, Kontsern Izhmash, and others. | + | + | + | + |
| 2016 | CAN | Asset freeze and travel restrictions of specific persons/entities; sanctions on defense entities: Izhevsky Mekhanichesky Zavod JSC, JSC Tecmash, Ruselectronics JSC, Shvabe Holding JSC. | + | + | ||
| 2016 | UKR | Asset freeze and travel restrictions of specific persons/entities; sanctions on payment entities: Zolota Korona, Kolibri, Unistream, Anelik, Blizko, and others; sanctions on energy entities: Bashneft, Novocherkaska GRES, Spezneftegaz, and Transmashholding; sanctions on defense entities: Rosteh, Rosoboroneksport, Rostvertol, Izhmash, and others. | + | + | + | + |
| 2016 | USA | Asset freeze and travel restrictions of specific persons/entities; sanctions on subsidiaries of Bank of Moscow, Gazprombank, and Russian Agricultural Bank; sanctions on energy entities: Gazprom and Novatek subsidiaries. | + | + | + | |
| 2017 | EU | Asset freeze and travel restrictions of specific persons/entities. | + | |||
| 2017 | UKR | Asset freeze and travel restrictions of specific persons/entities; sanctions on five Ukrainian banks with the capital of Russian state-owned banks: Sberbank PJSC, VS Bank PJSC, Prominvestbank PJSC, VTB Bank PJSC, and BM Bank PJSC. | + | + | ||
| 2017 | USA | Authorization of certain products to be exported to entities under the Russian Federal Security Agency. | - | |||
| 2017 | USA | Asset freeze and travel restrictions of specific persons/entities; Sanctions on financial entities: Taatta AO, IS Bank AO, VVB PAO, and others; sanctions on Transneft subsidiaries; sanctions on defense entities: Molot-Oruzhie OOO and others. | + | + | + | + |
| 2018 | EU | Asset freeze and travel restrictions of specific persons/entities. | + | |||
| 2018 | UKR | Asset freeze and travel restrictions of specific persons/entities; sanctions on energy entities: Rosneft, Lukoil, and Transoil; sanctions on payment institutions: WebMoney and Moscow Exchange MICEX-RTS transactions. | + | + | + | |
| 2018 | USA | Asset freeze and travel restrictions of specific persons/entities; sanctions on energy entities: subsidiaries of Surgutneftegas; sanctions on Rosoboronexport OJSC. | + | + | + | |
| 2018 | USA | OFAC authorization of trading licenses related to RUSAL and EN + Group. | - | |||
| 2019 | USA | Asset freeze and travel restrictions of specific persons/entities; financing restrictions; restrictions on the export of chemical and biological dual-use products to Russia. | + | + | + | |
| 2019 | EU | Asset freeze and travel restrictions of specific persons. | + | |||
| 2019 | CAN | Asset freeze and travel restrictions of specific persons/entities; sanctions on energy entities: Stroygazmontazh LLC, Ugolnye Tekhnologii OOO, and Gaz-Alyans OOO; sanctions on defense entities: Sukhoi Aviation JSC, JSC Russian Aircraft Corporation MiG, Tupolev CJSC, and others. | + | + | + | |
| 2019 | UKR | Asset freeze and travel restrictions of specific persons/entities; sanctions on military, energy, and financial entities. | + | + | + | + |
Note: “+” means increase sanctions; “-“ means decrease sanctions. Document source: https://www.treasury.gov (accessed on 28 May 2021); https://eeas.europa.eu; https://www.international.gc.cales (accessed on 26 May 2021); https://dfat.gov.au (accessed on 28 May 2021); https://www.mof.go.jp (accessed on 28 May 2021); https://lovdata.no/register/lovtidend (accessed on 25 May 2021); https://www.seco.admin.ch (accessed on 21 May 2021); http://www.rnbo.gov.ua/documents/ (accessed on 28 May 2021); https://sanctionsnews.bakermckenzie.com/ (accessed on 24 May 2021).
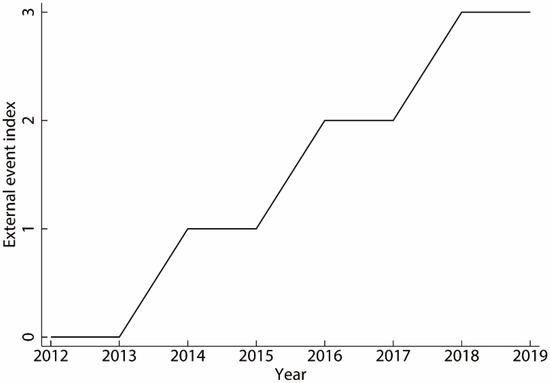
Figure A1.
The external event index over time.
Figure A1.
The external event index over time.
References
- Cortright, D.; Lopez, G.A.; Conroy, R.W. The Sanctions Decade: Assessing UN Strategies in the 1990s, 1st ed.; Lynne Rienner Pub: Boulder, CO, USA, 2000; pp. 15–30. [Google Scholar]
- Neuenkirch, M.; Neumeier, F. The impact of UN and US economic sanctions on GDP growth. Eur. J. Polit. Econ. 2015, 40, 110–125. [Google Scholar] [CrossRef] [Green Version]
- Tuzova, Y.; Qayum, F. Global oil glut and sanctions: The impact on Putin’s Russia. Energy Policy 2016, 90, 140–151. [Google Scholar] [CrossRef]
- IMF. Russian Federation: Staff Report for the 2015 Article IV Consultation. Available online: https://www.imf.org/external/pubs/ft/scr/2015/cr15211.pdf (accessed on 28 May 2021).
- Nelson, R.M. U.S. Sanctions and Russia’s Economy. Available online: https://crsreports.congress.gov/product/details?prodcode=R43895 (accessed on 15 May 2021).
- Crozet, M.; Hinz, J. Friendly fire: The trade impact of the Russia sanctions and counter-sanctions. Econ. Policy 2020, 35, 97–146. [Google Scholar] [CrossRef]
- Kholodilin, K.A.; Netšunajev, A. Crimea and punishment: The impact of sanctions on Russian economy and economies of the euro area. Balt. J. Econ. 2019, 19, 39–51. [Google Scholar] [CrossRef]
- Ahn, D.P.; Ludema, R.D. Measuring smartness: Understanding the economic impact of targeted sanctions. In Disrupted Economic Relationships Disasters, Sanctions, Dissolutions, 1st ed.; Nitsch, V., Besedes, T., Eds.; MIT Press: Cambridge, MA, USA, 2019; Volume 1, pp. 131–154. [Google Scholar]
- Golikova, V.; Kuznetsov, B. Perception of risks associated with economic sanctions: The case of Russian manufacturing. Post-Sov. Aff. 2017, 33, 49–62. [Google Scholar] [CrossRef]
- Shida, Y. Russian business under economic sanctions: Is there evidence of regional heterogeneity? Post-Communist Econ. 2020, 32, 447–467. [Google Scholar] [CrossRef]
- Lee, Y.S. International isolation and regional inequality: Evidence from sanctions on North Korea. J. Urban Econ. 2018, 103, 34–51. [Google Scholar] [CrossRef]
- Selden, Z.A. Economic Sanctions as Instruments of American Foreign Policy, 1st ed.; Greenwood Publishing Group: Santa Barbara, CA, USA, 1999; pp. 21–32. [Google Scholar]
- Ali, M.M.; Shah, I.H. Sanctions and childhood mortality in Iraq. Lancet 2000, 355, 1851–1857. [Google Scholar] [CrossRef]
- Majidpour, M. The unintended consequences of US-led sanctions on Iranian industries. Iran. Stud. 2013, 46, 1–15. [Google Scholar] [CrossRef]
- Galtung, J. On the effects of international economic sanctions, with examples from the case of Rhodesia. World Polit. 1967, 19, 378–416. [Google Scholar] [CrossRef]
- Movshuk, O. The reliability of China’s growth figures: A survey of recent statistical controversies. J. Econ. Study Northeast Asia 2002, 4, 31–45. [Google Scholar]
- Sutton, P.C.; Costanza, R. Global estimates of market and non-market values derived from nighttime satellite imagery, land cover, and ecosystem service valuation. Ecol. Econ. 2002, 41, 509–527. [Google Scholar] [CrossRef]
- Donaldson, D.; Storeygard, A. The view from above: Applications of satellite data in economics. J. Econ. Perspect. 2016, 30, 171–198. [Google Scholar] [CrossRef] [Green Version]
- Gao, B.; Huang, Q.; He, C. How does sprawl differ across cities in China? A multi-scale investigation using nighttime light and census data. Landsc. Urban Plan. 2016, 148, 89–98. [Google Scholar] [CrossRef]
- Shi, K.; Yu, B.; Huang, Y. Evaluating the ability of NPP-VIIRS nighttime light data to estimate the gross domestic product and the electric power consumption of China at multiple scales: A comparison with DMSP-OLS data. Remote Sens. 2014, 6, 1705–1724. [Google Scholar] [CrossRef] [Green Version]
- Wu, R.; Yang, D.; Dong, J. Regional inequality in China based on NPP-VIIRS night-time light imagery. Remote Sens. 2018, 10, 240. [Google Scholar] [CrossRef] [Green Version]
- Burgess, R.; Jedwab, R.; Miguel, E.; Morjaria, A. The value of democracy: Evidence from road building in Kenya. Am. Econ. Rev. 2015, 105, 1817–1851. [Google Scholar] [CrossRef] [Green Version]
- Knight, B. Estimating the value of proposal power. Am. Econ. Rev. 2005, 95, 1639–1652. [Google Scholar] [CrossRef]
- Knight, B. Endogenous federal grants and crowd-out of state government spending: Theory and evidence from the federal highway aid program. Am. Econ. Rev. 2002, 92, 71–92. [Google Scholar] [CrossRef] [Green Version]
- Dreher, A.; Fuchs, A.; Hodler, R. African leaders and the geography of China’s foreign assistance. J. Dev. Econ. 2019, 140, 44–71. [Google Scholar] [CrossRef]
- Connolly, R. Russia’s Response to Sanctions: How Western Economic Statecraft Is Reshaping Political Economy in Russia, 1st ed.; Cambridge University Press: Cambridge, UK, 2018; pp. 30–55. [Google Scholar]
- Ades, A.F.; Glaeser, E.L. Trade and circuses: Explaining urban giants. Q. J. Econ. 1995, 110, 195–227. [Google Scholar] [CrossRef] [Green Version]
- РИА Нoвoсти. Available online: https://ria.ru/20120601/662008532.html (accessed on 23 May 2021).
- Alavi, R. Industrialization in Malaysia: Import Substitution and Infant Industry Performance, 1st ed.; Routledge: London, UK, 2006; pp. 10–37. [Google Scholar]
- Bruton, H. Import substitution. Handb. Dev. Econ. 1989, 2, 1601–1644. [Google Scholar] [CrossRef]
- Sputnik. Available online: https://sputniknews.com/tag_Sectoral_Sanctions_Identification_List/ (accessed on 23 May 2021).
- Chikuhwa, J.W. Zimbabwe at the Crossroads, 1st ed.; AuthorHouse: Bloomington, IN, USA, 2006; pp. 32–39. [Google Scholar]
- Cooper, J.H. On income distribution and economic Sanctions. S. Afr. J. Econ. 1989, 57, 14–21. [Google Scholar] [CrossRef]
- Krugman, P.; Hanson, G. Mexico-US Free Trade and the Location of Production, 1st ed.; MIT Press: Cambridge, MA, USA, 1993; pp. 163–186. [Google Scholar]
- Vakulchuk, R. Russia’s new Asian tilt: How much does economy matter? In Russia’s Turn to the East, 1st ed.; Blakkisrud, H., Wilson, E., Eds.; Springer Nature: New York, NY, USA, 2018; Volume 1, pp. 139–157. [Google Scholar] [CrossRef] [Green Version]
- Szczepański, M. Economic Impact on the EU of Sanctions over Ukraine Conflict. Available online: https://www.europarl.europa.eu/thinktank/en/document/EPRS_BRI(2015)569020 (accessed on 15 November 2021).
- Gould-Davies, N. Russia, the West and sanctions. Survival 2020, 62, 7–28. [Google Scholar] [CrossRef]
- The European Council. Available online: https://www.consilium.europa.eu/en/policies/sanctions/ukraine-crisis/ (accessed on 23 May 2021).
- Veebel, V.; Markus, R. Lessons from the EU-Russia sanctions 2014–2015. Balt. J. Law Polit. 2015, 8, 165–194. [Google Scholar] [CrossRef] [Green Version]
- Brock, G. A remote sensing look at the economy of a Russian region (Rostov) adjacent to the Ukrainian crisis. J. Policy Model. 2019, 41, 416–431. [Google Scholar] [CrossRef]
- Open Street Map. Available online: https://www.openstreetmap.org/ (accessed on 28 May 2021).
- Kotlyakov, V.M.; Dumnov, A.D.; Kirsanov, A.A. National Atlas of Russia Volume 1, 1st ed.; Russian Federal Bureau of Surveying and Mapping: Moscow, Russia, 2008; pp. 394–395. [Google Scholar]
- USA International Business Publications. Russian Defense Industry Directory-Strategic Information and Contacts, 1st ed.; International Business Publications: Washington, DC, USA, 2001; pp. 16–108. [Google Scholar]
- Global Ports. Available online: https://data.humdata.org/dataset/global-ports (accessed on 24 May 2021).
- US Geological Survey. Available online: https://www.usgs.gov/centers/cersc (accessed on 21 May 2021).
- Liu, Y.; Hu, C.; Zhan, W. Identifying industrial heat sources using time-series of the VIIRS Nightfire product with an object-oriented approach. Remote Sens. Environ. 2018, 204, 347–365. [Google Scholar] [CrossRef]
- Dreger, C.; Kholodilin, K.A.; Ulbricht, D. Between the hammer and the anvil: The impact of economic sanctions and oil prices on Russia’s ruble. J. Comp. Econ. 2016, 44, 295–308. [Google Scholar] [CrossRef] [Green Version]
- Bali, M. The Impact of Economic Sanctions on Russia and its Six Greatest European Trade Partners. Finance Bus. 2018, 14, 45–67. (In Russian) [Google Scholar] [CrossRef]
- Michalopoulos, S.; Papaioannou, E. Pre-colonial ethnic institutions and contemporary African development. Econometrica 2013, 81, 113–152. [Google Scholar] [CrossRef] [Green Version]
- Anderson, S.J.; Tuttle, B.T.; Powell, R.L. Characterizing relationships between population density and nighttime imagery for Denver, Colorado: Issues of scale and representation. Int. J. Remote Sens. 2010, 31, 5733–5746. [Google Scholar] [CrossRef]
- Wang, C.; Meng, W.; Hou, X. The impact of high-speed rails on urban economy: An investigation using night lighting data of Chinese cities. Res. Transp. Econ. 2020, 80, 100819. [Google Scholar] [CrossRef]
- Dizaji, S.F.; Van Bergeijk, P.G. Potential early phase success and ultimate failure of economic sanctions: A VAR approach with an application to Iran. J. Peace Res. 2013, 50, 721–736. [Google Scholar] [CrossRef] [Green Version]
- Connolly, R. The Impact of eu economic Sanctions on Russia. In On Target? EU Sanctions as Security Policy Tools, 1st ed.; Dreyer, I., Luengo-Cabrera, J., Eds.; EU Institute for Security Studies: Paris, France, 2015; Volume 1, pp. 29–38. [Google Scholar]
- Connolly, R. The Russian Economy: A Very Short Introduction, 1st ed.; Oxford University Press: New York, NY, USA, 2020; pp. 76–85. [Google Scholar]
- Staiger, D.; Stock, J.H. Instrumental variables regression with weak instruments. Econometrica 1997, 65, 557–586. [Google Scholar] [CrossRef]
- Brown, L.; Greenbaum, R.T. The role of industrial diversity in economic resilience: An empirical examination across 35 years. Urban Stud. 2017, 54, 1347–1366. [Google Scholar] [CrossRef]
- Bank of Russia. Available online: https://www.cbr.ru/statistics/bank_system_new/cr_inst_branch_010112/ (accessed on 28 May 2021).
- U.S. Department of the Treasury. The Sectoral Sanctions Identifications List. Available online: https://www.treasury.gov/ofac/downloads/ssi/ssilist.txt (accessed on 23 May 2021).
- Christie, E.H. The design and impact of Western economic sanctions against Russia. RUSI J. 2016, 161, 52–64. [Google Scholar] [CrossRef]
- Dave, B. Russia’s Asia Pivot: Engaging the Russian Far East, China and Southeast Asia. RSIS Work. Paper 2016, 297, 1–27. [Google Scholar]
- Carnegie Endowment for International Peace. Available online: https://carnegiemoscow.org/2016/04/26/did-western-sanctions-affect-sino-russian-economic-ties-pub-63461 (accessed on 18 February 2022).
- Ahn, D.P.; Ludema, R.D. The sword and the shield: The economics of targeted sanctions. Eur. Econ. Rev. 2020, 130, 103587. [Google Scholar] [CrossRef]
- Afesorgbor, S.K.; Mahadevan, R. The impact of economic sanctions on income inequality of target states. World Dev. 2016, 83, 1–11. [Google Scholar] [CrossRef] [Green Version]
Publisher’s Note: MDPI stays neutral with regard to jurisdictional claims in published maps and institutional affiliations. |
© 2022 by the authors. Licensee MDPI, Basel, Switzerland. This article is an open access article distributed under the terms and conditions of the Creative Commons Attribution (CC BY) license (https://creativecommons.org/licenses/by/4.0/).