Abstract
Due to the rapid growth in global plastic production, in short-term applications, and negative impacts on natural ecosystems, plastics have received much attention. Additionally, the entire plastic value chain generates a significant amount of GHGs, and plastic use reductions should be considered as interventions addressing the climate crisis. This work investigates the life cycle of plastics in non-durable goods holistically. It identifies interventions to improve the sustainability and circularity of the system of production and analyzes the potential benefit of these interventions as climate change solutions. A baseline global market for plastics is defined and forecast to 2050, to which four interventions are applied: (1) plastic reduction through elimination and reuse; (2) replacement with paper; (3) replacement with recycled feedstock, (4) replacement with bioplastics. The highest potential in GHG emissions reduction lies in plastic reduction, followed by replacement with recycled plastics, paper, and, finally, bioplastics. Together the integrated system can reduce between 9.5 and 14.9 Gt CO2-eq from 2020 to 2050. The environmental and social impact of applying all these interventions in parallel is significant, as plastics are at the intersection of many challenges, including waste production, energy use, ocean pollution, and land disruption from fossil extraction.
1. Introduction
Global plastic production has increased astronomically over the past several decades; the total annual global production of plastics is estimated at 368 million tonnes in 2019, an increase from only 15 million tonnes in 1964 [1,2]. This growth is due to the many beneficial uses of plastics, their versatility in application, durability, and continued increasing technical properties from ongoing development. Their applications span all areas of life and society, from transportation to buildings to clothing to medicine. Despite these significant advantages, the environmental impacts of increased plastic consumption are of growing concern [3]. Plastics are petroleum-based, consuming approximately 6% of global oil today as a raw material [1]. Their production is energy-intensive, releasing further greenhouse gas (GHG) emissions, over 390 million tonnes of CO2-eq [1] or 4% of global GHG emissions in 2015 [4]. Further, a majority of plastics produced are used for short-term applications, such as packaging, household items, and more. These types of short use-phase applications result in significant waste production, 12% of total waste globally, or 242 million metric tons in 2016 [5]. Even plastic waste that is responsibly collected primarily ends up in landfills or is incinerated, instead of recycled, because many countries cannot process these wastes [6,7,8]. Open burning of plastic waste, which is still common practice in many Global South countries, was responsible for 1 gigaton of CO2-eq emissions in 2016 and is expected to double in the next 20 years [9] as well as is having many negative effects on human health [6,10,11,12]. The World Economic Forum [1] estimates that 32% of plastics are uncollected and leak into the environment, of which around 11 million metric tons entered the marine environment and could grow to 29 million metric tons in 2040 following business-as-usual prognostications [7]. Poorly managed plastic waste can enter the environment and cause damage to natural habitats as well as clog drainage and cause issues with infrastructure [5]. This has several consequences, including the accumulation of plastic waste in coastal ecosystems and the ocean’s surface [13,14,15], plastics being digested by marine organisms, damaging ecosystems functions and services [16,17,18], and directly affecting the livelihoods and health of coastal communities [10,19,20]. Plastics also degrade into small particles, called “microplastics”, that can be challenging to recover and cause more damage to food chains and ecosystems [21,22,23].
Due to the global crisis of plastic pollution and the unsustainable nature of the plastic system, several interventions that directly reduce plastic consumption and replace virgin plastic production with other materials have been proposed [24]. These interventions typically focus on plastic leakage and pollution into natural ecosystems, but they also have the potential to limit GHG emissions from the plastic system. Here, we investigate the current and future consumption of non-durable plastic goods, and what the quantitative climate impact of interventions to the plastics market can be. To address these inquiries, a life cycle-based approach applying Project Drawdown Modeling Framework (Appendix A.1) is used to investigate the GHG emissions in CO2-eq associated with plastics production for non-durable goods, where non-durable goods are defined as goods with a lifetime of fewer than 3 years, such as disposables and single-use items [9]. The “conventional” plastics market is dominated by virgin, petroleum-based plastics, the impacts of which can be mitigated through a series of interventions that reduce or replace conventional plastics [7,25,26]. A functional unit of 1 million metric tonnes of plastic production was defined as the primary unit of analysis, with the system boundary being a cradle-to-production gate. Key interventions to reduce the impact of the plastics market are identified and prioritized as presented in Figure 1 and Table 1. The CO2-eq intensity of producing conventional plastics with current technology and processes is compared with that of the intervention identified within a defined system boundary and market. This study only analyzes the CO2-eq reduction potential of preventing non-durable plastic production and does not account for waste management, in keeping with the system boundary, which is plastic production.
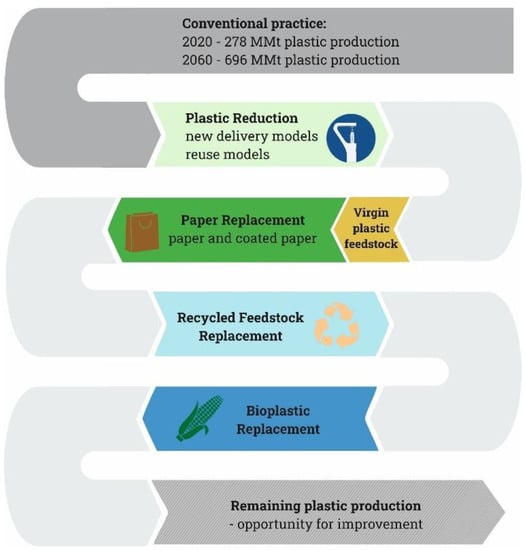
Figure 1.
Roadmap for reducing the conventional practice of virgin plastics production through multiple interventions.

Table 1.
Interventions to reduce the climate impact of the plastic market.
The continuation of plastics production at the current rate will contribute significantly to global GHG emissions in 2050, making it harder to limit global warming below 2 °C [27]. This study integrates new research findings from multiple studies, as well as considers various parallel interventions into one global plastics system. Directly linking the potential of these interventions to their climate impacts is critical for decision-makers to identify and prioritize the solutions they could implement or accelerate through policy, financial incentives, advocacy, etc.
2. Materials and Methods
2.1. Modelling Framework
Quantifying the CO2-eq impacts of potential solutions compared to conventional plastics production involves several steps in determining the size and environmental footprint of the global plastics market (Appendix A). The market is defined in terms of the total million metric tons (MMt) of plastic produced to meet estimated global functional demand between 2014 and 2050, which defines the Total Addressable Market (heretofore referred to as the TAM). The potential global adoption of each intervention—reduced demand from elimination and reuse, replacement with paper, replacement with recycled materials, and replacement with bioplastics—is quantified based on published sources for historical, current, and future projected adoption scenarios, ensuring they do not overlap within or extend beyond the boundary of the TAM. The emissions factors associated with conventional plastics and the interventions are defined per functional unit (MMt plastic) using a meta-analysis composed of peer-reviewed and widely cited sources of life cycle data for direct and indirect emission in t CO2-eq/MMt plastic (Table 1). The analysis begins in the base year of 2018 and increased adoption of TAM for each intervention is projected to 2050. Three scenarios are developed with different levels of increased adoption compared to a reference scenario (REF) in which those adoptions remain fixed at the current level (2018). The levels of adoption for three scenarios are defined as follows (Appendix A.4):
- Plausible—interventions are adopted at an ambitious but realistically vigorous rate,
- Ambitious—the adoption of interventions is increased to the high range of the projections thus representing an advancement of the Plausible scenario
- Maximum—represents the highest adoption estimated.
The difference in CO2-eq in the REF and each of the adoption scenarios is calculated by multiplying the net functional units captured in the three scenarios compared to the REF by the emissions factors for both conventional plastics and the interventions. The delta of the resulting emissions footprints represents the total reduced emissions from the adoption of the interventions (Figure A1).
2.2. Total Adoption Market
The Total Adoption Market (TAM) is determined based on a mixture of reported historical estimates for the years 2014–2020 and the projected future demand from 2021–2050 using existing market prognostications from published sources that account for economic and population growth, as well as other input factors. The baseline TAM of all plastic demanded between 2014–2050 is derived from four sources [1,2,7,28]. Only plastics that are non-durable goods with an average life span below 3 years, which represents around 64% of plastics production in 2016, are considered [1,7,29]. Non-durable plastics include flexible monomaterials (e.g., films, carrier bags), rigid monomaterials (eg. bottles, pots, household goods), and multimaterials (e.g., sachets). Out-of-scope plastics include materials used in building and construction, textiles, transportation, and machinery [7], which are considered durable goods with a life span of up to 50 years [2]. Due to the longer lifetime of durable plastics, they do not represent a big portion of waste ending up in the environment; thus, there is less interest to reduce or substitute solutions [7].
2.3. Interventions and Adoption Scenarios
Plastic Reduction is the first priority for several reasons (Figure 1): it has the highest potential CO2-eq savings by avoiding all material and energy use required to produce the plastics, it avoids upstream emissions associated with distribution, and it avoids collection and disposal of waste materials. The adoption scenarios for Plastic Reduction are determined by analyzing several sources estimating or proposing solutions to cut plastic production [4,7,25,30,31]. Those solutions include a variety of approaches such as legislation on bans and taxes, eliminating overpackaging, refill systems, such as dispensers, take-back services, concentrated product capsules, and consumer behavior changes in terms of carrying reusable bags, bottles, containers (details in Appendix A.3). Adoption of interventions to Plastic Reduction (in %) from each source is calibrated to the common functional unit of MMt plastic produced and averaged to determine the impact on the TAM, with different levels of ambition depending on the scenario.
After allocating part of the TAM to Plastic Reduction intervention, the remaining MMt of the plastic market is available for allocation to the identified replacement interventions. Because of technological constraints and specific quality needs, it is assumed that 10% of that plastic market must be met by virgin plastics [32,33]. The remaining 90% of that plastic market can therefore be allocated to investigating three replacement interventions, with priority given to Paper Replacement, then Recycled Feedstock Replacement, and Bioplastic Replacement (Figure 1). Feasible adoption of all these interventions is determined based on estimations derived from published literature and does not exceed the total TAM (Appendix A.3).
2.4. Emissions Factors
Emissions factors for conventional plastics production, paper production, recycled plastic production, and bioplastic production are calculated based on a meta-analysis derived from a literature review to determine an average CO2-eq emissions footprint of each technology. This process consists of identifying LCA data for each of these technologies that fit data quality requirements: the data are from peer-reviewed sources, public sector or multilateral agencies, or widely cited industry publications. In total, 146 data points from 34 sources were used (Table 2). These data are all verified and the averaged value is then assigned as the emissions factor for that technology. These emissions factors, as well as the standard deviation from the meta-analysis and the number of data that were compiled and analyzed, are included in Table 2.
Table 2.
CO2-eq emission factors for all interventions used in the analysis; n/a, not applicable.
2.5. Climate Impact
The total CO2-eq savings from each intervention is based on the adoption in functional units of MMt of plastic produced of each intervention over the time period in question (2020–2050), and the emissions factor per functional unit of that intervention. The reduced plastics intervention identifies what the baseline CO2-eq emissions would have been from the production of that quantity of conventional plastics from 2020–2050, and assumes that complete reduction would result in no production phase emissions:
where R is CO2-eq emissions reduction of the intervention i, EFCP is the Emissions Factor of Conventional Plastics, and Ai is Adoption of the intervention i (in this case Plastics Reduction) for the time period 2020–2050. The Plastics Reduction intervention includes the elimination of overpackaging, shifting to reuse, and new delivery models such as refill stations. As long as elimination does not require any CO2-eq emissions, the reuse and new delivery models have some emissions associated with material production and use phase, e.g., construction of refill stations requires some material and energy. Those emissions are not quantified within the current analysis, as they do not fit into our system boundary.
Beyond reducing production, other interventions CO2-eq emissions reductions are calculated based on the replacement of the alternative material with the conventional material, as follows:
where EFi is the Emissions Factor of the replacement technology: Paper Replacement, Recycled Feedstock Replacement, or Bioplastics Replacement.
2.6. System Integration
Plastics, like all industries, operate within a broader system linking many different interrelated sectors—from electricity generation and transport to agricultural and food systems. The integrated systems approach incorporated in the Project Drawdown Modeling Framework addresses many of these system dynamics while avoiding double-counting within the plastics industry and across the wider system [57]. For example, the adoption of the bioplastics intervention is limited by the dedicated biomass feedstock available from projected agricultural production modeled in another part of the system; and the adoption of interventions that require more energy use will impact the electricity generation modeled, whereas the reduced plastics intervention results in a reduced electricity demand, which is accounted for.
3. Results
Adoption of each of the four interventions is developed assuming varying levels of ambition and aggregated into three general scenarios, a Plausible, Ambitious, and Maximum scenario (Appendix A.4). Adoption of Plastics Reduction is projected to reach between 1592 and 3786 MMt 2020–2050 depending on the scenario (Table 3). The adoption of Paper Replacement, the second prioritized intervention, is assumed to require the same level of ambition across scenarios, and results in a constant value of 1471 MMt 2020–2050 for all three scenarios (Table 3); this is the only intervention in which multiple scenarios were not developed, due to data availability limitations. Recycled Feedstock Replacement is projected to capture between 5615 MMt and 4332 MMt of the TAM from 2020–2050. Finally, adoption of Bioplastics Replacement to replace virgin plastics is projected to be between 3024 MMt and 2020–2050 in the Plausible scenario, and 2333 MMt 2020–2050 in the Maximum scenario [32,58,59]. Because interventions are constrained by the boundaries of the projected TAM, the lower priority interventions, such as bioplastics, have smaller potential adoption in the late years of the time period of analysis in the Maximum scenario compared to the Ambitious scenario due to the more ambitious adoption of higher priority interventions, like Plastic Reduction. The total size of each solution for all three scenarios is summarized in Table 3.
Table 3.
Total reduction and replacement of plastics production (MMt) and total climate impact (Gt CO2-eq) from all four interventions under three scenarios between 2020–2050.
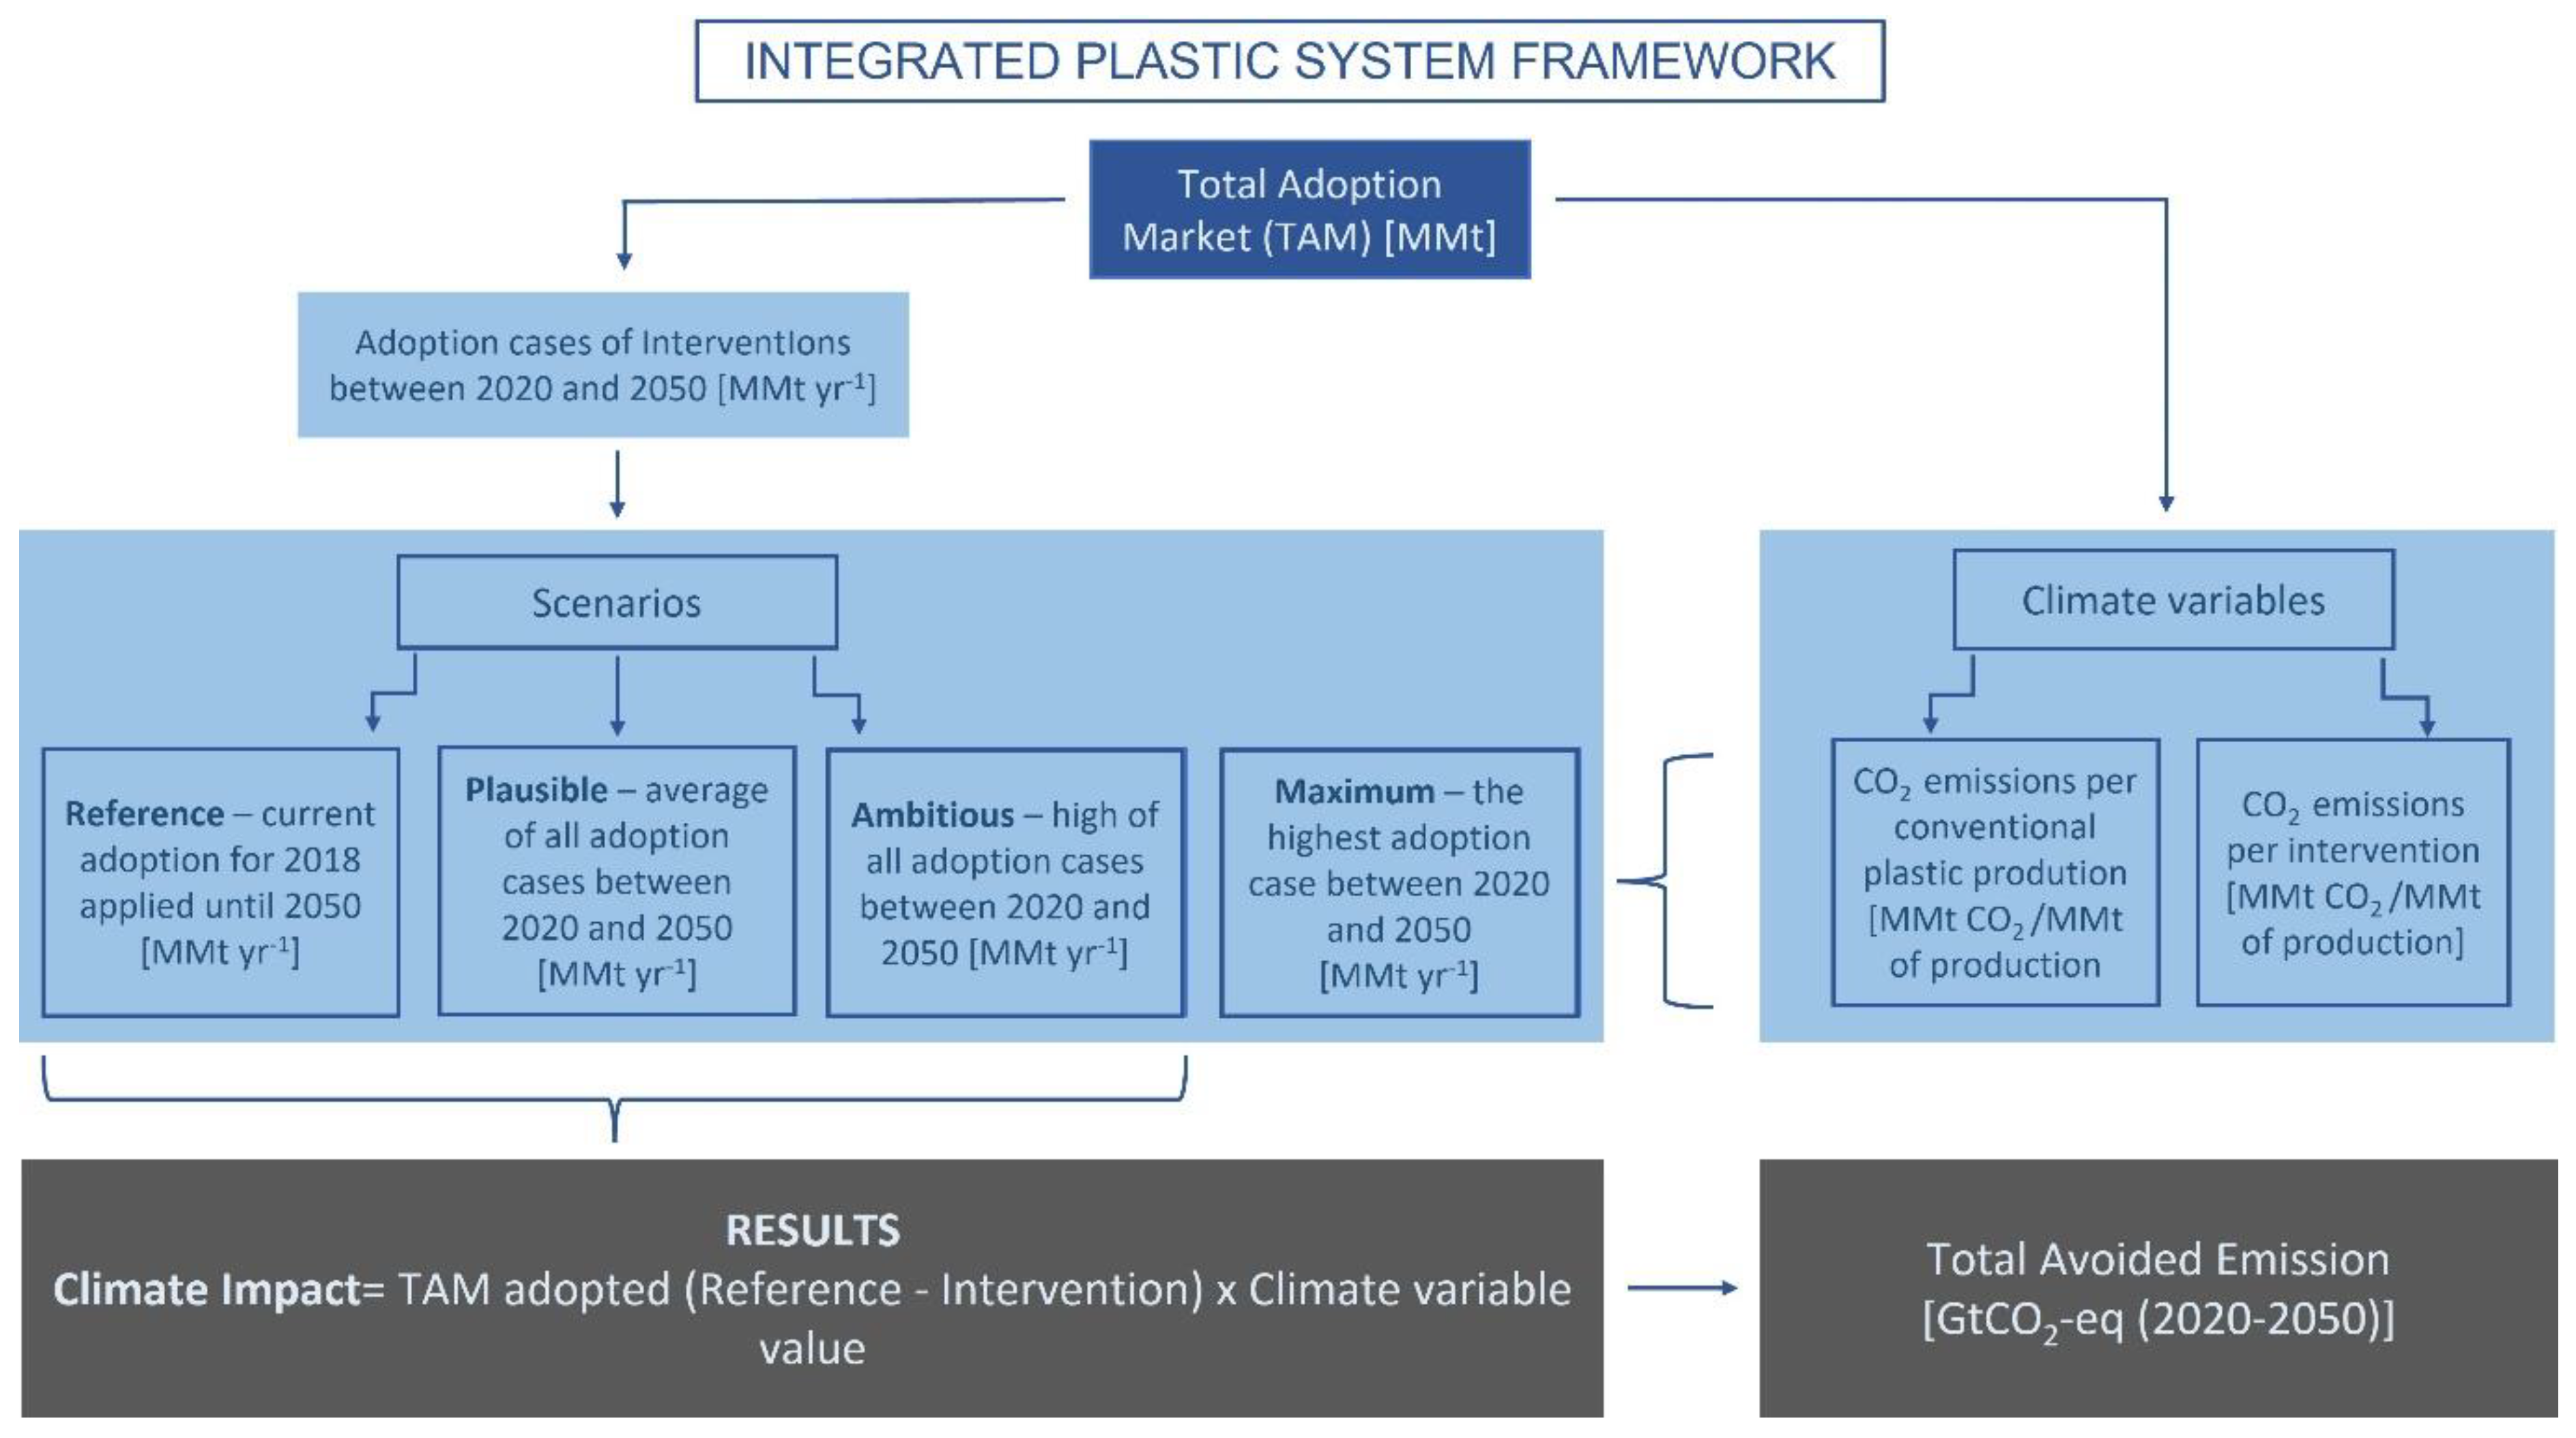
The implementation of these interventions results in significant CO2-eq emissions reductions between 2020–2050 (Table 3). Plastic Reductions have the highest potential range from 4.0 to 9.5 Gt CO2-eq, depending on the scenario. Paper Replacement resulted in 1.4 Gt CO2-eq reduced across all scenarios because there are insufficient studies with relevant data to construct more than one scenario (Appendix A.3). Recycled Feedstock Replacement has a higher potential of emission reduction range between 2.4 and 3.6 Gt CO2-eq. The impact of Bioplastics Replacement is comparable with a range from 1.7 to 3.0 Gt CO2-eq. Note that the adoption of Plastic Reduction has the highest priority across all solutions and is thus optimized in the Maximum scenario. This leads to a smaller available TAM for other interventions, which is why some have larger CO2-eq savings in the Ambitious scenario than in the more aggressive Maximum scenario. The total emissions reduction from all interventions is between 9.5 and 14.9 Gt CO2-eq from 2020–2050 (Table 3), and the difference among annual adoption for each scenario is presented in Figure 2.
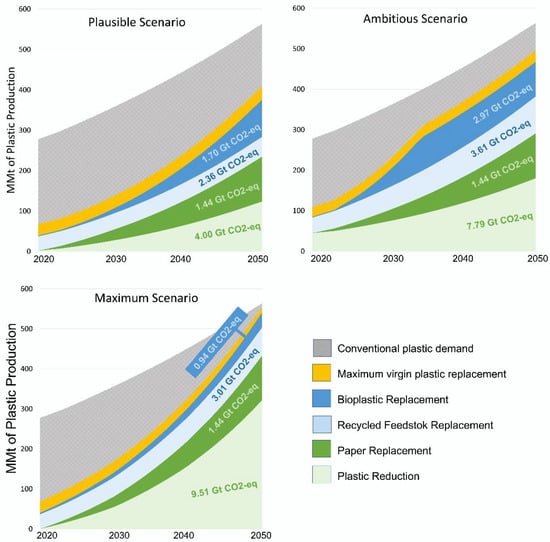
Figure 2.
Annual emission reduction from applying Integrated Plastic System interventions. Total emission reduction coming from each intervention achieved between 2020–2050 in three scenarios is displayed within the graph in Gt CO2-eq over the time period.
4. Discussion
4.1. The Potential to Transform the Global Plastic System
The results indicate that there are significant opportunities for improving the sustainability of the plastics system. Together the integrated system can reduce between 9.5 and 14.9 Gt CO2-eq between 2020–2050. Based on the prioritization used, decreased production of plastics through reduced demand and alternative distribution methods has the largest impact, followed by recycled plastic, and then replacement with alternative materials (paper, bioplastic), which has the least emissions savings potential. Summing up the impact of all interventions, the annual emissions reductions in 2050 are 0.3–0.8 Gt CO2-eq/year, representing around 1.5% of the reduction necessary to achieve the Paris Agreement on limiting global warming to 2 °C by 2050. A recent assessment presents the potential impact of completely phasing out single used plastics from packaging by 2050 with estimated annual emissions reductions reaching 2 Gt CO2-eq in 2050 [31]. Results of this study show a more conservative outlook based on the meta-analysis of the data collected, the different estimated TAMs, and the varying adoption mixes over time. However, both show the importance of transforming the plastic system as a significant way to address climate change. There are substantial opportunities for the plastic industry to adopt a low carbon, circular economy model, which is required to meet the Paris Agreement targets due to the large amount the emissions coming solely from plastics [60]. Achieving widespread reductions in plastic globally requires cooperation with consumers and producers, as well as government organizations that can incentivize reduction through policy [61], by extended producer responsibility schemes, for example [62].
It is important to note that the prioritization of the four interventions would necessarily impact the resulting emissions reductions, both for individual interventions and the system broadly. Plastic reduction, however, is proposed as that highest priority, as the benefits of reduced plastic production not only has the largest emissions savings per functional unit, but also has a plethora of other benefits, including reduced demand for virgin plastic, reduced waste production, and the socioeconomic and environmental issues associated with plastic waste [16]. Giving priority to reduction solutions is in line with circular economy principles, where reduction and reuse are identified as the most important strategies [63]. Reduced demand might also be a trigger for decreasing oil and gas extraction, e.g., shale fracking is unusually rich in ethane, methane, and other gases that are particularly useful for making petrochemical plastics, and fracking is aggressively expanding in many countries causing severe environmental and human health issues [64]. Moreover, fracking is a source of methane emissions that leak into the atmosphere during the extraction process [64], which is not accounted for in the life-cycle assessment of plastic. Therefore, reduced emissions from decreased plastic production may likely be substantially higher when accounting for avoided methane leaks. Further, plastic reduction is critical for low-income countries where waste management infrastructure is lacking. In these regions, the majority of plastic waste is informally disposed of, leading to significant leakage into the environment from open dumps or the burning of plastics [25].
In addition to having a lower carbon footprint, replacing plastics with paper has the added benefit of paper typically being more easily recycled than plastic materials. In 2019, 85% of all paper and board consumed in Europe was recycled, with paper fibers used 3.6 times on average [65]; globally paper fibers were used 2.4 times. While additional growth is required, the infrastructure for paper recycling is already advanced. Therefore, plastic replacement with paper would not require significant technological advances and changes in infrastructure; thus the cost associated with this intervention is likely to be more acceptable, especially within emerging economies [27]. Paper and coated papers are also often biodegradable, which means that there may be multiple end-of-life management options, making high recovery rates more feasible.
The use of recycled plastic feedstock is a widely adopted strategy for reducing plastic waste. This strategy is relatively feasible, as it does not require changes in the production process or new designs of products. While plastic recycling is a relatively mature and well-understood process, only 9% of plastic waste gets recycled globally [66]. In reality, several conditions have to be met for plastic waste to be recycled. First, plastic packaging has often been designed with additives for color, texture, etc. making it impossible to recycle using current technology [9,64]. Second, plastic waste has to be collected, which requires waste management infrastructure that is not available in the majority of the low- and middle-income countries [5]. Lastly, the collected plastic waste must be sorted, and directed to a recycling facility, which adds costs and complexity. Moreover, recent commitments by corporate food producers to include higher recycled content in plastic packaging caused a significant rise in the demand for recycled feedstocks that led to increasing prices [67]. Such price fluctuations can pose financial risks to some producers. Plastic packaging, whether recycled or not, can still end up in the environment if disposed incorrectly, thereby threatening natural ecosystems. For all these reasons, this intervention should be prioritized behind plastic reduction and substitution with the paper.
Bioplastics are the lowest priority solution because there is significant uncertainty in the LCA data for production, and the significant challenges and unknowns about feedstock, waste management strategies, and side effects [68,69,70]. Bioplastics are also significantly more expensive to produce than the other two replacement solutions, and historical trends have shown that adoption so far has fallen behind some of the original more optimistic projections [32]. It is still a critical intervention, though, and should not be ignored. Some specific bioplastics, like PLA, are more feasible alternatives for flexible plastics or mono-materials [9,71], making them more likely to be adopted.
Nevertheless, none of the analyzed solutions alone could achieve significant emissions reduction; therefore, climate mitigation actions related to plastics production should include transformation of the whole plastics production system (Figure 2).
4.2. Opportunities and Challenges
Designing out plastics from packaging opens several possibilities for applying innovative solutions and minimizing dependency on virgin plastics. Applying a system of interventions unlocks an opportunity for growth of the paper, recycling, and bioplastics industries within the next three decades as presented in Figure 2. Shifting to alternative materials is also important from an environmental and social point of view. Both paper and bioplastics are compostable, and paper has high recycling rates (e.g., 85% in the European Union, [65]); substituting plastics with paper and compostable materials thus has a positive impact on waste reduction, adding environmental and social benefits to this intervention. Paper and bioplastics alternatives replace problematic plastics films and multilayer flexibles, which have low recycling rates and technical specifications that cannot be replaced by other materials. Currently, the plastics industry is heavily dependent on fossil fuels; thus, the price of virgin plastic feedstocks depends on the price of oil [64]. This brings financial risks to plastics producers as prices of oil are uncertain and highly variable [72]. Avoiding fossil fuels-based plastic production is also important from the climate crisis perspective as increased plastic production will lead to increased extraction of fossil fuels, even if there is a transition away from them in the other industry sectors [64]. It will also help to avoid gas fracking—one of the most environmentally destructive ways of gas extraction [64].
This study presents the technological feasibility of changing the plastics production system; however, it does not include an economic feasibility analysis. Some of the proposed interventions, especially paper and bioplastics substitutes, might involve significant economic costs as those substitutes are usually having higher costs [9]. However, business-as-usual plastic production brings economic risks that outweigh the profits, when the costs associated with waste management and eliminating environmental consequences of plastic pollution are accounted for [9,73,74]. Extended producer responsibility might provide some additional economic opportunities for producers by favoring circular products, alternative business approaches, and by connecting producers, recyclers, and reverse logistic systems, including the circular bio-based economy [75].
4.3. Wider Benefits on Transforming the Plastic System
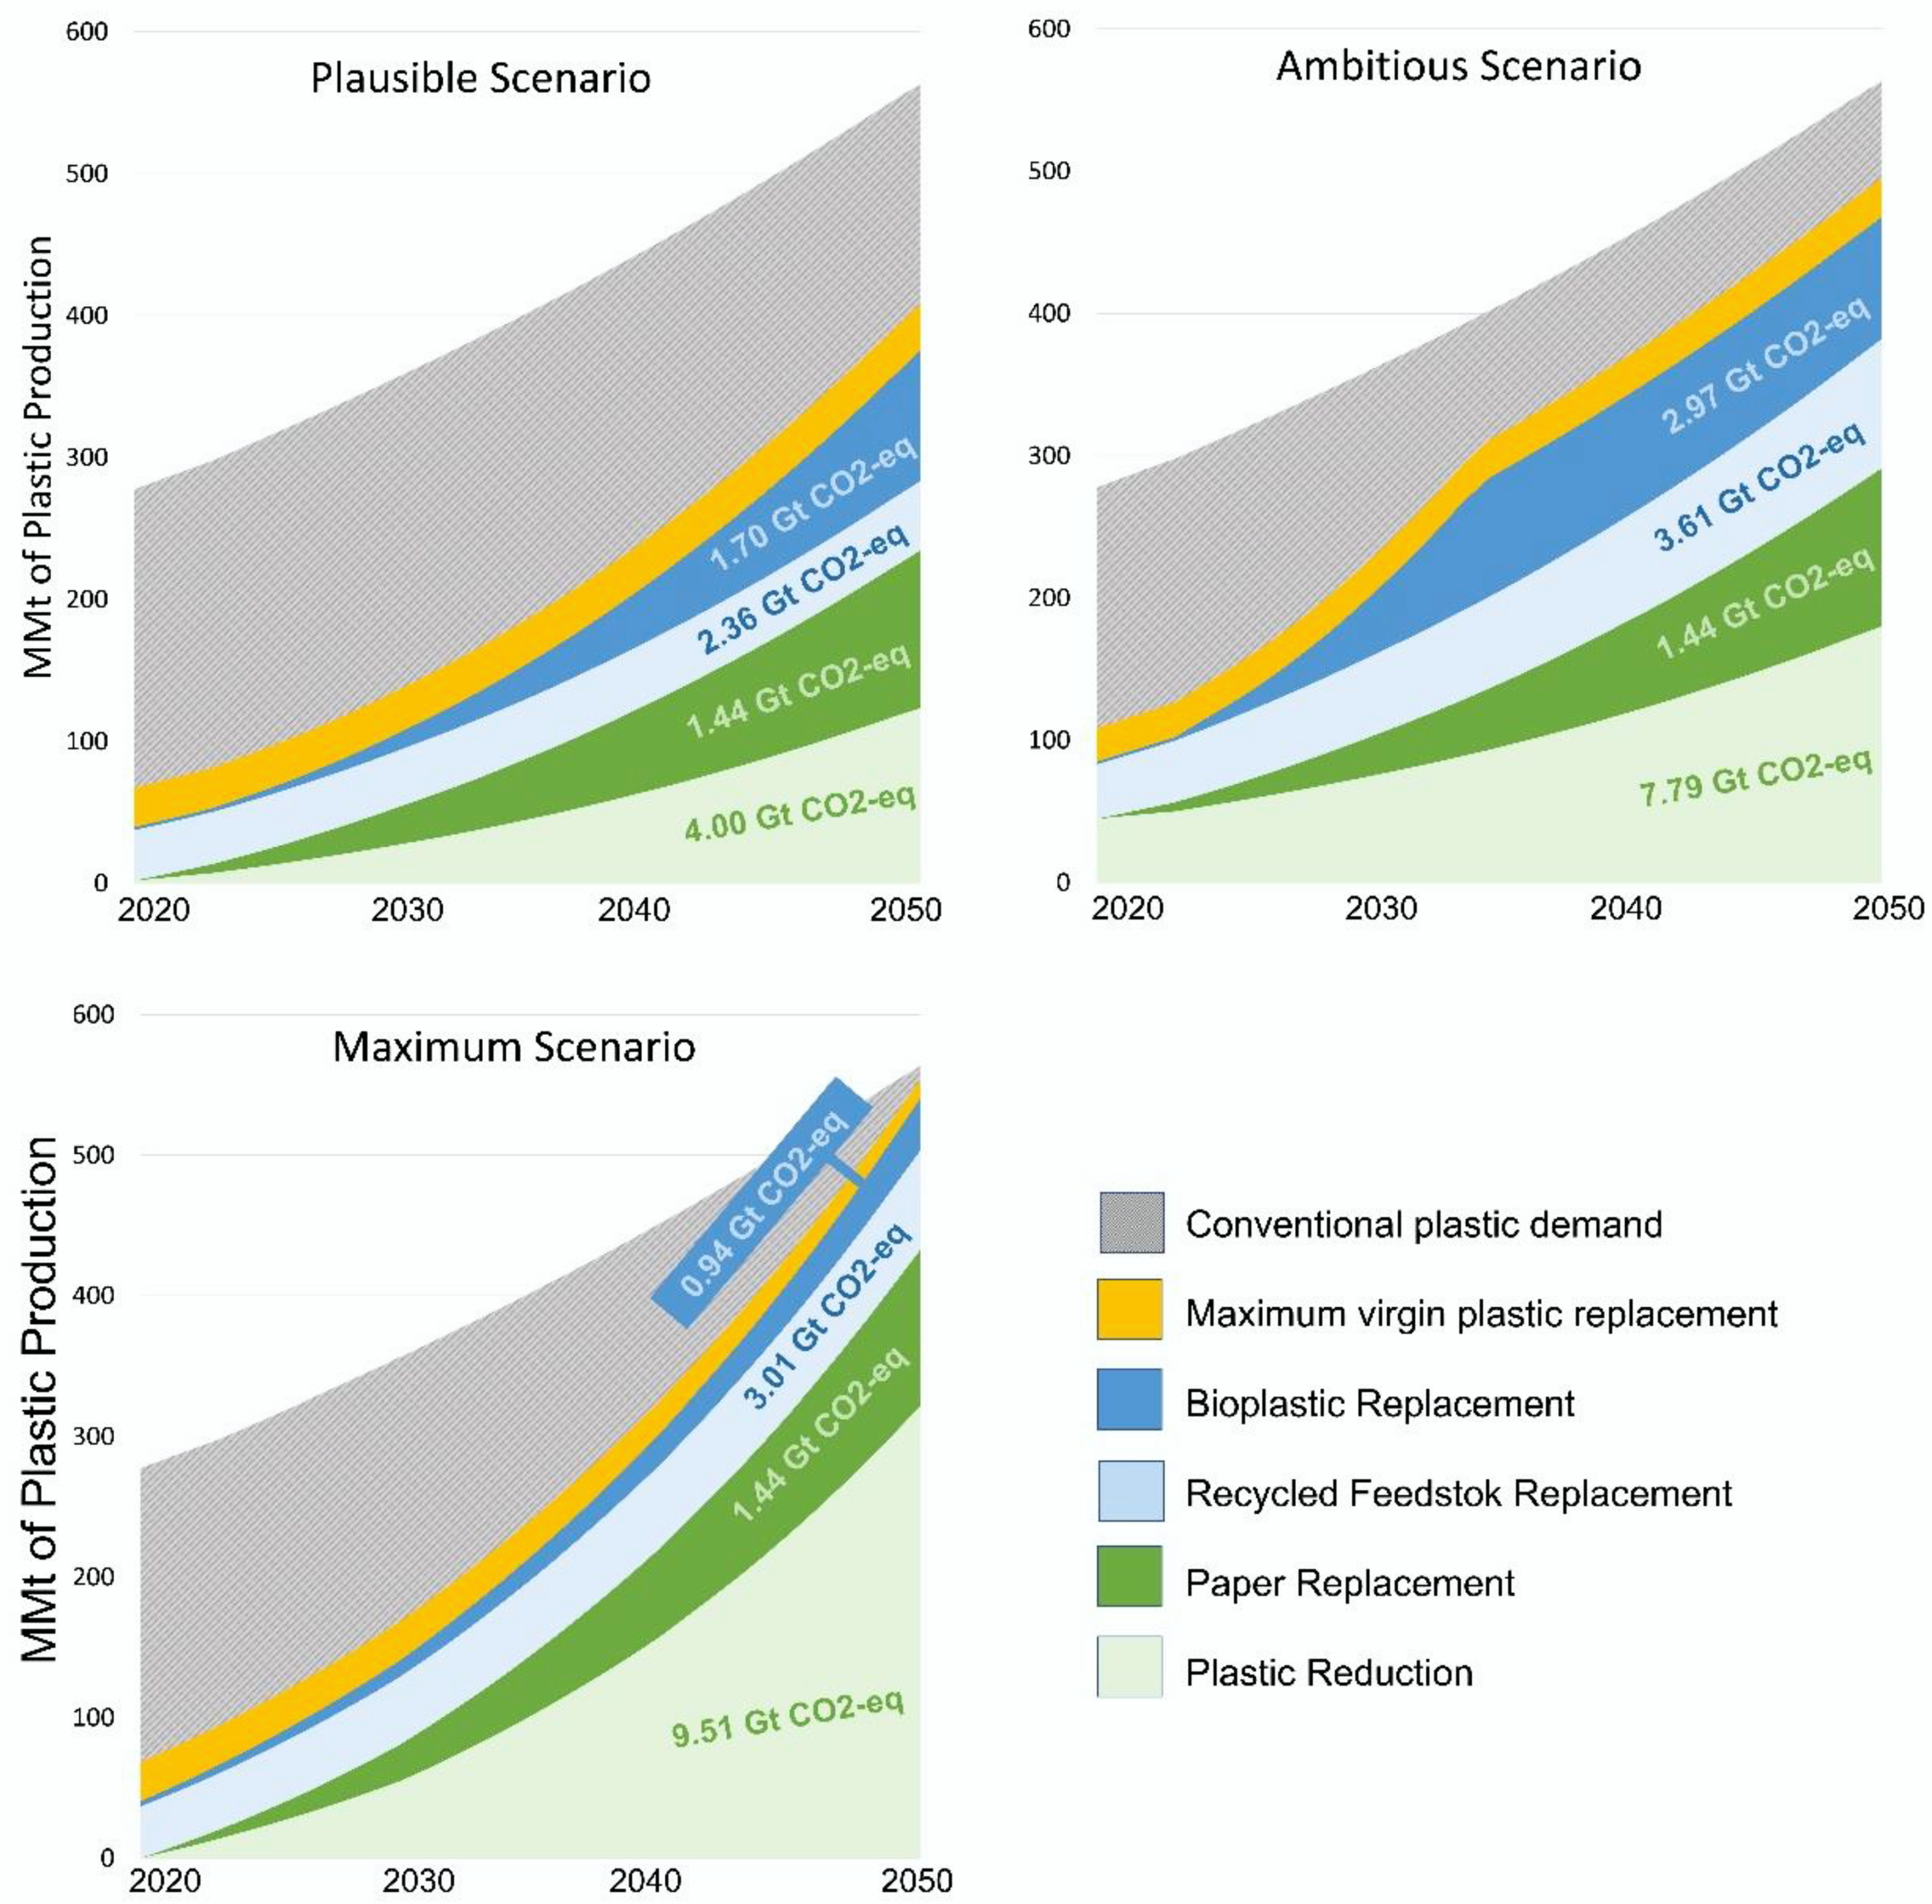
Due to their lightweight and durable nature, plastics have many important applications in industries such as aviation and medicine; however, over 60% of plastics are used in a form of single-use packaging or household goods with a short lifetime, which, when coupled with a low recycling rate, ends up as waste in a landfill [76]. Conservatively, increased demand and global population growth will cause almost a doubling of plastic production and plastic waste generation by 2040 [77]. The negative effects of mismanaged plastic waste are well recorded. Especially in developing countries where plastic pollution is widespread, terrestrial ecosystems and the socio-economy of communities and human health are directly impacted [16,19]. Open burning is still a common practice and releases airborne particulates, carcinogens, and other toxins [10]. Moreover, plastic ends up in the oceans where it occupies the coasts [14], forms floating islands [78], sinks to the deep sea, and degrades to microplastics that are impossible to be collected [79]. It poses risks to many marine species and negatively affects the fishery industry [80]. Designing out virgin plastics from packaging is therefore crucial to limit plastics pollution and improve the livelihoods of many nations (Figure 3). It is necessary for improving both human health and the health of ecosystems.
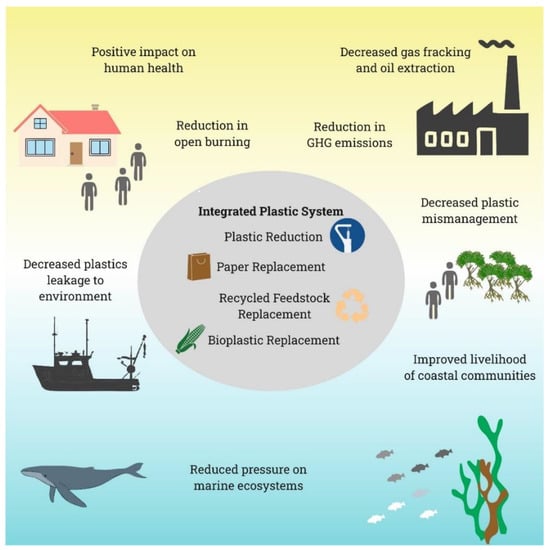
Figure 3.
Socio-economic and environmental benefits from applying Integrated Plastic System solutions.
Any movement to transform the plastics industry should follow an integrated strategy and incorporating multiple interventions is necessary to adequately achieve the climate targets outlined in Paris Agreement. Further, plastics, like all industries, operate within a broader system linking many different interrelated sectors–from electricity generation and transport to agricultural and food systems. The integrated systems approach incorporated in the Project Drawdown Modeling Framework addresses many of these system dynamics while avoiding double-counting within the plastics industry and across the wider system. For example, the adoption of the bioplastics intervention is limited by the dedicated biomass feedstock available from projected agricultural production modeled in another part of the system; and the adoption of interventions that require more energy use will impact the electricity generation modeled, whereas the reduced plastics intervention results in a reduced electricity demand, which is accounted for.
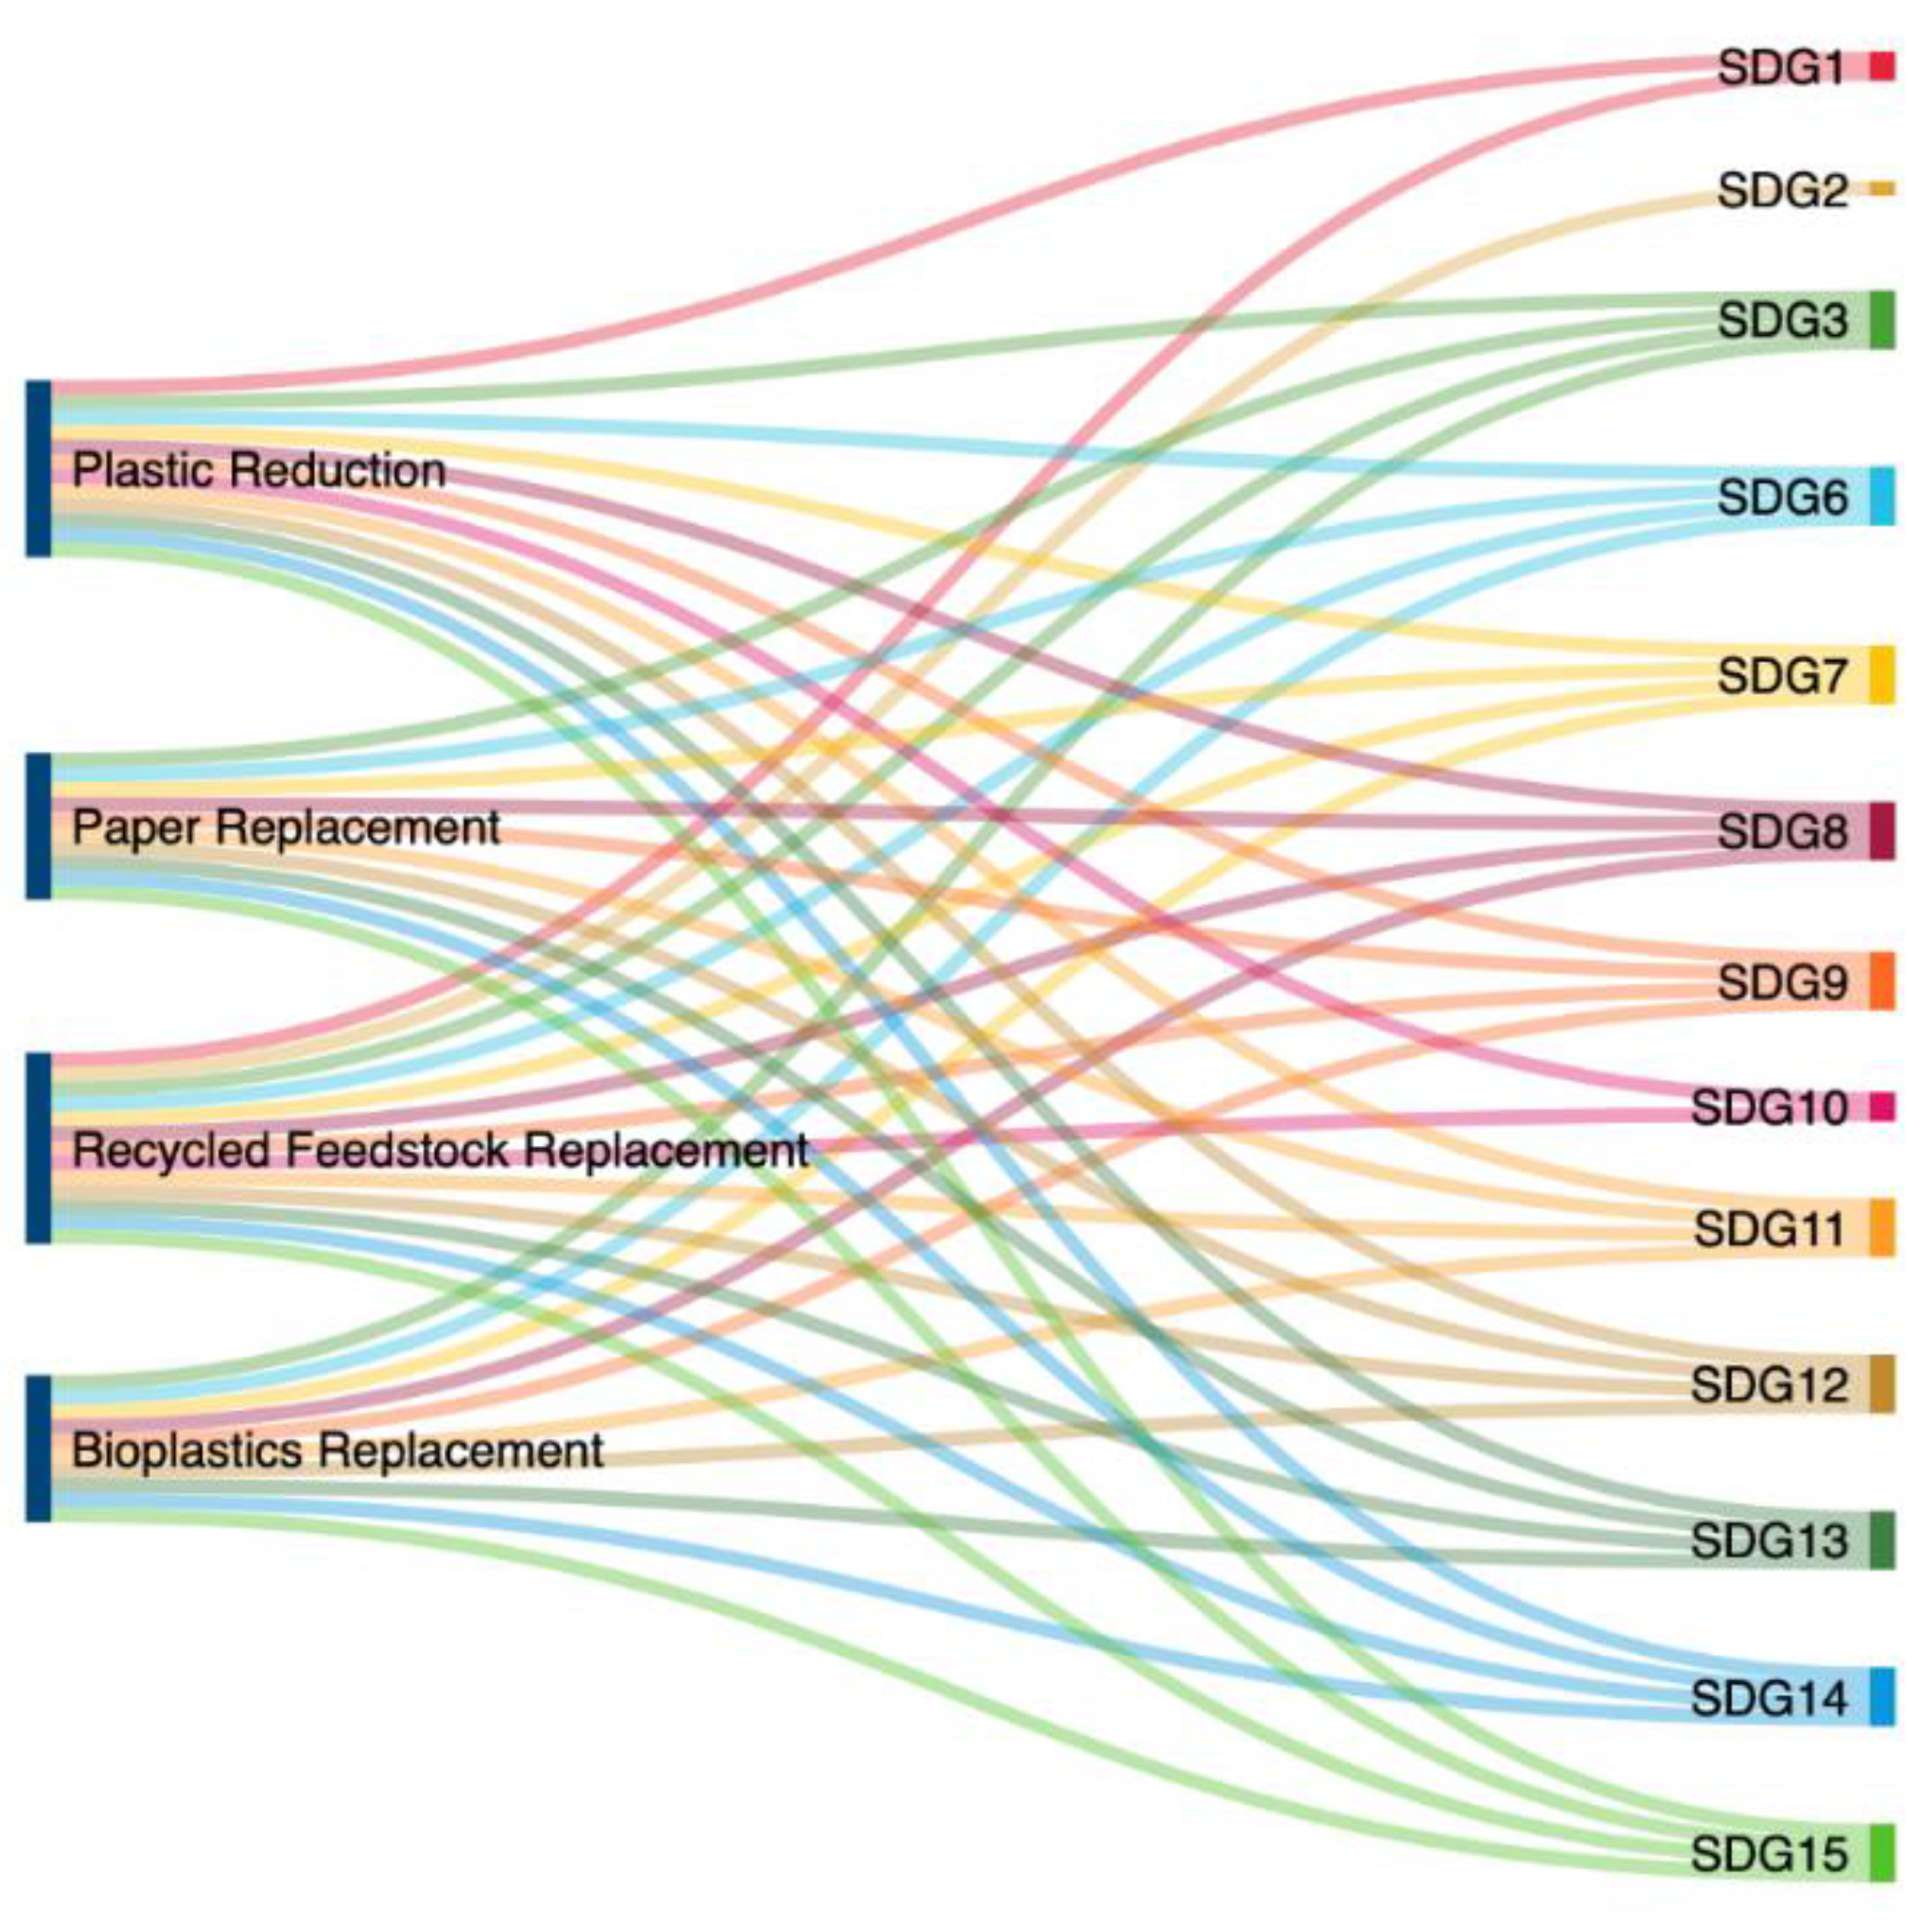
Similarly, approaching interventions as systemic solutions with cascading benefits to other important issues beyond climate allows them to be mapped to different global targets and frameworks [81]. The United Nations Sustainable Development Goals (SDGs), for example, identifies 17 goals and accompanying targets and indicators designed to solve many global challenges, such as ending poverty and hunger, improved health and well-being, universal education and voluntary family planning, ecosystem protection, etc. [82]. The interventions identified to mitigate emissions from the plastics industry in this study can be mapped through direct and indirect linkages to the specific targets of the SDGs (Figure 4) [81]. The effect of applying these interventions can be seen throughout the whole supply chain as they not only stimulate responsible production, usage of innovative materials, and waste, but also they indirectly impact entire material life cycles including end of life. The Integrated Plastic System interventions require new, sustainable infrastructure and innovative solutions (SDG 9) which will reduce virgin plastic production and consumption (SDG 7, 12, 13). This will benefit the waste management system by decreasing the amount of unmanaged waste (SDG 3, 6, 11) and plastic waste leaking into the terrestrial and aquatic environment (SDG 14 and SDG 15). Applying those interventions requires creating new jobs which could support the most vulnerable communities that are currently at the upfront of facing waste management challenges [5] (SDG 1, 2, 8, 10).
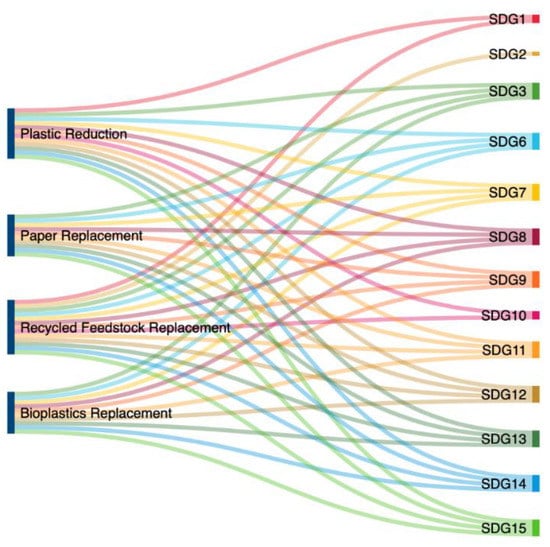
Figure 4.
Integrated Plastic System solutions and its links to the United Nations Sustainable Development Goals.
5. Conclusions
Interventions to reduce the plastic pollution crisis are high on the agenda of many nations/worldwide due to severe negative consequences for the environment and human functioning. The aim of this study was to investigate the current and future consumption of non-durable plastic goods, and what the quantitative climate impact of interventions to the plastics market can be. As proven, limiting virgin plastic production for non-durable goods has a high potential to cut GHG emissions as it can reduce between 9.5 and 14.9 Gt CO2-eq in 30 years, thus playing a significant role in tackling the climate crisis. This requires the integration of different strategies, starting with eliminating unnecessary plastic, reuse schemes, and replacing it with different materials. The largest climate impact comes from decreased production of plastics through reduced demand and alternative distribution methods, followed by recycled plastic, and then replacement with alternative materials (paper, bioplastic), which have the least emissions savings potential. Transforming the plastic system will also bring many additional benefits for human beings and the environment, helping to achieve thirteen Sustainable Development Goals. Looking at the plastic pollution crisis from a climate crisis angle gives many opportunities for policymakers and other stakeholders to empower action towards a reduced plastic future.
Author Contributions
Conceptualization, E.J., M.R.G. and C.J.F.; methodology, E.J., M.R.G. and C.J.F.; formal analysis, E.J. and M.R.G.; writing—original draft preparation, E.J. and M.R.G.; writing—review and editing, E.J., M.R.G. and C.J.F.; visualization, E.J. and M.R.G.; supervision, C.J.F. All authors have read and agreed to the published version of the manuscript.
Funding
This research was funded by Project Drawdown.
Institutional Review Board Statement
Not applicable.
Informed Consent Statement
Not applicable.
Data Availability Statement
Not applicable.
Acknowledgments
The authors thank Kevin Bayuk for his contribution to developing Drawdown Industry sector solutions.
Conflicts of Interest
The authors declare no conflict of interest.
Appendix A
Appendix A.1. Modelling Framework
The Project Drawdown modeling framework was used because of its integrated approach to evaluating interventions across multiple sectors reflecting most areas of human economic activity [57]. By clearly delineating the range of interventions and the relevant conventional technologies they impact or replace within limited boundaries, the framework avoids double-counting impacts across interventions, manages stock and flow relationships across the multisectoral system, and accounts for some interaction effects within and across sectors. For example, this study required integrating with the Project Drawdown food, agriculture, and land use, and paper production models to determine stock availability for various alternatives to conventional plastics [57].
As described in the Methodology, the adoptions of both conventional and interventions were projected for each of several adoption cases from 2018 to 2050 and the comparison of three solution scenarios (Plausible, Ambitious, and Maximum) with a reference scenario is what constituted the results (Figure A1). The results are obtained by following the step-by-step approach presented in Figure A1 and described below.
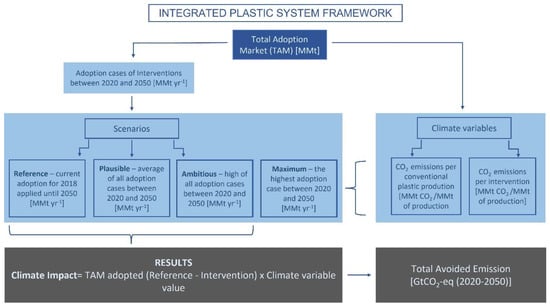
Figure A1.
Conceptual diagram of Integrated Plastic System modeling framework.
Figure A1.
Conceptual diagram of Integrated Plastic System modeling framework.
Appendix A.2. Total Adoption Market
Total Addressable Market (TAM) is determined based on a mixture of reported historical estimates for years 2014–2020 and projected future demand from 2021–2060 using existing market prognostications from published sources. The TAM—all plastic demanded between 2014–2050 under the reference scenario—is derived from several sources [1,2,7,28]. Only plastics that are non-durable goods with an average life span below 3 years, which represents around 64% of plastics production in 2016, are considered [1,7,29].
Appendix A.3. Interventions and Their Adoption Cases
Four interventions have been identified and developed to reduce GHG emissions from the global plastic system. The prioritization of interventions is explained in Materials and Methods. More details on interventions specification are listed here:
- Plastic Reduction: Non-durable goods by definition end up in waste quickly, and the potential reduction of this waste has a host of environmental benefits, from prevention of landfill gasses as well as environmental leakage [8]. These benefits are amplified in low-income countries and communities that may lack robust waste management infrastructure.In practice, some part of this solution would take the form of reuse models both at the level of producer (new delivery models such as take-back services) and at the level of consumer. However, these models all depend on continued-use items, and large-scale items that per single-use are negligible when compared to the number of single-use plastic items that they would currently replace. Following sources were used in as adoption in Plastic Reduction intervention:
- Ref. [4] assumed reducing growth in plastics demand from the 4% current annual growth rate of global plastics demand to 2% by 2050. Their analysis does not consist of any specific solution but rather assumes the reduced demand to limit CO2-eq emissions from the global plastics system.
- Ref. [25] published an estimate of plastics reduction using a scenario assuming reduced plastics use (or consumption). In the ambitious scenario, plastic waste generation is reduced from predicted waste generation levels at a linear rate to reach target reductions in 2030 of 10% in high income, 5% in upper-middle-income and low-middle income, and no increase in plastic waste generation in low-income countries. The solutions to reach assumed reduction targets include: reducing virgin plastic products made from fossil feedstocks; education, public awareness campaigns leading to behavioral change and reductions in a personal plastic waste generation; legislative level bans, levies, or taxes on ‘single-use’, ‘disposable’ or ‘unnecessary’ products, such as thin-film shopping bags; replacement with alternative feedstocks that are easily compostable; and requirements for producers to report information regarding quantity and types of designated products and packaging supplied.
- Ref. [30] report finds that in a business-as-usual scenario, plastic packaging production quadruples by 2050; but in a best-case scenario with increased closed-loop recycling and innovation to reduce plastic packaging at the source, the market would double. This slower growth is used as a reduced consumption scenario as well.
- Ref. [7] analysis suggest a reduction of 30% of plastics consumption by 2040. Their reduction solutions include eliminating unnecessary items and over-packaging (an 8% reduction in plastic); expanding reuse options that can replace the utility currently provided by plastic, including products intended for consumers to reuse (4% reduction); and new delivery models such as refill systems (18% reduction).
- Ref. [31] estimated that as much as 60% of single-use plastics can be reduced by 2050. Their solution includes dematerialization and reuses including banning single-use plastics, deposit schemes, incentivizing consumers to reduce single-use plastics, and self-dispensing and refill schemes.
- Paper Replacement—replacement of plastic non-durable goods with paper products is prioritized first among the replace solutions. This is principal because paper products on average have a lower emissions footprint for production, and they are typically compostable or biodegradable, offering better options for end-of-life management, as opposed to plastics that do not decompose. Additionally, the infrastructure for paper collection and recycling is much better developed than the one for plastics [65]. The quantity of the Reduced Plastics TAM that can be replaced with paper or the coated paper is based on estimates from [9], which identifies the technical feasibility for paper substitution as 110 Gt by 2050. A time series is derived based on interpolation to this value (110 Gt) in 2050, which is then used as the paper replacement scenario and due to lack of other sources is kept constant for all three scenarios.
- Recycled feedstock Replacement—The next prioritized solution is the replacement of conventional plastics with recycled plastics. Recycled plastics, defined as plastics produced from post-consumer waste, have a significantly lower carbon footprint than virgin plastics; thus increasing the number of plastics recycling through the increased collection, reduced yield losses, and incentivization or switching feedstocks from virgin to recycled, could have a significant impact on the global carbon budget of materials. Though currently, virgin plastic production tends to be cheaper, recycled polymers also can be cheaper than virgin materials due to energy savings and volatile oil prices. The number of plastics that are technologically and economically feasible for production from recycled plastics in non-durable goods is compiled from [2,9,27,31], the Plastics Pact and new EU regulations. Based on an average derived from these sources, about 55% of the Reduced Plastics TAM can be supplied by recycled plastics by 2050. Replacement with Recycled Plastics was based on historical adoption trends in the US for the Plausible Scenario [83] feasible adoption of recycling estimates from [84] for the Ambitious scenario, and an optimistic recycling scenario from [84] for the Maximum Scenario, all feedstock limited by the availability of plastic waste, as described in Section 2.2.
- Bioplastic Replacement—Bioplastics represent a broad array of technologies to produce many different types of materials such as packaging, textiles, durable goods, and disposable products. The many different types of bioplastics can and are made using a wide variety of feedstocks with a significant portion of the current research being dedicated to identifying and expanding available feedstocks. There are several categories of materials that encompass bioplastics. Some plastics are bio-based, or part bio-based and part fossil-based, but not biodegradable, such as Bio-PET (polyethylene terephthalate) which contains plant-derived ethylene. Other plastics that are bio-based but not biodegradable are bio polyethylene, bio polypropylene, polyamides, and more. There are additionally bio-based and biodegradable plastics, of which some examples are polylactic acid (PLA) and polyhydroxyalkanoates (PHA). The final category is other biodegradable plastics, such as polybutylene adipate terephthalate (PBAT). This class of plastics can have lower life cycle CO2-eq footprints due to a lower energy requirement for production and some potential carbon sequestration in their growing and production. The remainder of the Reduced Plastics TAM after allocation to minimum virgin feedstock requirements, Paper Replacement, Recycled Feedstock Replacement are allocated to Bioplastics. Replacement with Bioplastics is based on conservative estimates from [58] reports, [85] market projections, [32], and [59] constrained by biomass availability.
Appendix A.4. Scenarios and Climate Variables
The described above adoption potential resulted in few adoption cases per each intervention. Those were aggregated to create four scenarios:
- Reference scenario, adoption was fixed at the percent adoption in the specified current year (2018). The percent of intervention adoption was kept constant throughout the study period (until 2060). This serves as the baseline for comparison that the Plausible, Ambitious, and Maximum scenarios were compared against (Figure A1).
- Plausible scenario represents the situation in which interventions are adopted at a realistically vigorous rate over the time period under investigation. A complete analysis was performed for the Plausible scenario, where the rate of TAM adoption (in MMt) was an average of all adoption cases for a specific intervention (listed in Appendix A.3).
- Ambitious scenario represents the situation in which the adoption of interventions is optimized to be more ambitious than Plausible scenario. The same analysis was performed for the Ambitious scenario as for the Plausible scenario; however, the rate of TAM adoption (in MMt) was a high of all adoption cases for a specific intervention (listed in Appendix A.3).
- Maximum scenario represents the single highest adoption of intervention (listed in Appendix A.3).
Appendix A.5. Climate Impact Results
Emissions factors and climate impact results are described in Methodology and applied following Figure A1.
References
- World Economic Forum. The New Plastics Economy Global Commitment 2019 Progress Report; Ellen MacArthur Foundation: Isle of Wight, UK, 2016. [Google Scholar]
- Plastic Europe. Plastics—The Facts 2020. 2021. Available online: https://plasticseurope.org/knowledge-hub/plastics-the-facts-2020/ (accessed on 19 May 2022).
- Shershneva, E.G. Progressive Technologies of Waste Utilization as Drivers of Sustainable Development. IOP Conf. Ser. Mater. Sci. Eng. 2021, 1079, 062044. [Google Scholar] [CrossRef]
- Zheng, J.; Suh, S. Strategies to reduce the global carbon footprint of plastics. Nat. Clim. Chang. 2019, 9, 374–378. [Google Scholar] [CrossRef]
- Kaza, S. What a Waste 2.0: A Global Snapshot of Solid Waste Management to 2050; World Bank: Washington, DC, USA, 2018. [Google Scholar]
- Kaza, S.; Yao, L.; Stowell, A. Sustainable Financing and Policy Models for Municipal Composting; World Bank: Washington, DC, USA, 2016. [Google Scholar]
- Lau, W.W.Y.; Shiran, Y.; Bailey, R.; Cook, E.; Stuchtey, M.; Koskella, J.; Velis, C.; Godfrey, L.; Boucher, J.; Murphy, M.; et al. Evaluating scenarios toward zero plastic pollution. Science 2020, 369, 1455–1461. [Google Scholar] [CrossRef] [PubMed]
- Heller, M.C.; Mazor, M.H.; Keoleian, G.A. Plastics in the US: Toward a material flow characterization of production, markets and end of life. Environ. Res. Lett. 2020, 15, 094034. [Google Scholar] [CrossRef]
- PEW Charitable Trust. Breaking the Plastic Wave. A Comprehensive Assessment of Pathways Towards Stopping Ocean Platic Pollution; PEW Charitable Trust: Philadelphia, PA, USA, 2020. [Google Scholar]
- Azoulay, D.; Villa, P.; Arellano, Y.; Gordon, M.F.; Moon, D.; Miller, K.A.; Thompson, K. Plastic and Health The Hidden Costs of A Plastic Planet; Center for International Environmental Law: Washington, DC, USA, 2019. [Google Scholar]
- Alabi, O.A.; Ologbonjaye, K.I.; Awosolu, O.; Alalade, O.E. Public and Environmental Health Effects of Plastic Wastes Disposal: A Review. J. Toxicol. Risk Assess. 2019, 5, 021. [Google Scholar]
- Velis, C.A.; Cook, E. Mismanagement of Plastic Waste through Open Burning with Emphasis on the Global South: A Systematic Review of Risks to Occupational and Public Health. Environ. Sci. Technol. 2021, 55, 7186–7207. [Google Scholar] [CrossRef]
- Rochman, C.M. Strategies for reducing ocean plastic debris should be diverse and guided by science. Environ. Res. Lett. 2016, 11, 041001. [Google Scholar] [CrossRef]
- Lebreton, L.; Egger, M.; Slat, B. A global mass budget for positively buoyant macroplastic debris in the ocean. Sci. Rep. 2019, 9, 12922. [Google Scholar] [CrossRef] [Green Version]
- Hardesty, B.D.; Roman, L.; Leonard, G.H.; Mallos, N.; Pragnell-Raasch, H.; Campbell, I.; Wilcox, C. Socioeconomics effects on global hotspots of common debris items on land and the seafloor. Glob. Environ. Change 2021, 71, 102360. [Google Scholar] [CrossRef]
- Beaumont, N.J.; Aanesen, M.; Austen, M.C.; Börger, T.; Clark, J.R.; Cole, M.; Hooper, T.; Lindeque, P.K.; Pascoe, C.; Wyles, K.J. Global ecological, social and economic impacts of marine plastic. Mar. Pollut. Bull. 2019, 142, 189–195. [Google Scholar] [CrossRef]
- Thushari, G.G.N.; Senevirathna, J.D.M. Plastic pollution in the marine environment. Heliyon 2020, 6, e04709. [Google Scholar] [CrossRef] [PubMed]
- Sigler, M. The Effects of Plastic Pollution on Aquatic Wildlife: Current Situations and Future Solutions. Water Air Soil Pollut. 2014, 225, 2184. [Google Scholar] [CrossRef]
- Verma, R.; Vinoda, K.S.; Papireddy, M.; Gowda, A.N.S. Toxic Pollutants from Plastic Waste—A Review. Procedia Environ. Sci. 2016, 35, 701–708. [Google Scholar] [CrossRef]
- Thompson, R.C.; Moore, C.J.; vom Saal, F.S.; Swan, S.H. Plastics, the environment and human health: Current consensus and future trends. Philos. Trans. R. Soc. Lond. B Biol. Sci. 2009, 364, 2153–2166. [Google Scholar] [CrossRef] [PubMed]
- Wright, S.L.; Kelly, F.J. Plastic and Human Health: A Micro Issue? Environ. Sci. Technol. 2017, 51, 6634–6647. [Google Scholar] [CrossRef] [PubMed]
- Smith, M.; Love, D.C.; Rochman, C.M.; Neff, R.A. Microplastics in Seafood and the Implications for Human Health. Curr. Environ. Health Rep. 2018, 5, 375–386. [Google Scholar] [CrossRef] [Green Version]
- Ali, S. Bibliometric Analysis of Emerging Trends in Research on Microplastic Pollution in Post-Paris Agreement and Post-COVID-19 Pandemic World. In Microplastic Pollution. Emerging Contaminants and Associated Treatment Technologies; Hashmi, M.Z., Ed.; Springer: Berlin/Heidelberg, Germany, 2022; pp. 511–538. [Google Scholar]
- Sharafat, A.; Waqas, A.; Yasir, A.S.; Imran, S.C.; Nasibeh, Z. Strategic analysis of single-use plastic ban policy for environmental sustainability: The case of Pakistan. Clean Technol. Environ. Policy 2022, 24, 843–849. [Google Scholar]
- Borrelle, S.B.; Ringma, J.; Law, K.L.; Monnahan, C.C.; Lebreton, L.; McGivern, A.; Murphy, E.; Jambeck, J.; Leonard, G.H.; Hilleary, M.A.; et al. Predicted growth in plastic waste exceeds efforts to mitigate plastic pollution. Science 2020, 369, 1515–1518. [Google Scholar] [CrossRef]
- Lebreton, L.; Andrady, A. Future scenarios of global plastic waste generation and disposal. Palgrave Commun. 2019, 5, 1–11. [Google Scholar] [CrossRef] [Green Version]
- Material Economics. Sustainable Packaging—The Role of Materials Substitution. 2018. Available online: https://materialeconomics.com/publications/sustainable-packaging (accessed on 19 May 2022).
- Mosko, S. Bioplastics: Are They the Solution? 2021. Available online: https://www.resilience.org/stories/2012-10-19/bioplastics-are-they-the-solution/ (accessed on 19 May 2022).
- Plastic Europe. Plastics—The Facts 2018. 2018. Available online: https://plasticseurope.org/wp-content/uploads/2021/10/2018-Plastics-the-facts.pdf (accessed on 19 May 2022).
- Greenpeace. Blog 1 Plastic Packaging and Leakage Still Double by 2050. 2020. Available online: https://www.greenpeace.org/usa/wp-content/uploads/2019/10/going-plastic-free-plastic-packaging-and-leakage-still-double-by-2050.pdf (accessed on 19 May 2022).
- Becqué, R.; Sharp, S. Phasing Out Plastics. The Packaging Sector. 2020. Available online: https://odi.org/en/publications/phasing-out-plastics/ (accessed on 19 May 2022).
- Shen, L.; Haufe, J.; Patel, M. Product Overview and Market Projection of Emerging Bio-Based Plastics; Scientific Research Publishing: Utrecht, The Netherlands, 2009. [Google Scholar]
- Patel, M.K.; Crank, M.; Dornburg, V.; Hermann, B.; Roes, L.; Huesing, B.; Overbeek, L.; Terragni, F.; Recchia, E. Medium and Long-Term Opportunities and Risks of the Biotechnological Production of Bulk Chemicals from Renewable Resources; Technology and Society NWS, Copernicus Institute, Utrecht University: Utrecht, The Netherlands, 2006. [Google Scholar]
- Akiyama, M.; Tsuge, T.; Doi, Y. Environmental life cycle comparison of polyhydroxyalkanoates produced from renewable carbon resources by bacterial fermentation. Polym. Degrad. Stab. 2003, 80, 183–194. [Google Scholar] [CrossRef]
- Chen, G.-Q.; Patel, M.K. Plastics Derived from Biological Sources: Present and Future: A Technical and Environmental Review. Chem. Rev. 2012, 112, 2082–2099. [Google Scholar] [CrossRef] [PubMed]
- Groot, W.J.; Borén, T. Life cycle assessment of the manufacture of lactide and PLA biopolymers from sugarcane in Thailand. Int. J. Life Cycle Assess. 2010, 15, 970–984. [Google Scholar] [CrossRef]
- Yates, M.R.; Barlow, C.Y. Life cycle assessments of biodegradable, commercial biopolymers—A critical review. Resour. Conserv. Recycl. 2013, 78, 54–66. [Google Scholar] [CrossRef]
- Shen, L.; Worrell, E.; Patel, M.K. Comparing life cycle energy and GHG emissions of bio-based PET, recycled PET, PLA, and man-made cellulosics: Modeling and Analysis: Comparing life-cycle energy and GHG emissions of bioproducts. Biofuels Bioprod. Bioref. 2012, 6, 625–639. [Google Scholar] [CrossRef]
- Greene, J.P. Sustainable Plastics Environmental Assessments of Biobased, Biodegradable, and Recycled Plastics; Wiley: Hoboken, NJ, USA, 2014. [Google Scholar]
- Kinsell, A. Paperwork—Comparing Recycled to Virgin Paper; Environmental Paper Network: Asheville, NC, USA, 2012. [Google Scholar]
- Grimes, S.; Donaldson, J.; Grimes, J. BIR—Report on the Environmental Benefits of Recycling—2016 Edition; Bureau od International Recycling: Brussels, Belgium, 2015. [Google Scholar]
- European Environmental Paper Network. Paper Efficiency Scored; European Environmental Paper Network: Asheville, NC, USA, 2013. [Google Scholar]
- Diaz, R.; Warith, M. Life-cycle assessment of municipal solid wastes: Development of the WASTED model. Waste Manag. 2006, 26, 886–901. [Google Scholar] [CrossRef] [PubMed]
- Brogaard, L.K.-S.; Damgaard, A.; Jensen, M.B.; Barlaz, M.; Christensen, T.H. Evaluation of life cycle inventory data for recycling systems. Resour. Conserv. Recycl. 2014, 87, 30–45. [Google Scholar] [CrossRef] [Green Version]
- Ford, J. Carbon Neutral Paper, Fact or Fiction? A Report on the GHG Emissions of Paper Products; European Environmental Paper Network: Asheville, NC, USA, 2009. [Google Scholar]
- Laurijssen, J.; Marsidi, M.; Westenbroek, A.; Worrell, E.; Faaij, A. Paper and biomass for energy? Resour. Conserv. Recycl. 2010, 54, 1208–1218. [Google Scholar] [CrossRef]
- EPA. Opportunities to Reduce Greenhouse Gas Emissions through Materials and Land Management Practices; U.S. Environmental Protection Agency: Washington, DC, USA, 2015. [Google Scholar]
- CEPI (Confederation of European Paper Industries). Key Statistics 2018; European Pulp & Paper Industry: Brussels, Belgium, 2018. [Google Scholar]
- Merrild, H.; Damgaard, A.; Christensen, T.H. Recycling of paper: Accounting of greenhouse gases and global warming contributions. Waste Manag. Res. J. Sustain. Circ. Econ. 2009, 27, 746–753. [Google Scholar] [CrossRef]
- Hillman, K.; Damgaard, A.; Eriksson, O.; Jonsson, D.; Fluck, L. Climate Benefits of Material Recycling: Inventory of Average Greenhouse Gas Emissions for Denmark, Norway and Sweden; Nordic Council of Ministers: Copenhagen, Denmark, 2015. [Google Scholar]
- Shultz, T.; Suresh, A. Life Cycle Assesment Ocomparing Ten Sources of Manmade Cellulose Fiber. SCS Global Services Final Report. Emeryville. 2015. Available online: https://cdn.scsglobalservices.com/files/resources/SCS-Stella-LCA-MainReport-101017.pdf (accessed on 5 April 2021).
- Gemechu, E.D.; Butnar, I.; Gomà-Camps, J.; Pons, A.; Castells, F. A comparison of the GHG emissions caused by manufacturing tissue paper from virgin pulp or recycled waste paper. Int. J. Life Cycle Assess. 2013, 18, 1618–1628. [Google Scholar] [CrossRef]
- More Recycling. NERC Webinar, Recycling Markets. 2021. Available online: https://www.youtube.com/watch?v=z4C01elgIWU (accessed on 5 April 2021).
- Hottle, T.A.; Bilec, M.M.; Landis, A.E. Sustainability assessments of bio-based polymers. Polym. Degrad. Stab. 2013, 98, 1898–1907. [Google Scholar] [CrossRef]
- Vink, E.T.H.; Rábago, K.R.; Glassner, D.A.; Gruber, P.R. Applications of life cycle assessment to NatureWorksTM polylactide (PLA) production. Polym. Degrad. Stab. 2003, 80, 403–419. [Google Scholar] [CrossRef]
- Dornburg, V.; Lewandowski, I.; Patel, M. Comparing the Land Requirements, Energy Savings, and Greenhouse Gas Emissions Reduction of Biobased Polymers and Bioenergy. J. Ind. Ecol. 2003, 7, 93–116. [Google Scholar] [CrossRef] [Green Version]
- Project Drawdown. 2022. Available online: https://drawdown.org/ (accessed on 16 May 2022).
- European Bioplastics. Bioplastics Facts and Figures. 2018. Available online: https://docs.european-bioplastics.org/publications/EUBP_Facts_and_figures.pdf (accessed on 19 May 2022).
- IfBB. Biopolymers Facts and Statistics: 2018 Production Capacities, Processing Routes, Feedstock, Land and Water Use; Institute for Bioplastics and Biocomposites, Hochschule Hannover: Hannover, Germany, 2018. [Google Scholar]
- Material Economics. The Circular Economy. A Powerful Force for Climate Mitigation; Material Economics: Stockholm, Sweden, 2018. [Google Scholar]
- Khoironi, A.; Anggoro, S.; Sudarno, S. Community behavior and single-use plastic bottle consumption. IOP Conf. Ser. Earth Environ. Sci. 2019, 293, 012002. [Google Scholar] [CrossRef]
- OECD. Extended Producer Responsibility. 2021. Available online: https://www.oecd.org/env/tools-evaluation/extendedproducerresponsibility.htm (accessed on 19 May 2022).
- Ellen Macarthur Foundation. Towards the Circular Economy; Ellen Macarthur Foundation: Isle of Wight, UK, 2012; Volume 1. [Google Scholar]
- Vallette, J. The New Coal. Plastic & Climate Change; Beyond Plastic: Bennington, VT, USA, 2021. [Google Scholar]
- Eurostat. Packaging Waste by Waste Management Operations and Waste Flow, 1997–2017. 2020. Available online: https://ec.europa.eu/eurostat/cache/metadata/en/env_waspac_esms.htm (accessed on 19 May 2022).
- D’Ambrières, W. Plastics recycling worldwide: Current overview and desirable changes. Field Actions Sci. Rep. 2019, 19, 12–21. [Google Scholar]
- Woodring, D.; Hyde, T. Recycled Plastic: There’s Market Demand, but Where’s the Supply? Available online: https://www.greenbiz.com/article/recycled-plastic-theres-market-demand-wheres-supply (accessed on 4 February 2022).
- Posen, I.D.; Jaramillo, P.; Landis, A.E.; Griffin, W.M. Greenhouse gas mitigation for U.S. plastics production: Energy first, feedstocks later. Environ. Res. Lett. 2017, 12, 034024. [Google Scholar] [CrossRef]
- Escobar, N.; Haddad, S.; Börner, J.; Britz, W. Land use mediated GHG emissions and spillovers from increased consumption of bioplastics. Environ. Res. Lett. 2018, 13, 125005. [Google Scholar] [CrossRef]
- Brizga, J.; Hubacek, K.; Feng, K. The Unintended Side Effects of Bioplastics: Carbon, Land, and Water Footprints. One Earth 2020, 3, 45–53. [Google Scholar] [CrossRef]
- Haque, A.N.M.A.; Naebe, M. Flexible water-resistant semi-transparent cotton gin trash/poly (vinyl alcohol) bio-plastic for packaging application: Effect of plasticisers on physicochemical properties. J. Clean. Prod. 2021, 303, 126983. [Google Scholar] [CrossRef]
- EIA. Petroleum & Other Liquids. 2021. Available online: https://www.eia.gov/petroleum/ (accessed on 19 May 2022).
- CIEL. The Long-Term Prospects for the Plastics Boom: Untested Assumptions and Unanswered Questions in the Plastics Boom; Center for International Environmental Law: Washington, DC, USA, 2018. [Google Scholar]
- James, G. The Plastics Landscape: Risks and Opportunities Along the Value Chain; The Principles for Responsible Investment: London, UK, 2019. [Google Scholar]
- Filho, W.L.; Saari, U.; Fedoruk, M.; Iital, A.; Moora, H.; Klöga, M.; Voronova, V. An overview of the problems posed by plastic products and the role of extended producer responsibility in Europe. J. Clean. Prod. 2019, 214, 550–558. [Google Scholar] [CrossRef]
- Jambeck, J.; Geyer, R.; Wilcox, C.; Siegler, T.R.; Perryman, M.; Andrady, A.; Narayan, R.; Law, K.L. Plastic waste inputs from land into the ocean. Science 2015, 347, 768–771. [Google Scholar] [CrossRef]
- Ocean Conservancy; McKinsey&Co. Stemming the Tide: Land-Based Strategies for a Plastic-Free Ocean; Ocean Conservancy: Washington, DC, USA, 2015. [Google Scholar]
- Lebreton, L.; Slat, B.; Ferrari, F.; Sainte-Rose, B.; Aitken, J.; Marthouse, R.; Hajbane, S.; Cunsolo, S.; Schwarz, A.; Levivier, A.; et al. Evidence that the Great Pacific Garbage Patch is rapidly accumulating plastic. Sci. Rep. 2018, 8, 4666. [Google Scholar] [CrossRef] [PubMed] [Green Version]
- Hale, R.C.; Seeley, M.E.; Guardia, M.J.L.; Mai, L.; Zeng, E.Y. A Global Perspective on Microplastics. J. Geophys.Res. Ocean. 2020, 125, e2018JC014719. [Google Scholar] [CrossRef]
- Lusher, A.; Hollman, P.; Mendoza-Hill, J. Microplastics in Fisheries and Aquaculture. Status of Knowledge on Their Occurrence and Implications for Aquatic Organisms and Food Safety; Food and Agriculture Organization of the United Nations: Rome, Italy, 2017. [Google Scholar]
- Frischmann, C.J.; Mehra, M.; Allard, R.; Bayuk, K.; Gouveia, J.P.; Gorman, M.R. Drawdown’s ‘System of Solutions’ Helps to Achieve the SDGs. In Partnerships for the Goals; Filho, W.L., Azul, A.M., Brandli, L., Lange Salvia, A., Wall, T., Eds.; Springer: Berlin/Heidelberg, Germany, 2020; pp. 1–25. [Google Scholar]
- United Nations, Departament of Economic and Social Affairs. The 17 Goals. 2022. Available online: https://sdgs.un.org/goals (accessed on 19 May 2022).
- EPA United States Environmental Protection Agency. Plastics: Material-Specific Data. 2021. Available online: https://www.epa.gov/facts-and-figures-about-materials-waste-and-recycling/plastics-material-specific-data (accessed on 19 May 2022).
- World Economic Forum. The New Plastics Economy: Rethinking the Future of Plastics. 2016. Available online: https://www.weforum.org/reports/the-new-plastics-economy-rethinking-the-future-of-plastics/ (accessed on 25 April 2021).
- Lewis, K. A New Industrial Revolution for Plastics. 2019. Available online: https://www.usda.gov/media/blog/2018/09/19/new-industrial-revolution-plastics (accessed on 21 November 2019).

Publisher’s Note: MDPI stays neutral with regard to jurisdictional claims in published maps and institutional affiliations. |
© 2022 by the authors. Licensee MDPI, Basel, Switzerland. This article is an open access article distributed under the terms and conditions of the Creative Commons Attribution (CC BY) license (https://creativecommons.org/licenses/by/4.0/).