Abstract
The prevalence of abiotic stresses hampers soil health and plant growth in most ecosystems. In this study, rice husk iron-enriched biochar (BC) was prepared and its superiority in terms of nutrients enrichment, porosity and different acidic functional group (O-H, C=O) relative to simple biochar was confirmed through scanning electron microscopic, X-ray fluorescence and Fourier transform infrared analysis. To further evaluate its nickel (Ni), salt (NaCl) and carbonate (CaCO3) stress mitigating impact on wheat physiology and biochemical attributes, a pot experiment was conducted using; BC (1%), Ni (0.5 mM NiNO3), Na (100 mM NaCl) and CO3 (100 mM CaCO3) and with twelve treatments; T1; Control, T2; NiNO3, T3; CaCO3, T4; NaCl, T5; BC, T6; Ni + BC, T7; CaCO3 + BC, T8; NaCl + BC, T9; Ni + CaCO3 + BC, T10; Ni + NaCl + BC, T11; CaCO3 + NaCl + BC, T12; Ni + NaCl + CaCO3 + BC. The Langmuir isotherm model revealed the maximum Ni adsorption capacity (2433 mg g−1) in treatments where Ni was applied with BC soil. Maximum soil DTPA-extractable Ni was found in the T9 treatment; however, Ni concentration was not reported in wheat roots while only trace amounts of Ni were found in wheat shoots with the T9 treatment. It was suggested that BC has the capacity to induce the immunization effect in plant roots by providing additional Fe so their ionic homeostasis and redox metabolism worked properly. This argument was further paved by the enhanced adsorption of these toxic ions in the presence of BC-favored wheat growth as indicated by maximum increases in shoot iron and potassium concentrations under Ni + CaCO3 + BC, relative to control. Furthermore, the decrease in shoot hydrogen peroxide (H2O2) (20%) and malondialdehyde (32%) concentrations and increase in shoot ascorbate peroxidase (81%) and catalase (three-fold) activities under Ni + BC relative to Ni + NaCl + CaCO3 + BC controlled the cell membrane damage. In conclusion, BC proved to be an excellent amendment to reduce the toxic effects of Ni, NaCl and CaCO3 stresses and enhance wheat growth and nutrition.
1. Introduction
Soil heavy metal toxicity aggravates when it shares its toxic effects with other abiotic stresses [1]. The addition of nickel (Ni) to the soil, through sewage sludge, fertilizers, soil amendments and various industrial processes, leads to its toxicity which affects plant growth via minimizing water use efficiency and antioxidant activity [2]. Ni toxicity together with NaCl stress causes a decline in soil water holding capacity (WHC), synthesis of photosynthetic pigments, lower antioxidant activities/proline content by enhancing hydrogen peroxide (H2O2) and lipid peroxidation (LPO) in Brassica nigra [3]. Similarly, a significant decrease in plant carotenoids, carbonic anhydrase activity and chlorophyll contents have been reported with the combined application of Ni and NaCl [4]. Moreover, phytotoxicity of Ni along with cadmium (Cd) increases the production of reactive oxygen species (ROS) and causes LPO by producing malondialdehyde (MDA) and H2O2 accumulation in Triticum aestivum [5]. Additionally, calcium (Ca2+) ions play their role in signaling pathways in plants, however, in calcareous soils (rich in CaCO3), excessive carbonates become a threat for potential plant growth. It not only minimizes the soil WHC but also causes oxidative damage to seed embryos through the increased production of H2O2 [6].
With the developing concerns about contrasting abiotic stresses, scientists are working on biochar as a more sustainable approach due to its pronounced effects on plant growth via enhanced nutrient efficacy and potential detoxification of different abiotic stresses [7]. However, simple biochar application does not provide a complete remedial approach until it is co-composted through various procedures to ensure effective nutrient delivery to plants. In a co-composted biochar, aromatic structures make Van der Waals interactions and water bridges with C-chains of fluorinated compounds to increase their persistence in soil [8]. Similarly, biochar enrichment with suitable metal not only improves its structure and composition but also plays a key role in enhancing its bonding with a substrate. Cationic enriched biochar (Ca2+ or Mg2+) of size 10–20 μm binds with silicon and oxygen-rich mineral aggregates in crystalline structure whereby modifying the potential strength of minerals to increase their efficiency in soil [9]. Under contrasting stress conditions, the addition of iron (Fe) to biochar strengthens plant growth by reducing the chlorides (Cl−), excessive carbonates (CO3−) and Ni+2 toxicity through the enhanced surface area, WHC and stabilized pH of the soil. Furthermore, biochar doped with magnetic Fe results in a larger percentage of C functional groups for nutrient and metal adsorption [10].
In a biochar-mineral complex, magnetic nanoscale zerovalent iron (Fe0) coated on biochar usually remains precipitated, having an important reductant property for metals that makes C-O-Fe an electron acceptor [11]. As chromium Cr+6 is reduced to Cr+3 and Fe also changes its oxidation state, the activity of Fe towards Cr+6 reduction enhances by the formation of Fe+3 organic acid where Fe biochar serves as electron shuttle and enhances its reducing capacity [12]. Fe-enriched biochar (BC) may have advantages over untreated conventional biochar in many aspects. Application of biochar, enriched with Fe nanoparticles, in degraded soil enhances microbial communities (an increase of operational taxonomic units from 2978 to 3651 and Shannon diversity Index from 7.16 to 8.80) as compared to conventional biochar, which further reduces the chlorpyrifos (pesticide) uptake by improving the root Fe plaque in Allium fistulosum L. Ni adsorption onto the surface of the BC-soil interface could be an important mechanism to explain the immobilization of toxic metals in soil. Two isotherm adsorption models (Langmuir and Freundlich) were commonly used to assess the adsorption of Ni on BC and soil interface as a sole amendment or combined with the aforementioned stress conditions [2].
Keeping in view the improved structural as well as surface adsorption characteristics of Fe-enriched biochar, the current study aimed to investigate its potential as an effective soil conditioner to improve wheat (Triticum aestivum L.) growth and physiological performance when subjected to multiple stressors viz. Ni, salinity (NaCl) and carbonate (CaCO3) stresses.
2. Materials and Methods
2.1. Biochar Preparation, Enrichment and Experimental Design
Biochar was prepared by the pyrolysis of rice husk at 515 °C in a furnace (TF-1200X, Hefei Ke Jing Materials Technology Co., Ltd., Hefei, China) at a heating rate of 10 °C min−1 maintained up to 2 h. Finally, the product (biochar) was cooled at room temperature and stored in boxes. To prepare iron (Fe)-enriched biochar, 1 kg of biochar was soaked into 5 litres of water in a self-designed hot slurry stirring vessel. The material was continuously boiled at 100 °C and kept stirring. Additionally, iron chloride (FeCl3; 16% w/w) and iron sulfate (Fe2SO4; 20% w/w) were added after 10 min. The temperature was constantly monitored through an infrared (IR) thermometer (Smart Sensor AR852B+) and the process was ended after 90 min. The suspension was filtered through Whatman no. 42 filter paper to collect Fe-enriched biochar residues. The prepared doped biochar was thoroughly mixed with bentonite (100 g kg−1), air-dried and then oven-dried at 75 °C to achieve the final product [13]. To verify Fe enrichment, the rice husk biochar and Fe-enriched rice husk biochar were subjected to structural analysis using scanning electron microscope (SEM) (JSM-6490A, JEOL, Tokyo, Japan), analysis of elemental composition using X-ray fluorescence XRF (JSX-3202M, Freising, Germany) and functional groups estimation using Fourier transform infrared (FTIR) spectroscopy technique (Figure 1 and Figure 2). On the basis of the O-H acidic functional group, because the porous structure exposed a higher surface area for metal adsorption and higher metal (Fe) concentration on its surface, BC was selected over simple rice husk biochar for further pot experiments.
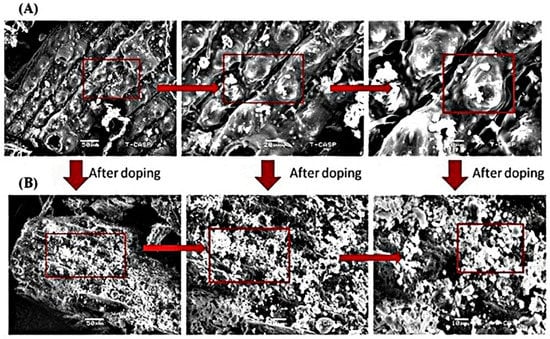
Figure 1.
(A) Scanning electron microscope (SEM) images of rice husk biochar at 10 µm, 20 µm and 50 µm demonstrate that the Biochar sample has a cylindrical rod shape. (B) the Fe-doped rice husk biochar has denatured cylindrical rod shape structures.
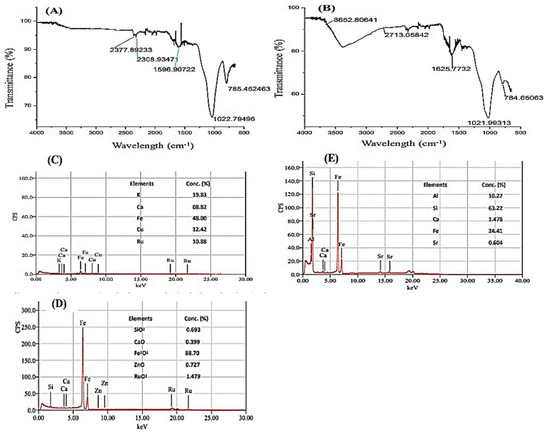
Figure 2.
FTIR spectra of (A) Rice husk biochar indicated no band formation from 4000–2500 cm−1 (B) Fe-enriched BC indicated a clear broad peak band formation of O-H acidic functional group from 4000–2500 cm−1 (C) X-ray fluorescence of rice husk biochar. It shows the elemental concentration in rice husk biochar where Fe concentration (48% Fe2O3) (D) X-ray fluorescence of rice husk Fe- doped biochar (E) X-ray fluorescence of bentonite clay. It was added at the end of the process to increase the resilience and persistence of the organic product in multiple stressed soils.
A pot experiment was conducted in the greenhouse of Government College University (GCU), Lahore from October–November, 2019. During the experimental period, the environmental conditions in the wire-house were monitored as follows: temperature ranged from 20–25 °C, relative humidity 45 ± 10% and ambient CO2 concentration varied from 0.039–0.057 vol%. The soil used in this experiment was bhal soil, the physico-chemical properties of which were mentioned in Table S1 (Supplementary).
Each pot of twelve treatments was filled out with 4 kg of bhal soil. The experimental set up was arranged in triplicates having different materials BC (1%), Ni (0.5 mM NiNO3), Na (100 mM NaCl) and CO3 (100 mM CaCO3) with twelve treatments; T1; Control, T2; NiNO3, T3; CaCO3, T4; NaCl, T5; BC, T6; Ni + BC, T7; CaCO3 + BC, T8; NaCl + BC, T9; Ni + CaCO3 + BC, T10; Ni + NaCl + BC, T11; CaCO3 + NaCl + BC, T12; Ni + NaCl + CaCO3 + BC. There were ten wheat seeds (cv. Faisalabad-2008), which were good quality, healthy and gave 100% true callus [14], sown in each pot. After 10 days of sowing (DAS), NPK fertilizers (Urea, Diammonium phosphate and sulfate of potash) at the ratio of 3:2.5:1 were applied manually. Then, four plants were maintained in each pot. At 45 DAS, four plants (roots and shoots) were harvested manually from each pot, separated from soil, washed with distilled water, and placed in aluminium foil then stored in plastic sealed bags in a refrigerator (HDF-325H-01:DF/White/R600a) at −20 °C for biochemical analysis. In the next step, two plants were taken, sun-dried for 72 h and then oven-dried at 65 °C [1]. Afterwards, the dry weight (g) of all plant samples was recorded on weighing balance before proceeding to the elemental analysis.
2.2. Shoot and Root Elemental and Biochemical Analysis
2.2.1. Analysis of Sodium (Na), Calcium (Ca), Magnesium (Mg), Potassium (K), Iron (Fe) and Nickel (Ni)
Dried root and shoot samples (0.1 g) were taken in a digestion tube and digested by using a di-acid (HNO3:HClO4) mixture in 3:1. Samples were filtered and absorbance of Na, Ca, Mg, K, Fe and Ni were measured on a multi-sequential atomic absorption spectrophotometer (AAS) (ICE-3000, Thermofischer, Bremen, Germany). Standards of individual elements were prepared as described by Jones and Case [4].
2.2.2. Estimation of Hydrogen Peroxide (H2O2), Melondialdehyde (MDA) and Cell Membrane Permeability (CMP)
For the H2O2 estimation in fresh leaf samples, the methodology of Velikova et al. [15] was used and absorbance was measured at 390 nm by using a spectrophotometer (Shimadzu UV-1201, Kyoto, Japan). Melondialdehyde (MDA) content in fresh leaf samples was recorded by using the methodology of Velikova et al. [15] and absorbance was recorded at 532 and 600 nm by spectrophotometer. For CMP, [16]’s methodology was used and the percentage of CMP was measured by the following formula:
2.2.3. Determination of Root and Shoot Phenolics and Protein Concentrations
Total phenolics in roots and shoots were calorimetrically determined by the method as described by Singleton [17]. The absorbance of total phenolics was determined by using a spectrophotometer (Shimadzu UV-1201, Kyoto, Japan) at 760 nm and expressed in μg g−1. Crude protein concentration in fresh root and shoot samples was determined following the Bradford method [18].
2.2.4. Analysis of Antioxidant Enzymes
Fresh wheat leaf (0.2 g) was grounded by pestle and mortar by using 1.2 mL of 0.2 M potassium phosphate buffer (pH 7.8) and centrifuged at 15,000 rpm for 20 min. The supernatant was separated and 0.8ml of buffer solution was added. The supernatant was collected and stored on ice to determine different antioxidant enzymes. Ascorbate peroxidase (APX) activity was assayed by using the method of Nakano and Asada [19] and APX absorbance was measured at 290 nm using a spectrophotometer (Shimadzu UV-1201, Kyoto, Japan). For catalase (CAT) determination, a methodology described by Cakmak and Horst was used and CAT absorbance was recorded spectophotometerically at 240 nm [20].
2.2.5. Determination of Chlorophyll Contents
Concentrations of chlorophyll a and b were determined by using fully expanded fresh leaf material. The concentrations of chlorophyll a and b were calculated according to the equations described by Strain and Svec [21].
A663* = Absorbance at 663 nm wavelength.
A645* = Absorbance at 645 nm wavelength.
2.3. Post-Harvest Soil Analysis
2.3.1. Study of Ni Sorption through Isotherm Models
To study the Ni adsorption rate of the BC-soil interface, Langmuir and Freundlich isotherm models were used. For that purpose, a sample was prepared by adding soil (10 g) into 125 mL flask with 20 mL extraction solution (0.1 M calcium chloride (CaCl2), 0.005 M diethylene triamine penta acetic acid (DTPA), 0.1 M Triethanolamine (TEA) into 1 L deionized water). After 2 h of shaking on a reciprocal shaker, the suspension was filterted and run on an Atomic Absorption Spectrophotometer for the quantification of adsorbed Ni in soil [16]. The following equations were used to determine the percentage of adsorption and absorption capacity [9].
where
- Qe = Adsorbent capacity, expressed as amount of Ni per adsorbent mass unit at equilibrium (mg g−1)
- V = Volume of Ni solution (L)
- Co = Initial Ni concentration in soil solution (mg L−1)
- Ce = Equilibrium Ni concentration in soil solution (mg L−1)
- m = Dry mass of adsorbent
Following adsorption, isotherms of Langmuir and Freundlich models were applied on the data to quantify the adsorption of Ni in the soil-BC [9].
Kl = Langmuir constant
Xm(qmax) = Maximum adsorption capacity
Kf = Freundlich constant
qe = exponential q value
c = Slope.
2.3.2. Soil pH, Moisture and Soluble Chlorides
Soil pH, moisture content and soluble chlorides (Cl−) were determined after harvesting. Soil pH was determined through Compact pH/ORP/Temperature meter (PH210) while soil moisture content was measured by gravimetric approach (for the quantitative determination of analyte based on its mass). Soluble chlorides (Cl−) concentration in the soil extract (v/w) was determined by titrating against silver nitrate. Chloride was determined by using an anion selective electrode (potentiometric) [4].
Statistical Analysis
Data was statistically analyzed under completely randomized design (CRD) with One-way ANOVA by using Microsoft Excel 2010® (Microsoft Cooperation, Redmond, WA, USA) and Statistix 8.1® (Analytical Software, Tallahassee, FL, USA) and significantly different means were separated by using the least significant difference (LSD) test [22].
3. Results
3.1. Characterization of Simple Rice Husk Biochar and Enriched (BC) Biochar
SEM images revealed the differences in structures of simple biochar and enriched biochar BC (Figure 1). The cylindrical rod-shaped structure of rice husk biochar presented empty spaces having no impregnation of minerals between strands (Figure 1A). The sample showed a little amount of adsorption on surface of different elements, whereas BC had a denatured porous structure having a high concentration of salts between layers; perhaps, due to the breakage of C-C bonds (Figure 1B).
FTIR spectra of rice husk biochar and enriched BC were presented in Figure 2. There was no major band formation that occurred in rice husk biochar from 4000 to 2500 cm−1 (Figure 2A); however, a very broad peak (3652.8 cm−1 to 2713.06 cm−1) in BC indicated that the O-H acidic functional group was formed with Fe doping on biochar (Figure 2B). Similarly, a sharp band stretching occurred at 1625.78 cm−1 in BC, which suggested the C=O functional group (Figure 2B).
These results were endorsed in XRF analysis, where rice husk biochar contained 48% Fe concentration (Figure 2C). After Fe doping and mixing with bentonite clay, an increase (88%) of Fe concentration was reported with Fe doping on the rice husk biochar surface (Figure 2D). X-ray fluorescence analysis also showed an addition of O functional groups in Fe rice husk biochar, which remained absent in simple biochar.
3.2. Biomass Accumulation and Elemental Concentration in Wheat Root and Shoot
Interestingly, shoot Ni concentration was significantly (p ≤ 0.01) increased in different Ni+NaCl treatment combinations; however, BC application showed promising results in lowering Ni uptake from root to shoot in T3 (Table 1). In T9, root Ni concentration was not detected, whereas DTPA-extractable soil Ni concentration was found to be high (Table 1). Under T3, Ni concentration was increased (37%) in the shoot as compared to combined treatments in T12.

Table 1.
Root, Shoot and Root:Shoot Ni concentrations of wheat plant grown under different treatments (T1; Control, T2; NiNO3, T3; CaCO3, T4; NaCl, T5; BC, T6; Ni + BC, T7; CaCO3 + BC, T8; NaCl + BC, T9; Ni + CaCO3 + BC, T10; Ni + NaCl + BC, T11; CaCO3 + NaCl + BC, T12; Ni + NaCl + CaCO3 + BC). DTPA-extractable Ni in soil was also presented under abovementioned treatments. Treatment means sharing different letter(s) differ significantly at p = 0.05. Data are average of three repeats per sample ± SE.
Root and shoot dry weight (RDW, SDW) were significantly (p < 0.01) influenced by the main effects (i.e., Ni, NaCl and CaCO3), first-order (i.e., Ni + NaCl, Ni + CaCO3 and CaCO3 + NaCl) and second-order interactions (i.e., Ni + NaCl + CaCO3) of applied treatments (Table 2); however, the negative impacts of combined Ni + CaCO3 + BC (T9) and Ni + NaCl + BC (T10) stresses were minimized by BC application and a significant increase (two-fold) of RDW was observed in both T9 and T10 relative to T6. Maximum (four-fold) shoot dry weight (SDW) was observed in T5 (Table 2).
Table 2.
Shoot and root dry weight (DW) and elemental concentration (Ca, Na, K, Mg and Fe) of wheat plants grown under different treatments (T1; Control, T2; NiNO3, T3; CaCO3, T4; NaCl, T5; BC, T6; Ni + BC, T7; CaCO3 + BC, T8; NaCl + BC, T9; Ni + CaCO3 + BC, T10; Ni + NaCl + BC, T11; CaCO3 + NaCl + BC, T12; Ni + NaCl + CaCO3 + BC). Treatment means sharing different letter(s) differ significantly at p = 0.05. Data are average of three repeats per sample ± SE.
Among elements, shoot Na concentration was significantly increased in those treatments where NaCl was applied alone or combined with Ni and CaCO3 stresses (Table 2). However, BC application significantly (p < 0.01) reduced Na translocation from root to shoot in T12 as there was a decrease (55%) of Na concentration observed in shoots as compared to roots under T12 (Table 2). Maximum Ca concentration was observed in shoots with a 20-fold increase in T7 as compared to T9 (Table 2). In roots, BC treatment significantly enhanced Ca concentration under T9 and T12 as compared to T1, where maximum deposition occurred in roots and a controlled amount of Ca transferred to shoots (Table 2). BC application significantly increased root and shoot Fe concentration irrespective of the stress applied among all treatments relative to biochar treatment (Table 2). In roots, maximum increase (two-fold) of Fe concentration was observed in T11, while in shoots, T9 presented the maximum value (15-fold) of Fe concentration as compared to the control.
3.3. Shoot Hydrogen Peroxide (H2O2), Melondialdehyde (MDA), Cell Membrane Permeability (CMP) and Shoot Antioxidant Enzymes
Shoot H2O2, MDA and CMP were significantly (p ≤ 0.01) influenced by the main and first-order interactions of applied treatments (Figure 3). In the T9 (Ni + CaCO3 + BC) treatment, there was an increase (two-fold) in MDA concentration as compared to T1 (Figure 3B). Similarly, a maximum increase in MDA concentration (two-fold) was reported in T11, which led to cause more damage to the cell membrane and an increase in CMP (63%) in T11, when compared to T1. BC application controlled the H2O2 contents better in those soil treatments where CO3− was not applied as a main effect or first-order interaction; however, there was a significant decrease in H2O2 contents (25%) reported in T12 as compared to T11.
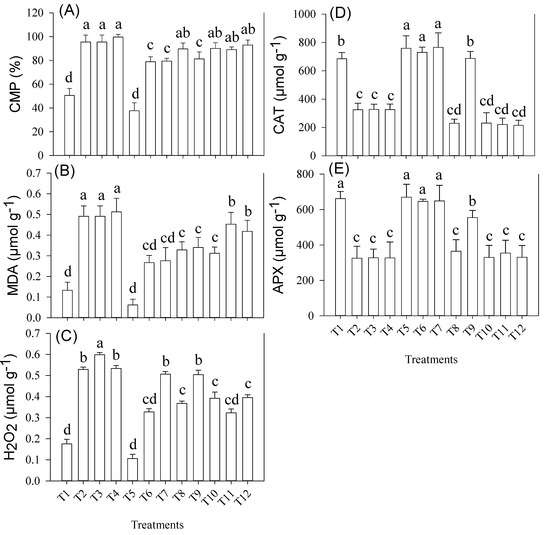
Figure 3.
(A) Cell Membrane Permeability (CMP) (B) Malondialdehyde (MDA) (C) Hydrogen peroxide (H2O2) (D) Catalase (CAT) (E) Ascorbate Peroxidase (APX) contents in shoots of wheat cultivar grown under various treatments, i.e., T1; Control, T2; NiNO3, T3; CaCO3, T4; NaCl, T5; BC, T6; Ni + BC, T7; CaCO3 + BC, T8; NaCl + BC, T9; Ni + CaCO3 + BC, T10; Ni + NaCl + BC, T11; CaCO3 + NaCl + BC, T12; Ni + NaCl + CaCO3 + BC. Treatment means sharing different letter(s) differ significantly at p = 0.05. Data are average of three repeats per sample per sample ± SE. LSD0.05 for Shoot CMP = 8.1475; Shoot MDA = 0.0904; Shoot H2O2 = 0.0361; Shoot CAT = 114.62; Shoot APX = 111.92.
Catalase (CAT) and Ascorbate peroxidase (APX) concentrations were significantly (p ≤ 0.01) influenced by contrasting stresses in alone and combined treatments (Figure 3). The combination of contrasting stresses significantly reduced the CAT and APX activities and a maximum decrease (69%) in CAT activity was found under the T12 treatment relative to control; although, BC application increased the CAT activity in T6 and T7 (three-fold) as compared to T11 treatment, respectively. Similarly, BC application alleviated the negative impacts of Ni and CaCO3 by increasing APX activity under T6 (82%) and T7 (96%), as compared to T12.
3.4. Root and Shoot Chlorophyll (a & b), Non-Enzymatic Antioxidants (Phenolics) and Protein Concentration
In all the pots where NaCl was applied, a significant reduction in chlorophyll b concentration was observed (Figure 4). In T10, the maximum reduction in chlorophyll b concentration (85%) was reported as compared to T5. However, a maximum increase in both Chl a and b concentrations was observed under the T9 (CaCO3 + Ni + BC) treatment.
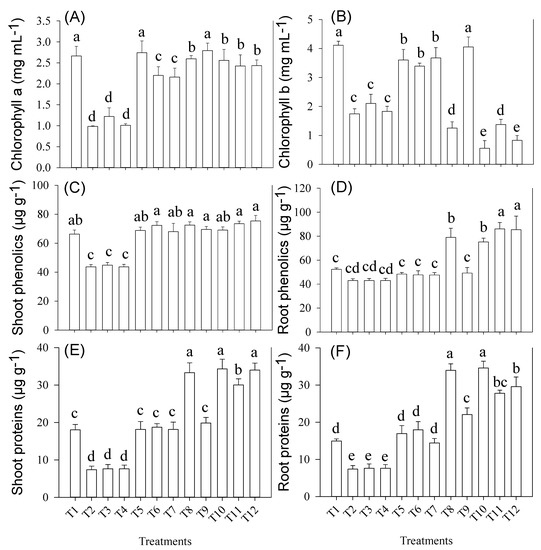
Figure 4.
(A) Chlorophyll a (B) Chlorophyll b (C) Shoot phenolics (D) Root phenolics (E) Shoot proteins and (F) Root proteins in wheat cultivar grown under various treatments, i.e., T1; Control, T2; NiNO3, T3; CaCO3, T4; NaCl, T5; BC, T6; Ni + BC, T7; CaCO3 + BC, T8; NaCl + BC, T9; Ni + CaCO3 + BC, T10; Ni + NaCl + BC, T11; CaCO3 + NaCl + BC, T12; Ni + NaCl + CaCO3 + BC. Treatment means sharing different letter(s) differ significantly at p = 0.05. Data are average of three repeats per sample ± SE. LSD0.05 for Shoot Chlorophyll a = 0.3595; Chlorophyll b = 0.4229; Shoot Phenolics = 5.3839; Root Phenolics = 9.9519; Shoot Proteins = 9.3883; Root Proteins = 4.7248.
Wheat root and shoot phenolics were significantly (p ≤ 0.01) enhanced by the combined stresses and BC treatments (Figure 4). BC application showed no impact on root phenolics when grown under main effects or first-order interaction of Ni and CaCO3 treatments, as compared to shoot phenolics. However, a maximum increase (79%) in root phenolics was observed in T12 as compared to T6. Similarly, in shoot phenolics, BC application positively impacted on main effects and first-order interactions of Ni and CaCO3 (Figure 4).
Similar to root phenolics, root and shoot proteins were significantly increased in those treatments where NaCl was applied as alone or combined stress in BC soil (Figure 4). There was an increase in root (74%) and shoot (two-fold) protein content under T12 and T10 as compared T5. Single and combined treatments of Ni and CaCO3 showed no positive influence on protein content.
3.5. Sorption Isotherms for Ni
The adsorption capacity of Ni on BC soil significantly increased in those treatments where Ni was applied (Table 3). Among both models, Langmuir was best suited to our data as it represented maximum adsorption capacity ~qmax (2433 mg g−1) for best monolayer coverage as reported in T6 [12,23]. According to Langmuir isotherm, the comparison of adsorption capacity of substrate (BC) for metal was: Ni (2433 mg g−1) > Ni + NaCl (2380 mg g−1) > Ni + Na + CaCO3 (2375 mg g−1) > Ni + CaCO3 (2304 mg g−1) (Table 3).
Table 3.
Freundlich and Langmuir data representation of wheat cultivar grown under different treatments (T1; Control, T2; NiNO3, T3; CaCO3, T4; NaCl, T5; BC, T6; Ni + BC, T7; CaCO3 + BC, T8; NaCl + BC, T9; Ni + CaCO3 + BC, T10; Ni + NaCl + BC, T11; CaCO3 + NaCl + BC, T12; Ni + NaCl + CaCO3 + BC) for Ni adsorption estimation.
4. Discussion
4.1. Enhanced Ni Adsorption on BC-Soil Interface Led to Better Wheat Growth
The Ni adsorption capacity was significantly enhanced in all those treatments where Ni was applied as a soil amendment (Table 1 and Table 3). The enhancement of Ni adsorption capacity by BC could be due to the enhanced cation exchange capacity (CEC) of soil. This result was consistent with Turan et al. [10] who reported that Fe-rich chitosan biochar increased the adsorption rate of soil Cr+6 up to 151 mg g−1. Similarly, Si-Mg-enriched corn cob biochar showed qmax values of 139.78 mg g−1 and 86.86 mg g−1 for atenolol (ATE) and lead (Pb), respectively [2]. In this study, Langmuir isotherm was best fitted for Ni adsorption on the BC-soil interface where it gets controlled by the electrostatic interactions (Table 2). The porous structure of the biochar enables complex bonding with oxygen containing hydroxyl, carbonyl, carboxyl and methoxy groups, which creates H-bonds with adsorbed molecules [23]. Equation (5) represented the constant association of energy adsorption known as Langmuir constant KL and R value indicated the favorability of the adsorption nature, where R = 1 represents a linear significant relationship, R < 1 indicates favorable, R > 1 means unfavorable and R = 0 shows irreversible relation (Table 3) [12]. Similarly, q(max) represented the maximum monolayer coverage 2433 mg g−1 and R2 value indicated the sorption data best fitted on Langmuir isotherm (Table 3; Equation (5)). Moreover, the addition of BC might increase the surface hydrophilicity, organic matter content and surface sorption capacity similar to magnesium oxide (MgO)-modified biochar composite, which adsorbs arsenic (As) and lead (Pb) in red soil [24,25].
Interestingly, the adsorption rate of Ni remained higher under contrasting stress conditions (Table 3) which might be associated with the mesoporous structures of BC (Figure 1B). These mesopores were probably formed either by the doping of metal on the biochar surface or through the activation/oxidation process of metal-biochar composites at high temperature and pressure [26,27]. The mesoporous structure of BC could also have contributed to its maximum Ni adsorption capacity [1].
The high Ni-adsorption capacity of soil in T9 caused a significant influence on Ni uptake in plants where no Ni translocation was detected in wheat shoots (Table 1). In T6, high Ni concentration was found in roots as compared to shoots (Table 1); it might be due to wheat roots exhibiting hyperaccumulation activity that prevents metal translocation to shoots due to chelation and compartmentalization for intracellular detoxification [28]. However, shoot Ni accumulation was significantly higher in T10 and T12 as compared to roots (Table 1); according to [29], nicotinamide is responsible for the hyperaccumulation of Ni in xylem sap where Na and Ca molecules also bind to chelate-free Ni ions. These plants enhance xylem loading rate by stimulating metal influx across the cell membrane and speed up the metal transport towards the shoot, where sequestration occurs in vacuoles of shoots and leaves. In this study with CaCO3 and NaCl, Ni uptake is carried through apoplast where Ca and Na competed with Ni ions’ penetration channels, binding sites and declined its uptake in roots that may cause suspended Ni transferred ions to chelate in shoot and leaf vacuoles [30].
4.2. Rice Husk Fe-Biochar Reduced the Toxicity of Soil Chlorides (Cl−) for Wheat Plants
Maximum soil chloride (Cl−) concentration (20.5 mmol L−1) was found in the NaCl + BC (T8) treatment (Table S2). In those treatments where NaCl was applied as soil stress, BC protected the plant roots from Na+ and Cl− by reducing their availability (Table S2). As Fe was present in a cationic form at the BC-soil interface, its affiliation towards anions like Cl− remained obvious. Furthermore, SEM (Figure 1B) and XRF images (Figure 2) showed the more active surface area and functional groups, respectively, which might have enhanced CEC and alleviated Na+ and Cl− uptake while enhancing K+ uptake (Tables S1 and S2; Table 2). The presence of these functional groups and aromatic rings would have made BC more suitable for the sorption of Cl− ions (Table S2) [31,32,33].
4.3. Nutrients Uptake in Wheat Plant Regulated by BC under Contrasting Abiotic Stresses
Application of BC under multiple stresses (T12) decreased Ca2+ and K+ in shoots, while increasing Na+ in roots and its translocation to shoots, as compared with the control (Table 2). A high concentration of Na+ in plant cells acts as a driving force for the outflow of K+ and Ca+2 ions through protein secondary active transport channels in plant cells [34]. In recent years, K+ efflux has also been regarded as a plant signaling mechanism under salinity or heavy metal stress [35]. Salinity and heavy metal stress induce K+ efflux in guard cells by outwardly rectifying K+ channel (GORK) pathways in stomata and the root epidermis. Under salinity stress, up-regulation of GORK channels causes excessive K+ leakage and impaired stomatal closure, thus compromise the plant’s water retaining capability [36]. In the present experiment, excessive uptake of Na+ and Ni+ might have caused membrane depolarization in the wheat plant, which is then restored either through H+ pumps or K+ efflux to balance the charge across the plasma membrane (Table 2). Nevertheless, an oxidative stress-induced increase in cytosolic K+ efflux is reported to cause programmed cell death (PCD) [37]. Furthermore, enhanced shoot Na+ and Ni+ concentration under combined stress of Ni+ and NaCl significantly reduced the uptake of Fe. The exogenous application of BC potentially induced the strategy II (release of Phyto siderophores) mechanism, enhanced root Fe uptake (75%) and its subsequent translocation to aboveground tissues that ultimately act as a cofactor of several enzymes (proteins) and helps to maintain plant growth and development under stress conditions (Table 2).
4.4. Rice Husk Fe-Enriched Biochar (BC) Maintained Biomass and Cell Membrane Stability by Triggering Antioxidant Defense System under Contrasting Abiotic Stresses
Plants being photosynthesizing organisms continuously produce reactive oxygen species (ROS) as a by-product of aerobic metabolism. Under (a)biotic stresses, intracellular ROS production causes oxidative damage to cellular constituents including cell membranes, lipids, proteins and consequently leads to cell death [38]. In this study, hydrogen peroxide (H2O2) was quantified as a marker for oxidative stress—indicating maximum H2O2 production in response to exogenously applied Ni and CaCO3 stresses (Figure 3). Overproduction of H2O2 causes the oxidation of enzymes thiol groups and stops their activity, which ultimately leads to lipids peroxidation (LPO). During LPO activity, different hydrocarbon fragments like MDA are produced, as was the case in our study (Figure 3). The reaction of MDA with thiobarbaturic acid leads to the formation of thiobarbaturic acid reactive substances [39]. Moreover, increased ROS production under stressful environments leads to the activation of ROS-sensitive ion channels such as GORK or NSCC to increase K+ efflux [40]. The possible mechanism behind ROS scavenging might be the activation of the antioxidant defense system in response to biochar and the immobilization of different pollutants like Na, Ni and excess of carbonates (Table 1 and Table S2; Figure 3) [41].
To overcome ROS-induced oxidative stress, plants produce secondary metabolites and antioxidant enzymes such as SOD, APX and CAT [38,40,42]. In the current study, CAT and APX activities were increased in individual or combined treatments (T6, T7 and T9) of Ni and CaCO3 relative to NaCl application (Figure 3); BC efficiently adsorbed the Cl− from soil (Table S2) so Na+ might enter to the plant roots causing negative impacts on CAT and APX (Table 2, Figure 3). However, wheat plants efficiently activated their non-enzymatic antioxidants (phenolics) to minimize the negative impacts of Na+ (Figure 4) [4].
In this study, Ni-treated (T6, T8, T10 and T12) wheat plants showed a decline in chlorophyll concentration where chlorophyll b expressed more sensitivity to Ni stress than chlorophyll a (Figure 4A,B). This could be due to the replacement of Mg (the main constituent of chlorophyll) by Ni. Application of BC reduced Ni toxicity by decreasing its uptake through root apoplast and binding it with complex heterocyclic groups of biochar in soil [43], thus facilitating wheat to improve its nutrient (Mg, K) uptake ratio and concentration of photosynthetic pigment (chlorophyll) (Table 2, Figure 4).
4.5. Phenolics and Protein Accumulation Mitigated Contrasting Abiotic Stresses through BC Application
Abiotic stresses act synergistically in soil and their negative effects are more obvious during plant growth; however, in our experiment, root and shoot phenolics were significantly increased in combined stress treatment (T12) relative to single stress under BC (T5) (Figure 4). BC application enhanced the Fe induction into wheat roots that enabled phenolics to chelate Na and Ni, similar to Hg and Cr, by quenching free radical reactions. Under cytosolic Na+ and Ni+ stress, phenolics act as scavenging agents due to their ability to donate H+ ions and their capability to quench 1O2 [44]. Sytar et al. (2019) [3] reported that different key enzymes such as phenylalanine ammonia-lyase (PAL) and chalcone synthase (CHS) usually activated under abiotic stresses to enhance the production of phenolic compounds; a similar trend was reported in our study where root and shoot phenolic contents increased under T12 treatment (Figure 4) [3]. For instance, in soybeans (Glycine max), flavonoid biosynthesis stimulates under salinity stress due to the up-regulation of genes, like GmFNSII-1 and GmFNSII-2, involved in flavone biosynthase synthesis [45].
Similar trends were observed in root and shoot proteins which were significantly increased under combined stress treatments (T8, T10, T11 and T12) relative to single stress (T3) in the presence of BC (Figure 4). Under single stress, high metabolic and photorespiratory activity in mitochondria might have demanded high electron input which resulted in ROS escalation and, eventually, leads to protein oxidation (Figure 4) [41]. Such oxidation events are most likely to happen in proteins that coexist near the sites of high ROS production. Reduced transition metal Fe2+ is required for the formation of hydroxyl radical (°OH) due to the high reaction rate of H2O2 with Fe2+, therefore, the metal ion is required in a controlled amount to avoid excess formulation of °OH ions. Certain metalloproteins require a metal co-factor (e.g., Fe-S) for the proper structure and functioning of the protein that is susceptible to oxidation [39]. However, under contrasting combined stresses, the antiport pathway of K+:Na+ increases K+ level in the external cell sap medium due to HKT1 (Hight affinity potassium transporters 1) protein synthesis (Figure 4). These Na+/H+ antiporter genes SOS1 (Salt overly sensitive 1) are recognized as markers for ionic and oxidative stress-responsive proteins (Cyt b6f, Glucagon-like peptide-1 (GLP)) as experienced in the present study where marker proteins might have enhanced under T7, T8 and T9 treatments relative to the control (T1) [41,46].
4.6. Economics of BC and Its Limitations
Generally, BC is considered to be an expensive organic amendment in field conditions. In the past, large (>10 t ha−1) amounts of biochar were necessary to increase crop yields, but [47] reported that N uptake increased in wheat shoots with a very low application rate of biochar (100 kg ha−1), while biochar enriched with Fe nanoparticles applied at the same rate (100 kg ha−1) even further enhanced growth and yield of wheat. It has also been observed that biochar doped with magnetic Fe resulted in a larger percentage of C functional groups for nutrient and metal adsorption [47]. In our previous studies, Fe, Zn and Si enrichment on the BC surface enhanced the plant growth and its physiology even at a lower rate of application (0.5 or 1%) under different abiotic stresses [1,32,48]. Hence, a huge amount of exchequer can be saved by using the elemental-enriched BC on a commercial scale in degraded soils.
Similarly, global adaptability towards BC depends on the type of feedstock and the technology being used for its production. Alongside, industries need to be focused on the whole life cycle analysis (LCA) of biochar including cut off costs from harvesting, storage and transportation to the field area, where net margin of producing biochar can be improvised through taking wise decisions by opting for promising processing and readily available biomass [49].
5. Conclusions
There was significant decrease in wheat shoot DW, ionic contents and antioxidant enzymes activity reported with Ni, Na and CO3 alone treatments. However, Fe enriched biochar (BC) application significantly enhanced the growth and physiological parameters irrespective of the contrasting stresses. Under contrasting stress conditions, T9 treatment (BC + Ni + CO3) showed best results in increasing shoot DW, K, Fe and chlorophyll a and b concentrations by decreasing the CMP and MDA contents. Similarly, shoot CAT and APX concentrations were increased in Ni + BC (T6) and CaCO3 + BC (T7) alone and in combined treatment BC + Ni + CO3 (T9) to maintain wheat growth. Considering the aforementioned enhancements in soil fertility status and improvements in plant nutritional and defensive mechanisms, rice husk iron-enriched biochar could be an excellent addition to the available organic amendments against contrasting abiotic stresses.
Supplementary Materials
The following supporting information can be downloaded at: https://www.mdpi.com/article/10.3390/su14137852/s1, Table S1. Physico-chemical properties of soil used in this experiment. Table S2. Post-harvest analysis of soil including moisture content (%), pH and chlorides Cl− (mmol L−1) concentration.
Author Contributions
W.-u.-D.K. conceived the idea and designed the research. W.-u.-D.K., R.S., M.N.A. and M.T. conducted the experiment and analyzed the data. M.A.F., M.N.A., F.N., Y.H. and N.S. developed the full draft and again analyzed the data. W.-u.-D.K., M.A.F., N.S. and F.N. revised and critically reviewed the manuscript. All authors have read and agreed to the published version of the manuscript.
Funding
Authors are thankful to the National Natural Science Foundation of China (U1710255) for their support. We also acknowledge support of the Punjab Agricultural Research Board (project #894) to Waqas-ud-Din Khan in providing financial support for this study.
Institutional Review Board Statement
Not applicable.
Informed Consent Statement
Not applicable.
Data Availability Statement
The data that support this study are available in the article and accompanying online Supplementary Materials.
Acknowledgments
Authors are highly thankful to Zafar Sadiq, Botanical garden, Government College University, Lahore for their support in carrying out the experiment.
Conflicts of Interest
The authors declared that there is no conflict of interest with any agency.
References
- Khan, W.U.D.; Ramzani, P.M.A.; Anjum, S.; Abbas, F.; Iqbal, M.; Yasar, A.; Ihsan, M.Z.; Anwar, M.N.; Baqar, M.; Tauqeer, H.M.; et al. Potential of miscanthus biochar to improve sandy soil health, in situ nickel immobilization in soil and nutritional quality of spinach. Chemosphere 2017, 185, 1144–1156. [Google Scholar] [CrossRef] [PubMed]
- Fu, C.; Zhang, H.; Xia, M.; Lei, W.; Wang, F. The single/co-adsorption characteristics and microscopic adsorption mechanism of biochar-montmorillonite composite adsorbent for pharmaceutical emerging organic contaminant atenolol and lead ions. Ecotoxicol. Environ. Saf. 2020, 187, 109763. [Google Scholar] [CrossRef] [PubMed]
- Sytar, O.; Kumari, P.; Yadav, S.; Brestic, M.; Rastogi, A. Phytohormone priming: Regulator for heavy metal stress in plants. J. Plant Growth Regul. 2019, 38, 739–752. [Google Scholar] [CrossRef] [Green Version]
- Jones, J.B.; Case, V.W. Sampling, handling, and analyzing plant tissue samples. Soil Test. Plant Anal. 1990, 3, 389–427. [Google Scholar]
- Abbas, T.; Rizwan, M.; Ali, S.; Adrees, M.; Zia-ur-Rehman, M.; Qayyum, M.F.; Ok, Y.S.; Murtaza, G. Effect of biochar on alleviation of cadmium toxicity in wheat (Triticum aestivum L.) grown on Cd-contaminated saline soil. Environ. Sci. Pollut. Res. 2018, 25, 25668–25680. [Google Scholar] [CrossRef]
- Parvin, K.; Nahar, K.; Hasanuzzaman, M.; Bhuyan, M.B.; Fujita, M. Calcium-mediated growth regulation and abiotic stress tolerance in plants. In Plant Abiotic Stress Tolerance; Springer: Cham, Switzerland, 2019; pp. 291–331. [Google Scholar]
- Xu, G.; Zhang, Y.; Sun, J.; Shao, H. Negative interactive effects between biochar and phosphorus fertilization on phosphorus availability and plant yield in saline sodic soil. Sci. Total Environ. 2016, 568, 910–915. [Google Scholar] [CrossRef]
- Hagemann, N.; Joseph, S.; Schmidt, H.P.; Kammann, C.I.; Harter, J.; Borch, T.; Young, R.B.; Varga, A.; Taherymoosavi, S.; Elliott, K.W.; et al. Organic coating on biochar explains its nutrient retention and stimulation of soil fertility. Nat. Commun. 2017, 8, 1089. [Google Scholar] [CrossRef]
- Wang, S.; Kong, L.; Long, J.; Su, M.; Diao, Z.; Chang, X.; Chen, D.; Song, G.; Shih, K. Adsorption of phosphorus by calcium-flour biochar: Isotherm, kinetic and transformation studies. Chemosphere 2018, 195, 666–672. [Google Scholar] [CrossRef]
- Turan, V.; Ramzani, P.M.A.; Ali, Q.; Abbas, F.; Iqbal, M.; Irum, A.; Khan, W.U.D. Alleviation of nickel toxicity and an improvement in zinc bioavailability in sunflower seed with chitosan and biochar application in pH adjusted nickel contaminated soil. Arch. Agron. Soil Sci. 2018, 64, 1053–1067. [Google Scholar] [CrossRef]
- Ahmad, M.; Ahmad, M.; Usman, A.R.A.; Al-Faraj, A.S.; Abduljabbar, A.S.; Al-Wabel, M.I. Biochar composites with nano zerovalent iron and eggshell powder for nitrate removal from aqueous solution with coexisting chloride ions. Environ. Sci. Pollut. Res. 2018, 25, 25757–25771. [Google Scholar] [CrossRef]
- Liu, W.; Zhang, J.; Zhang, C.; Ren, L. Preparation and evaluation of activated carbon-based iron-containing adsorbents for enhanced Cr (VI) removal: Mechanism study. Chem. Eng. Sci. 2012, 189, 295–302. [Google Scholar] [CrossRef]
- Dad, F.P.; Khan, W.U.D.; Tanveer, M.; Ramzani, P.M.A.; Shaukat, R.; Muktadir, A. Influence of Iron-Enriched Biochar on Cd Sorption, Its Ionic Concentration and Redox Regulation of Radish under cadmium toxicity. Agriculture 2020, 11, 1. [Google Scholar] [CrossRef]
- Abid, N.; Maqbool, A.; Malik, K.A. Screening commercial wheat (Triticum aestivum L.) varieties for Agrobacterium mediated transformation ability. Pak. J. Agric. Sci. 2014, 51, 83–89. [Google Scholar]
- Velikova, V.; Yordanov, I.; Edreva, A. Oxidative stress and some antioxidant systems in acid rain-treated bean plants: Protective role of exogenous polyamines. Plant Sci. 2000, 151, 59–66. [Google Scholar] [CrossRef]
- Estefan, G.; Sommer, R.; Ryan, J. Methods of soil, plant, and water analysis: A manual for the West Asia and North Africa region. Int. Cent. Agric. Res. Dry Areas (ICARDA) 2013, 3, 55–119. [Google Scholar]
- Singleton, V.L.; Orthofer, R.; Lamuela-Raventós, R.M. Analysis of total phenols and other oxidation substrates and antioxidants by means of folin-ciocalteu reagent. In Methods in Enzymology; Academic Press: Cambridge, MA, USA, 1999; Volume 299, pp. 152–178. [Google Scholar]
- Bradford, M.M. A rapid and sensitive method for the quantitation of microgram quantities of protein utilizing the principle of protein-dye binding. Anal. Biochem. 1976, 72, 248–254. [Google Scholar] [CrossRef]
- Nakano, Y.; Asada, K. Hydrogen peroxide is scavenged by ascorbate-specific peroxidase in spinach chloroplasts. Plant Cell Physiol. 1982, 22, 867–880. [Google Scholar]
- Cakmak, I.; Horst, W.J. Effect of aluminum on lipid peroxidation, superoxide dismutase, catalase, and peroxidase activities in root tips of soybean (Glycine max). Physiol. Plant. 1991, 83, 463–468. [Google Scholar] [CrossRef]
- Strain, H.H.; Svec, W.A. Extraction, separation, estimation, and isolation of the chlorophylls. In The Chlorophylls; Academic Press: Cambridge, MA, USA, 1966; pp. 21–66. [Google Scholar]
- Williams, L.J.; Abdi, H. Fisher’s least significant difference (LSD) test. In Encyclopedia of Research Design; Sage: Newcastle upon Tyne, UK, 2010; Volume 218, pp. 840–853. [Google Scholar]
- Dada, A.O.; Ojediran, J.O.; Olalekan, A.P. Sorption of Pb2+ from aqueous solution unto modified rice husk: Isotherms studies. Adv. Phys. Chem. 2013, 2013, 842425. [Google Scholar] [CrossRef] [Green Version]
- Yadav, M.K.; Gupta, A.K.; Ghosal, P.S.; Mukherjee, A. pH mediated facile preparation of hydrotalcite based adsorbent for enhanced arsenite and arsenate removal: Insights on physicochemical properties and adsorption mechanism. J. Mol. Liq. 2017, 240, 240–252. [Google Scholar] [CrossRef]
- Diao, Z.H.; Du, J.J.; Jiang, D.; Kong, L.J.; Huo, W.Y.; Liu, C.M.; Wu, Q.H.; Xu, X.R. Insights into the simultaneous removal of Cr6+ and Pb2+ by a novel sewage sludge-derived biochar immobilized nanoscale zero valent iron: Coexistence effect and mechanism. Sci. Total Environ. 2018, 642, 505–515. [Google Scholar] [CrossRef] [PubMed]
- Dieguez-Alonso, A.; Funke, A.; Anca-Couce, A.; Rombolà, A.G.; Ojeda, G.; Bachmann, J.; Behrendt, F. Towards biochar and hydrochar engineering—Influence of process conditions on surface physical and chemical properties, thermal stability, nutrient availability, toxicity and wettability. Energies 2018, 11, 496. [Google Scholar] [CrossRef] [Green Version]
- He, L.; Zhong, H.; Liu, G.; Dai, Z.; Brookes, P.C.; Xu, J. Remediation of heavy metal contaminated soils by biochar: Mechanisms, potential risks and applications in China. Environ. Pollut. 2019, 252, 846–855. [Google Scholar] [CrossRef] [PubMed]
- Pianelli, K.; Mari, S.; Marquès, L.; Lebrun, M.; Czernic, P. Nicotianamine over-accumulation confers resistance to nickel in Arabidopsis thaliana. Transgenic Res. 2005, 14, 739–748. [Google Scholar] [CrossRef]
- Callahan, D.L.; Kolev, S.D.; O’Hair, R.A.; Salt, D.E.; Baker, A.J. Relationships of nicotianamine and other amino acids with nickel, zinc and iron in Thlaspi hyperaccumulators. New Phytol. 2007, 176, 836–848. [Google Scholar] [CrossRef] [PubMed]
- Seregin, I.V.; Kozhevnikova, A.D. Enhancement of nickel and lead accumulation and their toxic growth-inhibitory effects on amaranth seedlings in the presence of calcium. Russ. J. Plant Physiol. 2009, 56, 80–84. [Google Scholar] [CrossRef]
- Rajapaksha, A.U.; Chen, S.S.; Tsang, D.C.; Zhang, M.; Vithanage, M.; Mandal, S.; Gao, B.; Bolan, N.S.; Ok, Y.S. Engineered/designer biochar for contaminant removal/immobilization from soil and water: Potential and implication of biochar modification. Chemosphere 2016, 148, 276–291. [Google Scholar] [CrossRef]
- Jia, R.; Li, L.; Qu, D.; Mi, N. Enhanced iron (III) reduction following amendment of paddy soils with biochar and glucose modified biochar. Environ. Sci. Pollut. Res. 2018, 25, 91–103. [Google Scholar] [CrossRef]
- Jiang, S.F.; Ling, L.L.; Chen, W.J.; Liu, W.J.; Li, D.C.; Jiang, H. Highly efficient removal of bisphenol A in a peroxymonosulfate/iron functionalized biochar system: Mechanistic elucidation and quantification of the contributors. J. Chem. Eng. Technol. 2019, 359, 572–583. [Google Scholar] [CrossRef]
- Holland, J.E.; Cammarano, D.; Fitzgerald, G.J.; Perry, E.M.; Poile, G.; Conyers, M.K. Proximal fluorescence sensing of potassium responsive crops to develop improved predictions of biomass, yield and grain quality of wheat and barley. Precis. Agric. 2019, 20, 379–397. [Google Scholar] [CrossRef]
- Shabala, L.; Zhang, J.; Pottosin, I.; Bose, J.; Zhu, M.; Fuglsang, A.T.; Velarde-Buendia, A.; Massart, A.; Hill, C.B.; Roessner, U.; et al. Cell-type-specific H+-ATPase activity in root tissues enables K+ retention and mediates acclimation of barley (Hordeum vulgare) to salinity stress. Plant Physiol. 2016, 172, 2445–2458. [Google Scholar] [CrossRef] [PubMed] [Green Version]
- Chakraborty, K.; Bose, J.; Shabala, L.; Shabala, S. Difference in root K+ retention ability and reduced sensitivity of K+-permeable channels to reactive oxygen species confer differential salt tolerance in three Brassica species. J. Exp. Bot. 2016, 67, 4611–4625. [Google Scholar] [CrossRef] [PubMed] [Green Version]
- Shabala, S. Signaling by potassium: Another second messenger to add to the list? J. Exp. Bot. 2017, 68, 4003–4007. [Google Scholar] [CrossRef] [Green Version]
- Shah, A.N.; Tanveer, M.; Abbas, A.; Fahad, S.; Baloch, M.S.; Ahmad, M.I.; Saud, S.; Song, Y. Targeting salt stress coping mechanisms for stress tolerance in Brassica: A research perspective. Plant Physiol. Biochem. 2021, 158, 53–64. [Google Scholar] [CrossRef] [PubMed]
- Nazir, F.; Hussain, A.; Fariduddin, Q. Interactive role of epibrassinolide and hydrogen peroxide in regulating stomatal physiology, root morphology, photosynthetic and growth traits in Solanum lycopersicum L. under nickel stress. Environ. Exp. Bot. 2019, 162, 479–495. [Google Scholar] [CrossRef]
- Shahzad, B.; Rehman, A.; Tanveer, M.; Wang, L.; Park, S.K.; Ali, A. Salt Stress in Brassica: Effects, Tolerance Mechanisms, and Management. J. Plant Growth Regul. 2022, 41, 781–795. [Google Scholar] [CrossRef]
- Abd-Allah, E.F.; Hashem, A.; Alam, P.; Ahmad, P. Silicon alleviates nickel-induced oxidative stress by regulating antioxidant defense and glyoxalase systems in mustard plants. J. Plant Growth Regul. 2019, 38, 1260–1273. [Google Scholar] [CrossRef]
- Khan, M.T.; Ahmed, S.; Shah, A.A.; Noor Shah, A.; Tanveer, M.; El-Sheikh, M.A.; Siddiqui, M.H. Influence of Zinc Oxide Nanoparticles to Regulate the Antioxidants Enzymes, Some Osmolytes and Agronomic Attributes in Coriandrum sativum L. Grown under Water Stress. Agronomy 2021, 11, 2004. [Google Scholar] [CrossRef]
- El-Naggar, A.; Lee, S.S.; Rinklebe, J.; Farooq, M.; Song, H.; Sarmah, A.K.; Zimmerman, A.R.; Ahmad, M.; Shaheen, S.M.; Ok, Y.S. Biochar application to low fertility soils: A review of current status, and future prospects. Geoderma 2019, 337, 536–554. [Google Scholar] [CrossRef]
- Pathak, K.; Kataria, S.; Gadre, R. Trending Methods to Enhance Antioxidant Activities in Wheat. In Wheat Production in Changing Environments; Springer: Singapore, 2019; pp. 241–260. [Google Scholar]
- Sharma, S.; Chandra, S.; Kumar, A.; Bindraban, P.; Saxena, A.K.; Pande, V.; Pandey, R. Foliar application of iron fortified bacteriosiderophore improves growth and grain Fe concentration in wheat and soybean. Indian J. Microbiol. 2019, 59, 344–350. [Google Scholar] [CrossRef]
- Almeida, D.M.; Oliveira, M.M.; Saibo, N.J. Regulation of Na+ and K+ homeostasis in plants: Towards improved salt stress tolerance in crop plants. Genet. Mol. Biol. 2017, 40, 326–345. [Google Scholar] [CrossRef] [PubMed] [Green Version]
- Joseph, S.; Anawar, H.M.; Storer, P.; Blackwell, P.; Chee, C.; Yun, L.; Munroe, P.; Donne, S.; Horvat, J.; Wang, J.; et al. Effects of enriched biochars containing magnetic iron nanoparticles on mycorrhizal colonisation, plant growth, nutrient uptake and soil quality improvement. Pedosphere 2015, 25, 749–760. [Google Scholar] [CrossRef]
- Taqdees, Z.; Khan, J.; Khan, W.U.D.; Kausar, S.; Afzaal, M.; Akhtar, I. Silicon and zinc nanoparticles-enriched miscanthus biochar enhanced seed germination, antioxidant defense system, and nutrient status of radish under NaCl stress. Crop Pasture Sci. 2022, 73, 556–572. [Google Scholar] [CrossRef]
- Oni, B.A.; Oziegbe, O.; Olawole, O.O. Significance of biochar application to the environment and economy. Ann. Agric. Sci. 2019, 64, 222–236. [Google Scholar] [CrossRef]
Publisher’s Note: MDPI stays neutral with regard to jurisdictional claims in published maps and institutional affiliations. |
© 2022 by the authors. Licensee MDPI, Basel, Switzerland. This article is an open access article distributed under the terms and conditions of the Creative Commons Attribution (CC BY) license (https://creativecommons.org/licenses/by/4.0/).