Article

Towards Circulating and Ecological Sphere in Urban Areas: An Indicator-Based Framework for Food-Energy-Water Security Assessment in Nagpur, India

1
Department of Architecture and Planning, Visvesvaraya National Institute of Technology (VNIT), Nagpur 440010, India
2
Graduate School of Media and Governance, Keio University, Kanagawa Prefecture, Minato City 252-0882, Japan
3
Integrated Sustainability Center, Institute for Global Environmental Strategies (IGES), 2108-11 Kamiyamaguchi, Hayama, Kanagawa Prefecture, Minato City 240-0115, Japan
4
Department of Atmospheric Science, School of Earth Sciences, Central University of Rajasthan, NH-8, Bandarsindri, Ajmer 305817, India
5
Department of Agroforestry and Environment, Bangabandhu Sheikh Mujibur Rahman Agricultural University, Gazipur 1706, Bangladesh
*
Authors to whom correspondence should be addressed.
Sustainability 2022, 14(13), 8123; https://doi.org/10.3390/su14138123
Submission received: 18 May 2022 / Revised: 22 June 2022 / Accepted: 1 July 2022 / Published: 3 July 2022

Abstract

:
The world’s urban population is expected to nearly double by 2050, making urbanization one of the most disruptive developments of the 21st century. On a global-to-local scale, ensuring a secure and reliable supply of food energy and water (FEW) resources for all humans is a major challenge in such a scenario. While much attention has recently been focused on the concept of FEW security and the interactions between the three sectors, there is no universally acceptable framing of the concept due to the fact that latest studies are mainly focused on individual FEW sectors, with not much investigation into how they interact. This research aims to create a localized framework based on the principles of the emerging concept of the Circulating Ecological Sphere (CES), introduced by the government of Japan, for a limited number of security indicators and dimensions. It began with a thorough study of the relevant literature using the PRISMA method, identification of gaps in local indicators for urban areas in each of the existing frameworks, and the proposal of a new indicator framework that tackles collective FEW security in urban environments is made accordingly. The authors have applied a special mechanism for filtration of this literature dataset in the context of Nagpur City in accordance with data availability and case study context. To test the applicability of the indicator set, it has been applied to the specific case of Nagpur. Both online and offline surveys were conducted to collect data, and subsequently a weighted mean method was adopted to analyze the data and derive values for the indicator set.

1. Introduction

Food, energy, and water (collectively referred to as ‘FEW’ hereafter) resources are essential for the survival and advancement of human societies. Furthermore, they are also intricately linked in the form of a nexus. Water is used to produce both food and energy; energy is utilized to pump, purify, and distribute water, as well as to manufacture, harvest, store, transport, and cook food; and crops and food waste are increasingly being used as an energy source. Failure to effectively manage the resources in any of these FEW sectors can therefore lead to serious inefficiencies in FEW resource management. In recent years, there has also been a growing body of literature highlighting the close interlinkages and trade-offs between the three FEW sectors [1,2,3,4]. Several notable global agencies including, the World Economic Forum, World Water Forum, the Bonn 2011 Nexus Conference, and the World Water Week 2012, have called for an integrated approach to FEW security [3]. This concept highlights inextricable interactions between the three sectors [5]. A safe and dependable FEW system is one in which everyone has consistent access to clean water, energy, and healthy food [6].
There are also concerns about security in terms of the FEW nexus. Food security is defined as having consistent physical, social, and economic access to sufficient, safe, and nutritious food that fits dietary needs and food choices in order to live a healthy and active life. Access to reliable and affordable energy for cooking, heating, lighting, communications, and productive uses is referred to as energy security. Water security refers to the availability and accessibility of adequate and high-quality water for human and environmental usage [7]. Although the FEW security concept has gained considerable attention in recent times, there is no universally acceptable framing of the concept [8]. In parallel the emerging concept of a Circulating and Ecological Sphere (CES—previously known as RCES) is also being promoted by the government of Japan, resonating with the notion of FEW security. CES depicts a self-sufficient and decentralized society that utilizes and circulates regional resources, complementing and supplementing other regions based on its specific qualities, and that ensures sustainable, equitable, and efficient resource consumption in both urban and rural locations [9].
The shortage of FEW resources frequently accentuates conflicts and political instability, and threatens livelihoods worldwide [5]. Providing a secure and resilient supply of these resources to all humans is therefore a major challenge on a broad global-to-local scale [10]. As a backdrop to rapid urbanization trends and changing population dynamics, a shift of focus from global to local scale is therefore required to ensure FEW security and sustainable development. Urban areas are also increasingly being placed at the center of FEW nexus discussions due to the growing concentration of population and economic activities [11].
Today, ensuring FEW resource security is seen by many as an urgent problem that could threaten the lives of the urban population, if not effectively addressed. The world’s urban population is predicted to nearly double by 2050, making urbanization one of the most disruptive developments of the 21st century [12]. Cities are increasingly concentrating populations, economic activities, social and cultural interactions, as well as environmental and humanitarian impacts, posing massive sustainability challenges in housing, infrastructure, basic services, food security, health, education, decent jobs, safety, and natural resources, to name a few [12]. The majority of the world’s population is living in urban areas, and the share of the world’s population living in urban areas is expected to increase from 55 percent in 2018 to 60 percent in 2030 [13]. Urban communities are sensitive and vulnerable to adverse climate conditions, and therefore FEW infrastructure systems are essential for contributing towards and maintaining the well-being of households [14].
Higher and more volatile energy and food prices have pushed natural resources to the forefront of the world agenda in recent years, while water scarcity has become a rising danger to industry, agriculture, and energy production. According to one prediction, global food, water, and energy demand will increase by 35, 40, and 50%, respectively, by 2030 [15]. Simultaneously, climate change will deteriorate the prospects for availability of these vital commodities [15].
Particularly for large developing countries like India with high population density, FEW nexus thinking is increasingly important, as such countries are highly water-stressed [16]. India is one of the world’s largest irrigators [17] and irrigation accounts for the majority of the world’s fresh water consumption. India is already struggling to fulfill domestic energy, food, and water demands, with 14% of the population living without electricity and roughly a third of the population cooking with conventional biofuels [18]. India has very little spare land or water, and it is one of the world’s most vulnerable countries to climate change’s effects. These problems will worsen in the coming decades [15]. Nagpur City, which is situated in the center of India, experiences all types of extreme weather conditions. Furthermore, the effect of urbanization and climate change are converging in threatening ways for the city [19].
In light of this challenge, it is essential to have a guiding framework when envisioning interventions in decaying communities from a sustainable standpoint that helps to coordinate existing policies while also exploring new possibilities based on local conditions. One such idea along these lines is based on the recent concept of CES. This research has been done with a good understanding of the concept of CES and focuses on analyzing urban areas in the context of a FEW nexus by following certain principles of CES. This study looks at the specific case of Nagpur City, in order to explore the relevance and application of the CES approach at a local level in terms of FEW security.
Urban areas largely rely on their surroundings for resource supply. The need for these resources depends on the components of urban systems. One major challenge is minimizing the use of these resources and developing a circular model [20]. Thus, the focus of this study is to develop a framework which can allow cities to assess their FEW security scenarios based on the CES concept. While existing studies on FEW security emphasize understanding and managing the interactions between the FEW sectors [5], most of them are focused on individual FEW sectors, with not much investigation into how they interact. The literature shows integrated studies of FEW security are limited on a global or regional scale. Study trends at the local level suggest that FEW resources are generally examined independently. There is only a small amount of research that focuses on how they are linked from a security viewpoint. These trends indicate a gap in the availability of urban level/local level indicators in all sectors, indicating the unique aspect of this study. Urban households consume considerable quantities of FEW resources to meet daily demand. A household is a unit of demand and it can also be the most appropriate unit for influencing consumption practices. A high portion of FEW consumption in cities can be attributed to household use [21]. Hence, the study focuses mainly on indicators that denote the situation at the household level.
To sustain FEW resources in the long term, and to promote human well-being and economic growth, there is a genuine need to address these underlying issues in an integrated manner [22]. Aiming to bridge this research gap, this study, together with the CES concept, works to systematically analyze the FEW security indicators and apply the indicator set at an urban scale. The three key objectives of this research are: (1) to review the existing indicators in FEW security domains; (2) to contextualize the existing indicators for the specific case of Nagpur City in India, and (3) to suggest a feasible framework for assessment of FEW security in Nagpur and test its applicability.
The remainder of the paper is structured as follows. Section 2 provides a brief overview of the FEW nexus with underlying security concerns for the specific case of Nagpur and the relevance of the indicator framework, identifying a gap in the research. Section 3 introduces the case study of Nagpur and briefly explains the FEW scenarios in the city. The research methodology is explained in Section 4. In Section 5, the urban level indicator framework is developed and applied to Nagpur City followed by a discussion of the results. Finally, in Section 6, FEW security for Nagpur is discussed and the key conclusions are made underlining the research limitations for the study.

2. Theoretical Background

This section provides an understanding of existing literature in the FEW domains. The Section is divided into three subsections. The first discusses the growing concerns in the domain of FEW security and the nexus-based challenges. In the second sub-section, the concept of CES is discussed in the context of the FEW nexus. The last section is about the relevance of an indicator framework for FEW security.

2.1. FEW Nexus and FEW Security Concerns

The multi-faceted challenges faced by human societies today, such as climate change, population growth, and urbanization, are simultaneously threatening the security of FEW resources at an accelerating rate [23]. These stressors combined with an ever-increasing demand for FEW resources are likely to further accelerate climate change and many other socio-economic issues [22] unless major policy reforms are implemented toward effective resource management. Specifically, the population in water-stressed countries is predicted to increase to four billion people by 2050 [24].
These complexities of interactions necessitate a comprehensive and in-depth understanding of the dynamics of global trends in urbanization [25] and its influence on natural resources. FEW systems are facing several threats to these propositions [26] and the unprecedented surge in urbanization and population growth rates is generating multiple impacts, affecting FEW demands. Sustainable natural resource management, in that regard, is crucial to ensure FEW security for a growing population, which could be conflicting while limited to a sectoral approach [5]. In the course of constructing a literature study, the authors arrived at several nexus-based indicators, that are expected to impact these resources for the specific case of Nagpur City. The indicators are discussed as follows:

2.1.1. Temperature

Climate change tends to increase existing and future risks associated with the management of resources [27]. The increase in average temperatures and rising demand for buildings with a more comfortable indoor environment lead to an increase in building energy consumption [28]. The impacts of climate change, which are driven by rising temperatures and changes in precipitation patterns, are expected to exacerbate the tension between the availability of and demand for resources. Rising average annual temperatures and precipitation can be considered the most significant climate change impacts for Nagpur City based on climate and geographical data. With increasing tendency, the average yearly temperature over the last two decades has been higher than the 50-year mean. The number of extreme heat events per year is also increasing, with 8 out of 10 years in the recent decade (2000–2019) indicating an above-average anomaly. In addition, based on seasonal statistics, the monsoon has seen a 16.4% rise in the occurrence of high temperatures between 2010 and 2019 [29].

2.1.2. Precipitation and Rainfall

Precipitation is one of the most critical indicators. The change in frequency and intensity of rainfall is often studied to understand the extent and magnitude of climate change, as rainfall has one of the most significant impacts on agriculture and food security. This is especially true for India, as the country’s agriculture and, in turn, its economy is very dependent on seasonal rainfall. Thus the differences in global average temperatures and precipitation patterns (climate variability) have immense potential to affect agriculture in India. Therefore, it is important to examine and understand the spatio-temporal dynamics of this indicator to provide credible inputs to policymakers. Moreover, it is crucial to understand the changes in the precipitation pattern for Nagpur to understand the impact of climate change. The annual rainfall pattern over Nagpur has not changed significantly over the last 50 years. However, the seasonal distribution of rainfall demonstrates significant pattern changes that could have a negative impact on agriculture [29].

2.1.3. Urbanization and Population Growth

Due to encroachment and stress on existing natural resources, agricultural lands adjacent to cities face the brunt of this expansion. As a result, monitoring and controlling city expansion can help to sustainably manage resources. The availability of water changes as cities expand onto productive agricultural land. As a result, it is critical to keep an eye on this sprawl in order to spot places that are being overburdened by growth and make informed land-use decisions. The periphery of Nagpur has grown significantly representing a nearly 71% rise in all directions of the city. This growth was most noticeable along the Wardha, Bhandara, and Amravati highways. The eastern, northern, and southern segments of the city’s periphery were dominated by agricultural regions that produced just one or two crops per year. Megaprojects like the Multimodal International Hub Airport at Nagpur (MIHAN) and the International Airport fueled urban growth in the city’s eastern and southern outskirts. The area covered by scrubland (land dominated by bushes) decreased significantly, from 16.4% in 1991 to 5.5% in 2012. Scrublands are now restricted to the city’s southern and northern reaches. Areas under double cropping and degraded scrublands were converted into residential or industrial areas during the urbanization process. The urban sprawl in Nagpur is due to inward migration to the city from villages, by people looking for better education, employment, recreation, and living standards [30].

2.2. Concept of Circulating and Ecological Sphere (CES)

The goal of CES is to create “a self-reliant and decentralized society where different resources are circulated within each region, leading to symbiosis and exchange with neighboring regions according to the unique characteristics of each region to re-discover regional resources and make optimum use of them in a sustainable manner” [31]. In line with recent global policy agreements such as the Sustainable Development Goals (SDGs) and the Paris Agreement, Japan’s Ministry of the Environment introduced the concept of CES in its fifth Basic Environment Plan. The notion is rapidly being advocated as a foundation for future environmental policy in Japan and across the world [32]. The Government of Japan had previously developed the idea of a Regional Circular Sphere and adopted the 3R (reduce, reuse, and recycle) material recycling principles to build a sound material-cycle society in the second Basic Environment Plan. Notably, Japan’s National Biodiversity Strategy (2012–2020) laid the foundation for creating a society that is in tune with nature [9].
It is primarily a policy approach that integrates three recognized principles: (1) a low-carbon society, (2) resource circulation, and (3) living in harmony with nature [33]. The CES reimagines the spatial dimension of human activities in order to maximize their range of activity, and to loudly promote a self-sufficient and decentralized society [34]. Furthermore, this approach could be implemented at all scales ranging from a community or municipal scale to a river basin or country scale. It begins at the local level, encouraging communities to examine their own potential to live in harmony with the environment by decreasing waste, producing renewable energy, and utilizing ecosystem services without harming them. It then scales up to create new value chains that complement local resources while organically connecting communities and regions to support one another. Finally, this new viewpoint optimizes the scale at which various human activities occur, reducing their environmental effect.
The idea of a Circulating and Ecological Economy (CEE) provides a theoretical foundation for the CES approach. Recycling, limiting resource use, and creating renewable energy sources are key to the ideals of a circular economy and low-carbon society. A circular economy focuses on “closing the loop”, where the value of a resource is circulated as long as feasible and waste is minimized, if not eliminated [35]. It also emphasizes the utilization of renewable resources to accomplish the low-carbon society’s supporting concept. A “low-carbon society” promotes low greenhouse gas emissions through converting to energy-efficient and low-carbon sources, as well as changing consumption patterns [36]. Overall, through using underused resources, both of these concepts contribute to the idea of resilient societies and rejuvenation. The third principle of CES as mentioned above focuses on a “society living in harmony with nature”, which prioritizes economic recovery while safeguarding natural resources.
The CES idea emphasizes the importance of local renewable energy generation and decarbonization, as well as the investigation of innovative solutions to environmental concerns through stakeholder partnerships. CES may thus be viewed as a broad concept aimed at using circularity concepts in a collaborative manner that maximizes local strengths and resources in order to build resilience [37]. Hence, to ensure the successful implementation of this concept, research must be done on the creation of indicators and assessment methods that will measure and quantify progress, as well as identify the characteristics of Nagpur City that can be used to enhance sustainability and resilience.

2.3. Relevance of Indicator Framework in FEW Nexus

Indicators are measurable and they help to determine whether objectives have been achieved [38]. An indicator framework is an organized way to view data from different sources. It is a simple and concise way to present gathered data and help show the relevance and connection between different indicators. In a framework, data can be grouped or categorized and are often shown alongside detailed descriptions of associated measures and methods of calculation [39]. Systematically building a framework of indicators can help us to find gaps in the existing information [40]. Following this, as discussed on the interlinked nature of the FEW resources in previous sections, the authors have attempted to develop an indicator framework for urban FEW security to understand these sectors on the same platform in a quantitative way.
On similar lines, a review of recent studies from 2011 onwards (as summarized in Table 1) shows that significant research has been conducted in the domain of FEW security. However, there were very few integrated studies on FEW security at a global or regional scale [5,41,42,43,44]. On the other hand, the research trends at the local level reveal that FEW resources are being largely analyzed and addressed independently [24,45,46,47,48,49,50,51,52]. Amongst these, a very limited number of studies have focused on an interconnected security perspective. Most of the previous studies have analyzed FEW systems independently or examined two of the three FEW systems at a time [53]. These trends show that there is a gap in availability of urban level/local level indicators in all sectors as evident from Table 1

3. Case Study Context
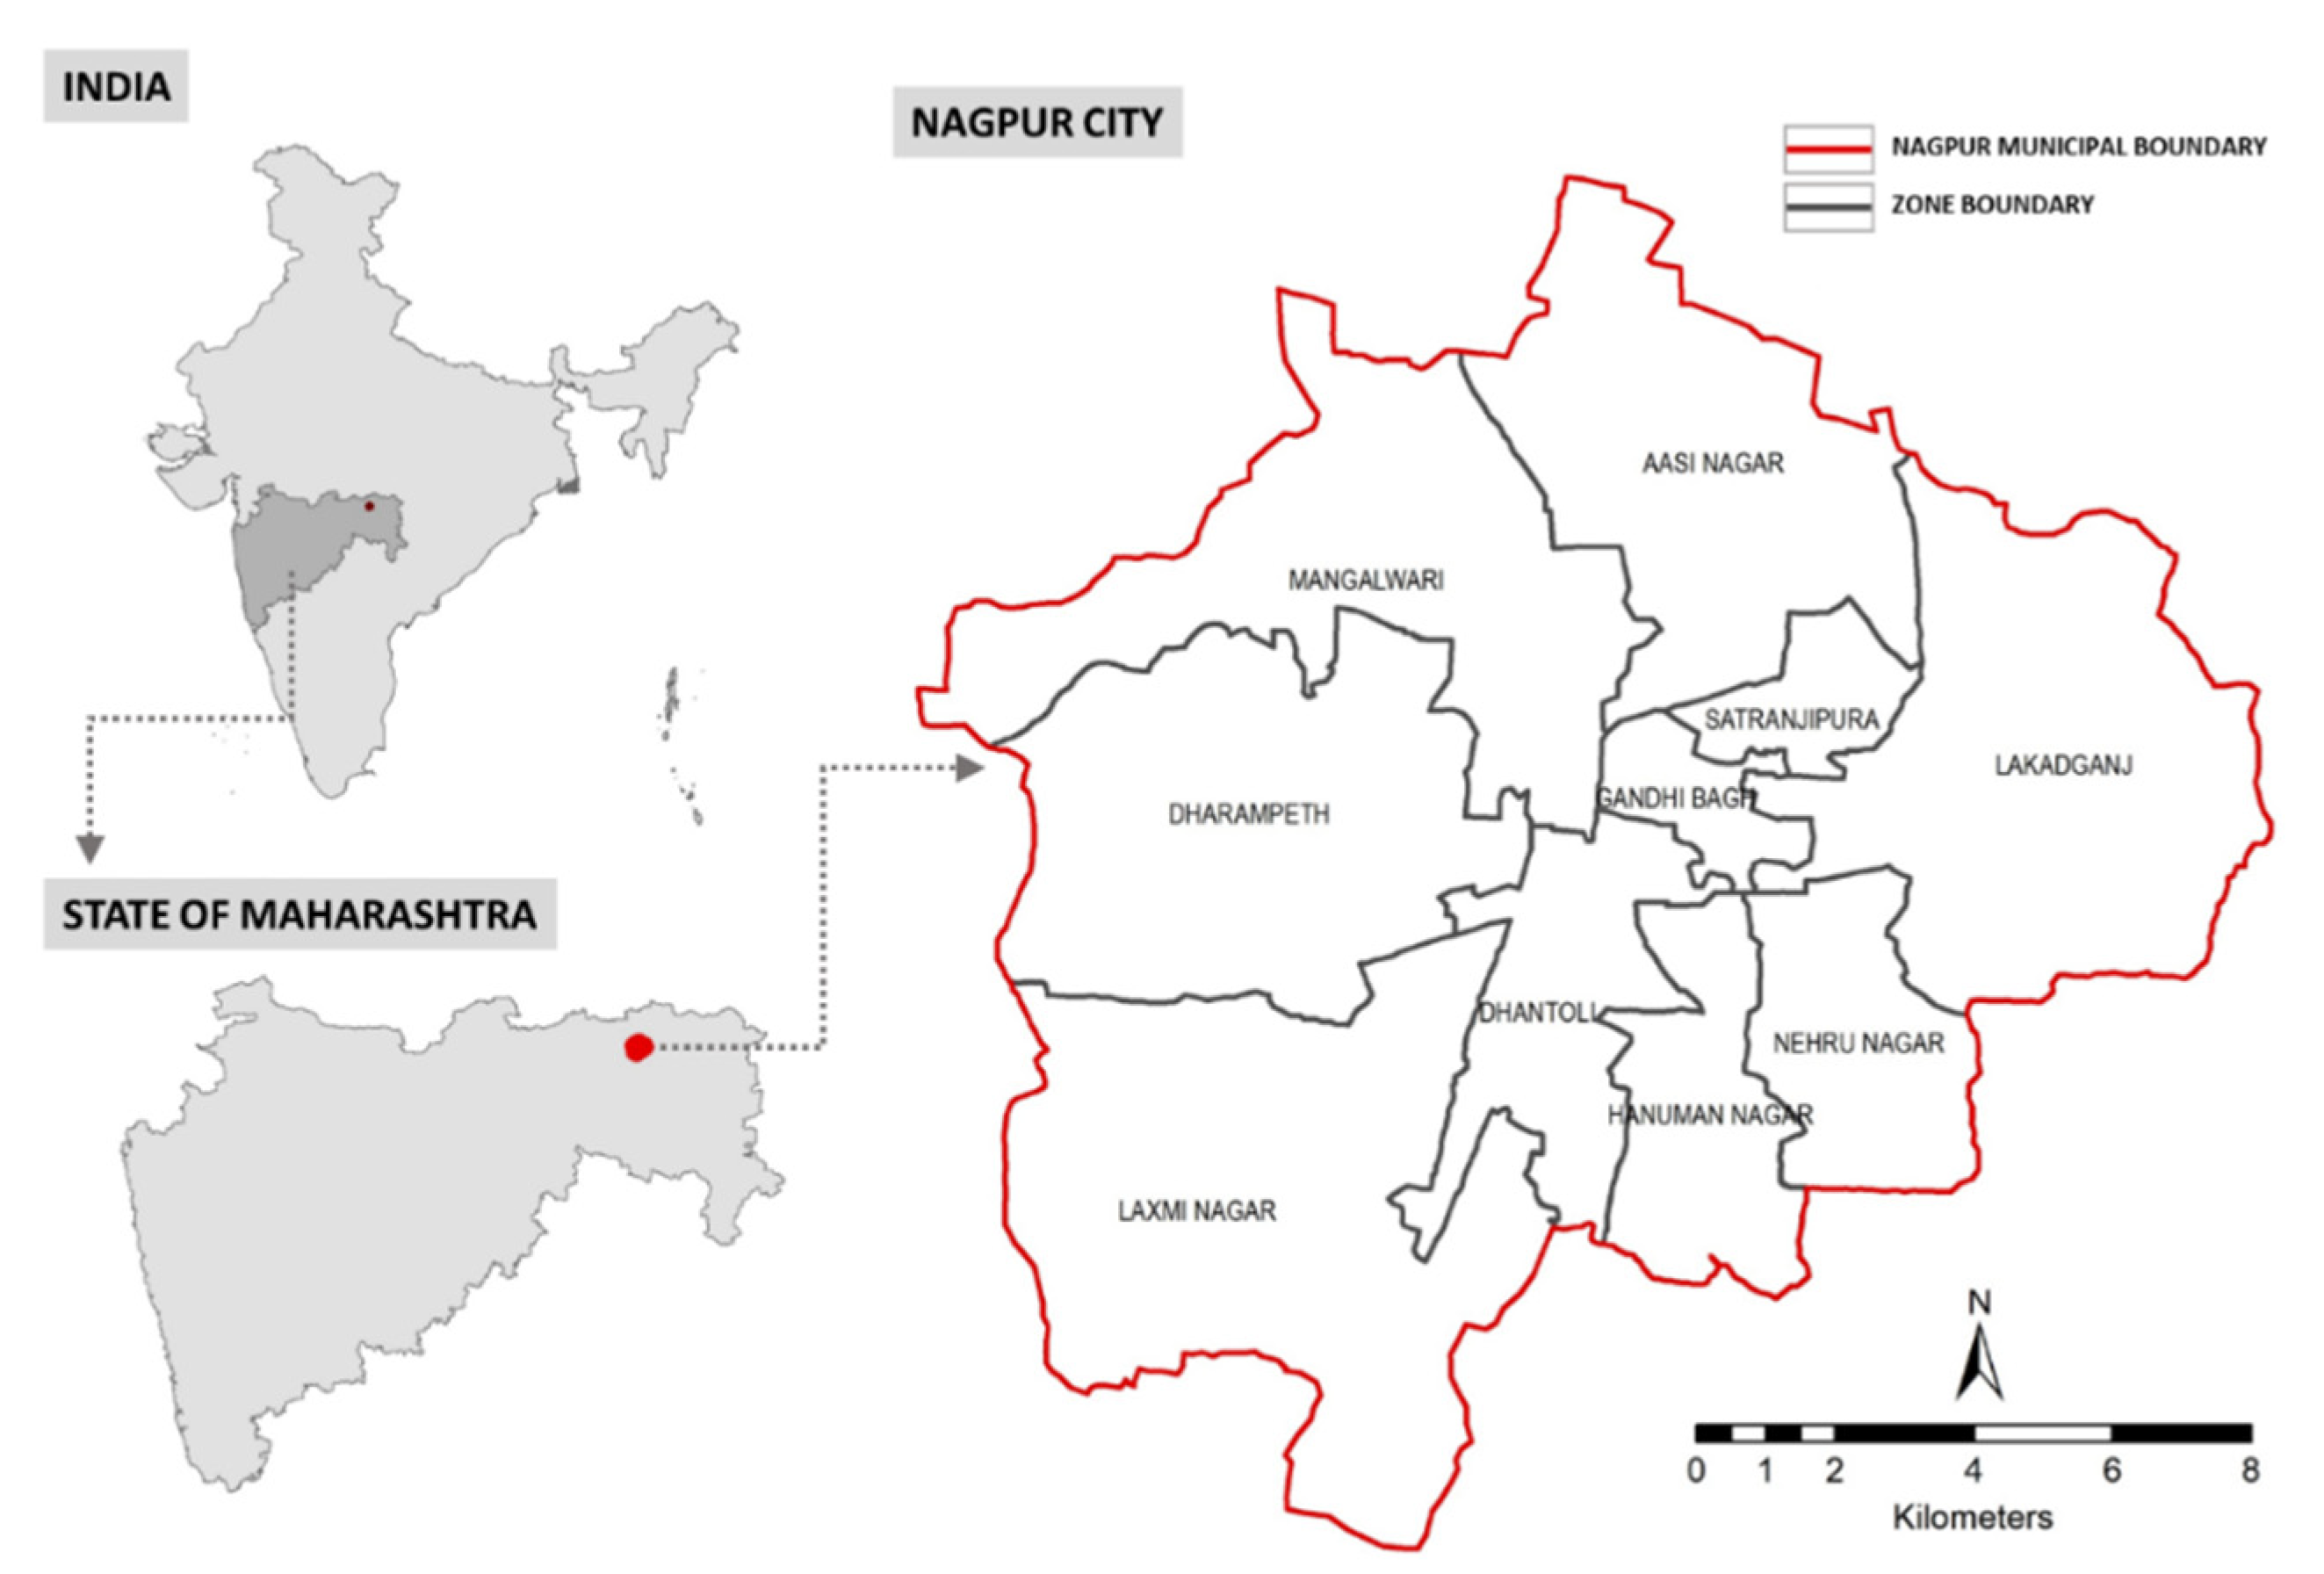
3.1. About Nagpur

Nagpur is the location of the Zero Mile marker in India (location shown in Figure 1). Spread across a geographic area of 217.56 km2, the city has an approximate population of 2.5 million. Due to its strategic central location in India, it is well connected to other major cities through vast transport networks. Besides its political and geographical significance, it is also a prominent educational hub and has a rich natural resource base [44,54]. Because of the region’s enormous orange production, it is also well known as the “City of Oranges” in India. It is further projected to be one of the fastest-growing cities in the world from 2019 to 2035 with an average annual GDP growth rate of 8.41% [55].

3.2. FEW Scenarios in Nagpur

Nagpur is not only the third-largest city in Maharashtra state but is also recognized as one of the fastest-growing urban agglomerations of India [56]. Historically, Nagpur is subject to a tropical climate with dry weather and experiences extreme weather conditions with significant consequences of climate variability [19]. It has witnessed severe water stress situations in recent years [54]. FEW sustainability can play a major role in ensuring the city develops in a resilient way [57], and Nagpur is still in the transformation phase. Meanwhile, the flow of FEW resources is separately governed and managed by different agencies [16,58]. Nagpur needs to leverage the interlinkages between FEW sectors to address this governance issue [44].

4. Research Methods

4.1. Literature Analysis

To identify the relevant research documents through the existing literature, this study followed the Preferred Reporting Items for Systematic Reviews and Meta-Analyses (PRISMA) guidelines [59]. In line with the PRISMA guidelines, search queries were mainly executed in the Elsevier’s Scopus database, which is recognized to be the most comprehensive abstract and citation database of interdisciplinary literature (peer-reviewed), as well as additional high-quality online sources such as books and conference proceedings [60]. Figure 2 illustrates the results obtained through the Scopus search. A search query was first applied with the following keywords ‘Food + Energy + Water + Security’ in the “ALL” category. A total of 1910 papers were retrieved initially from Scopus using our defined search query. To filter out the documents focusing on indicators, the search query is then modified to ‘Food + Energy + Water + Security + Indicator’, through which 121 research documents were identified. Later, after manual screening, the literature database titles were extracted and the relevant literature was identified, irrespective of the study area, year of publication, type of document, etc. The next step was to shortlist the research documents, through which the 29 research documents were shortlisted for review. Other than the Scopus database search, a total of 15 other research documents and grey literature were also taken into consideration for this research.

4.2. Framework Development

Based on the review of identified research documents, this research builds on four steps of analysis, as described below:
Step 1: To identify the key dimensions in the domain of FEW security. Table 2 shows the interconnected dimensions for the same.
Step 2: To identify the security indicators in FEW sectors. Table 3 shows the sector-wise security indicators.
Step 3: Formulation of an Indicator framework for the assessment of Urban FEW security.
Step 4: To collect the data primarily and secondarily.
Step 5: The final step was to assess this acquired data and conclude the assessment.
Figure 3 shows the methodology that was followed by the authors and which was instrumental in the assessment of FEW security for particular case studies. This indicator framework is believed ultimately to help authorities in the decision-making process in matters of governance for urban FEW security.

4.3. Assessment for Nagpur City

4.3.1. Indicator Scoring and Weighted Mean Method

To avoid any bias in the scoring of each indicator, the assessment of indicators was done quantitatively. Thus, the framework can be applied to any case study irrespective of its character, location, and other defining peculiarities.
To calculate the scores for overall security based on all the indicators and for each dimension, the weighted arithmetic mean formula W = i = 1 n w i X i i = 1 n w i (W = Weighted average, n = number of terms to be averaged, wi = weights applied to x values, Xi = data values to be averaged) was used, as it offers more nuance to each attribute.

4.3.2. Survey Method

To investigate the applicability of the framework for urban FEW security assessments, the study focused on the specific case study area of Nagpur City. Household-level surveys were conducted targeting city residents to gain an understanding of FEW security at the household level. In line with the 10 administrative zones of Nagpur, a stratified random sampling approach was adopted to cover households across the city. To ensure wider outreach across the city, offline surveys were conducted at the outset. In addition, an online questionnaire (through ‘Google Forms’) was circulated through Facebook and WhatsApp. When collecting the samples, the emphasis was more on collecting proportionate responses from all zones in the given time interval of 10 days (29 October 2021 to 7 November 2021). Given the context of the continuing COVID-19 pandemic and other concerns, the survey was performed over a 10-day time frame, as there was a perceived necessity for situation analysis in the defined time interval of 10 days. Since this was a pilot study authors decided to collect the samples with a confidence level of 85–90% which gives a z-score of 1.44–1.65. The survey was performed under the supervision of the authors; hence the margin of error was decided to be 5%. The sample size (SS) was calculated using formula S S = z 2 × p   ( 1 p ) e 2 z 2 × p   ( 1 p ) e 2   N + 1 (N = population size, e = Margin of error, z= z-score), which came to be 208–273. The survey area does not cover the whole city but only the selected parcels for which we consider this sample size to be adequate. The online method was chosen particularly in view of the above mentioned COVID-19 issues. Even so, it was difficult to reach out to city residents and obtain a sufficient number of responses. Hence the authors do acknowledge that there was a rather limited number of samples collected for this study. After the defined period of 10 days, the online survey was turned off, and the survey responses were downloaded as a CSV file. A total of 243 responses were collected from the study area. Following this, all the samples collected through both online and offline modes were analyzed by the authors in Microsoft Excel.

5. Results

5.1. Formation of Indicator Framework

5.1.1. Review of Existing Indicators in FEW Domain

After filtering out relevant literature datasets using the PRISMA method, certain dimensions and indicators in the available literature were studied for all three sectors (FEW). Later, each of them was scrutinized fronting onto urban level assessment. The list of all these dimensions and indicators is shown in Table 2 and Table 3.
Table 2. Identified dimensions in FEW security domain.
DimensionsSource
Availability[47,48,50,52]
Diversity[24,51]
Quality[24,47,48,61]
Service Sustainability[24,47,48]
Capacity[24]
Affordability[24,48,52]
Health Risk[24,61]
Regulations[24,42,47]
Strategic Planning[24,42]
Utilisation[24,47]
Stability[47]
Accessibility[24,47,48,52,61,62]
Governance[24,51,61]
Table 3. Sector wise indicators in FEW security domain.
SectorIndicatorSource
FoodOverweight Children[3,5,41,42,63]
Cereal Yield
Food Supply Per Capita
Fertilizer Use/HA
Cereal Import Dependency Ratio
Prevalence of Undernourishment[64]
Low Per Capita Income[3,47]
Low and Unequal Distribution of Income
Poor and Highly Unstable Growth Performance especially in Agriculture
Unemployment and Underemployment
Low and Declining Farm Size
Inequalities in Land Distribution
Low Land Utilization
Social Discrimination
Population Growth
Access to Market
Poverty
Political Instability
Poor, Marginalized, Ethnic Group & Lower Caste Groups
High Infant Mortalities
EnergyAccess to Electricity[3,5,41,42,45,50]
Energy Use Per Capita
Electricity Consumption
Electricity from Hydroelectric
Access to Clean Fueltech for Cooking
Emission from the Energy Sector
Energy Intensity Level
Share of Renewable Energy in Total Primary Energy Supply (%)
Supply [45,48]
Excess Production
Demand
WaterPopulation with Safe Drinking Water[3,5,41,42]
Population with Open Defecation
Water Resources Per Capita
Water Withdrawal Per Capita
Cultivated Area with Irrigation
Groundwater Extraction/Borewells
Water for Industrial Use
Municipal Water Withdrawal
Population using Basic Drinking Water Services (%)[64]
Population using Basic Sanitation Services (%)
Freshwater Withdrawal (% of Available Freshwater)
Scarce Water Consumption Embodied Imports
Groundwater Level[65]
Groundwater Recharge Rate
Groundwater Salinity
Groundwater pH
Type of Water Source[46]
Accessibility of Running Water
Household Water Cost
Water Consumption
Waterborne Disease
Rainfall[27]
Stream Flow
Relative Humidity
Ambient Water Quality[50]
Surface Water Availability[3,14,24]
Groundwater Availability
Other Source Availability
Water Storage Capacity
Diversity of Water Sources
Water Quality
Water Supply Capacity
Water Supply Coverage
Cost Recovery of Water Utilities
Water Tariff
Access to Sanitation
Water Contamination Incidents
Economic Loss Due to Water Pollution
Strategic Planning
Disaster Management
Regulation
Temperature[66]
Precipitation

5.1.2. Indicator Framework for Urban FEW Security in Nagpur

Thereafter, dimensions and indicators were finalized for framing of the localized indicator set. Appendix A: Table 1 shows the indicator framework utilized for the assessment of FEW security. Each sector was divided into three dimensions, namely Availability, Accessibility, and Utilization, and further into indicators and sub-indicators. Lastly, the overall security dimension was added for all three sectors to understand the perception of the respondents. Most of the data (summarized in Appendix A: Table A1)) was collected through a primary source.

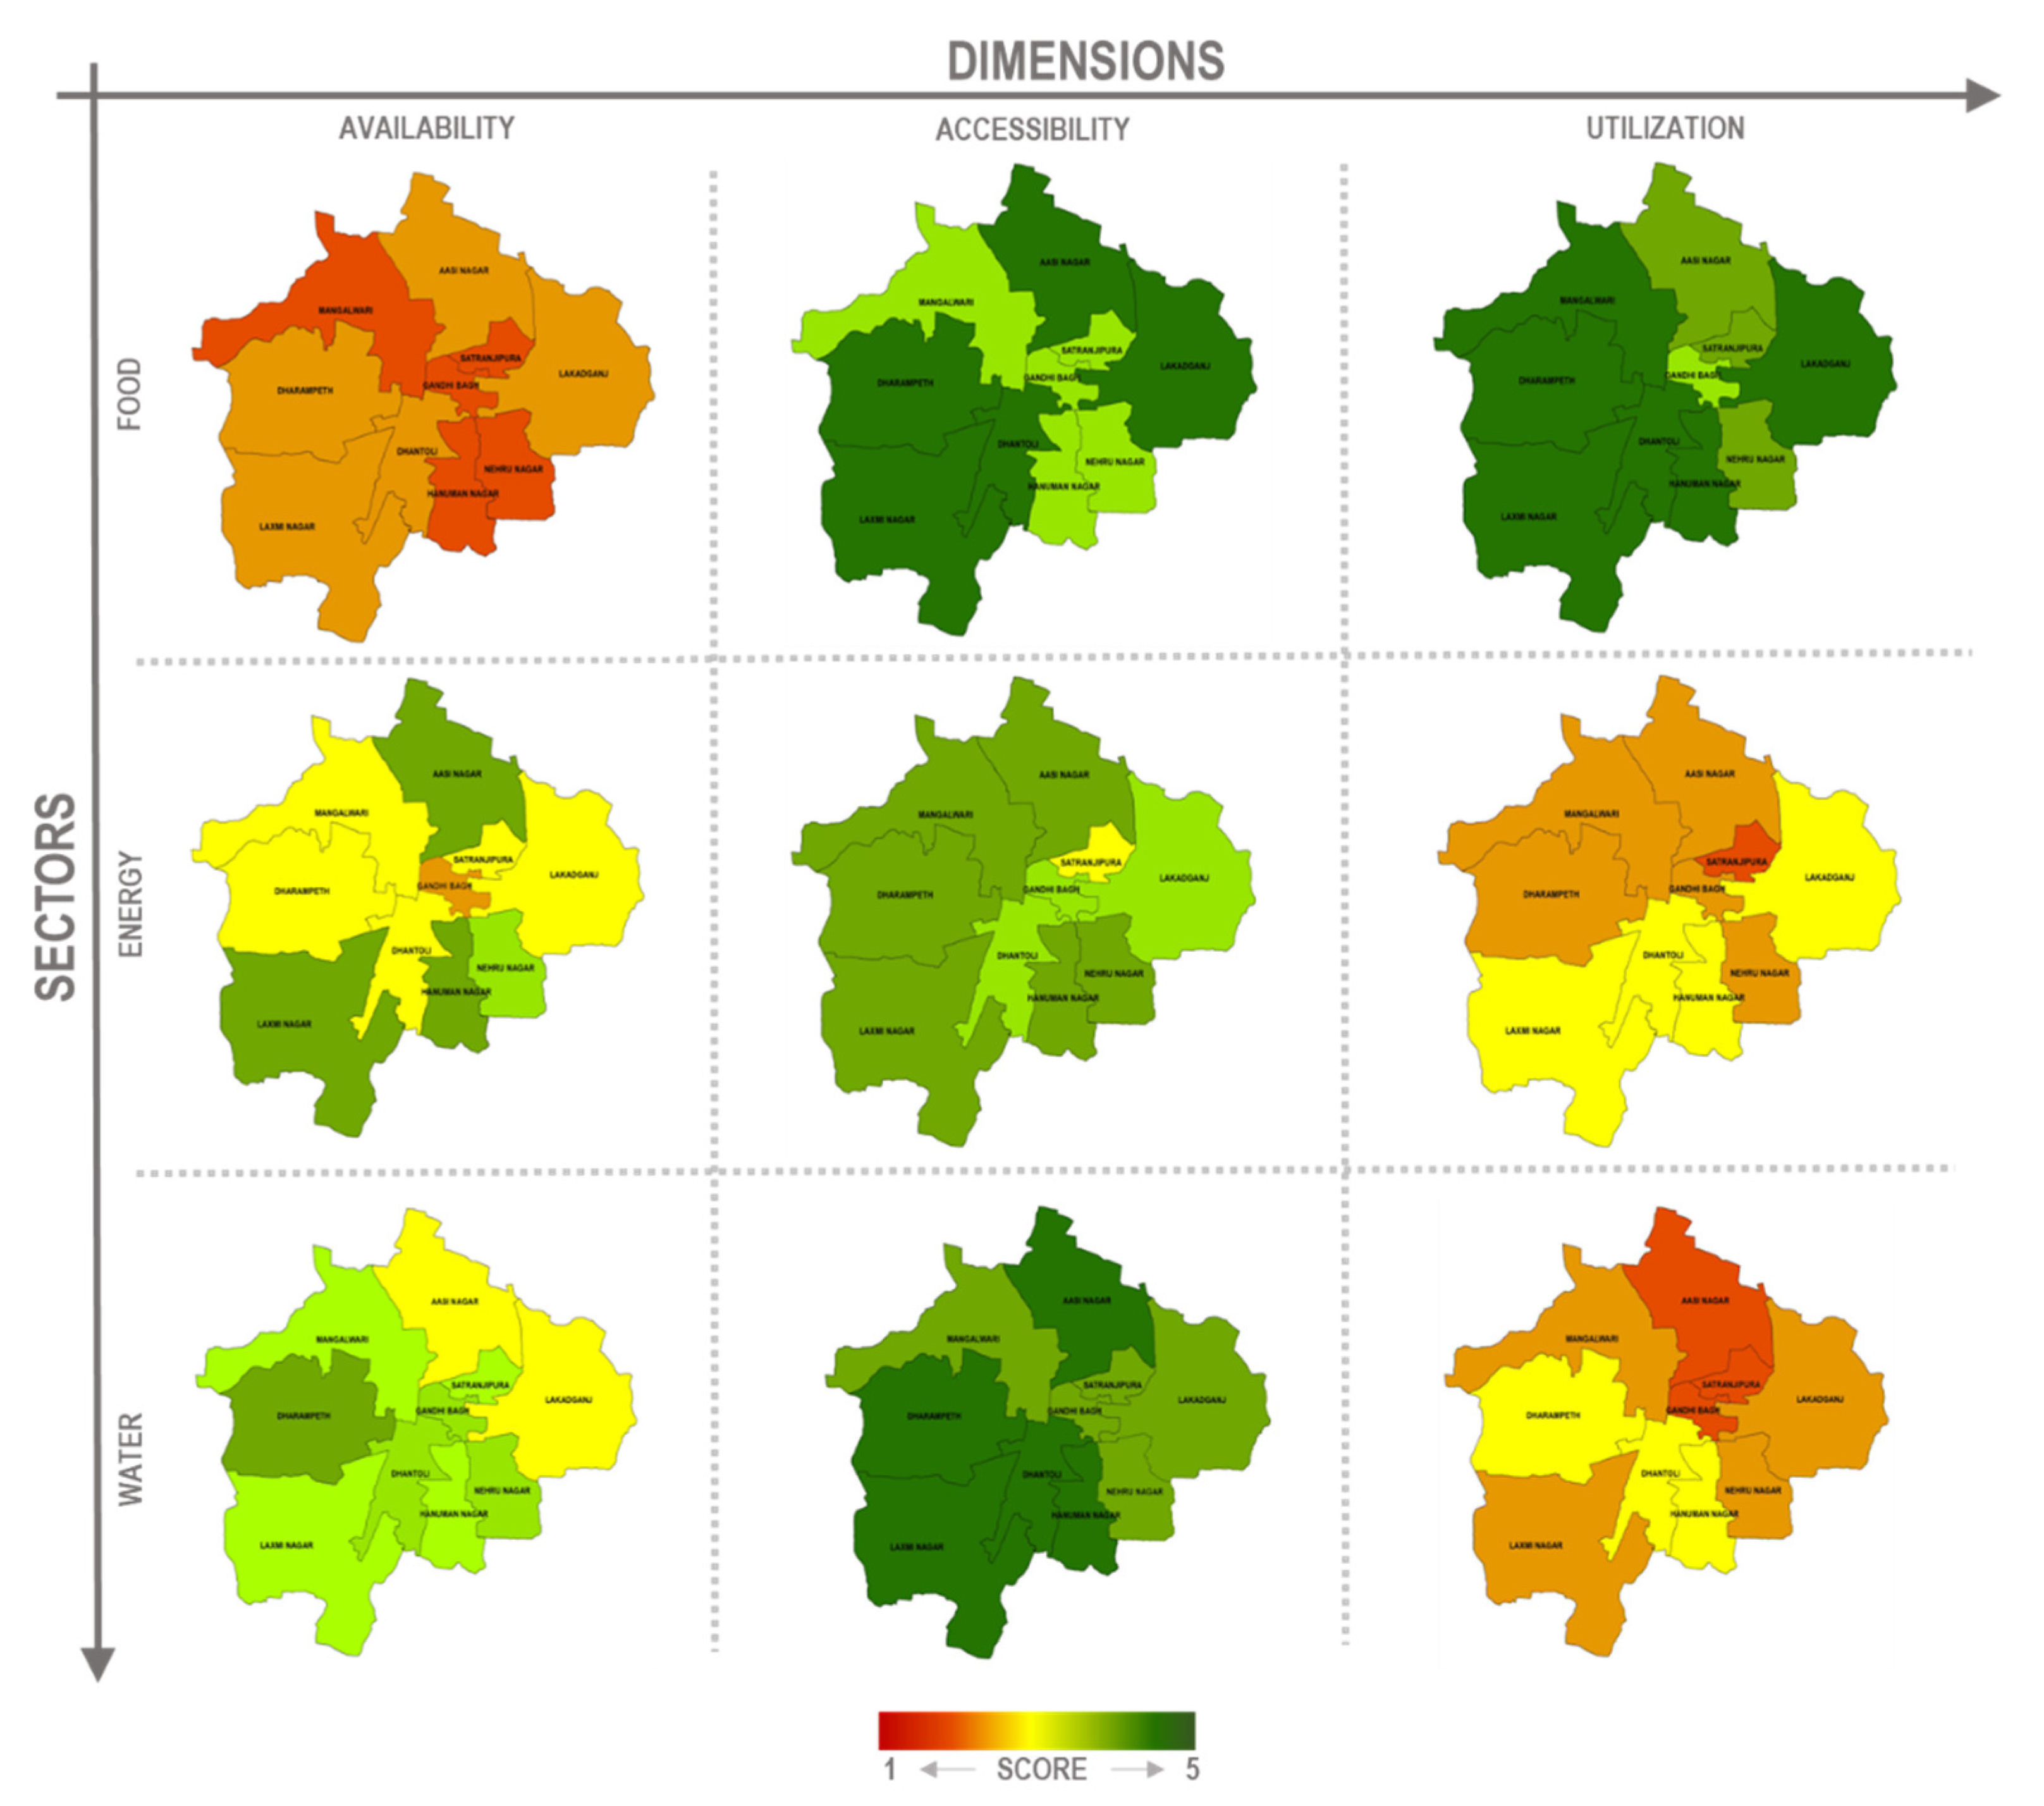
5.2. Application of the Indicator Framework for Nagpur City Context

A questionnaire survey was conducted in line with the finalized queries mentioned (Appendix A: Table A1) A total of 243 samples were collected from 10 zones of the city. The questionnaire also included some general queries like gender, zone of residence, income group, and household size, to understand the demographic character of the responses. As can be seen in Table 4, the maximum share of responses is obtained from three zones, namely Dharampeth, Laxminagar, and Hanuman Nagar. Overall, 52.18 percent of the respondents were male and 47.82 percent were female. The average household size of the samples collected was 4.2. The responses received were almost equal from all the income groups.
As can be seen in Figure 4, the dimension-wise final scores for all three sectors were mapped to understand the spatial scenario of FEW security for the city of Nagpur. Further, these sectoral securities with respect to three dimensions, namely availability, accessibility and utilization, are discussed in the following sections.

5.2.1. Food Security

  • Availability:
In terms of food availability, very few households in Nagpur city were reported to have their own kitchen garden or livestock, which undermines in-house food availability. At the same time, market food availability was perceived by city residents to be good. Compared with energy and water, food is less available in all 10 zones. Specifically for Gandhibagh, Mangalwari, Satranjipura, Hanuman Nagar, and Nehru Nagar, it is even less available in comparison with other zones. Overall, more consideration must be taken regarding the dimension of availability of food.
2.
Accessibility:
Most of the respondents stated that they have a marketplace within 2 km of their household, thus indicating better physical access to food. Moreover, there was also moderately good economic accessibility for food as seen from the responses. In particular, economic accessibility for people in lower-income groups in the older areas was reported to be low. Most of them seemed satisfied with the quality and nutritional value of the food they have. Hanuman Nagar, Nehrunagar, Satranjipura Gandhibaug and Mangalwari zones are believed to be on verge of development for this particular dimension.
3.
Utilization:
The majority of respondents selected the energy-efficient cooking mode out of the available options. Overall, for all 10 zones, the dimension of utilization was better even compared with other dimensions of food security. Compared to water and energy utilization, the food sector elicited far better scores.

5.2.2. Energy Security

4.
Availability:
When energy availability is considered, the city of Nagpur was reported to have wide coverage with low power fluctuations. However, there were some fluctuations and power cuts, mostly observed in Dharampeth, Mangalwari, Gandhibaug, Satranjipura, Dhantoli and Lakadganj. Compared to other sectors, energy availability can be perceived as moderately good for all zones of Nagpur.
5.
Accessibility:
When energy accessibility is considered, economic access by the respondents to energy services was good, but their dependency on electricity for household appliances was at a maximum level. Figure 4 shows that energy accessibility can be considered moderate when compared to other sectors.
6.
Utilization:
Respondents were observed to be using the energy-efficient option for lighting, along with choosing more energy-efficient appliances when purchasing new products. However, city residents were not yet opting for renewable energy sources at the household level, which could enhance the city’s energy security. The zone of Satranjipura is in significantly poor condition when compared to other zones. Overall, the dimension of utilization for energy needs more attention than availability and accessibility.

5.2.3. Water Security

7.
Availability:
Most of the respondents, had an in-house storage facility for water, rather than availing themselves of groundwater sources. For the zones of Lakadganj and Ashi Nagar, the scores for water availability are comparatively low as most residents lacked both groundwater usage and in-house storage.
8.
Accessibility:
The overall accessibility for water can be perceived as good, as residents were well covered by the water supply system. Residents did not need to spend much of their income on water tariffs, making water more accessible for all income groups. For all zones, it was observed that physical, as well as economic access, was good for all respondents.
9.
Utilization:
From Figure 4, it can be observed that the dimension of utilization for water security is a matter of particular concern. While several respondents had very good access to the water supply, they were concerned about the quality of water they were using on daily basis. The city residents were mostly dependent on the municipal water supply system with very little diversity in terms of water sources. Households were still not practicing rainwater harvesting, despite the fact that rainwater could potentially be a good renewable water source for the city. Aashi Nagar, Satranjipuraand Gandhibaug zones showed significantly lower scores for water utilization, as most of the respondents from these particular zones are dependent on the municipal water supply and were concerned with the quality of water available to them. Most of the zones also have less diverse water sources for all-year-round use.

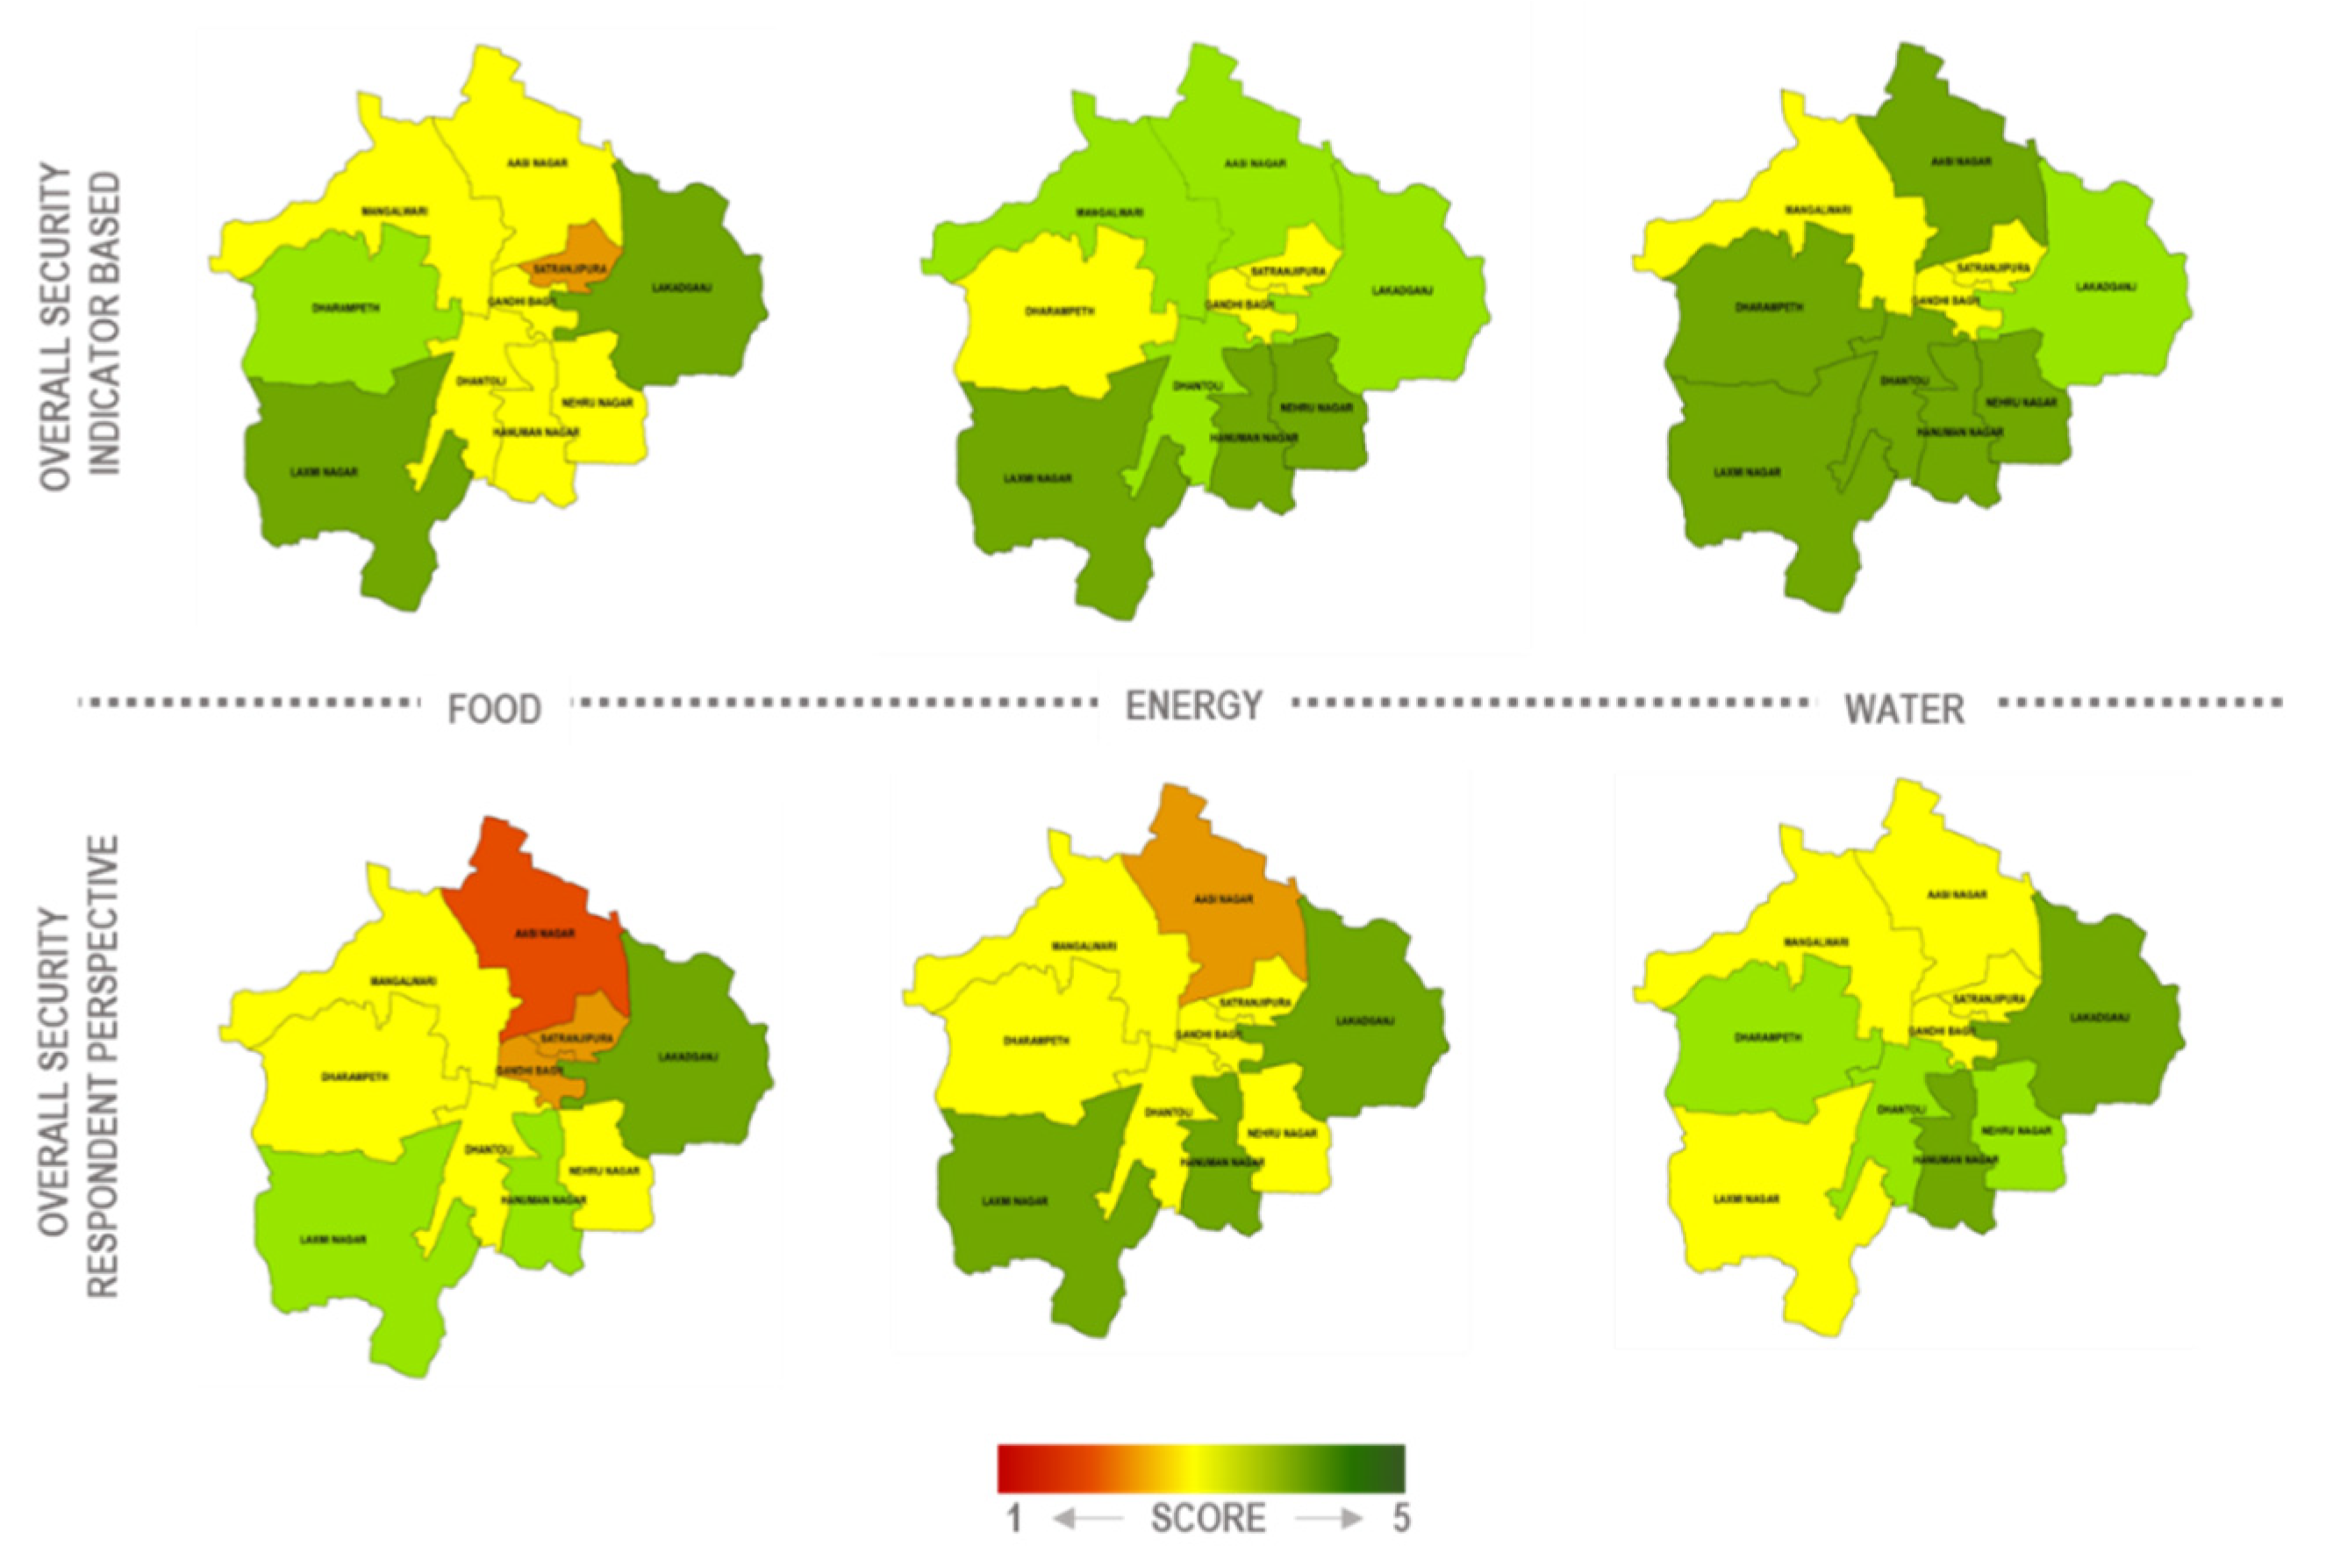
5.2.4. Overall FEW Security

Figure 5 shows the final weighted scores for each zone and for all three sectors. The sector-wise scores (overall security—indicator-based) are similar to the scores obtained from the survey results (overall security—respondent perspective). For the Aashi Nagar zone, this score is significantly less than the indicator-based score as the respondents perceive that the food security in their area is poor. Hence, the dimension of overall security for all three sectors could be crucial and justifiably fits the framework, as it gives a clear picture of how city residents’ perceive FEW security in Nagpur.

6. Discussion and Conclusions

6.1. Discussion

This framework could be applied to support FEW security assessments for a city-level analysis. As discussed in Section 4, an indicator-based approach is preferred by the authors to analyze FEW security, as this can assist in analyzing resource security in a quantitative and non-biased way, irrespective of the selected case. A comprehensive understanding of FEW security issues and their importance is vital for rational decision-making. This study also covered issues that are less frequently examined at a local level, with urban related indicators included in the framework.
It was observed from the literature study that this kind of assessment on an urban scale has not been done so far (as evident from Table 1). Therefore, finalizing the assessment dimensions and indicators was an iterative and complex process. In the final framework, the indicators that the authors finalized were in the context of Nagpur City considering location, character, climate variability, and data availability. Thereby, when finalizing the framework as detailed in Section 5, a primary survey was conducted both offline and online. One challenge was that, because of certain restrictions due to the COVID-19, pandemic, many of the residents refused to engage in response, so the authors were unable to collect an equal number of samples from these 10 different zones of the city. At a later stage, the authors emphasized obtaining a proportionate number of responses from each zone. The limited sample size is thus acknowledged by the authors. As a future scope of this study, the authors might conduct similar surveys at different time intervals to perform a temporal analysis. Lastly, a qualitative approach was excluded from the study because different experts may interpret qualitative scales differently and the findings of the various criteria may be difficult to compare.
Analysis of FEW security was carried out to understand the current conditions of the city based on several dimensions, namely availability, accessibility, and utilization for FEW security. As evident in Figure 4 in the previous section, the indicators for food availability have a lower score as compared to other sectors. However, it is important to understand that cities predominantly rely on external areas for food. In that context, food security in Nagpur is reliant on rural areas of Nagpur district, and self-reliance for food availability is lower than for other dimensions, and also in comparison with other sectors. In should also be noted that the city is currently facing water scarcity issues. Thus, encouraging urban farming in the city will also have an impact on water and energy availability which currently score better than food availability. Secondly, when accessibility for FEW is considered, all three sectors show better scores. Lastly, the dimension of utilization concerning energy and water shows a lower score as compared to food. Household-level preparedness can be anticipated to be very low for all three sectors as in-house food availability scores are low, renewable energy sources are not made use of, people do not practice rainwater harvesting and there is not much diversity in terms of available resources. Overall this explains why residents must shift to utilization of more energy-efficient and renewable resources. Finally, if we look at the overall scenario (Figure 4), as compared to availability and utilization for all three sectors, the dimension of accessibility had better scores. Thus, the findings show a scenario where the population of Nagpur perceives the dimension of accessibility of FEW as “satisfactory” but the dimensions of availability and utilization as “moderate”. Hence, it can be understood that Nagpur is not a resource-efficient city.
Rapid urbanization in Nagpur is bringing about a rise in population and, as a result, a rise in the demand for potable water. New power plants near the city have similarly increased the need for water. The year 2019 was indeed a wake-up call for the city. For the first time in several decades the Nagpur Municipal Corporation (NMC) supplied water on alternate days in mid-July when rains were delayed until late July in Nagpur. The area has also seen erratic precipitation in recent times. Such periods of scanty rainfall are especially concerning when it comes to food production in the surrounding rural areas, which supply most of the food to city residents. CES depicts a self-sufficient and decentralized society that utilizes and circulates resources, and as such the city should focus more on self-sustenance in terms of FEW resources, seeing as there is major reliance on the areas outside the city for FEW resources. As the concept of CES also emphasizes the necessity of cooperation and involvement for sustainable resource management, the level of awareness and willingness to support development policies is critical to the application of this concept [9]. Hence, to examine the level of awareness among residents, an overall security perspective was included as part of the survey. There seems to be a possibility for collaborative, bottom-up engagement on sustainability as a number of respondents are well aware of how crucial FEW security is.
Cities are at the forefront of managing change and are the driving force for action to reduce the use of resources by taking an integrated approach and planning. Not only are they the engines of the economy and home for their citizens, but municipalities also supply and control various public services to residents and businesses that influence the majority of resource use, and energy consumption [20]. Hence, to maintain these resources, it is essential to understand that these issues are intangibly linked, and thus must be addressed with a more integrated approach as mentioned above. In line with that, a sound indicator framework can be used as a management tool to assist governments to design implementation plans and policies in allocating FEW resources appropriately. This research therefore provides a method for assessing the state of FEW security in urban areas and helps them cope with upcoming challenges.

6.2. Conclusions

Given the character of competing developmental and environmental goals together with trends of rapid urbanization and population expansion in India, it has become necessary to explore the issues surrounding natural resource management while ensuring responsible use of all these resources. This study aimed to contribute an urban level assessment of collective FEW security by developing a localized framework for FEW security indicators and dimensions. Concurrently, its applicability for the specific case of Nagpur, India was also tested.
There have been a significant number of studies in the field of FEW security but these are generally limited to a global or regional scale. Study trends at the local level, on the other hand, suggest that FEW resources are examined and treated independently, with two of the three FEW systems examined at the same time. There have only been a small number of studies that focus on security among FEW sectors. Thus, the research set out in this study is unique among such studies.
The research began by identifying the relevant literature datasets, adopting the PRISMA method. Then a thorough analysis of the related literature was made, identifying gaps in local indicators for urban areas of each of the available frameworks, and proposing a new indicator framework that addresses the overall FEW security in urban areas.
A specific methodology for filtration of these indicators was applied by the authors considering the context of Nagpur City. Some indicators were necessarily left out by the authors in this study and these remaining indicators should also be investigated in the respective case study contexts. In addition, a qualitative approach could be considered including an expert consultation so as to develop a relevant indicator framework. Further practical testing of the framework would also provide more information about which FEW security indicators and dimensions should be addressed in the evaluation, as not all of the framework’s elements are relevant in every scenario. On thing is certain and that is FEW nexus thinking and a CES approach require enormous political will. Currently both concepts are at a nascent stage, and operationalizing policy recommendations is likely to require much greater advocacy for effective policy change on both global to local scales. A systematic and thorough approach would be useful in foresight and risk management for that matter. The findings of the research, as discussed above, also suggest ways in which the different areas could enhance their self-reliance according to CES. However, the extent to which CES impacts development planning in Nagpur City will be determined by how receptive policymakers are to the concept.
This indicator framework is restricted to urban areas. A rural perspective might result in quite a different scenario from which several questions would emerge requiring further research to better translate them into integrated policy formulation. One research domain might be how to improve collaboration across different geographical scales, such as isolated municipalities and urban areas, intra-regional watershed areas, or at the global level. In this sense, it is critical to examine how to determine the most appropriate scales for resource consumption and circulation and how to effectively intervene at the respective scale of analysis. Another challenge is how to minimize the possible detrimental effects on FEW resources, such as the deployment of renewable energy facilities and nature conservation. Lastly, FEW nexus thinking can also explore collaboration between different resource management departments and policies, thereby encouraging the application of CES. All these challenges must be investigated via direct observation on the ground to better understand the complexity and challenges at different scales, thereby ensuring the transition to sustainability.

Author Contributions

All authors were involved in conceptualization, visualization, investigation, methodology, writing—review and editing; formal analysis, B.M., V.S., P.M. and A.K.D.; writing—original draft preparation, software, B.M.; validation, resource, supervision, project administration, funding acquisition, S.D., P.M., R.S., B.K.M., D.S., M.A.R. and R.D. All authors have substantially contributed for the development of this manuscript. All authors have read and agreed to the published version of the manuscript.

Funding

This research is supported by the Asia-Pacific Network for Global Change Research (APN) under the project titled “Developing Urban-Rural partnerships framework to mitigate climate-induced water availability impacts on Food, Energy and Water (FEW) security at the regional level” with the project reference number CRRP2020-05MY-Shaw, and by the Strategic Research Fund of the Institute for Global Environmental Strategies (IGES), Japan under the project titled “Circulating and Ecological Sphere Concept: Path Making for a Sustainable Transformation through Translating Global Goals into Local Actions”.

Institutional Review Board Statement

Not applicable.

Informed Consent Statement

Informed consent was waived as no personal information was collected from respondents and only general opinion survey was conducted.

Data Availability Statement

Not applicable.

Acknowledgments

This study has been conducted under the project ‘Developing Urban-Rural partnerships framework to mitigate climate-induced water availability impacts on Food, Energy, and Water (FEW) security at regional level’ funded by the Asia-Pacific Network for Global Change Research (APN) with the project reference number CRRP2020-05MY-Shaw. This study is also supported by the Strategic Research Fund of the Institute for Global Environmental Strategies. The authors are grateful to three anonymous reviewers who have immensely helped in improving the manuscript, and to Emma Fushimi, IGES, Japan for her kind support in proof reading and edits.

Conflicts of Interest

The authors declare no conflict of interest.

Appendix A

Table A1. Indicator Framework and Criteria for Scoring of Indicators.
DimensionIndicatorQuestionAnswerUnitRating Criteria (Likert Scale)Data Collection Source
12345
FOOD
AvailabilityIn-house AvailabilityDo you practice Kitchen Gardening/Urban Agriculture in your home?Yes/No% Respondents with answer = YES0–20%20–40%40–60%60–80%80–100%Primary
Do you own any livestock, farm animals or poultry?Yes/No% Respondents with answer = YES0–20%20–40%40–60%60–80%80–100%Primary
Market AvailabilityHow much do you rate the market food availability?Very Poor/Poor/Moderate/Good/Very GoodOption Chosen by Respondentvery poorpoormoderategoodvery goodPrimary
AccessibilityPhysical AccessDo you have grocery store/food market within 2 km?Yes/No% Respondents with answer = YES0–20%20–40%40–60%60–80%80–100%Primary
Economic AccessWhat % of your Income is spent on food?0–100%%80–100%60–80%40–60%20–40%0–20%Primary
Quality of Food AvailableHow much do you rate the quality of food available to you?Very Poor/Poor/Moderate/Good/Very GoodOption Chosen by Respondentvery poorpoormoderategoodvery goodPrimary
Nutrition AdequacyDo you have adequate access to nutritious food?Yes/No% Respondents with answer = YES0–20%20–40%40–60%60–80%80–100%Primary
UtilisationCooking FuelWhich cooking option do you use?LPG/Induction/Kerosene/Other% Respondents using more eco-friendly and cost effective source0–20%20–40%40–60%60–80%80–100%Primary
Overall SecurityOverall Food SecurityHow much do you rate the overall food security?Very Poor/Poor/Moderate/Good/Very GoodOption Chosen by Respondentvery poorpoormoderategoodvery goodPrimary
ENERGY
AvailabilityPower cutsHow frequently do you face power cuts in your area?Daily/Once a Week/Once a Month/Rarely/NeverOption Chosen by RespondentDailyOnce a weekOnce a MonthRarelyNeverPrimary
Power FluctuationDo you observe fluctuation in electricity supply now and then?Yes/No% Respondents with answer = NO0–20%20–40%40–60%60–80%80–100%Primary
Service CoverageWhat % of city/population covered under service supply?0–20%20–40%40–60%60–80%80–100%Secondary
AccessibilityEconomic AccessWhat % of your income is spent on Electricity and other energy sources?0–100%%80–100%60–80%40–60%20–40%0–20%Primary
UtilisationElectricity Consumption/Dependency on ElectricityWhich electronic appliances do you use?Refrigerator/TV/Geyser/Water Purifier/Induction/Laptop/Washing Machine/AC/Cooler/Microwave/Mixer/OtherNumber of options selected by respondentsMore than 88642Primary
LightingWhich Lights do you use?CFL/LED/Halogen lamps/Flourescent lamps/Incandescent bulbs% Respondents using most eco-friendly and cost effective source0–20%20–40%40–60%60–80%80–100%Primary
Households using Renewable Energy SourcesDo you use solar panels for electricity supply?Yes/No% Respondents with answer = YES0–20%20–40%40–60%60–80%80–100%Primary
Energy Efficient UseWhich products do you prefer while purchasing?Energy Efficient/Affordable% Respondents with answer = Energy Efficient0–20%20–40%40–60%60–80%80–100%Primary
Overall SecurityOverall Energy SecurityHow much do you rate the overall energy security?Very Poor/Poor/Moderate/Good/Very GoodOption Chosen by Respondentvery poorpoormoderategoodvery goodPrimary
WATER
AvailabilityGroundwater AvailabilityDo you have personal tubewell/common handpump?Yes/No% Respondents with answer = YES0–20%20–40%40–60%60–80%80–100%Primary
Household Water Storage AvailabilityDo you have water storage tank (Over Head Tank/Under Ground Tank/Inhouse Storage)?Yes/No% Respondents with answer = YES0–20%20–40%40–60%60–80%80–100%Primary
AccessibilityAccess to proper Sanitation ServiceWhat % of city/population covered under service supply?0–20%20–40%40–60%60–80%80–100%Secondary
Households with access to tap water supplyDo you have access to tap water supply?Yes/No% Respondents with answer = YES0–20%20–40%40–60%60–80%80–100%Primary
Economic AccessibilityWhat % of your income is spent on water tariff?0–100%%80–100%60–80%40–60%20–40%0–20%Primary
UtilisationQuality of Water UsedHow much do you rate the quality of water available to you?Very Poor/Poor/Moderate/Good/Very GoodOption Chosen by Respondentvery poorpoormoderategoodvery goodPrimary
Diversity in Sources UsedWhich water source do you use/is available to you?Tap/Borewell/Tanker/Common Tap/HandpumpsNumber of options selected by respondentsonetwothreefourallPrimary
Use of Renewable SourceDo you practice Rainwater Harvesting at household/community level?Yes/No% Respondents with answer = YES0–20%20–40%40–60%60–80%80–100%Primary
Overall SecurityOverall Water SecurityHow much do you rate the overall water security?Very Poor/Poor/Moderate/Good/Very GoodOption Chosen by Respondentvery poorpoormoderategoodvery goodPrimary

References

  1. Hoolohan, C.; Larkin, A.; McLachlan, C.; Falconer, R.; Soutar, I.; Suckling, J.; Varga, L.; Haltas, I.; Druckman, A.; Lumbroso, D.; et al. Engaging stakeholders in research to address water–energy–food (WEF) nexus challenges. Sustain. Sci. 2018, 13, 1415–1426. [Google Scholar] [CrossRef] [PubMed] [Green Version]
  2. Scott, M.; Larkin, A. Geography and the water–energy–food nexus: Introduction. Geogr. J. 2019, 185, 373–376. [Google Scholar] [CrossRef]
  3. Rasul, G. Food, water, and energy security in South Asia: A nexus perspective from the Hindu Kush Himalayan region☆. Environ. Sci. Policy 2014, 39, 35–48. [Google Scholar] [CrossRef] [Green Version]
  4. Chen, Y.; Xu, L. Evaluation and Scenario Prediction of the Water-Energy-Food System Security in the Yangtze River Economic Belt Based on the RF-Haken Model. Water 2021, 13, 695. [Google Scholar] [CrossRef]
  5. Putra, M.P.I.F.; Pradhan, P.; Kropp, J.P. A systematic analysis of Water-Energy-Food security nexus: A South Asian case study. Sci. Total Environ. 2020, 728, 138451. [Google Scholar] [CrossRef] [PubMed]
  6. Ingram, J.S.I. A food systems approach to researching food security and its interactions with global environmental change. Food Secur. 2011, 3, 417–431. [Google Scholar] [CrossRef]
  7. Nkiaka, E.; Okpara, U.T.; Okumah, M. Food-energy-water security in sub-Saharan Africa: Quantitative and spatial assessments using an indicator-based approach. Environ. Dev. 2021, 40, 100655. [Google Scholar] [CrossRef]
  8. Zhang, X.; Vesselinov, V.V. Integrated modeling approach for optimal management of water, energy and food security nexus. Adv. Water Resour. 2017, 101, 1–10. [Google Scholar] [CrossRef]
  9. Takeuchi, K.; Fujino, J.; Ortiz-Moya, F.; Mitra, B.K.; Watabe, A.; Takeda, T.; Jin, Z.; Nugroho, S.B.; Koike, H.; Kataoka, Y. Circulating and Ecological Economy—Regional and Local CES: An IGES Proposal; Institute for Global Environmental Strategies: Kanagawa, Japan, 2019. [Google Scholar]
  10. McGrane, S.J.; Acuto, M.; Artioli, F.; Chen, P.Y.; Comber, R.; Cottee, J.; Farr-Wharton, G.; Green, N.; Helfgott, A.; Larcom, S.; et al. Scaling the nexus: Towards integrated frameworks for analysing water, energy and food. Geogr. J. 2019, 185, 419–431. [Google Scholar] [CrossRef]
  11. Alfasi, N.; Fenster, T. Between the “Global” and the “Local”: On Global Locality and Local Globality. Urban Geogr. 2009, 30, 543–566. [Google Scholar] [CrossRef]
  12. UN. New Urban Agenda (Habitat 3). 2017. Available online: https://uploads.habitat3.org/hb3/NUA-English.pdf (accessed on 13 August 2021).
  13. UN. Sustainable Cities, Human Mobility and International Migration. 2018. Available online: https://undocs.org/en/E/CN.9/2018/2 (accessed on 13 August 2021).
  14. Dargin, J.; Berk, A.; Mostafavi, A. Assessment of household-level food-energy-water nexus vulnerability during disasters. Sustain. Cities Soc. 2020, 62, 102366. [Google Scholar] [CrossRef]
  15. Ghosh, A.; Steven, D. India’s Energy, Food, and Water Security: International Cooperation for Domestic Capacity. In Shaping the Emerging World: India and the Multilateral Order; Sidhu, W.P.S., Mehta, P.B., Jones, B.D., Eds.; Bbrookings Institution Press: Washington, DC, USA, 2013; p. 369. [Google Scholar]
  16. Sukhwani, V.; Shaw, R. A Water-Energy-Food Nexus based Conceptual Approach for Developing Smart Urban-Rural Linkages in Nagpur Metropolitan Area, India. IDRiM J. 2020, 10, 16635. [Google Scholar] [CrossRef]
  17. ICID. World Irrigated Area—2018. 2018. Available Online: https://www.icid.org/world-irrigated-area.pdf (accessed on 23 January 2022).
  18. IEA. World Energy Outlook 2011. Paris. 2011. Available online: https://www.iea.org/reports/world-energy-outlook-2011 (accessed on 25 August 2021).
  19. Sawadh, R.; Masram, B.Y.; Balamwar, S. Analysis of Past Behaviour of Climate Change on Basis of Multiple Parameters in Nagpur. Zeichen J. 2020, 6, 9. [Google Scholar]
  20. European Environment Agency (EEA). Technical, Urban Sustainability Issues—What Is a Resource-Efficient City? European Environment Agency (EEA): Copenhagen, Denmark, 2015. [Google Scholar]
  21. Hussien, W.A.; Memon, F.A.; Savic, D.A. An integrated model to evaluate water-energy-food nexus at a household scale. Environ. Model. Softw. 2017, 93, 366–380. [Google Scholar] [CrossRef] [Green Version]
  22. Walker, S. Triple Threat: Water, Energy and Food Insecurity. Triple Threat Water, Energy Food Insecurity. 2020. Available online: https://www.wri.org/insights/triple-threat-water-energy-and-food-insecurity (accessed on 1 September 2021).
  23. Zhuang, J.; Sayler, G.; Yu, G.; Jiang, G. Solving Shared Problems at the Food, Energy, and Water Nexus. Eos 2021, 102, 1739474. [Google Scholar] [CrossRef]
  24. Jensen, O.; Wu, H. Urban water security indicators: Development and pilot. Environ. Sci. Policy 2018, 83, 33–45. [Google Scholar] [CrossRef]
  25. Gragg, R.S.; Anandhi, A.; Jiru, M.; Usher, K.M. A Conceptualization of the Urban Food-Energy-Water Nexus Sustainability Paradigm: Modeling From Theory to Practice. Front. Environ. Sci. 2018, 6, 133. [Google Scholar] [CrossRef]
  26. Shu, Q.; Scott, M.; Todman, L.; McGrane, S.J. Development of a prototype composite index for resilience and security of water-energy-food (WEF) systems in industrialised nations. Environ. Sustain. Indic. 2021, 11, 100124. [Google Scholar] [CrossRef]
  27. Gesualdo, G.C.; Oliveira, P.T.; Rodrigues, D.B.B.; Gupta, H.V. Assessing water security in the São Paulo metropolitan region under projected climate change. Hydrol. Earth Syst. Sci. 2019, 23, 4955–4968. [Google Scholar] [CrossRef] [Green Version]
  28. Bhatnagar, M.; Mathur, J.; Garg, V. Determining base temperature for heating and cooling degree-days for India. J. Build. Eng. 2018, 18, 270–280. [Google Scholar] [CrossRef]
  29. NEERI. Environmental Status Report: Nagpur City. Nagpur. 2020. Available online: https://www.nmcnagpur.gov.in/assets/250/2021/06/mediafiles/Final_2020_ESR_-_AK.pdf (accessed on 5 September 2021).
  30. Kar, R.; Reddy, G.O.; Kumar, N.; Singh, S. Monitoring spatio-temporal dynamics of urban and peri-urban landscape using remote sensing and GIS—A case study from Central India. Egypt. J. Remote Sens. Space Sci. 2018, 21, 401–411. [Google Scholar] [CrossRef]
  31. Marome, W.; Rodkul, P.; Mitra, B.K.; Dasgupta, R.; Kataoka, Y. Towards a more sustainable and resilient future: Applying the Regional Circulating and Ecological Sphere (R-CES) concept to Udon Thani City Region, Thailand. Prog. Disaster Sci. 2022, 14, 100225. [Google Scholar] [CrossRef]
  32. Ministry of the Environment Japan. Outline of the Fifth Basic Environment Plan. Available online: https://www.env.go.jp/policy/kihon_keikaku/plan/plan_5/attach/ref_en-02.pdf (accessed on 16 October 2021).
  33. Institute for Global Environmental Strategies Homepages. Available online: https://archive.iges.or.jp/en/sdgs/sts.html (accessed on 16 October 2021).
  34. Ortiz-Moya, F.; Kataoka, Y.; Saito, O.; Mitra, B.K.; Takeuchi, K. Sustainable transitions towards a resilient and decentralised future: Japan’s Circulating and Ecological Sphere (CES). Sustain. Sci. 2021, 16, 1717–1729. [Google Scholar] [CrossRef]
  35. Bačová, M.; Böhme, K.; Guitton, M.; Herwijnen, M.V.; Kállay, T.; Koutsomarkou, J.; Magazzù, I.; O’Loughlin, E.; Rok, A. Pathways to a Circular Economy in Cities and Regions; Interreg Europe Joint Secretariat: Lille, France, 2016. [Google Scholar]
  36. Skea, J.I.M.; Nishioka, S. Policies and Practices for a Low-Carbon Society. Clim. Policy 2008, 8, S5–S16. [Google Scholar] [CrossRef]
  37. Thapa, K.; Sukhwani, V.; Deshkar, S.; Shaw, R.; Mitra, B.K. Strengthening Urban-Rural Resource Flow through Regional Circular and Ecological Sphere (R-CES) Approach in Nagpur, India. Sustainability 2020, 12, 8663. [Google Scholar] [CrossRef]
  38. CoastAdapt. Identifying Indicators for Monitoring and Evaluation. 2017. Available online: https://coastadapt.com.au/how-to-pages/identifying-indicators-monitoring-and-evaluation (accessed on 23 January 2022).
  39. Government of Canada. What Is an Indicator Framework? 2017. Available online: https://health-infobase.canada.ca/datalab/indicator-framework-blog.html#:~:text=An%20indicator%20framework%20is%20an,and%20connec-tion%20between%20different%20indicators (accessed on 24 January 2022).
  40. Mainguet, C.; Baye, A. Defining a framework of indicators to measure the social outcomes of learning. In Measuring the Effects of Education on Health and Civic Engagement: Proceedings of the Copenhagen Symposium–© OECD 2006. 2006; p. 11. Available online: https://www.oecd.org/education/innovation-education/37425733.pdf (accessed on 24 January 2022).
  41. Flammini, A.; Puri, M.; Pluschke, L.; Dubois, O. Walking the Nexus Talk: Assessing the Water-Energy-Food Nexus in the Context of the Sustainable energy for All Initiative; FAO: Rome, Italy, 2014. [Google Scholar]
  42. Rasul, G. Managing the food, water, and energy nexus for achieving the Sustainable Development Goals in South Asia. Environ. Dev. 2016, 18, 14–25. [Google Scholar] [CrossRef] [Green Version]
  43. Markantonis, V.; Reynaud, A.; Karabulut, A.A.; El Hajj, R.; Altinbilek, D.; Awad, I.M.; Bruggeman, A.; Constantianos, V.; Mysiak, J.; Lamaddalena, N.; et al. Can the Implementation of the Water-Energy-Food Nexus Support Economic Growth in the Mediterranean Region? The Current Status and the Way Forward. Front. Environ. Sci. 2019, 7, 84. [Google Scholar] [CrossRef]
  44. Sukhwani, V.; Shaw, R.; Deshkar, S.; Mitra, B.K.; Yan, W. Role of Smart Cities in Optimizing Water-Energy-Food Nexus: Opportunities in Nagpur, India. Smart Cities 2020, 3, 1266–1292. [Google Scholar] [CrossRef]
  45. Chuang, M.C.; Ma, H.W. An assessment of Taiwan’s energy policy using multi-dimensional energy security indicators. Renew. Sustain. Energy Rev. 2013, 17, 301–311. [Google Scholar] [CrossRef]
  46. Nilsson, L.M.; Berner, J.; Dudarev, A.A.; Mulvad, G.; Odland, J.; Parkinson, A.; Rautio, A.; Tikhonov, C.; Evengård, B. Indicators of food and water security in an Arctic Health context—Results from an international workshop discussion. Int. J. Circumpolar Health 2013, 72, 21530. [Google Scholar] [CrossRef] [Green Version]
  47. Adhikari, S. Food security: Pillars, determinants and factors affecting it. Retrieved Febr. 2018, 27, 2021. [Google Scholar]
  48. Prambudia, Y.; Rahmana, A.; Juraida, A. Framework for measuring urban energy security: Citizen perspective. J. Pengemb. Kota 2019, 7, 34–45. [Google Scholar] [CrossRef] [Green Version]
  49. Ibrahim, H.; Uba-Eze, N.; Oyewole, S.; Onuk, E. Food Security among Urban Households: A Case Study of Gwagwalada Area Council of the Federal Capital Territory Abuja, Nigeria. Pak. J. Nutr. 2009, 8, 810–813. [Google Scholar] [CrossRef] [Green Version]
  50. Mabhaudhi, T.; Nhamo, L.; Chibarabada, T.; Mabaya, G.; Mpandeli, S.; Liphadzi, S.; Senzanje, A.; Naidoo, D.; Modi, A.; Chivenge, P. Assessing Progress towards Sustainable Development Goals through Nexus Planning. Water 2021, 13, 1321. [Google Scholar] [CrossRef]
  51. Bin Abdullah, F.; Iqbal, R.; Hyder, S.I.; Jawaid, M. Energy security indicators for Pakistan: An integrated approach. Renew. Sustain. Energy Rev. 2020, 133, 110122. [Google Scholar] [CrossRef]
  52. Gasser, P. A review on energy security indices to compare country performances. Energy Policy 2020, 139, 111339. [Google Scholar] [CrossRef]
  53. Liang, S.; Qu, S.; Zhao, Q.; Zhang, X.; Daigger, G.T.; Newell, J.P.; Miller, S.A.; Johnson, J.X.; Love, N.G.; Zhang, L.; et al. Quantifying the urban food–energy–water nexus: The case of the detroit metropolitan area. Environ. Sci. Technol. 2018, 53, 779–788. [Google Scholar] [CrossRef]
  54. Deshkar, S. Resilience Perspective for Planning Urban Water Infrastructures: A Case of Nagpur City. In Urban Drought; Springer: Singapore, 2019; pp. 131–154. [Google Scholar] [CrossRef]
  55. Holt, R. Global Cities, Which Cities will Be Leading the Global Economy in 2035; Oxford Economics: Oxford, UK, 2018. [Google Scholar]
  56. NSSCDCL. NSSCDCL Homepages. Available online: https://nsscdcl.org/aboutnsscdcl.jsp (accessed on 15 March 2022).
  57. Fernández, C.G.; Peek, D. Smart and Sustainable? Positioning Adaptation to Climate Change in the European Smart City. Smart Cities 2020, 3, 511–526. [Google Scholar] [CrossRef]
  58. NIT. Nagpur Metropolitan Area Development Plan: 2012-32, Draft Development Plan Report. Nagpur Improvement Trust (NIT). 2015. Available online: https://www.nitnagpur.org/pdf/Metro_Region_DP.pdf (accessed on 21 September 2021).
  59. Moher, D.; Liberati, A.; Tetzlaff, J.; Altman, D.G.; PRISMA Group. Preferred reporting items for systematic reviews and meta-analyses: The PRISMA statement. PLoS Med. 2009, 6, e1000097. [Google Scholar] [CrossRef] [Green Version]
  60. Baas, J.; Schotten, M.; Plume, A.; Côté, G.; Karimi, R. Scopus as a curated, high-quality bibliometric data source for academic research in quantitative science studies. Quant. Sci. Stud. 2020, 1, 377–386. [Google Scholar] [CrossRef]
  61. Paudel, S.; Kumar, P.; Dasgupta, R.; Johnson, B.; Avtar, R.; Shaw, R.; Mishra, B.; Kanbara, S. Nexus between Water Security Framework and Public Health: A Comprehensive Scientific Review. Water 2021, 13, 1365. [Google Scholar] [CrossRef]
  62. Hua, T.; Zhao, W.; Wang, S.; Fu, B.; Pereira, P. Identifying priority biophysical indicators for promoting food-energy-water nexus within planetary boundaries. Resour. Conserv. Recycl. 2020, 163, 105102. [Google Scholar] [CrossRef]
  63. Saladini, F.; Betti, G.; Ferragina, E.; Bouraoui, F.; Cupertino, S.; Canitano, G.; Gigliotti, M.; Autino, A.; Pulselli, F.; Riccaboni, A.; et al. Linking the water-energy-food nexus and sustainable development indicators for the Mediterranean region. Ecol. Indic. 2018, 91, 689–697. [Google Scholar] [CrossRef]
  64. Cansino-Loeza, B.; Sánchez-Zarco, X.G.; Mora-Jacobo, E.G.; Saggiante-Mauro, F.E.; González-Bravo, R.; Mahlknecht, J.; Ponce-Ortega, J.M. Systematic Approach for Assessing the Water–Energy–Food Nexus for Sustainable Development in Regions with Resource Scarcities. ACS Sustain. Chem. Eng. 2020, 8, 13734–13748. [Google Scholar] [CrossRef]
  65. Haji, M.; Govindan, R.; Al-Ansari, T. Novel approaches for geospatial risk analytics in the energy–water–food nexus using an EWF nexus node. Comput. Chem. Eng. 2020, 140, 106936. [Google Scholar] [CrossRef]
  66. Liu, Q. Interlinking climate change with water-energy-food nexus and related ecosystem processes in California case studies. Ecol. Process. 2016, 5, 389. [Google Scholar] [CrossRef] [Green Version]
Figure 1. Location map of Nagpur city.
Sustainability 14 08123 g001
Figure 2. PRISMA flowchart for the study.
Sustainability 14 08123 g002
Figure 3. Methodology for development of framework.
Sustainability 14 08123 g003
Figure 4. Final dimension wise FEW security scores for 10 zones of Nagpur city.
Sustainability 14 08123 g004
Figure 5. Overall security scores for 10 zones of Nagpur City.
Sustainability 14 08123 g005
Table 1. Highlighting the focus of urban level indicators in FEW security domain.
StudyRegional/Global Level IndicatorsLocal/Urban Level Indicators
FoodEnergyWaterFoodEnergyWater
Arshad 2012
Chuang 2013
Nilsson et al. 2013
Flammini et al. 2014
Rasul 2016
Saladini 2018
Jensen 2018
Adhikari 2018
Prumbadia 2019
Ibrahim et al. 2019
Gesauldo 2019
Markentonis 2019
Putra 2020
Casino-Loeza 2020
Haji et al. 2020
Mabhaudi 2021
Table 4. Characteristics of the survey respondents.
Number of Surveys243
AttributeResponse Percentage
Gender Group
Male52.26%
Female47.74%
Other0.00%
Household Size (Average Household size = 4.2)
<331.69%
4 to 553.09%
6 to 812.76%
>82.47%
Area of Residence (Zone wise categorization of city area)
Ashi Nagar10.29%
Dhantoli11.52%
Dharampeth16.05%
Hanuman nagar11.11%
Laxminagar13.58%
Nehrunagar7.82%
Gandhibagh7.41%
Lakadganj6.17%
Mangalwari7.82%
Satranjipura8.23%
Income Group (INR)
<20,00021.40%
20,000 to 40,00021.40%
40,000 to 80,00017.28%
80,000 to 1.25 lac21.81%
>1.25 lac18.11%
Publisher’s Note: MDPI stays neutral with regard to jurisdictional claims in published maps and institutional affiliations.

