Abstract
With the development of micro gas turbines (MT) and power-to-gas (P2G) technology, the electric–gas system plays an important role in maintaining the stable, economical, and flexible operation of the microgrid. When subjected to power load disturbance and natural gas load disturbance, the system controller needs to coordinately control the frequency of the microgrid and the gas pressure at the natural gas pipeline nodes. Additionally, the reliability and stability of a multi-microgrid system are much higher than that of a single microgrid, but its control technology is more complicated. Thus, a frequency–pressure cooperative control strategy of a multi-microgrid oriented to an electric–gas system is proposed in this paper. Firstly, based on the analysis of the operating characteristics of the natural gas network and the coupling equipment, the dynamic model of natural gas transmission is built. Secondly, a multi-microgrid load frequency control model including MT, P2G equipment, electric vehicles (EVs), distributed power sources and loads has been established. In addition, according to the three control objectives of microgrid frequency, node pressure and system coordination and stability, the structure of a Muti-Agent Deep Deterministic Policy Gradient (MADDPG) controller is designed, then the definition of space and reward functions are completed. Finally, different cases are set up in the multi-microgrid, and the simulation results are compared with PI control and fuzzy control. The simulation results show that, the proposed MADDPG controller can greatly suppress the frequency deviation caused by wind power and load disturbances and the air pressure fluctuations caused by natural gas network load fluctuations. Additionally, it can coordinate well the overall stability between the sub-microgrids of multi-microgrid.
1. Introduction
With the rapid economic development, energy shortages and environmental pollution problems have gradually become prominent [1,2]. China and most countries in the world take the construction of a green, low-carbon and clean energy Internet as a strategic goal and vigorously support the development and access of renewable energy [3]. The energy Internet is an energy peer-to-peer exchange and sharing network that can connect new power networks, oil networks, natural gas networks and other energy nodes. Power-to-Gas (P2G) technology is an important means to realize energy transmission and distribution in the energy Internet, which can realize joint operation with renewable energy power generation and change the direction of energy flow between the power system and natural gas from the traditional one-way to two-way [4]. However, compared with a single microgrid and natural gas network, the structure of the P2G coupling network is more complex, and the relationship between the systems through the equipment coupling is more diverse and flexible, which undoubtedly increases the operation and control difficulty of the P2G coupling network [5].
First of all, the structural design and control model of the natural gas network is the research foundation of the P2G interconnection system [6,7]. In the research of natural gas network structure, the dynamic characteristic of gas pipelines is modeled with energy storage capability in [8], and a cooperative dispatching strategy for P2G and pipeline storage capability is presented. In [9], a dynamic model of gas network pipelines is also used to establish the online optimal dispatching model of the integrated energy system. Additionally, regarding the research of natural gas network control methods, a comprehensive non-combination of wind turbines, gas turbines, electric-to-gas turbines, transmission lines and natural gas pipelines in the gas–electric integrated system linear programming model is established in [10], and a collaborative planning method for gas–electric systems based on non-cooperative game theory is proposed. In [11], a control algorithm using radial basis function neural network to optimize controller parameters is proposed for the complex non-linear regulator model, which can effectively improve the control accuracy, response speed and dynamic tracking performance of the voltage regulator. However, with the development of the P2G interconnection system, the operation status of the natural gas net-work side will be more complicated, so the load disturbance of the natural gas network and the microgrid can affect the frequency and pressure balance of the system together. Meanwhile, the P2G system also carries the task of multi-energy complementation with the grid, and the stability puts forward higher requirements. Thus, the above natural gas network control method for a single scenario cannot well coordinate various units in the microgrid to participate in the stable control of natural gas and realize the stable operation of the natural gas network under a variety of operating conditions.
Secondly, when the microgrid is in an islanded mode, the switch at the public connection point between the upper-level grid and the microgrid is disconnected, and power support can no longer be provided. It is necessary to control the distributed power supply in the microgrid to provide frequency support for the microgrid [12,13]. In the P2G inter-connection system, the MT and P2G equipment, as stable micro sources and controllable loads on the microgrid side, also have the ability to participate in the stability control of the microgrid. In [14], a nonlinear control model of wind power accommodation for an electricity-heat-gas integrated microgrid with P2G is proposed, which can meet the demand for electricity, heat, gas loads, and the security constraints of the electricity microgrid. In [15], a strategy to regulate and control the frequency of the microgrid through EVs and controllable natural gas loads is proposed. Moreover, the simulation is carried out in a power system including large-scale wind power and photovoltaic power generation to verify the effectiveness of this method for load frequency control. However, the above-mentioned research is only aimed at the frequency control problem of microgrid containing natural gas system, which obviously cannot satisfy the cooperative the control between the whole systems of microgrid frequency and natural gas network air pressure.
In addition, the core unit of the microgrid frequency control system is the load frequency controller, and its control effect is critical to whether the microgrid can perform effective frequency modulation and whether the P2G interconnection system can be coordinated [16]. In the current research, a variety of control methods have been applied to the design of load frequency controllers. In [17], a coordinated operation strategy for a microgrid that uses P2G technology to produce natural gas from abandoned wind and participates in frequency modulation is proposed. Furthermore, based on the actual abandonment of a wind farm and the actual command issued by an automatic power generation control (AGC) unit, the particle swarm optimization algorithm is used to perform verification calculations. In [18], a load frequency controller is designed for the simultaneous participation of a MT, electrolytic cells and EVs, and the PI control parameters are optimized based on the hybrid leapfrog algorithm of H2/H∞ control technology. However, in the P2G interconnection system, the state parameters and operating conditions of the microgrid have been changing due to the fluctuation of renewable energy and the coupling of the network. The traditional control method is difficult to ensure the stability of the microgrid under complex and changeable operating conditions, and it can only deal with the frequency modulation problem of the microgrid alone but cannot coordinate the control of microgrid and natural gas network greatly.
Meanwhile, with the proposal of the multi-regional energy Internet, the multi-microgrid system (MMS) formed by the interconnection of multiple sub-microgrids has developed rapidly. However, the strong random disturbance brought by the access of large-scale new energy sources and the power exchange between multiple microgrids bring more challenges to the multi-energy cooperative control of the MMS. Methods such as classical control [19], adaptive control [20], and robust control [21] cannot save the experience and knowledge of past tasks and need to be re-initialized in the face of various complex operating conditions so that the response speed of the control is slowed down and the performance is deteriorated.
In summary, an P2G interconnection system with MTs and P2G equipment as the coupling link is modeled, and the interactive characteristics of the microgrid and natural gas network are obtained from this. Thus, a load frequency control strategy of islanded microgrid based on DDPG is proposed in this paper, which is oriented to P2G system. The main contributions are as follows:
- (1)
- A frequency–pressure cooperative control structure of multi-microgrid with electric-gas system is proposed. Based on the analysis of the operating characteristics of the natural gas network and the coupling equipment, the natural gas network model and the P2G system coupling model are established. The coordinated transformation of the electrical coupling system in the two modes of the gas determined by power (GDP) and the power determined by gas (PDG) is realized, which provides a model basis for the coordinated control of frequency and natural gas pressure.
- (2)
- In order to coordinate power transmission between multiple microgrids and realize coordination and cooperation, the MADDPG algorithm with the cooperative control idea of “centralized training, decentralized execution” is proposed to design the frequency controller for the multi-microgrid. Moreover, on the basis of the two areas of the IEEE standard, the area control error (ACE) is used as one of the state spaces in the design process of the controller so as to obtain the optimal solution of multi-microgrid coordination quickly and accurately in the control process.
- (3)
- In order to coordinate the control of the frequency of the microgrid and the air pressure of the natural gas network, the structure and the reward function of the MADDPG controller is designed according to the two control objectives in order for it to meet the two control goals of the frequency of the microgrid and the air pressure of the natural gas network together.
The remainder of this paper is organized as follows. In Section 2, the natural gas network model and the P2G system coupling model are established. The load frequency control structure of multi-microgrid is introduced in Section 3. The load frequency controller based on MADDPG is introduced in Section 4. The simulation results are presented and analyzed in Section 5, and the conclusions are summarized in Section 6.
2. The Model of the Power-to-Gas System
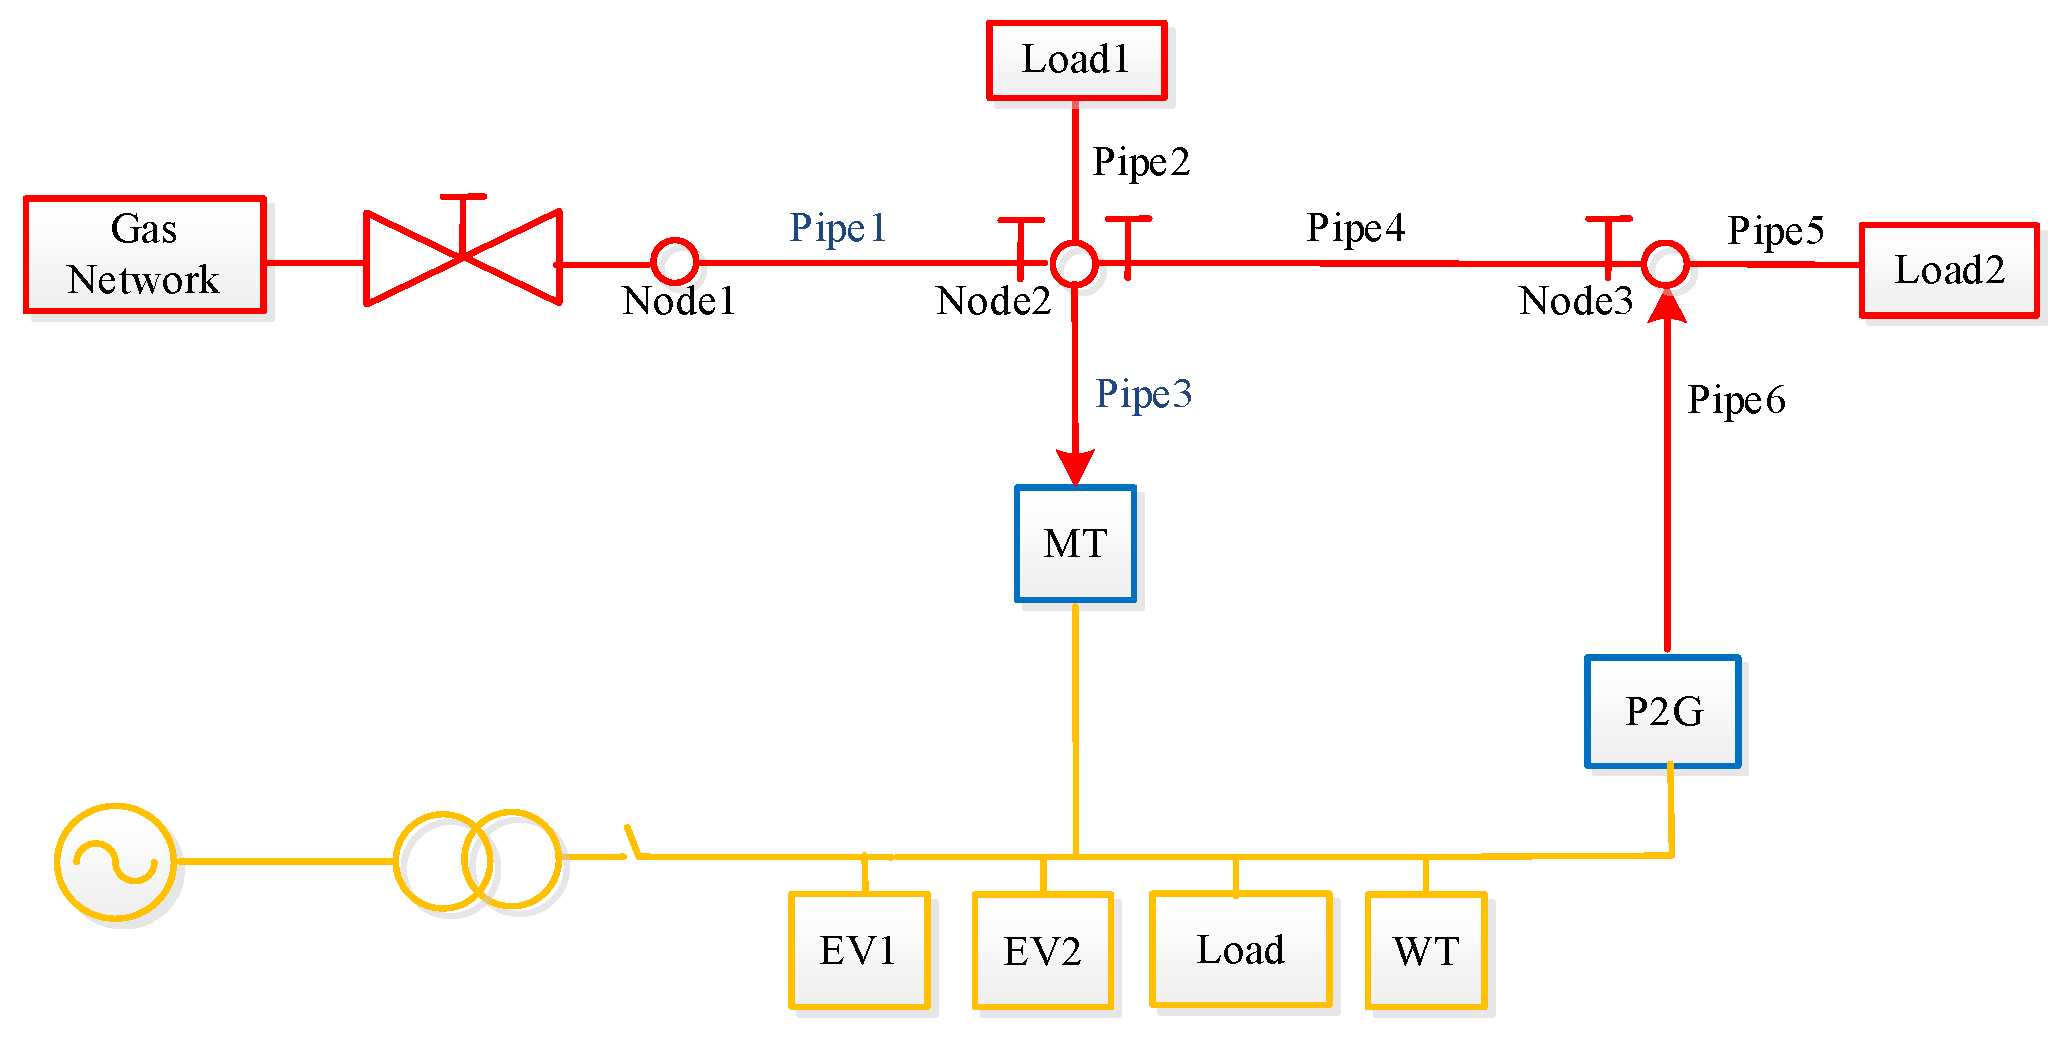
As the connection between the power grid and the natural gas network is getting closer, the construction of the P2G interconnection model and the mutual influence be-tween the two networks have received more and more attention [22]. The microgrid model in this paper includes EVs, distributed power sources, MTs and ordinary loads, while the natural gas network model includes natural gas transmission pipelines, pressure regulating valves and shut-off valves, which together constitute the model of the P2G inter-connected terminal integrated energy system [23], as shown in Figure 1.

Figure 1.
The model of the P2G interconnected terminal integrated energy system.
2.1. The Model of Natural Gas Network
When the interactive characteristics of the P2G interconnection system is being studied, the operation status of the grid side changes rapidly and the time scale is very short. Therefore, when establishing a natural gas pipeline model, it is necessary to consider the dynamic process of the natural gas pipeline operating state change and establish its dynamic model.
Additionally, because the natural gas terminal system covers a small area, the radial change of natural gas flow can be ignored. The natural gas flow change of the natural gas pipeline can be assumed to be a one-dimensional fluid, and the pressure, flow rate and density only change with time and the axial position in the pipeline, as shown in Figure 2.
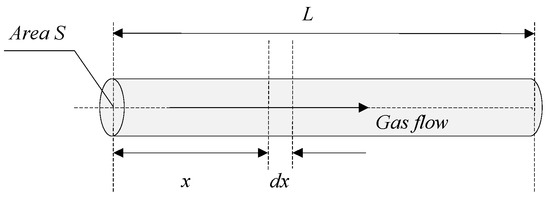
Figure 2.
Natural gas flow in natural gas pipeline.
According to the law of conservation of mass and Newton’s second law of motion, the dynamic natural flow can be described by the following Formulas (1) and (2). Additionally, because the pipeline length of the low-pressure natural gas network is usually several hundred meters, it is shorter than the pipelines of the medium-pressure network and the high-pressure network. Therefore, according to the law of conservation of mass, Newton’s second law of motion, and the idea of finite element approximation, the dynamic natural gas flow in a short natural gas pipeline can be described in the form of ordinary differential Equations (3) and (4) [24]:
where pin and pout are the air pressure at the inlet and outlet of the natural gas pipeline, Min, Mout are the flow at the inlet and outlet of the pipeline, c is the sound propagation speed in the natural gas pipeline, D is the diameter of the pipeline, S is the cross-sectional area of the pipeline, L is the length of the pipeline, f is the friction coefficient of the pipeline, ρ is the density of natural gas, ω is the flow rate of natural gas in the pipeline, and x is the distance.
Furthermore, because the friction coefficient and pipeline diameter of the natural gas pipeline are constant, the friction coefficient is typically 0.003. Then, in Equations (1) and (2), there are only four variables, namely pin, pout, Min and Mout. For a section of natural gas pipeline, when two variables are given, the values of the other two variables can be solved.
In this low-pressure natural gas network, the pressure regulating valve functions as a step-down transformer in the power grid, which reduces the air pressure and maintains the outlet air pressure to track the set reference value. The dynamic characteristics of the pressure regulating valve can be simplified as:
where r is the variable ratio of the pressure regulating valve, Kr is the proportional control coefficient in the pressure regulating valve, and pout_ref is the air pressure reference value at the outlet of the pressure regulating valve.
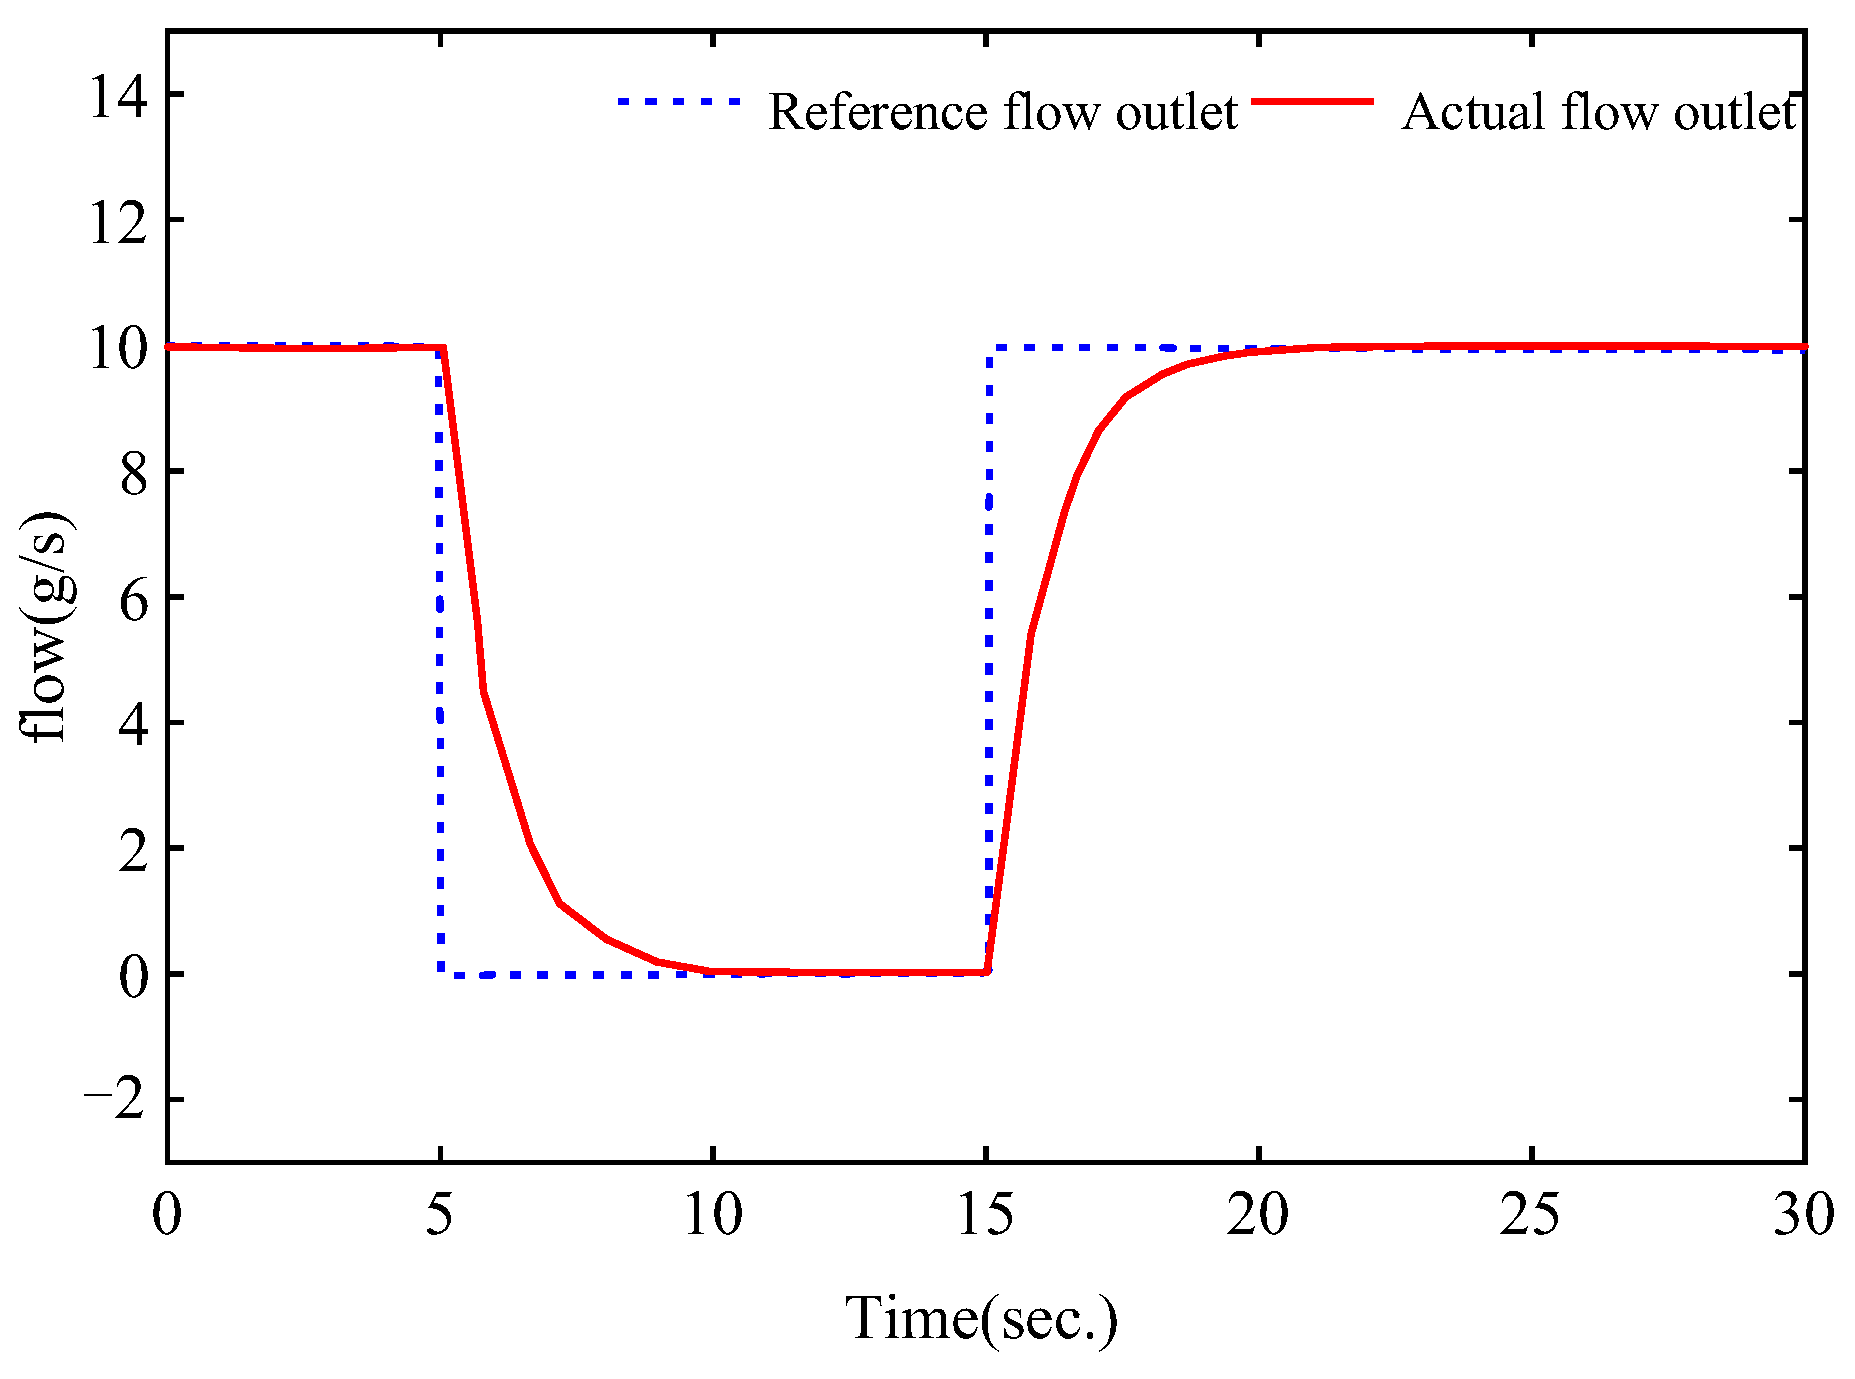
Thus, a pressure regulator model can be built to test its dynamic characteristics. When the outlet reference pressure of the pressure regulating valve changes, its outlet pressure and pressure regulation ratio can change accordingly, as shown in Figure 3. It can be seen that the pressure regulating valve model can track the target outlet pressure well. Meanwhile, when a leak is detected in a natural gas pipeline, the shut-off valves at both ends of the pipeline can be controlled to shut off, and the natural gas supply of the faulty pipeline can be cut off in time to prevent the leakage from further expanding and cause safety accidents. Its dynamic characteristics are shown in Figure 4. It can be seen that the shut-off valve can effectively cut off the flow of the natural gas network.
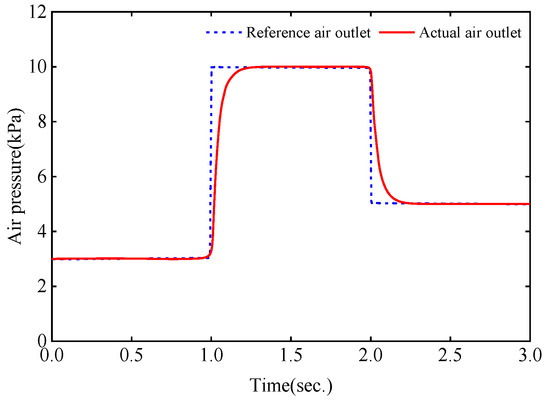
Figure 3.
Dynamic response of pressure regulator outlet pressure.
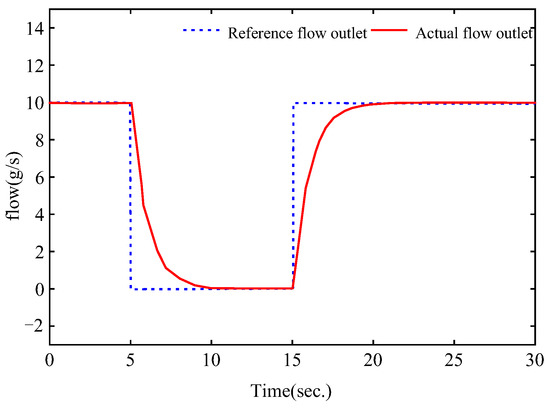
Figure 4.
Dynamic response of shut-off valve outlet flow.
2.2. Coupling Relationship of Power-to-Gas System
As shown in Figure 1, in the P2G interconnection system, the microgrid and the natural gas network are connected to P2G equipment through MTs, and the coupling between the microgrid and the natural gas network is also caused by changes in the operating state of the coupling equipment.
The active power output by the MT is related to the amount of gas, and the rate of methane production by the P2G equipment is related to the active power consumed. Since the operating status of the MT and P2G equipment can be determined by the demand on the microgrid side or the demand on the natural gas network, the operation modes of the two can be divided into two modes: gas determined by power (GDP) and power determined by gas (PDG): When working in the GDP mode, the micro gas turbine is equivalent to a stable distributed power source, and the P2G device is equivalent to a controllable electric load; when working in the PDG mode, the P2G device is a stable gas source, and the micro gas turbine is a controllable gas load.
In the internal control system of the MT, the output active power is regulated by the DDPG controller. The block diagram of the control system is shown in Figure 5.
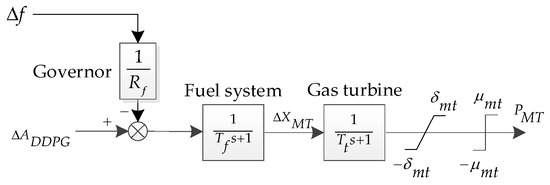
Figure 5.
The power control block diagram of micro gas turbine.
Where, the fuel system and the gas turbine adopt the first-order inertia link to be equivalent, ∆ADDPG is the control signal sent by the agent DDPG, ∆XMT is the state quantity that characterizes the valve position change of the fuel system, Tf and Tt are the time constants of the fuel system and the gas turbine respectively, ±δMT is the power climbing constraint of the micro gas turbine, ±μMT is the power variation constraint. The working mode of the micro gas turbine control system is adjusted by the DDPG controller.
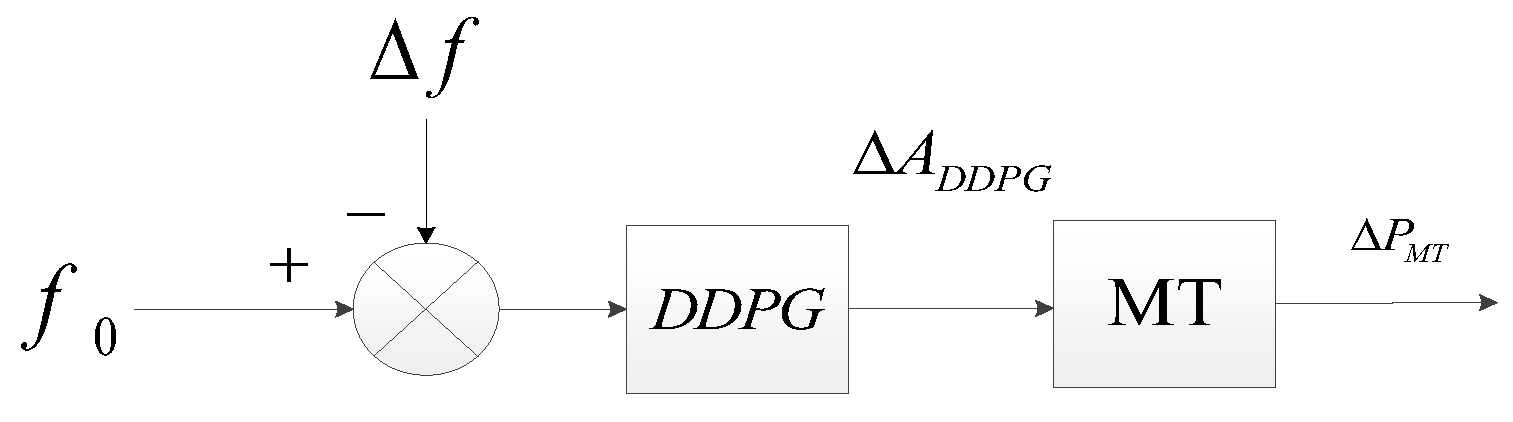
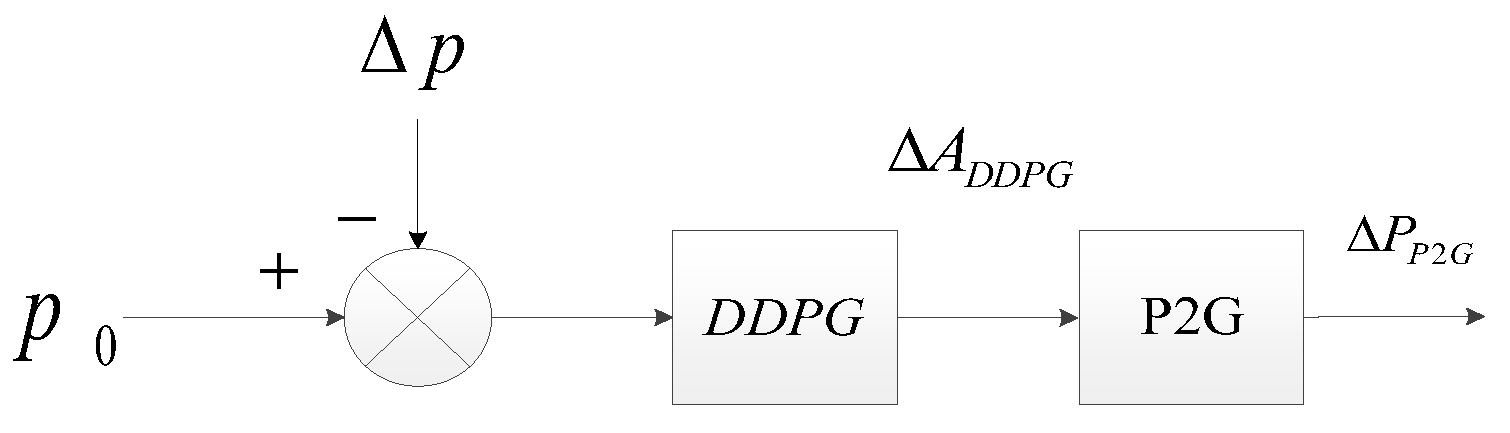
When the control system works in the GDP mode, it can adjust the output active power of the gas turbine by adjusting the gas volume of the gas turbine according to the frequency of the microgrid so as to realize the functions of frequency modulation. The block diagram of FM control is shown in Figure 6. Additionally, when the control system works in the PDG mode, it can adjust the MT’s intake air volume according to the change of the gas pressure at the node of the natural gas network in order to adjust the air pressure at the inlet end to further maintain the node air pressure. The block diagram of natural gas pressure balance control is shown in Figure 7.
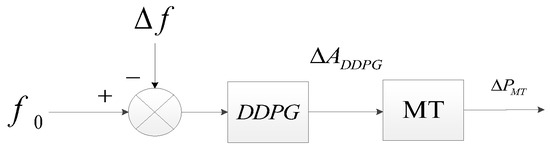
Figure 6.
The DDPG control signal during frequency modulation in the mode of gas determined by power.

Figure 7.
The DDPG control signal during gas pressure modulation in the mode of power determined by gas.
3. Load Frequency Control Model of Multi-Microgrid
Frequency determines the quality of electric energy, and air pressure determines the quality and safety of gas supply. Therefore, in the P2G interconnected terminal system, the frequency stability of the microgrid and the gas pressure stability of the natural gas network are very important for improving the quality of energy supply and the stability of the integrated energy system. For a multi-microgrid system, the controller needs to coordinate and control the unit output of each sub-microgrid, and select the control command that is most conducive to the overall stability of the system for various operating conditions. Therefore, this section analyzes the load frequency responses of MT, P2G equipment, EV stations, distributed power sources and loads in the microgrid, and constructs a multi-microgrid load frequency control model by introducing the ACE and power coupling links.
3.1. Load Frequency Control Model of P2G Equipment
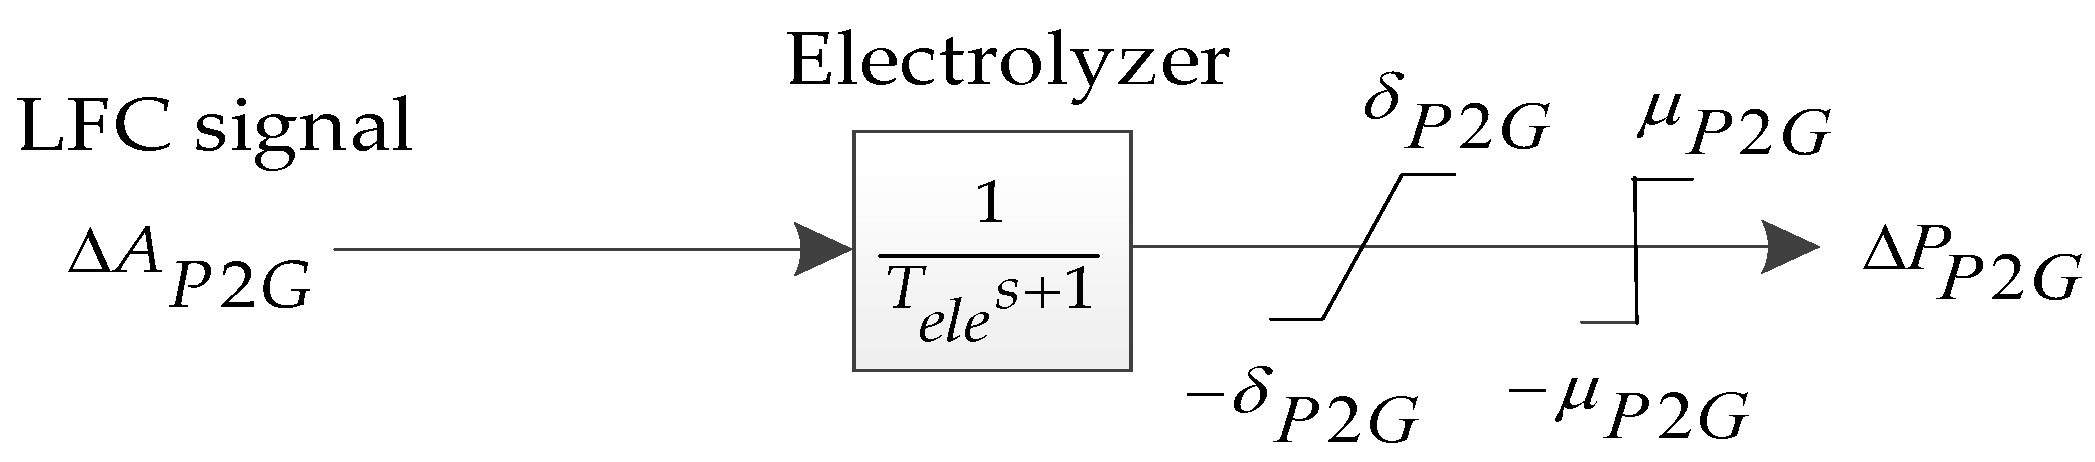
The role of P2G equipment is equivalent to virtual energy storage. The P2G electrolyzer can adjust the voltage amplitude of the DC voltage source through the rectified Buck circuit and realize power adjustment by changing its electrolysis current. Since the gas flow rate supplied by P2G equipment to the natural gas network is small, and the duration of frequency adjustment is very short, its frequency control model does not need to consider the influence of natural gas users and has the advantage of fast response speed. The frequency control response model of P2G equipment is shown in Figure 8:

Figure 8.
The frequency control response model of P2G equipment.
Where, ∆uP2G is the load frequency control signal received by the P2G equipment, Tele is the time constant of the electrolytic cell, ±δP2G is the upper and lower limits of the power change rate constraint, ±μP2G is the upper and lower limits of the power increment constraint, and ∆PP2G is the power increment of the P2G device.
3.2. Load Frequency Control Structure of a Multi-Microgrid Based on MADDPG
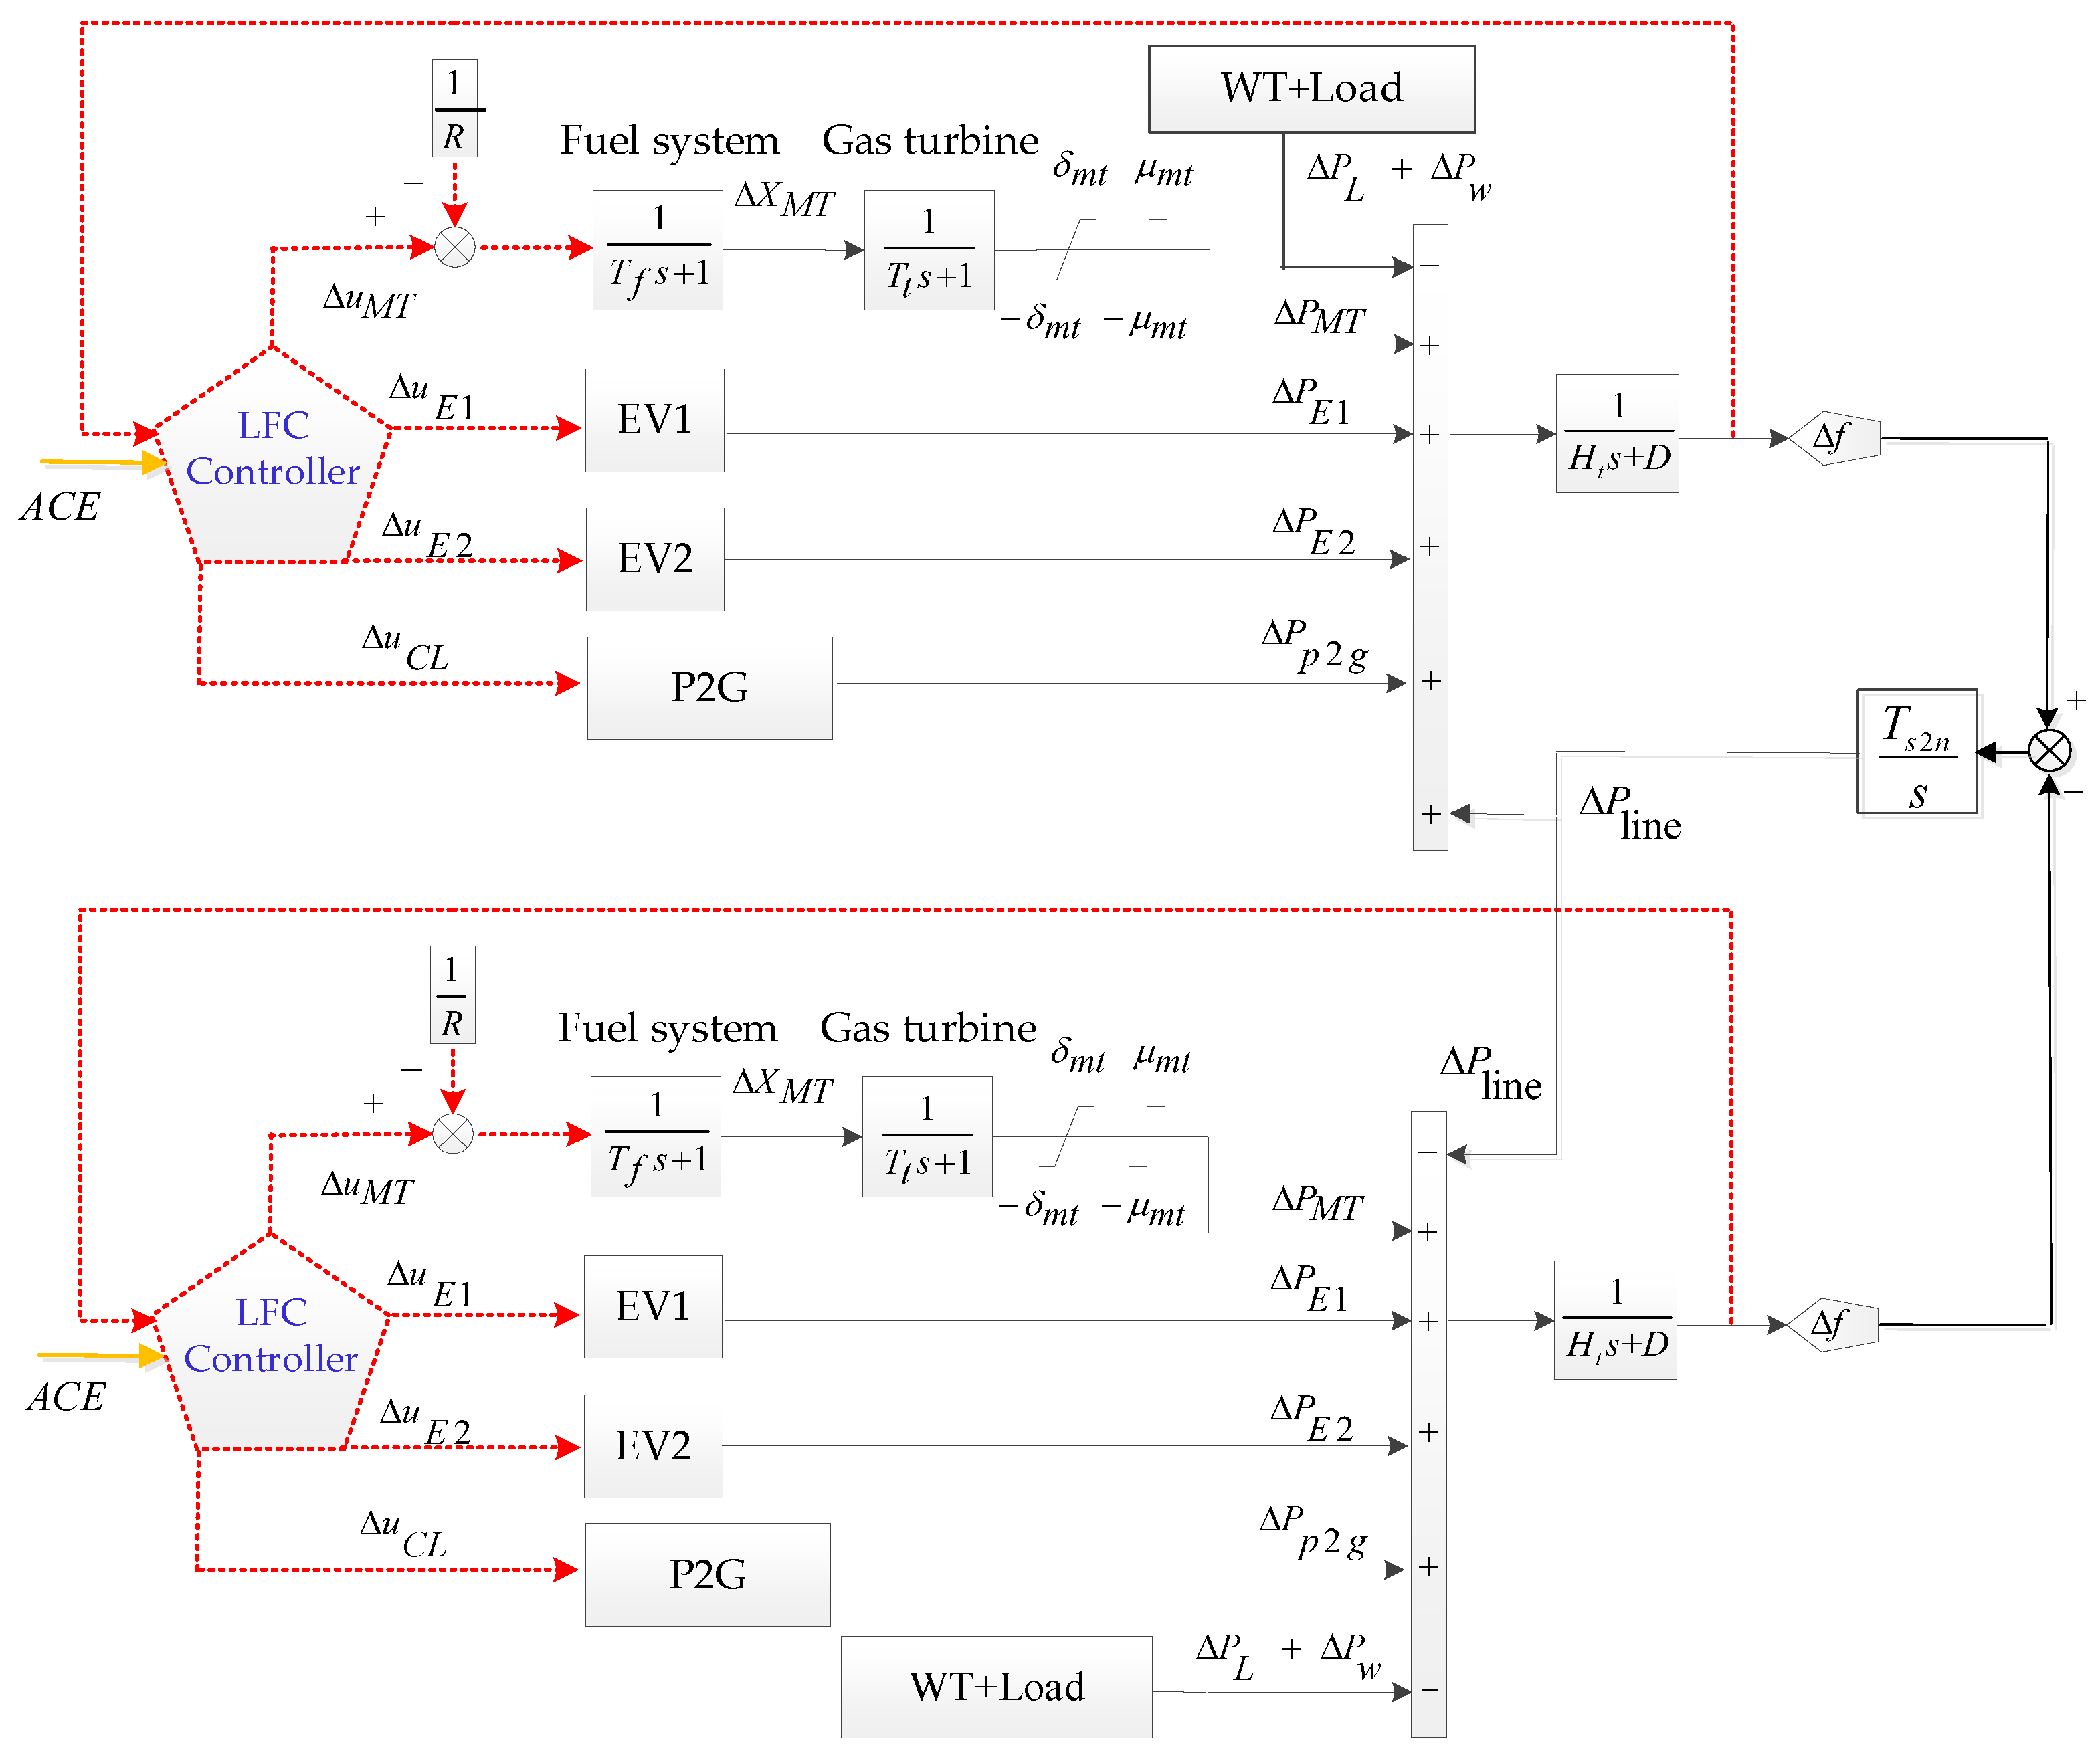
Based on the above, the wind power, micro gas turbines [25], and electric vehicle charging stations [26] are used to establish a multi-microgrid load frequency control model in this paper, as shown in Figure 9. Among them, wind power has great uncontrollability, so it is only treated as a random load, MT is used as the main frequency modulation unit, and EV stations are used as auxiliary frequency modulation units to ensure the flexibility of microgrid regulation [27].
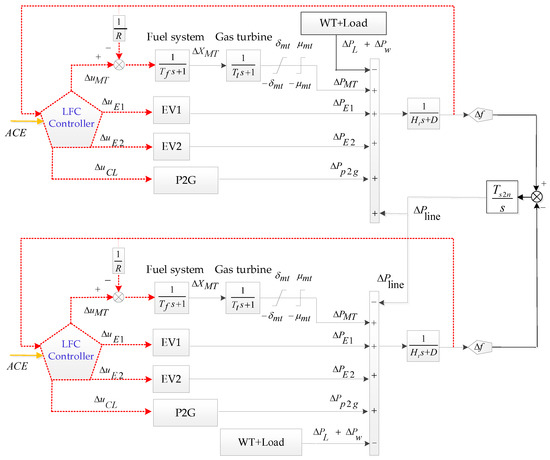
Figure 9.
Frequency control model of multi-microgrid.
Where, ΔPL is the load disturbance power, ΔPW is the wind disturbance power, ΔPMT is the power variation of MT, ΔPEV is the power variation of EVs, ΔPP2G is the power variation of P2G, ΔPline is the power variation of tie-line, Ht is the constant of inertia of the microgrid, Tsij is the coupling link parameter, ACE is the area control error, which is a signal used to coordinate the two controllers.
4. Load Frequency Controller of Islanded Microgrid Based on MADDPG
In the multi-microgrid with P2G equipment, it is important to maintain the stability of the microgrid frequency and gas network pressure. However, due to fluctuations in the output of wind turbines and natural gas flow, it would inevitably cause the microgrid frequency and natural gas network pressure to deviate from the standard value.
Furthermore, DDPG has the advantages of online learning and experience playback capabilities, which can effectively solve the control problems in nonlinear systems [28]. Meanwhile, compared to the Q-learning algorithm, which cannot process continuous signals, DDPG learning can be performed in a continuous action space [29] without discretizing the action space. Therefore, it can better realize the precise control of each unit in the microgrid, which is suitable for the design of this paper. Therefore, this paper designs a load frequency controller of multi-microgrid based on MADDPG, which can adjust the output power of the unit in the microgrid through the frequency deviation and the change of the air pressure so that the frequency and the air pressure can be stabilized.
4.1. Theoretical Analysis of DDPG
In this model, the fluctuation of random power supply and load, the random output boundary of EV and the real-time frequency deviation are all complex nonlinear data that are difficult to quantify. The combination of deep neural network and reinforcement learning can effectively process large-scale data. It can rely on the data in the microgrid model in this paper to give real-time decisions according to the corresponding operating requirements and optimization goals and obtain the optimal control scheme and optimization strategy [30]. Therefore, this paper takes the state vector S as the input sequence through the convolutional neural network and passes through the long short-term memory network (LSTM) in the convolutional neural network. Then, the output will enter the fully connected layer and finally get the approximated Q value in the output layer; the network structure diagram is shown in Figure 10.
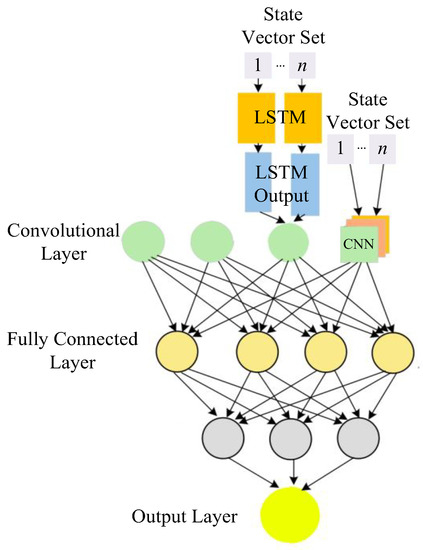
Figure 10.
The network structure diagram.
There are four networks in DDPG: actor target network (ATN), actor current network (ACN), critic target network (CTN) and critic current network (CCN).
At t, the parameter of ACN is θ, the parameter of ATN is θ’, the parameter of CCN is ω, and the parameter of CTN is ω’. Among them, the action at can be generated according to the current status st by the ACN. The action at+1 at the t+1 time can be generated according to the subsequent state of the environment by the ATN. The value Rt corresponding to the status st and action at can be calculated by the CCN. The value of Q’ (st+1, at+1|ω’), which is used to calculate the target value y, can be generated by the CTN based on subsequent state st+1 and action at+1, as shown in the Formula (8):
where, γ is a discount factor and 0 < γ < 1.
Meanwhile, the ω of CCN and the θ of ACN are updated through the gradient of the neural network, as shown in the Formulas (9) and (10):
where, m is the number of samples, yj is the target value of the j sample, Q(sj,aj,ω) is the output value of the CCN for the j sample, πθ(⋅) is the output value of the ACN.
Further, the parameters of CCN and ATN can be updated by Equation (11):
where, τ is an update coefficient, which is generally small.
Moreover, the termination function E is used to determine whether the Agent enters the termination: If it does, the iterative process stops, and a new round of state sequence starts. Otherwise, the iterative process can be continued.
In summary, the sample unit {s, a, R, s’, E} is stored in the empirical playback set D. Then the m sample units of the set D are trained for T rounds using Equations (8)–(11), and the training step length of each round is Tm.
4.2. Theoretical Analysis of MADDPG
In addition, the theoretical basis of MADDPG is the Markov game, which is an extension of Markov decision process under multi-agent conditions [31]. In a multi-agent environment, the Markov game of N agents consists of the following elements:
- (1)
- State S, which can describe all possible configurations of all agents;
- (2)
- Actions A1,…,AN of each agent;
- (3)
- Observations O1,…,ON of each agent.
The goal of each agent is to maximize its final expected reward, and its calculation formula is as follows.
where, γ is the discount factor, which can affect the convergence speed and training stability of the agent; ri is the reward value of each agent.
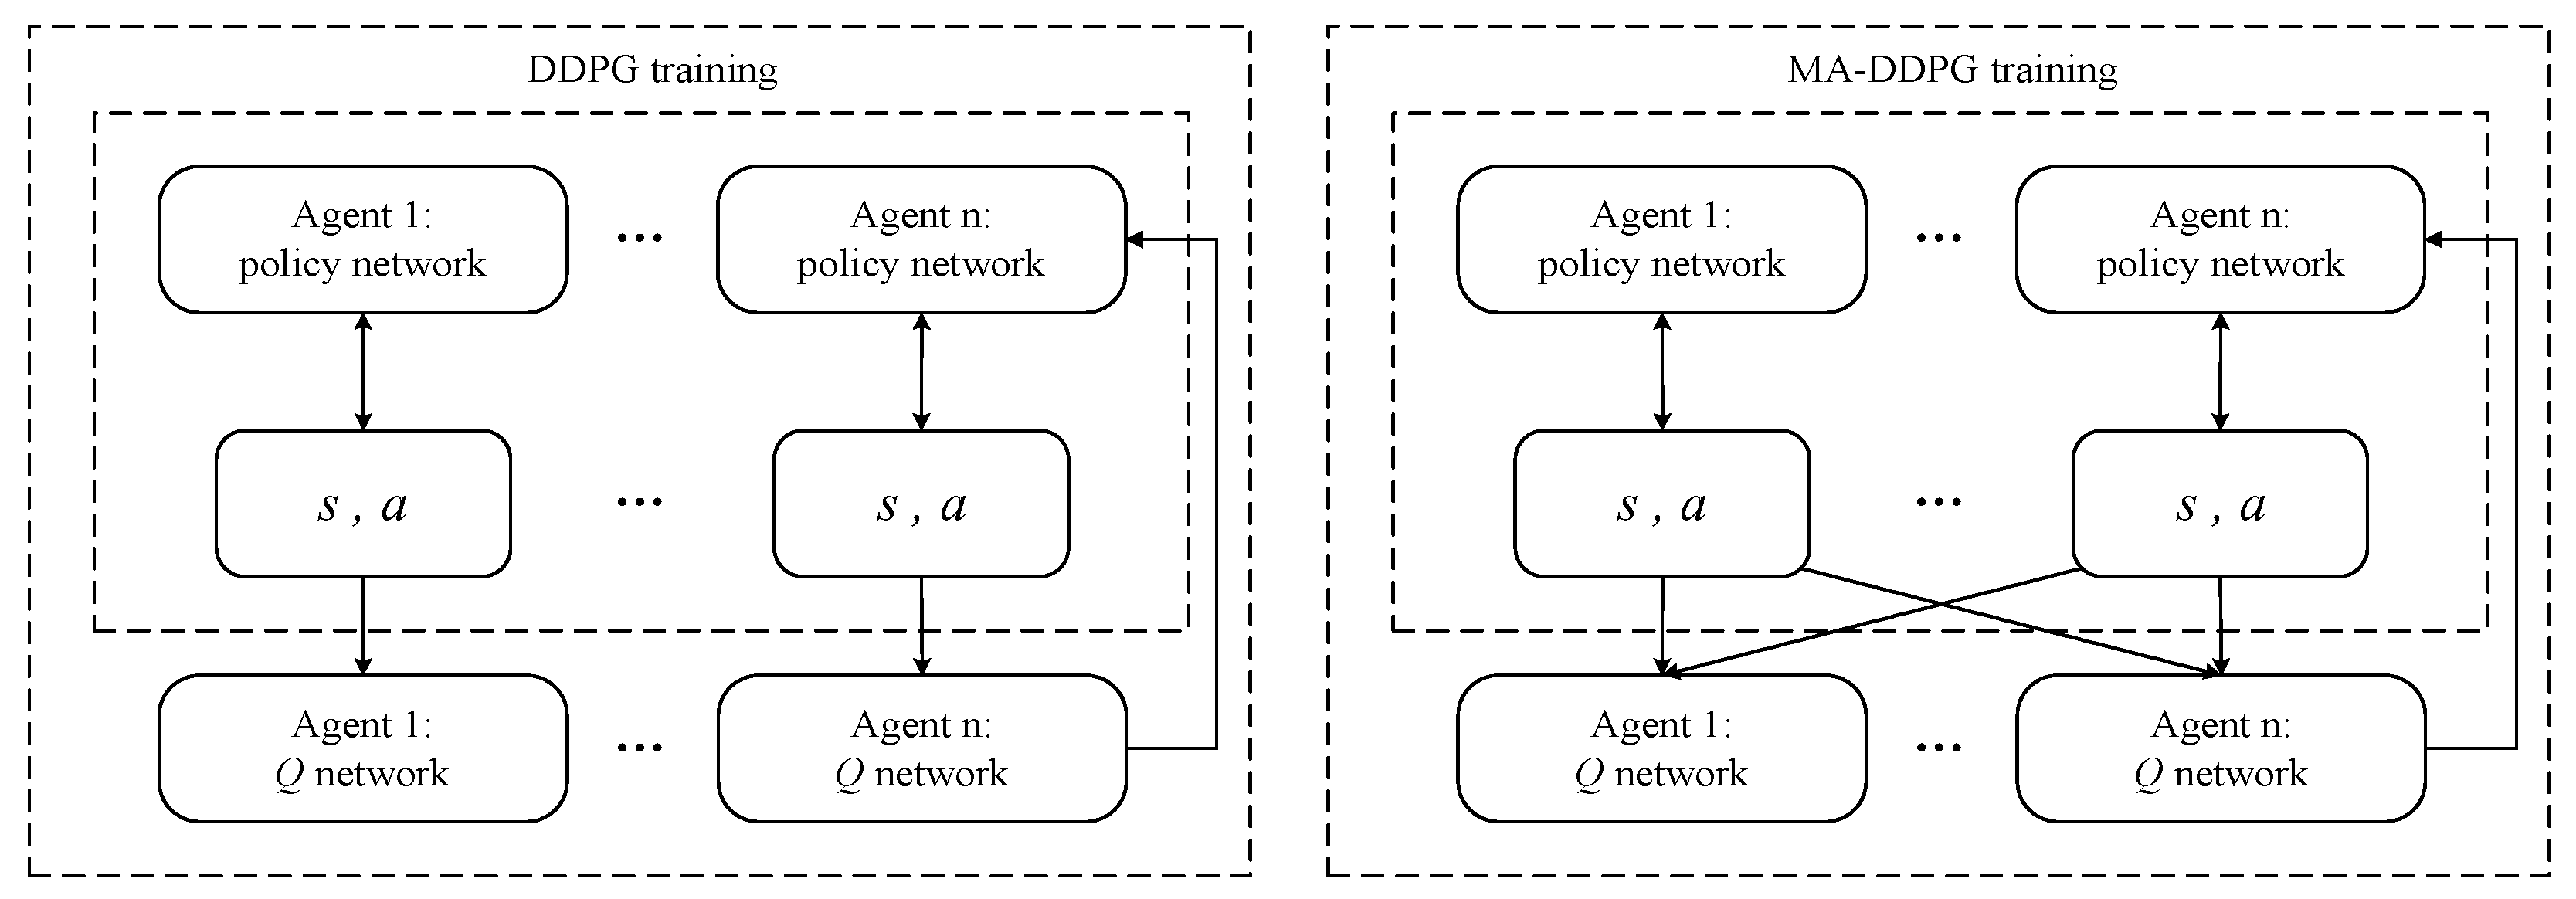
The structural comparison of MADDPG and DDPG is shown in Figure 11. Among the actor–critic network in each agent, the network framework adopts the mode of centralized training and decentralized execution as shown in Figure 11: Critic (Q network) can obtain global information (s1, s2,…,sn) and global actions (a1, a2,…,an); Actor (policy network) can only make actions based on local observations. The learning process of MADDPG is similar to the above-mentioned DDPG algorithm, and its objective function is shown in Formula (13) [32]:
where, other_s_a is the states and actions of other attackers and defenders. For the states and actions at the next time instant other_s′_a′, the states other_s′ are from the replay buffer, and the related actions other_a′ are obtained through the delayed policy network.
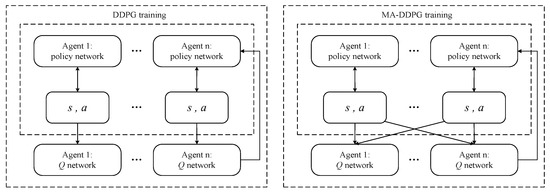
Figure 11.
The structural comparison of MADDPG and DDPG.
The update of the gradient is shown in Equation (14), and the objective function of the policy network is shown in Equation (15):
From this, the gradient can be calculated by Equation (16), and calculate the final update of the gradient by Equation (17):
4.3. Definition of State Space and Action Space
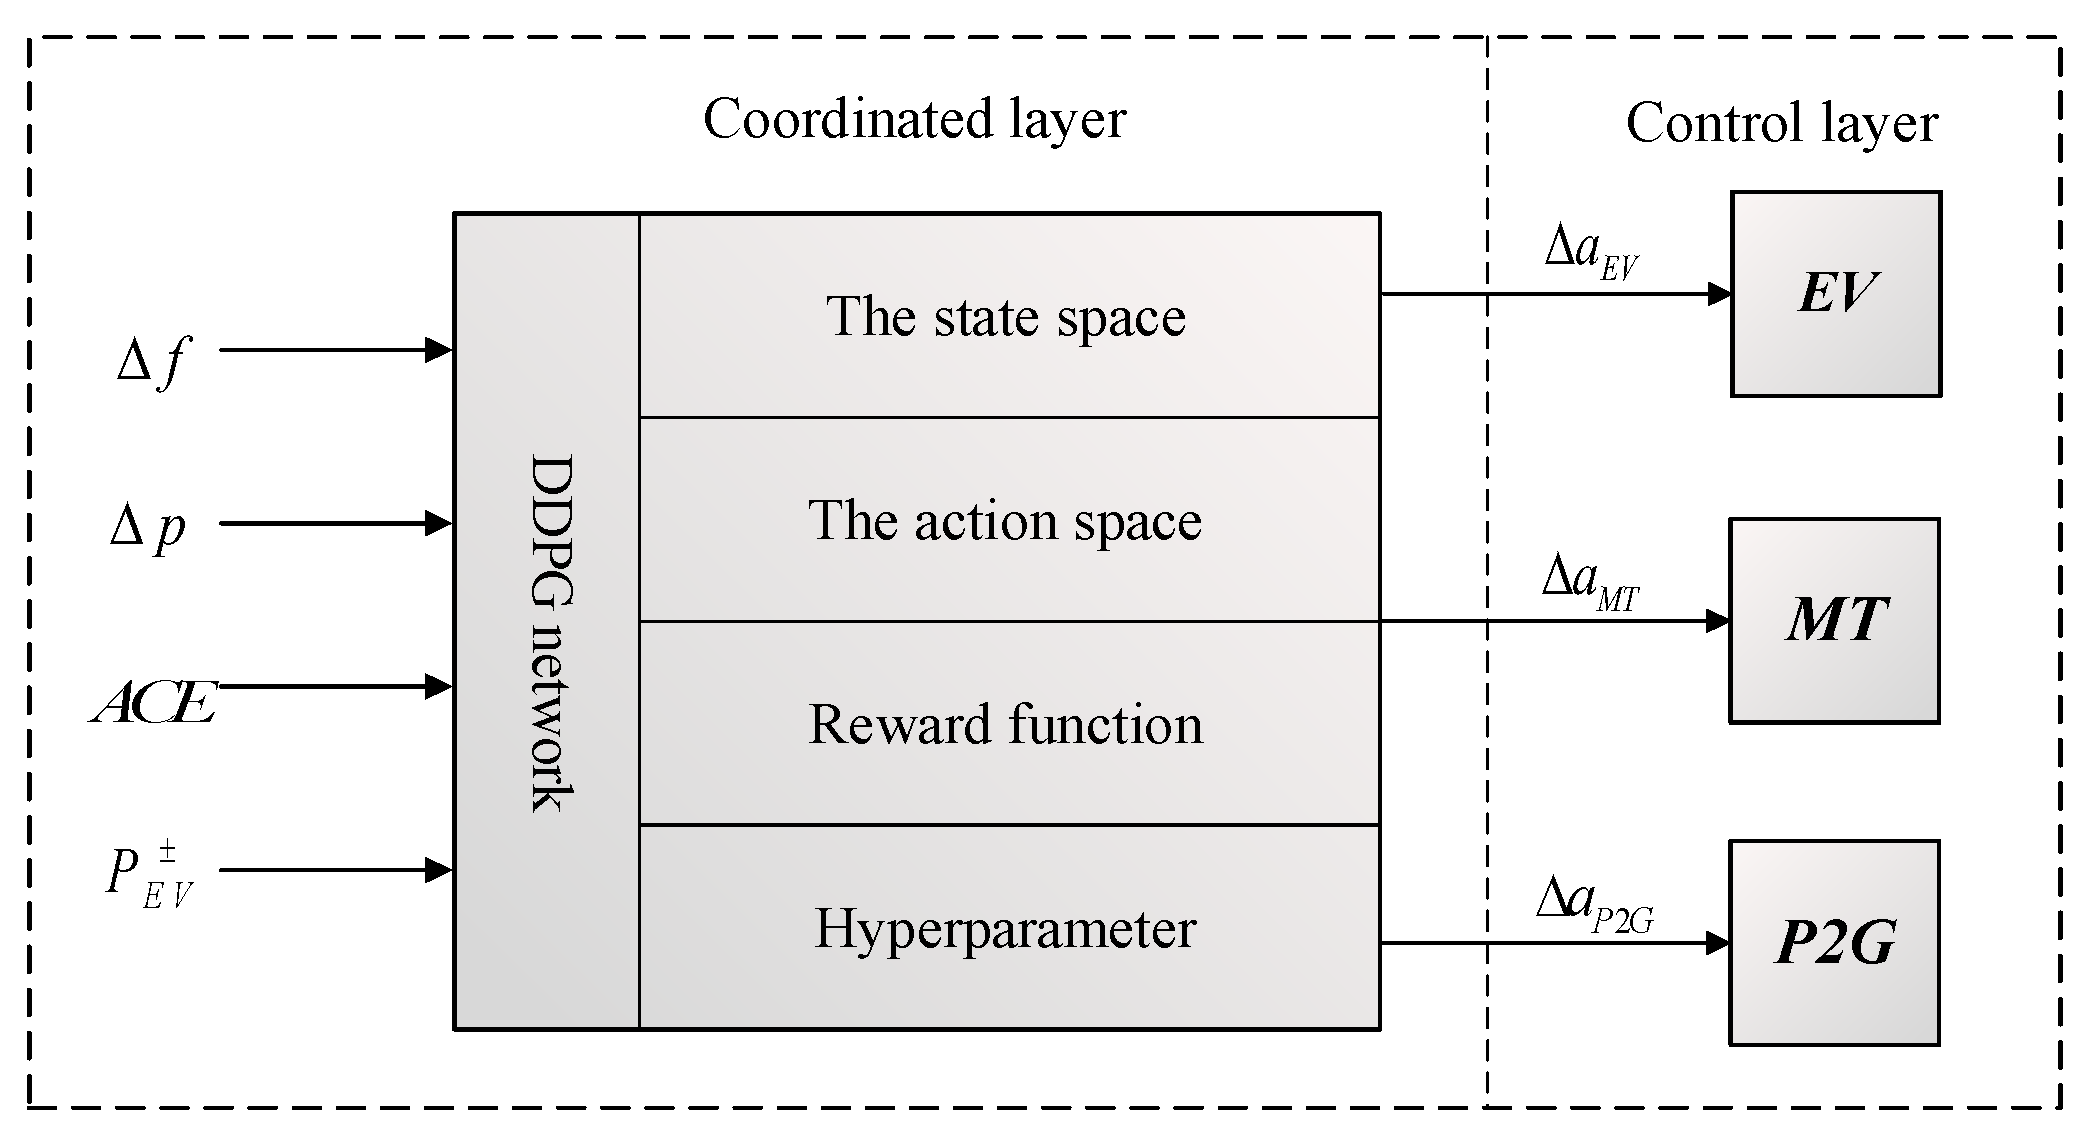
As shown in Figure 12, the controller structure is composed of the input layer and the control layer. The input layer can collect and process status signals such as microgrid frequency deviation Δf, the natural gas network pressure deviation Δp, the boundary of the output power of EVs charging stations , and the value of ACE, which can be updated by Equation (18):
where, β is the frequency response coefficient in each microgrid, the unit is MW/0.1 Hz.
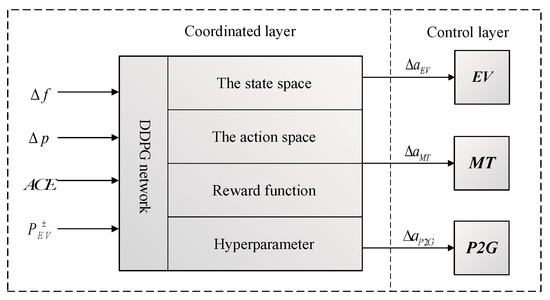
Figure 12.
The control structure of frequency controller based on DDPG.
Meanwhile, the control layer can coordinate the control objectives of the two microgrids to provide a combined action command that is optimal for overall stability ΔAi (ΔaEVi, ΔaMTi, ΔaP2Gi) to each unit in the multi-microgrid so as to control the output power of MT, EV and P2G in multi-microgrid, and achieve rapid suppression of frequency fluctuations and pressure deviations.
Thus, the state set of the controller is the microgrid frequency deviation ∆F(t), the natural gas network pressure deviation ∆p(t), the boundary of output power of EVs station , and the value of ACE(t), so the state space S can be defined as follow:
The action set A of the MADDPG controller should be the real time scheduling instruction set for the output active power of MT, EVs, and P2G equipment. Therefore, the joint action set A of Agent1 can be defined as follows:
A=[∆AMT (t), ∆AEV (t), ∆AP2G (t)]
Furthermore, according to [15], the discrete set of frequency deviation ΔF(t) can be set as (−∞, −0.2), [−0.2, −0.15), [−0.15, −0.10), [−0.10, −0.03), [−0.03, 0.03], (0.03, 0.10], (0.10, 0.15], (0.15, 0.2], (0.2, +∞), unit is Hz. And real-time air pressure fluctuation ∆p(t) can be set to (−∞, −0.5), [−0.5, −0.4), [−0.4, −0.3), [−0.3, −0.2), [−0.2, 0.2], (0.2, 0.3], (0.3, 0.4), (0.4, 0.5), (0.5, ∞), unit is kPa.
4.4. Design of Reward Function
The control objectives of this paper are: (1) Maintain the frequency stability of the microgrid; (2) Maintain the stability of the node air pressure in the natural gas network; (3) Coordinate the overall stability of two microgrids. Therefore, a comprehensive reward function in each sub-microgrid can be established to coordinate frequency restoration and air pressure adjustment.
where, Ri is the global reward in MG i, rf is the reward of microgrid frequency, rp is the reward of air pressure, μ1, μ2, μ3 and μ4 are the parameters of each control area in the frequency reward rf, and δ1, δ2, δ3 and δ4 and are the parameters of each control area in the air pressure reward rp, the ACE(t) represents the instantaneous value of ACE at time t. η represents the weight of ACE, which is 0.5 in this paper. And the convergence effect and the learning speed can be affected by the size of the reward value, so it is necessary to perform simulation tests according to actual examples, and the specific process would be discussed in next section.
Thus, the overall reward function of the multi-microgrid system is shown in Formula (24):
5. Simulation Results
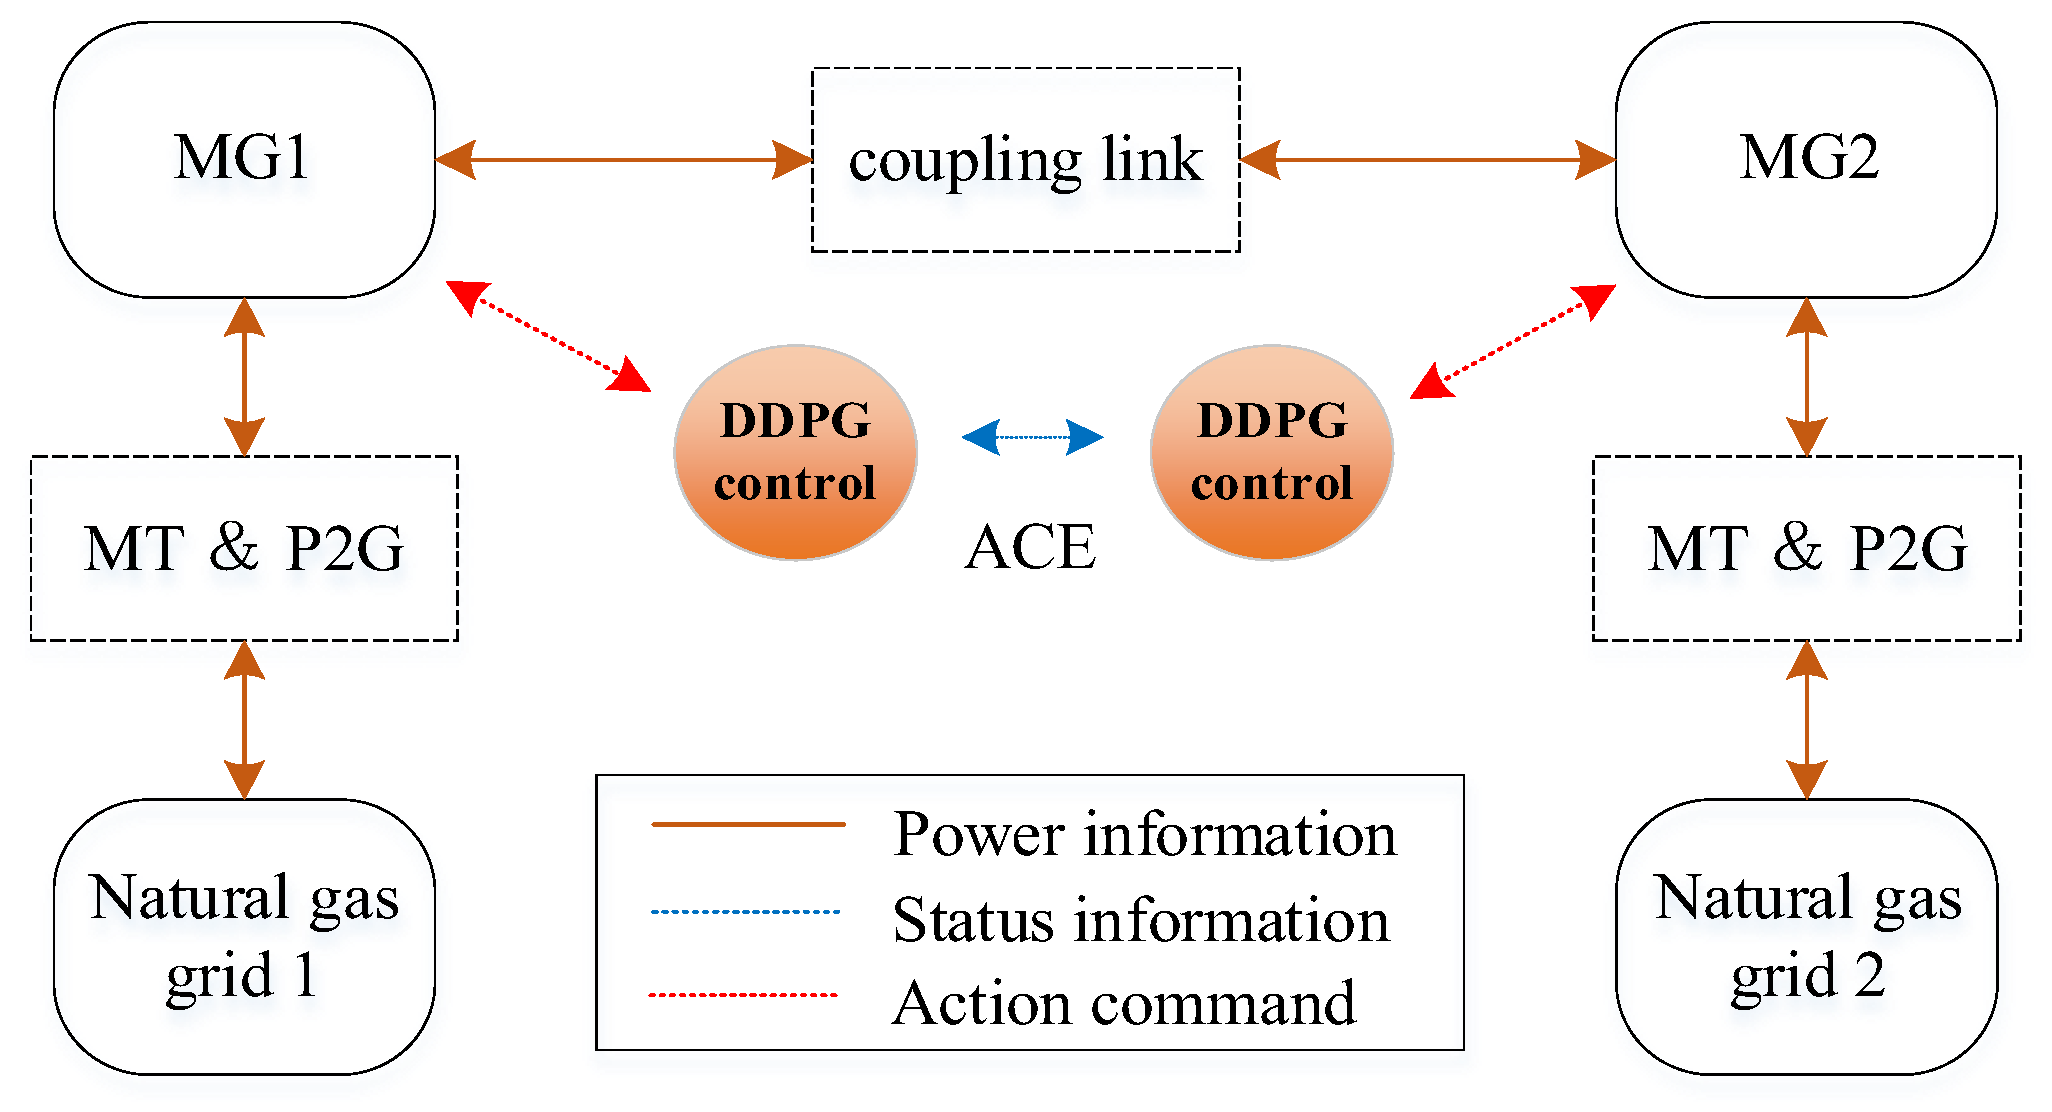
In order to test the control effect of the strategy proposed in this paper, a multi-microgrid system is constructed through simulation experiments as shown in Figure 13, and the specific settings of equipment parameters are shown in Table 1. Therefore, according to the microgrid structure and a large number of tests, the specific values of the controller reward function, hyperparameters and training parameters can be obtained as shown in Table 2. The verification of the calculation examples in this paper is carried out through simulation experiments. The computing platform is a PC with i7-1165G7@2.80GHz CPU and 16 GB RAM, and the software environment is Windows 10 Professional and MATLAB R2021a.

Figure 13.
The simulation structure of multi-microgrid system.

Table 1.
Parameters of equipment in microgrids.
Table 2.
Convergence test results under different parameters.
Meanwhile, 6 groups of neural network structure parameters (h,u) are set for the convergence test, and the learning results of the agent are shown in Table 3. It can be seen that when the number of layers of the neural network h = 5, and the neurons in each layer u = 50, the agent has the best convergence characteristics and optimization results.
Table 3.
Convergence test results under different parameters.
5.1. Pre-Learning Stage
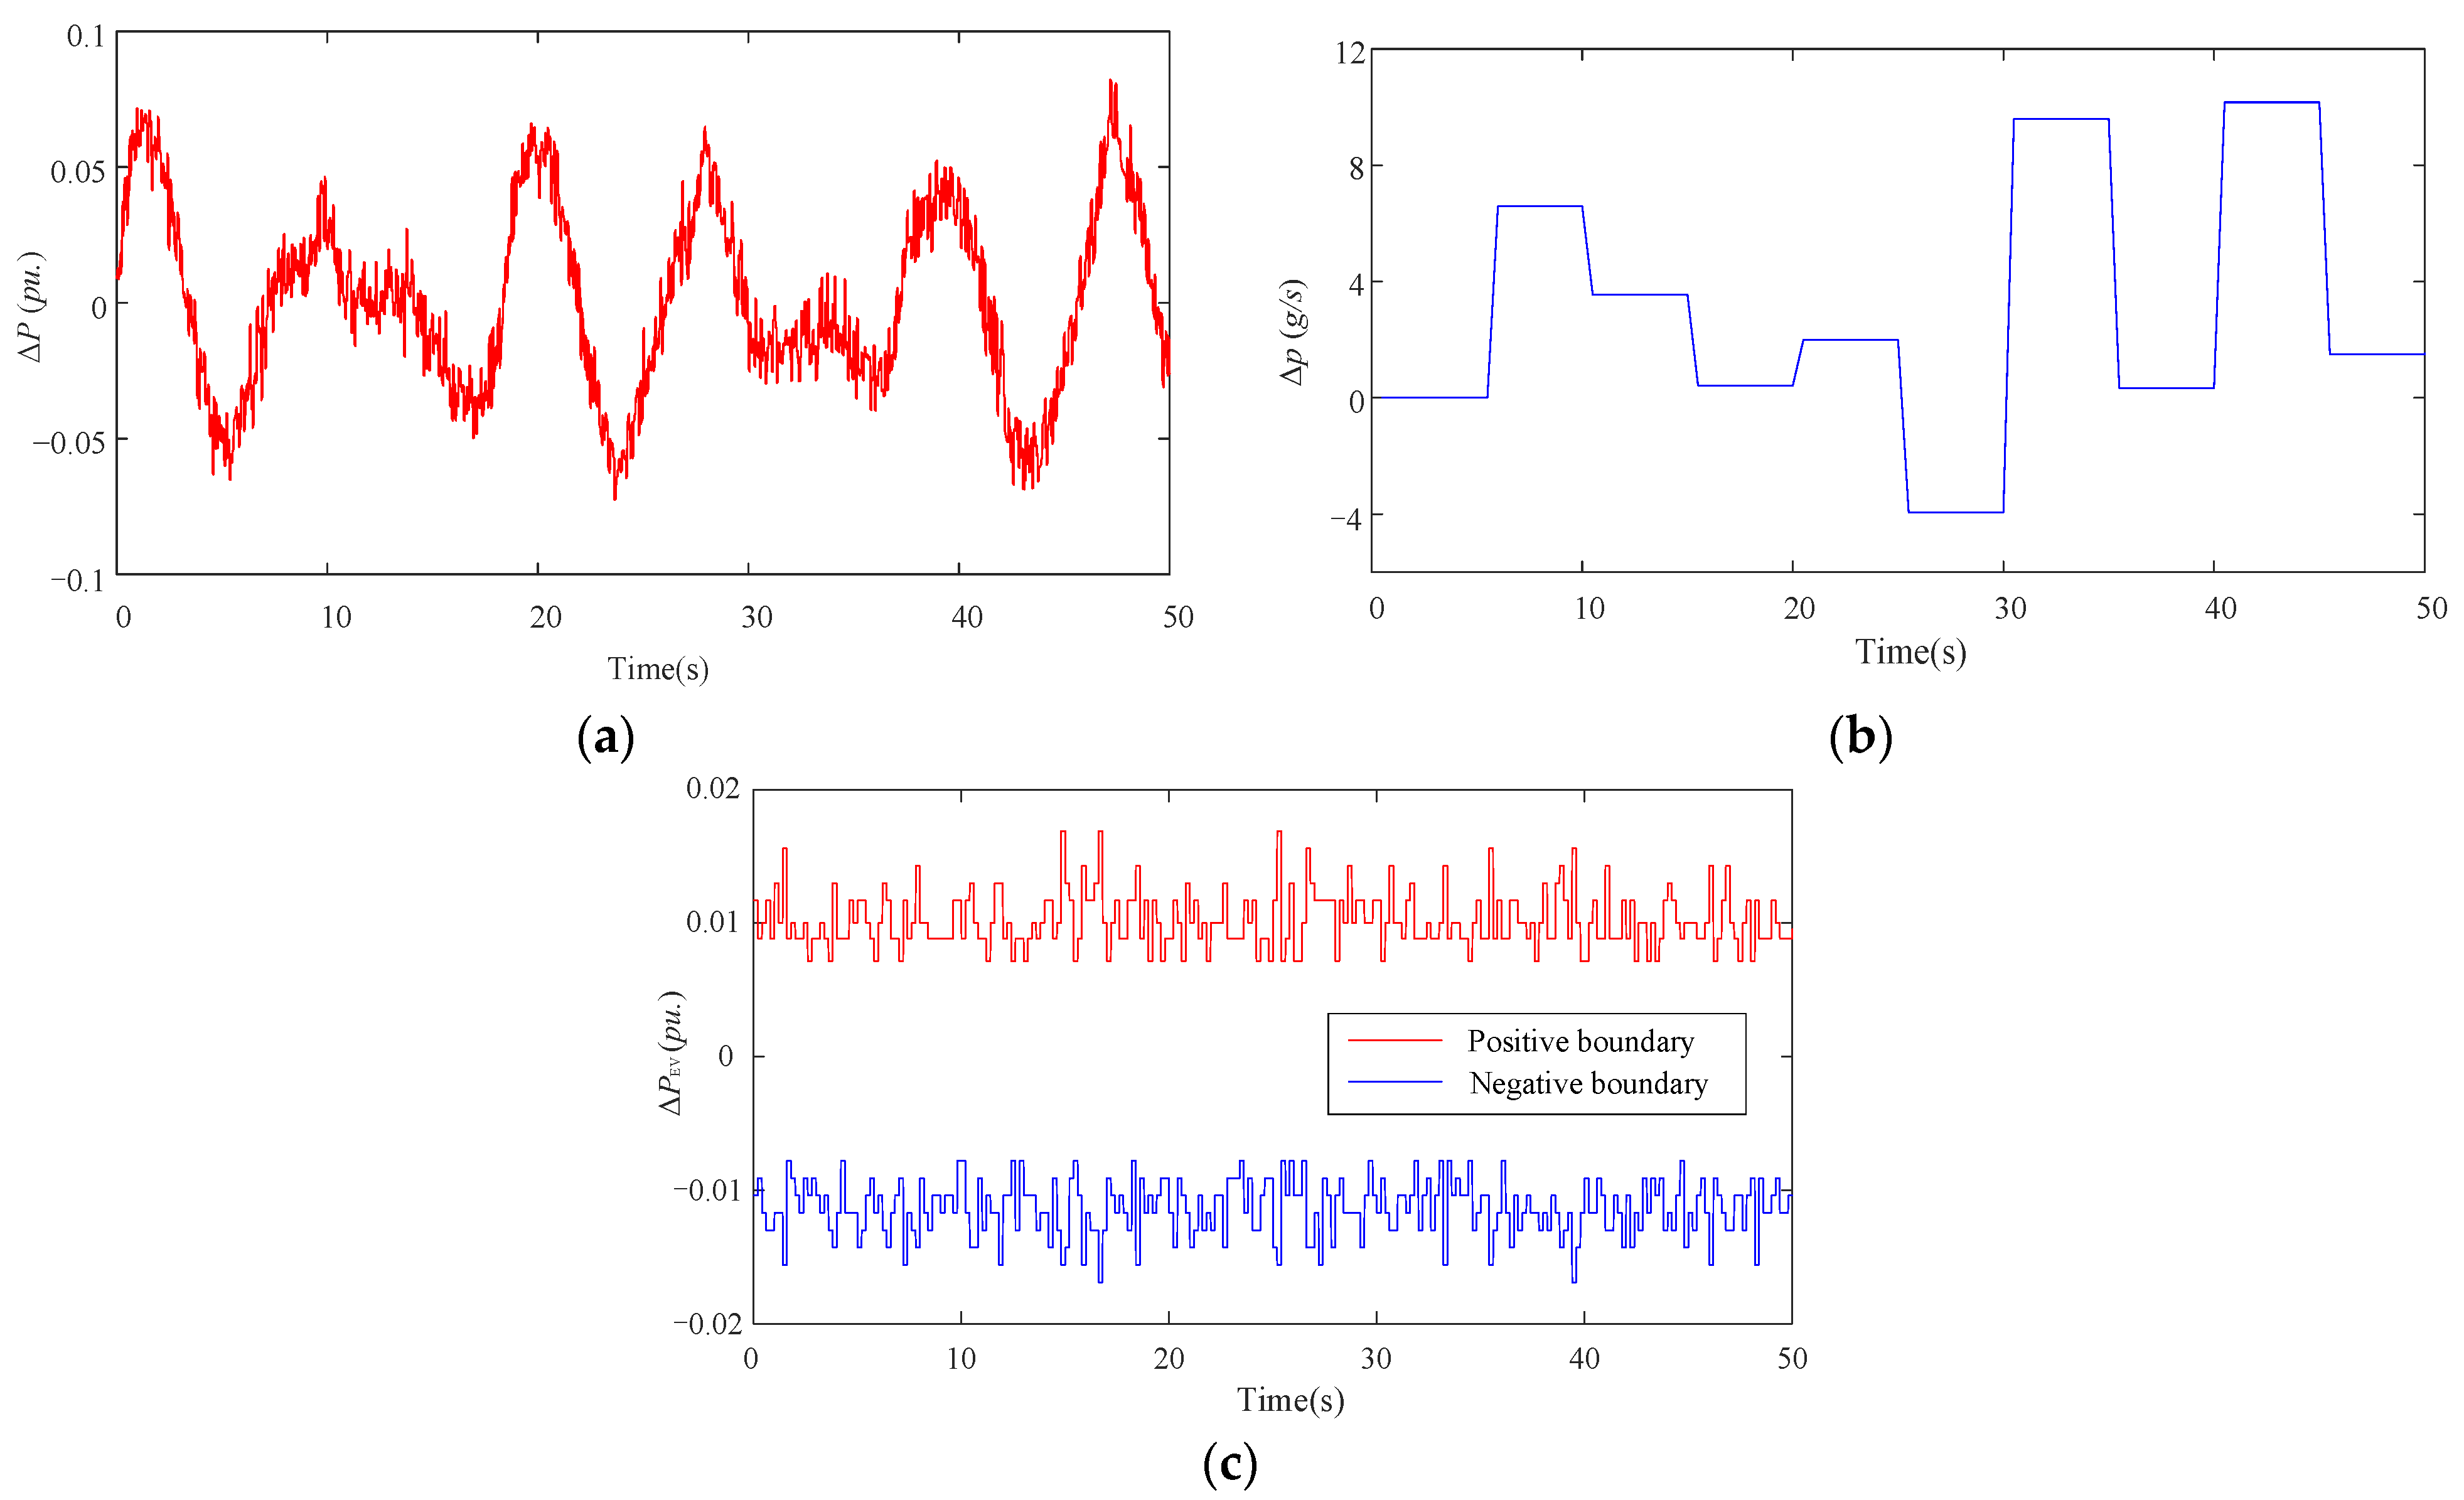
Before the DDPG controller is used in the formal simulation test, it needs to go through a pre-learning stage. In the early stage of pre-learning, the controller did not accumulate enough experience, so there is no intelligent control ability [33]. Therefore, this paper sets up the wind power disturbance function formed by the superposition of various different amplitudes and different types of functions, the node air pressure function of the natural gas network, and the electric vehicle output power boundary function that changes randomly over time, which are used to train the Agent, so as to obtain the optimal value function Q network Qφ(s,a). The training process is shown in Figure 14.

Figure 14.
Random perturbation function in the pre-learning phase: (a) Random disturbances in wind power generation; (b) Random disturbance of natural gas pipeline flow. (c) The output power increment function of the EV stations.
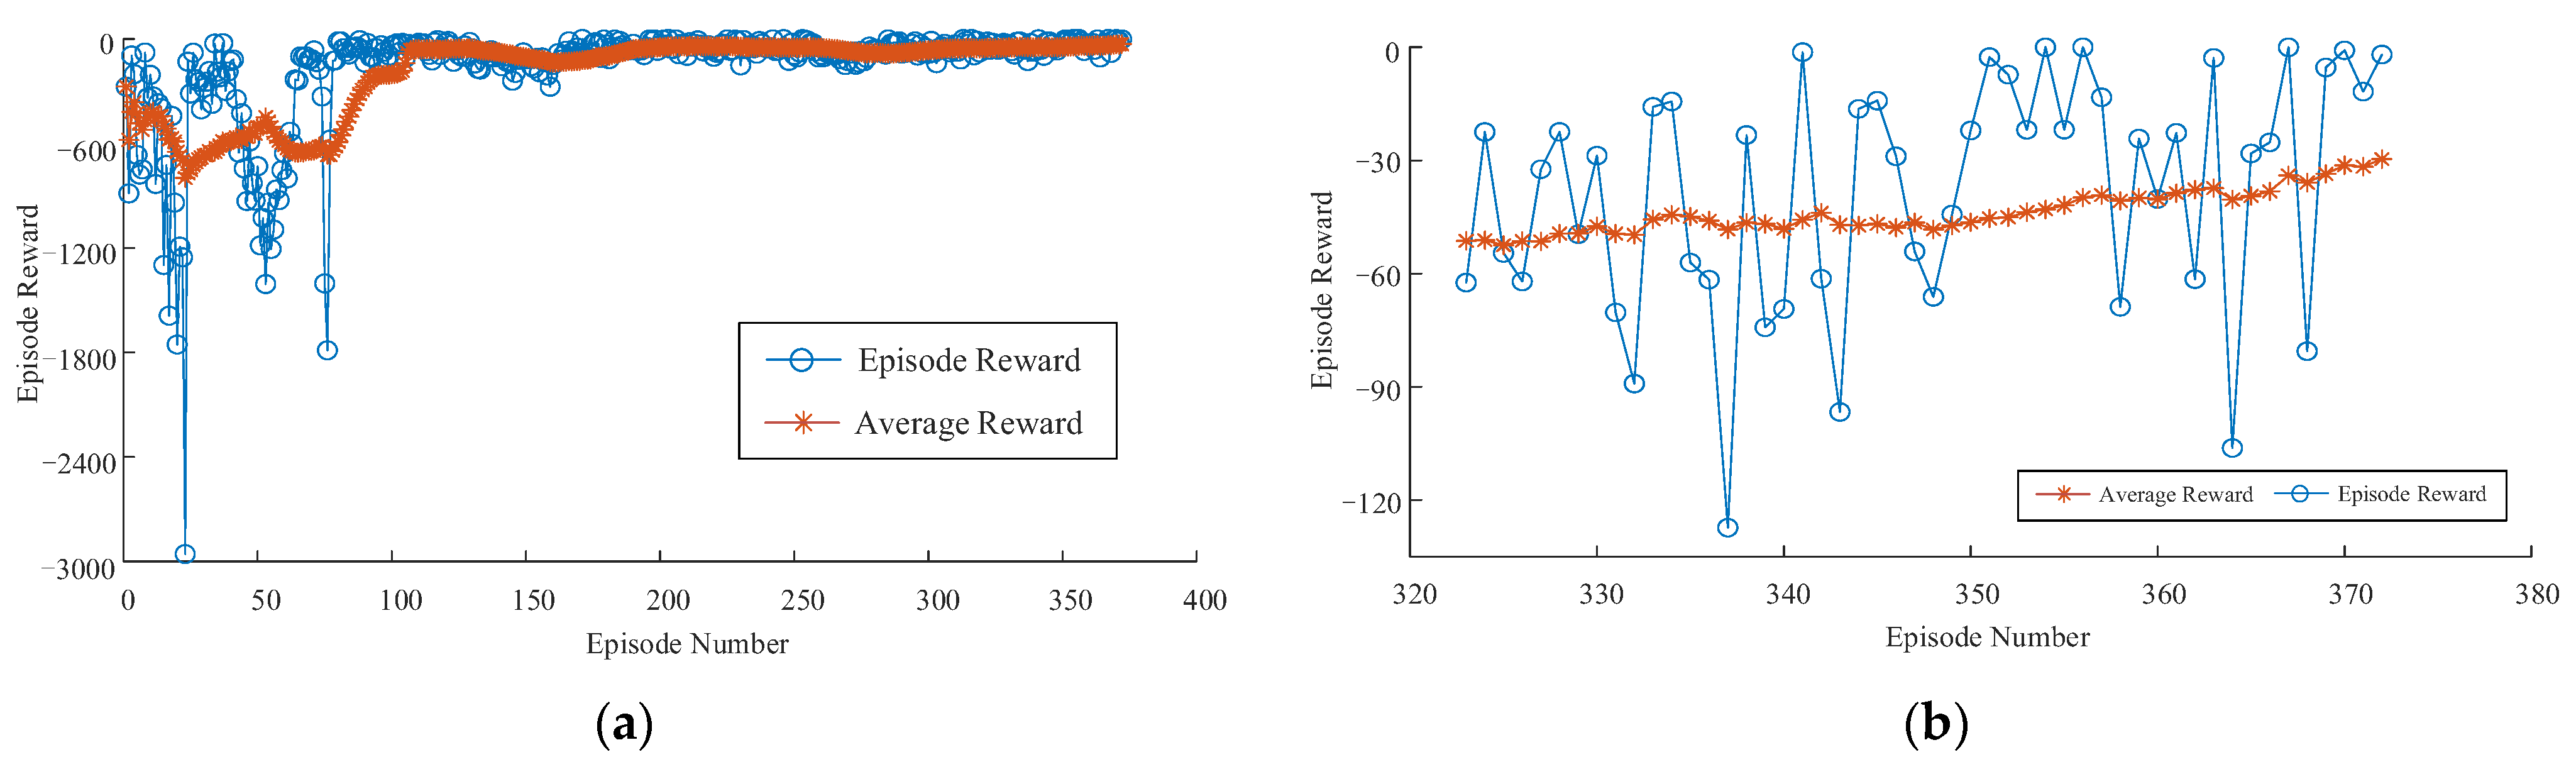
Thus, the pre-learning process of the Agent 1 is shown in Figure 15. It can be seen that the learning process has been completed at 372 episodes. After training, the average reward and the final reward of Agent 1 is −1.93044 and −29.64933, the average reward and the final reward of Agent 2 is −2.52452 and −30.45247, which shows that the controller has good convergence characteristics to complete the simulation experiment.
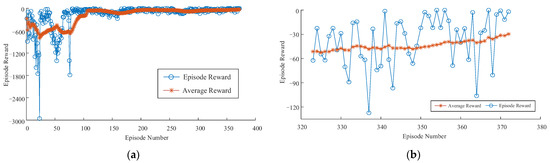
Figure 15.
The complete trend graph of the reward function: (a) The complete trend graph of the reward function; (b) The trend graph of the reward function for the last 50 iterations.
5.2. Case Study
In order to verify the control effect of the MADDPG controller proposed in this paper, the PID controller and the Fuzzy controller are selected as comparisons, and the experimental tests are carried out in the following cases.
5.2.1. Case 1: The Response of Microgrid Load and Wind Power Combined Disturbance
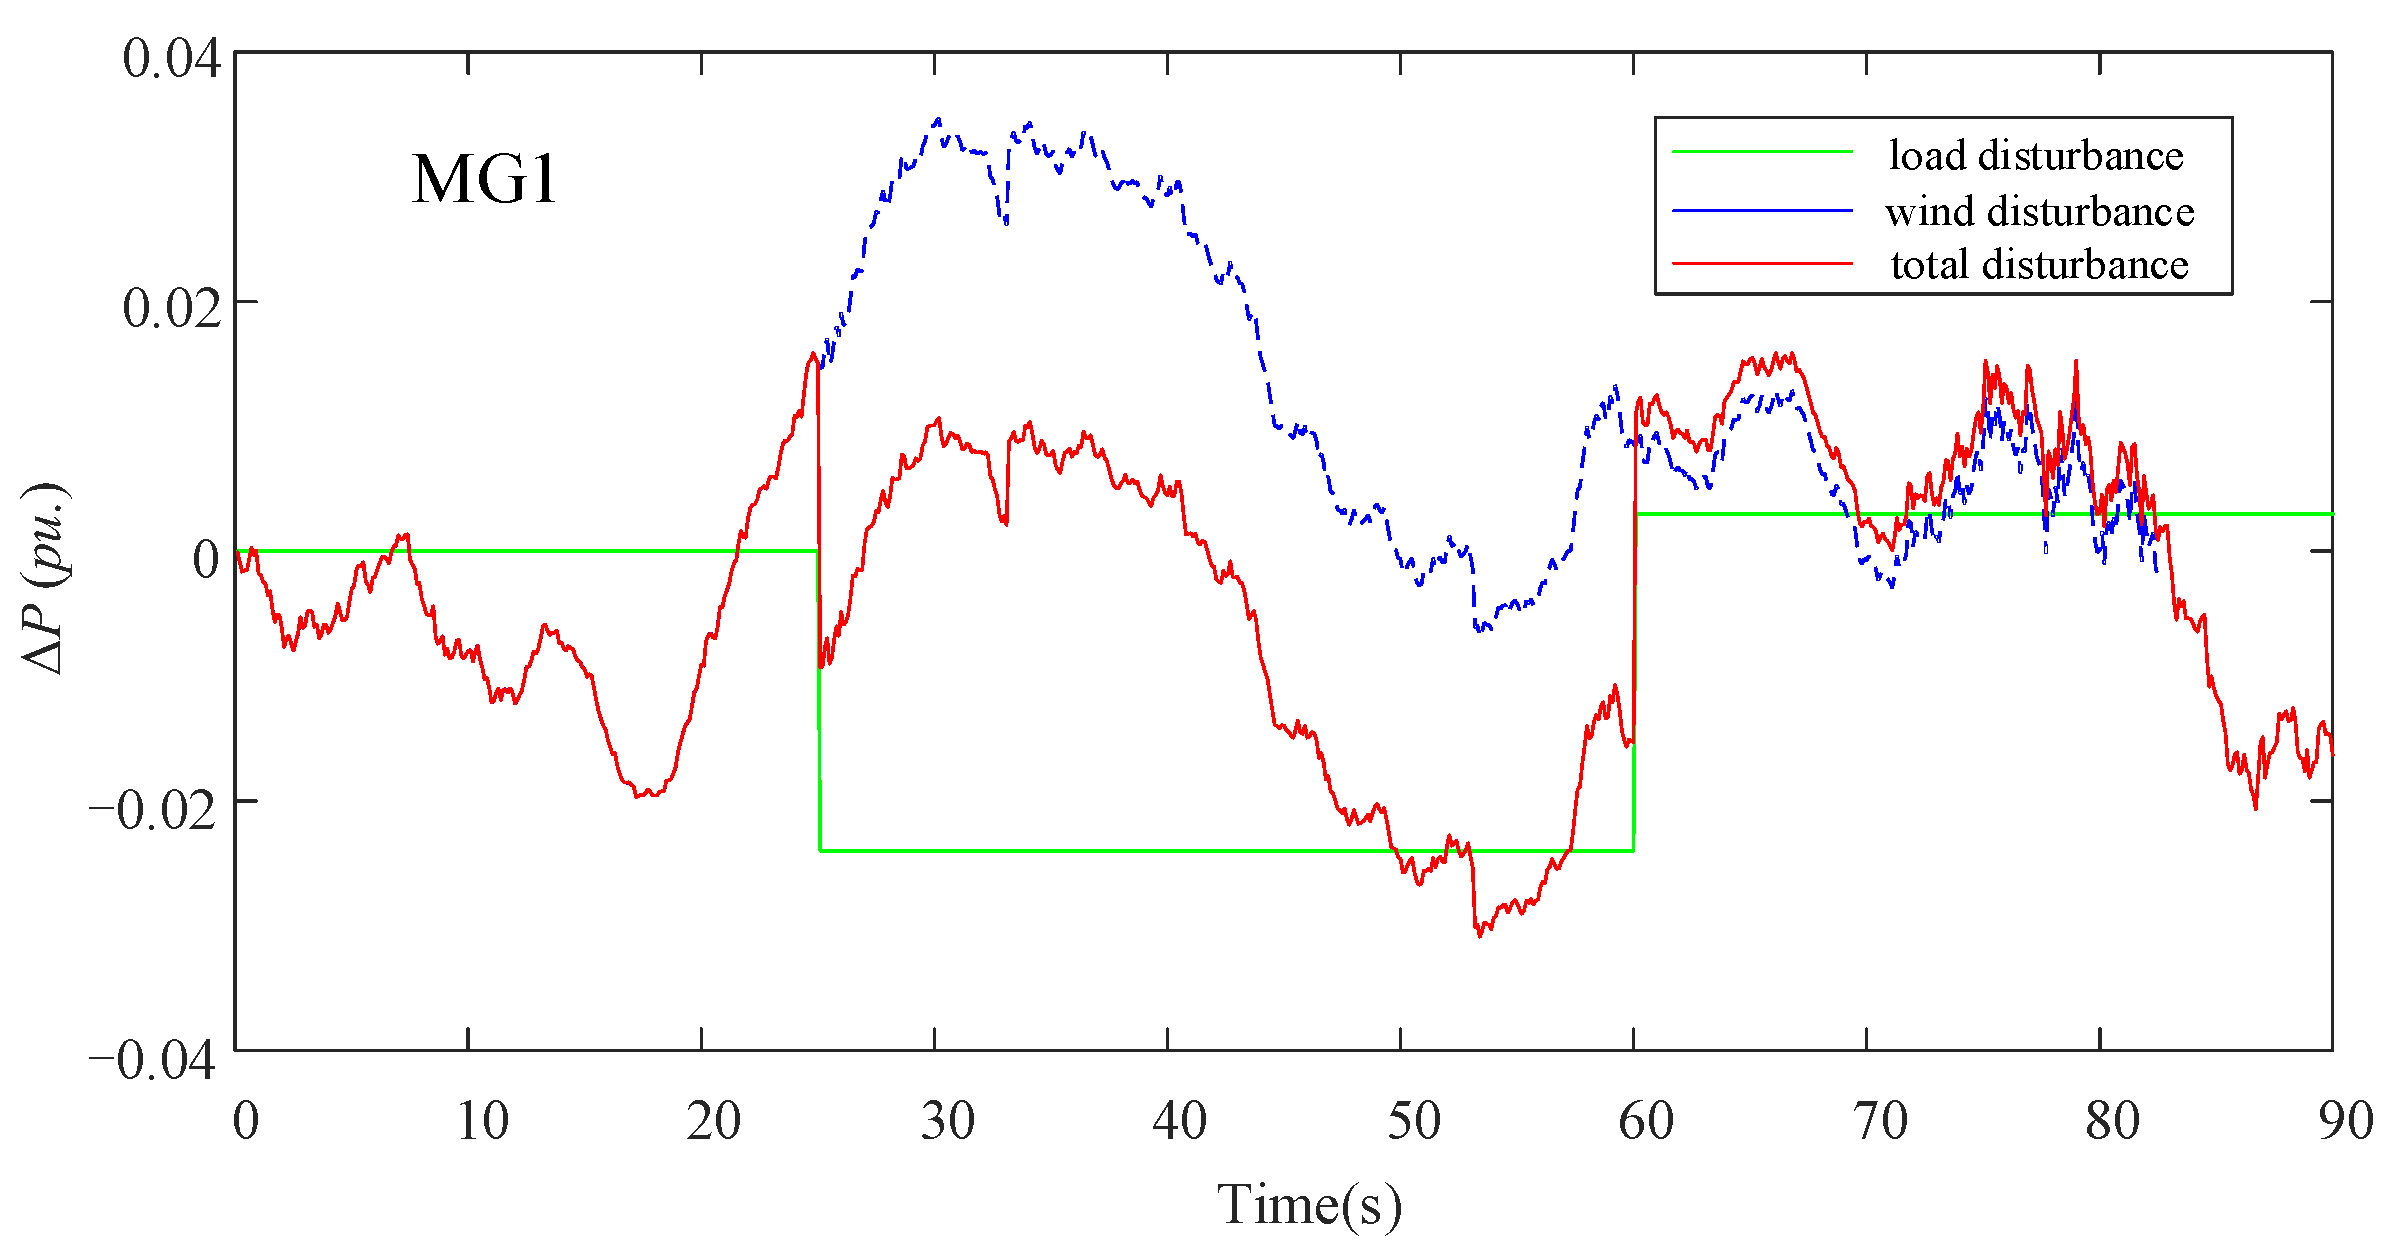
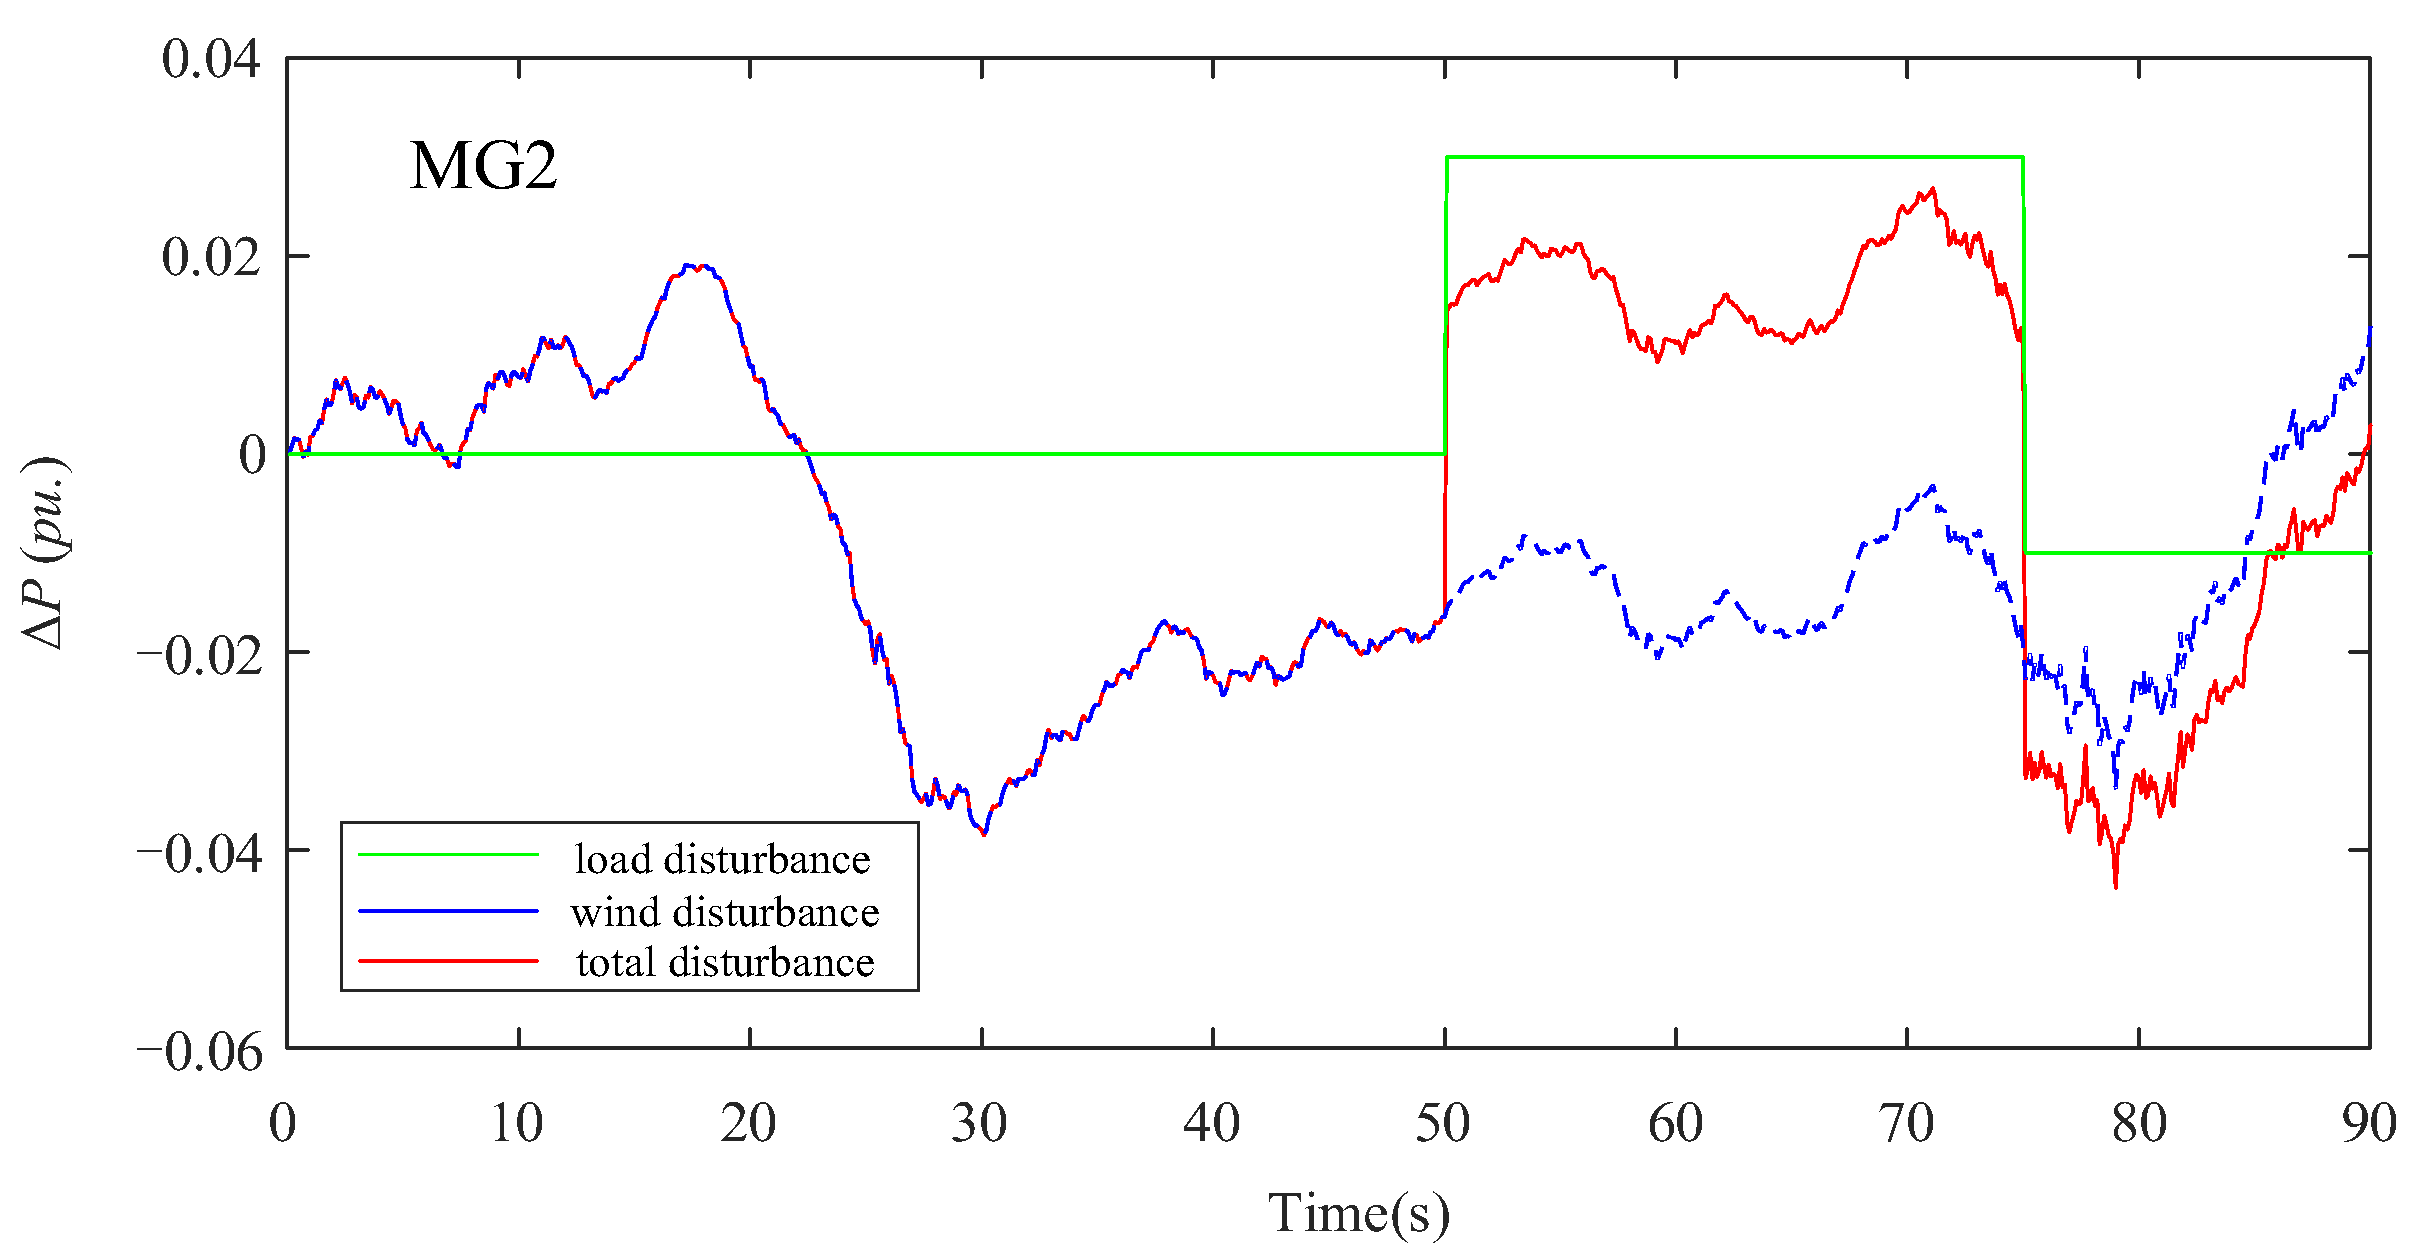
The load power on the microgrid side may have a step disturbance, and the combined power disturbance caused by the superposition of the wind power disturbance is extremely complex. This section aims to simulate such combined disturbances to verify the robustness of the proposed load frequency controller. The power changes of the combined disturbances experienced by the multi-microgrid system are shown in Figure 16. In Figure 17 is shown the action of the load frequency controller based on the MADDPG control, fuzzy control and PI control on the load frequency fluctuation of the microgrid. Additionally, the |Δf| of MG1 can be used as the assessment object, and the threshold value of the assessment excellence rate can be set to 0.03 Hz. It is worth mentioning that, although the wind turbine has great randomness, its change speed is fast, and the time scale is small. Therefore, the power imbalance of the micro-grid caused by the wind turbine will be solved by MADDPG controller in a short time. As a result, in this section, the influence of random disturbance on the air pressure in the gas network will not be considered.
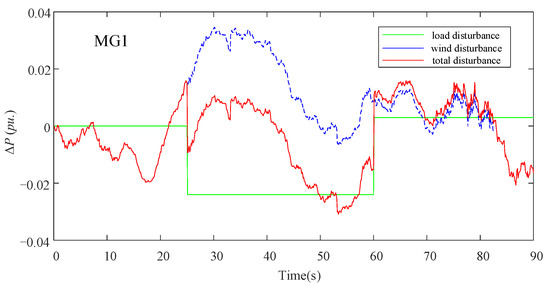
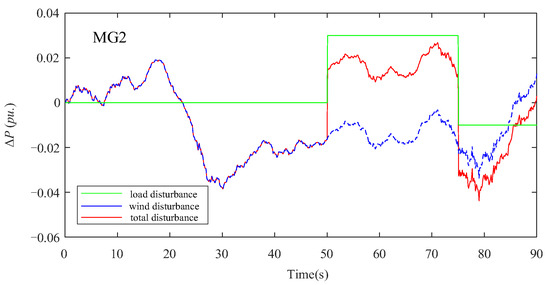
Figure 16.
Load and wind power disturbance to multi-microgrid.
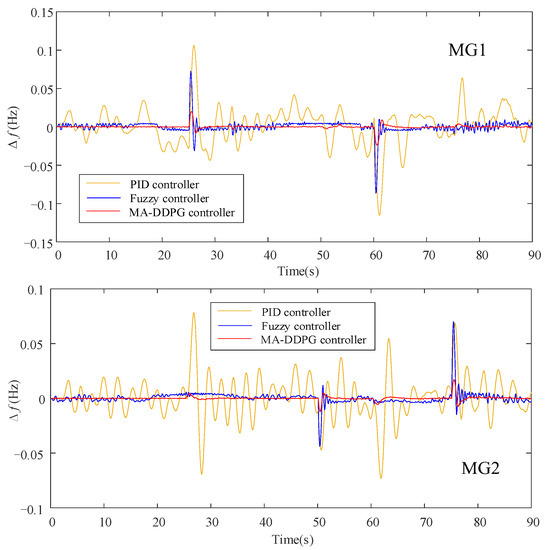
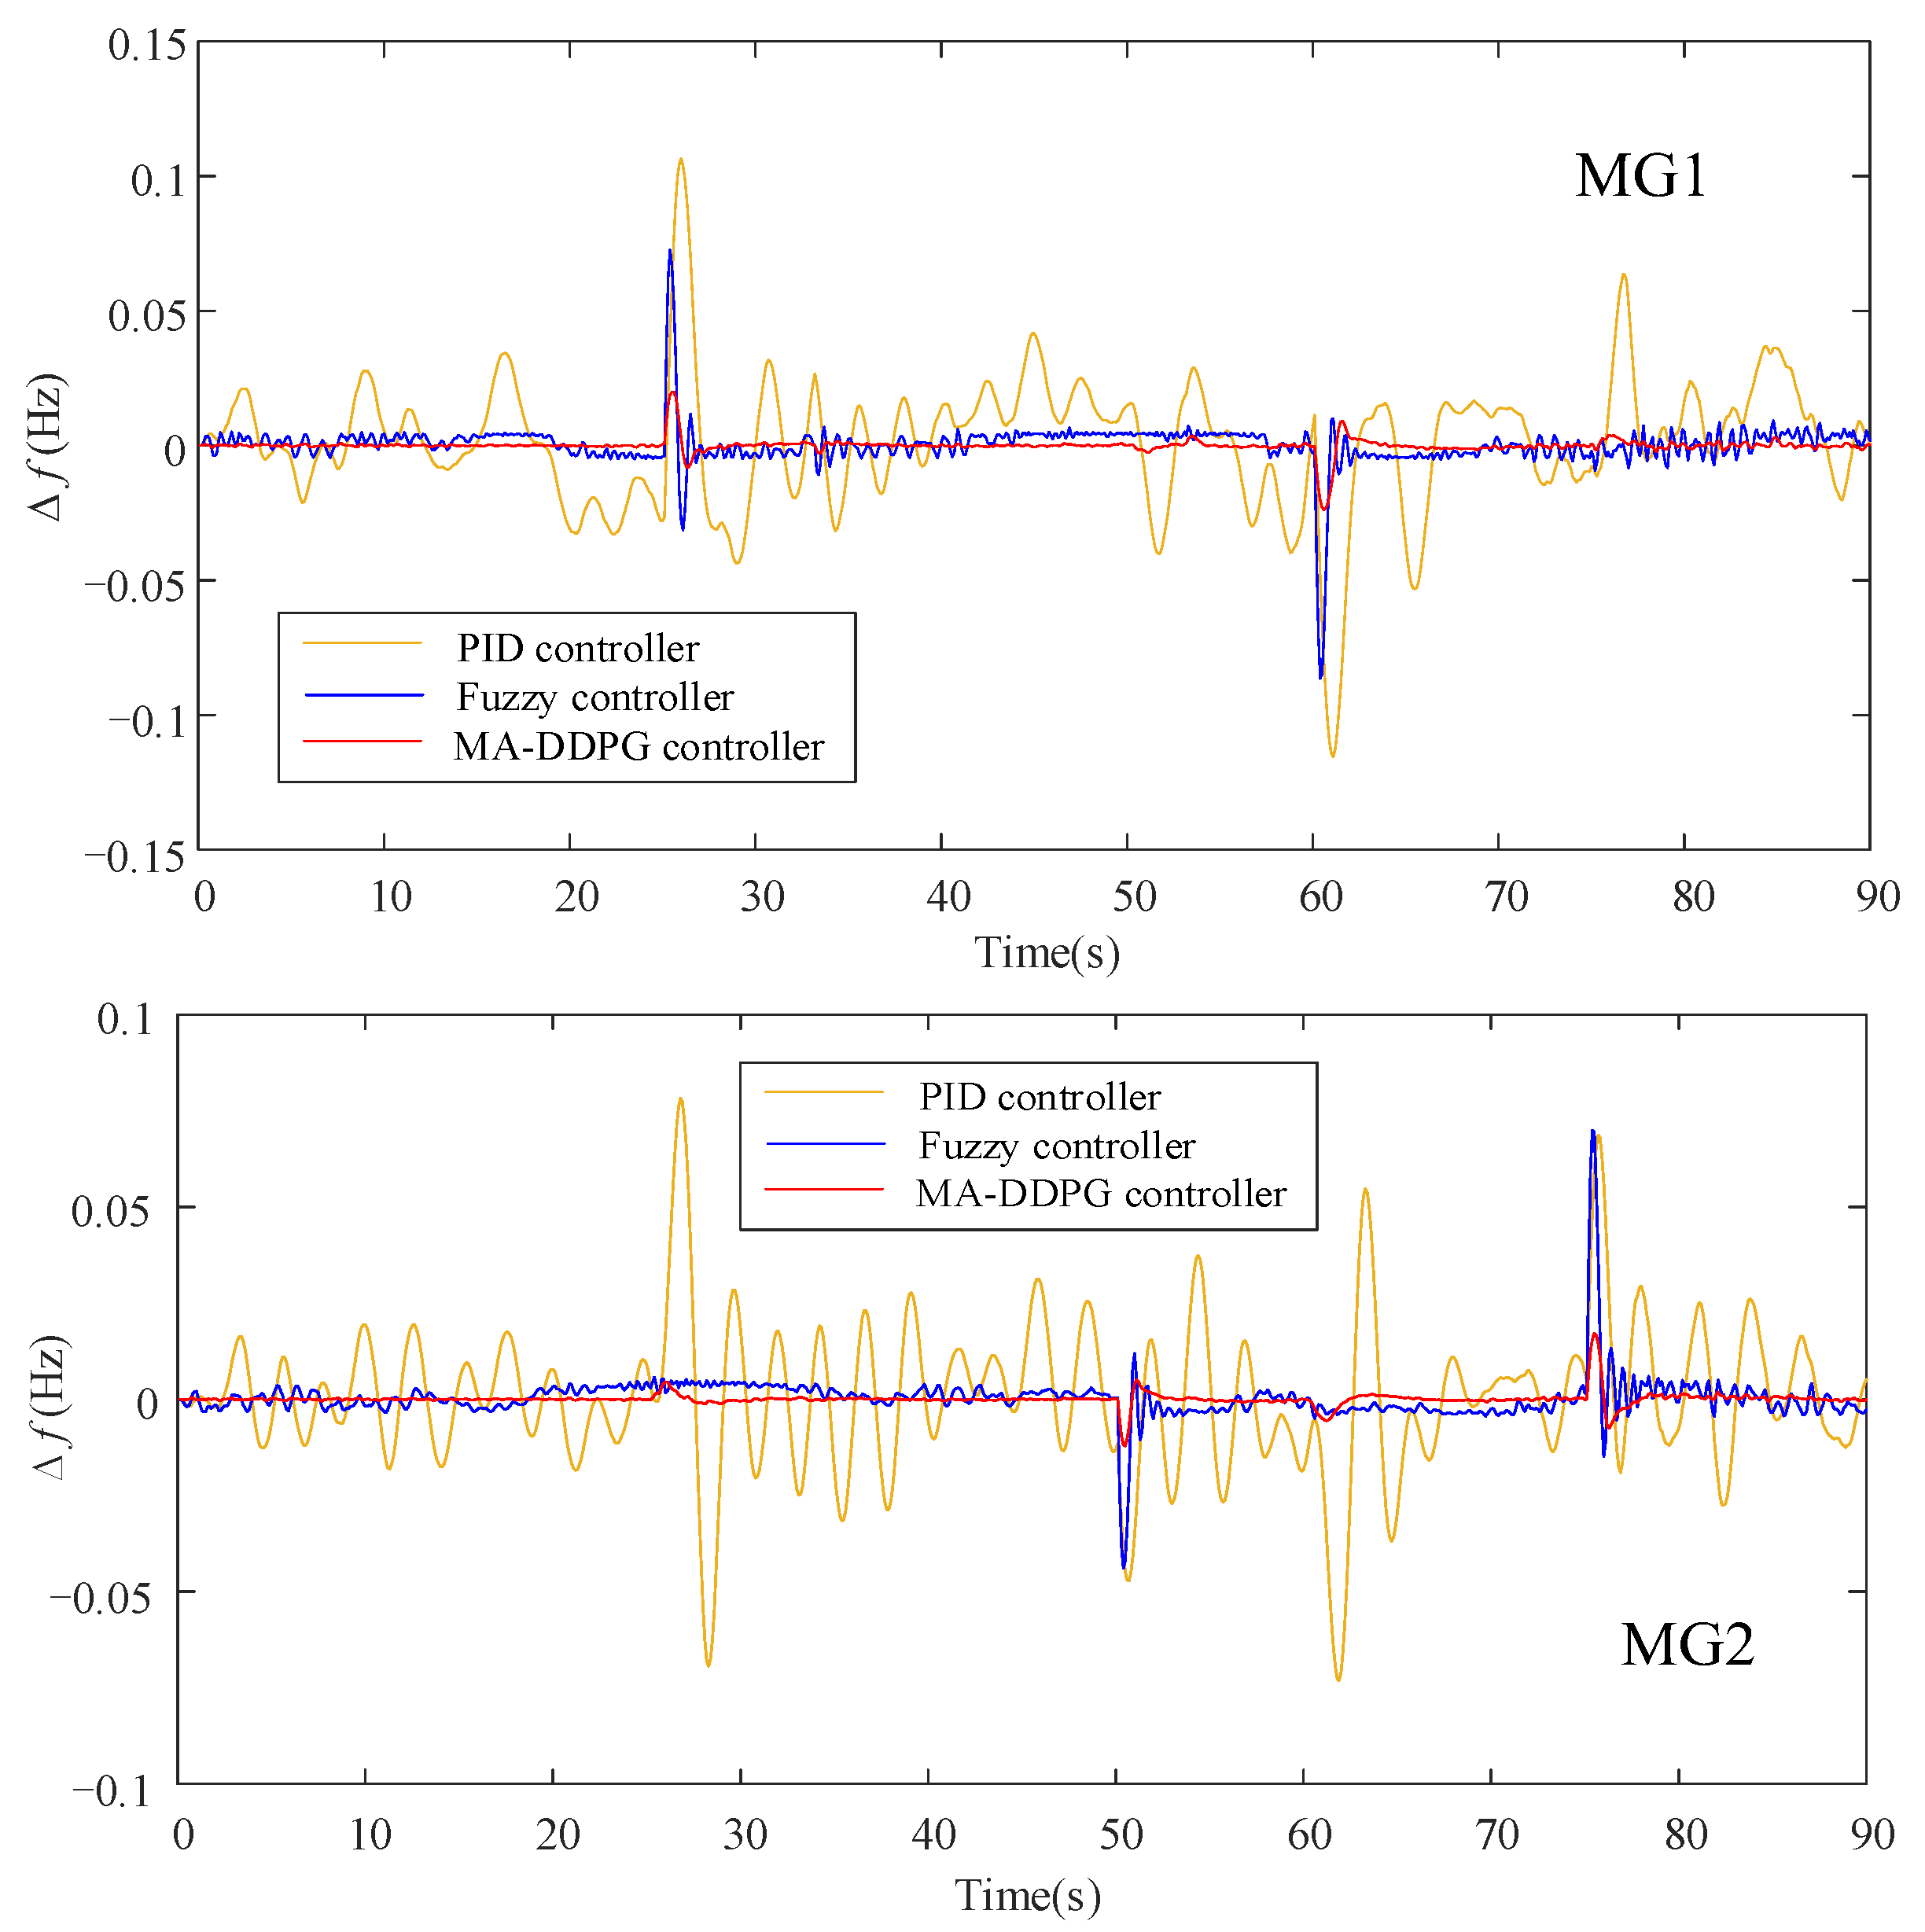
Figure 17.
Frequency deviation of MMS under combined disturbance.
Thus, it can be seen from Figure 17 that, under the combined disturbance, the load frequency controller based on MADDPG algorithm maintains excellent control effect, the amplitude of frequency fluctuation is smaller, which can be controlled within the range of 0.03 Hz, reaching 100% excellent rate. Under PI and Fuzzy control, the maximum |Δf| reaches 0.1168 and 0.08239 Hz, the excellent rate of |Δf| is much lower than MADDPG controllers.
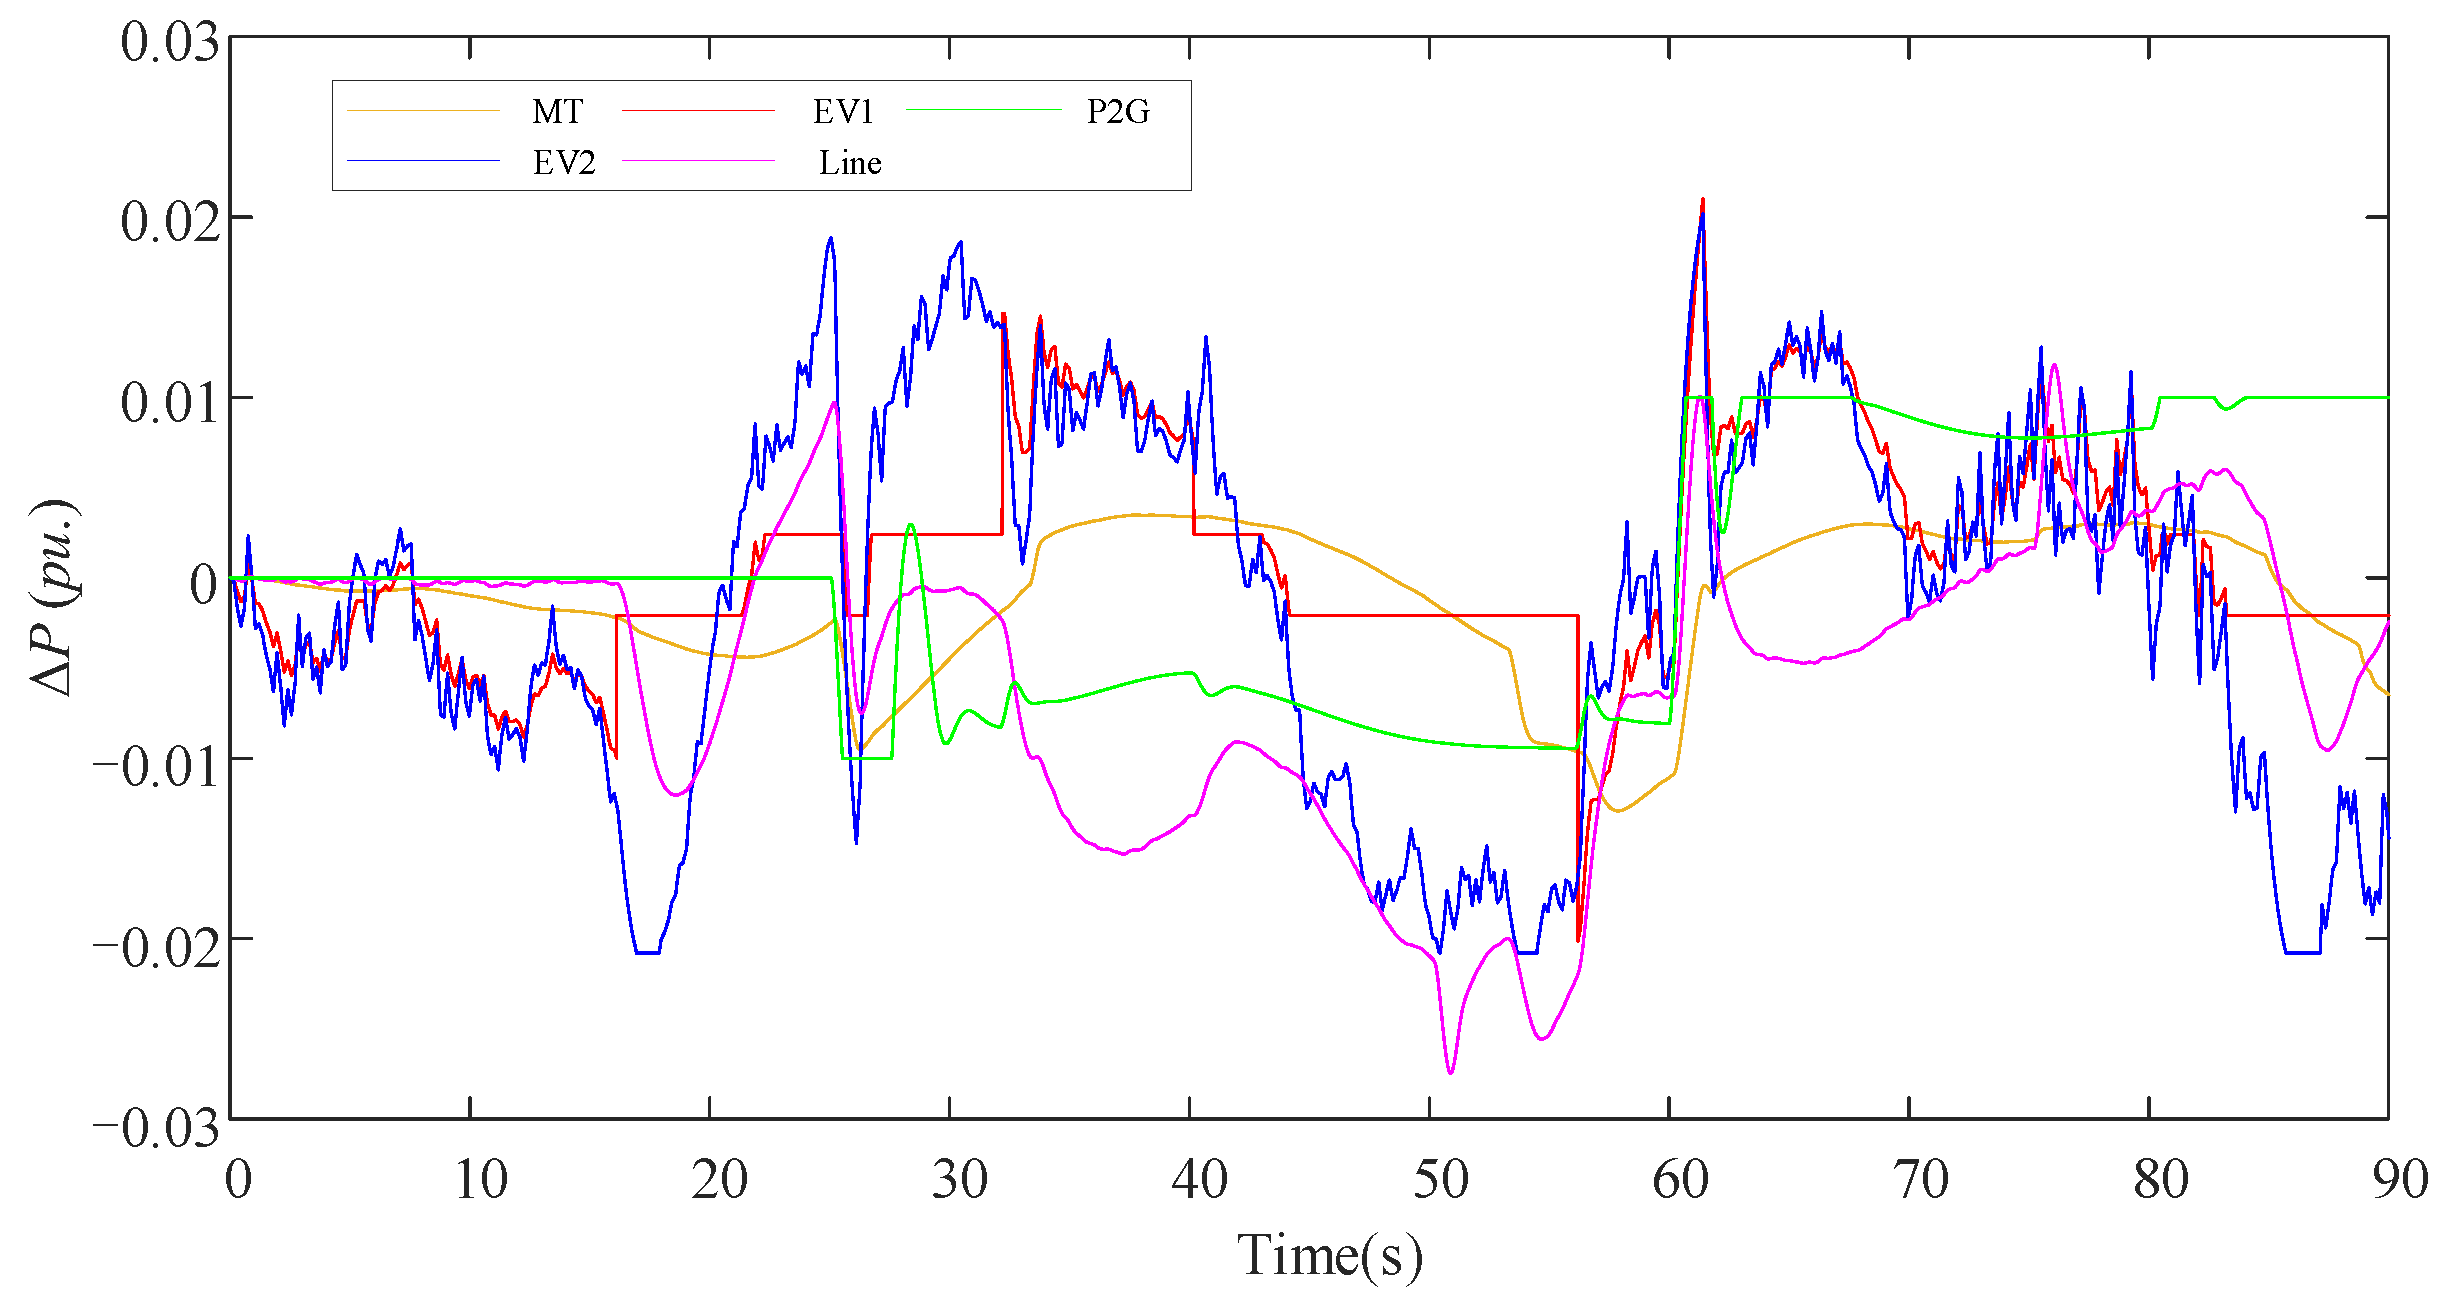
Meanwhile, the power variations of each equipment and tie line in the MG1 under the MADDPG controller are shown in Figure 18. The inertia of the MT is large, and the response speed is slow. The P2G equipment maintains a fast response speed. However, due to the limitation of its controllable capacity, in the case of combined disturbances, the EV stations with a large capacity are mainly responsible for the main frequency regulation task. In addition, there are random limit constraints on the output power increment of EV stations, so the power change curve of the EV stations is obviously jagged.
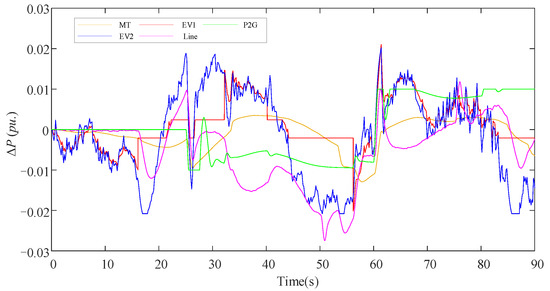
Figure 18.
The power variations of each equipment and tie line in the MG1.
5.2.2. Case 2: The Response of Natural Gas Load Disturbance
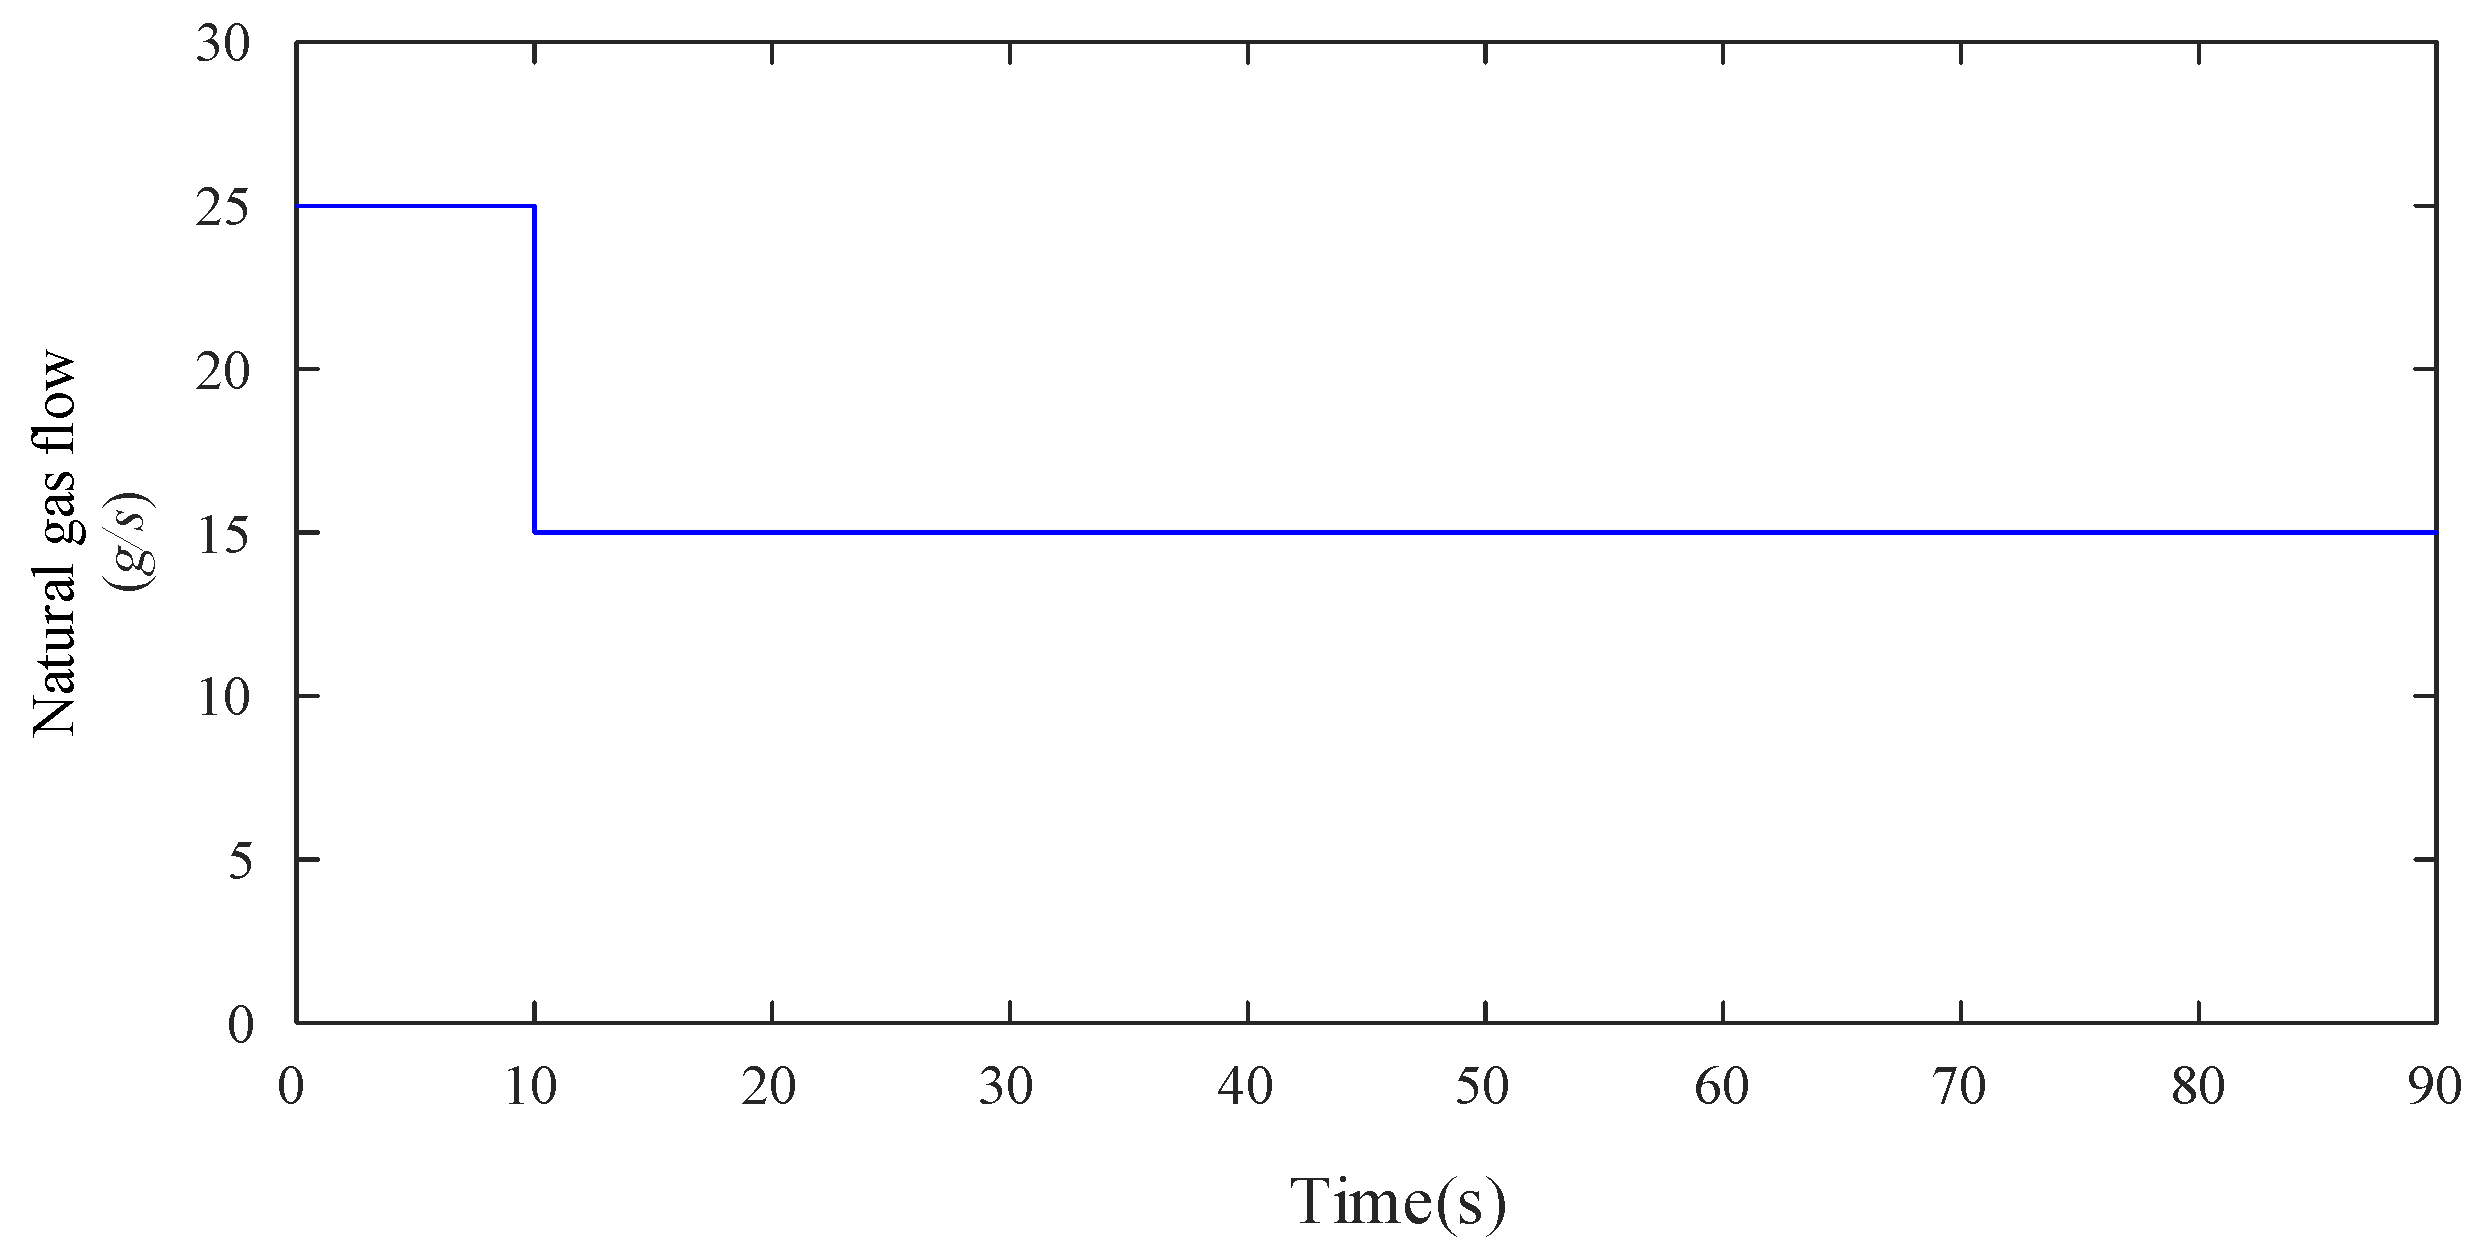
The sudden change of the load flow of the natural gas network will cause the air pressure at the interface between the pipeline and the load to fluctuate, causing the pressure difference between the inlet and the outlet of the pipeline to change. When the gas pressure disturbance at the key node of natural gas is detected, the MT and P2G equipment are switched to the PDG mode to participate in the gas pressure stability control.
Thus, on the basis of case1, at the initial moment of the simulation, the natural gas network is running in a steady state. When t = 10 s, the natural gas flow of pipe 2 in MG1 drops from 25 g/s to 15 g/s, as shown in Figure 19.
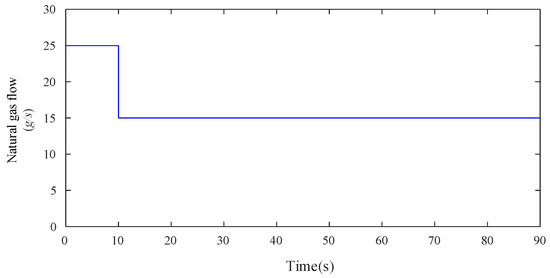
Figure 19.
The changes in natural gas pipeline flow.
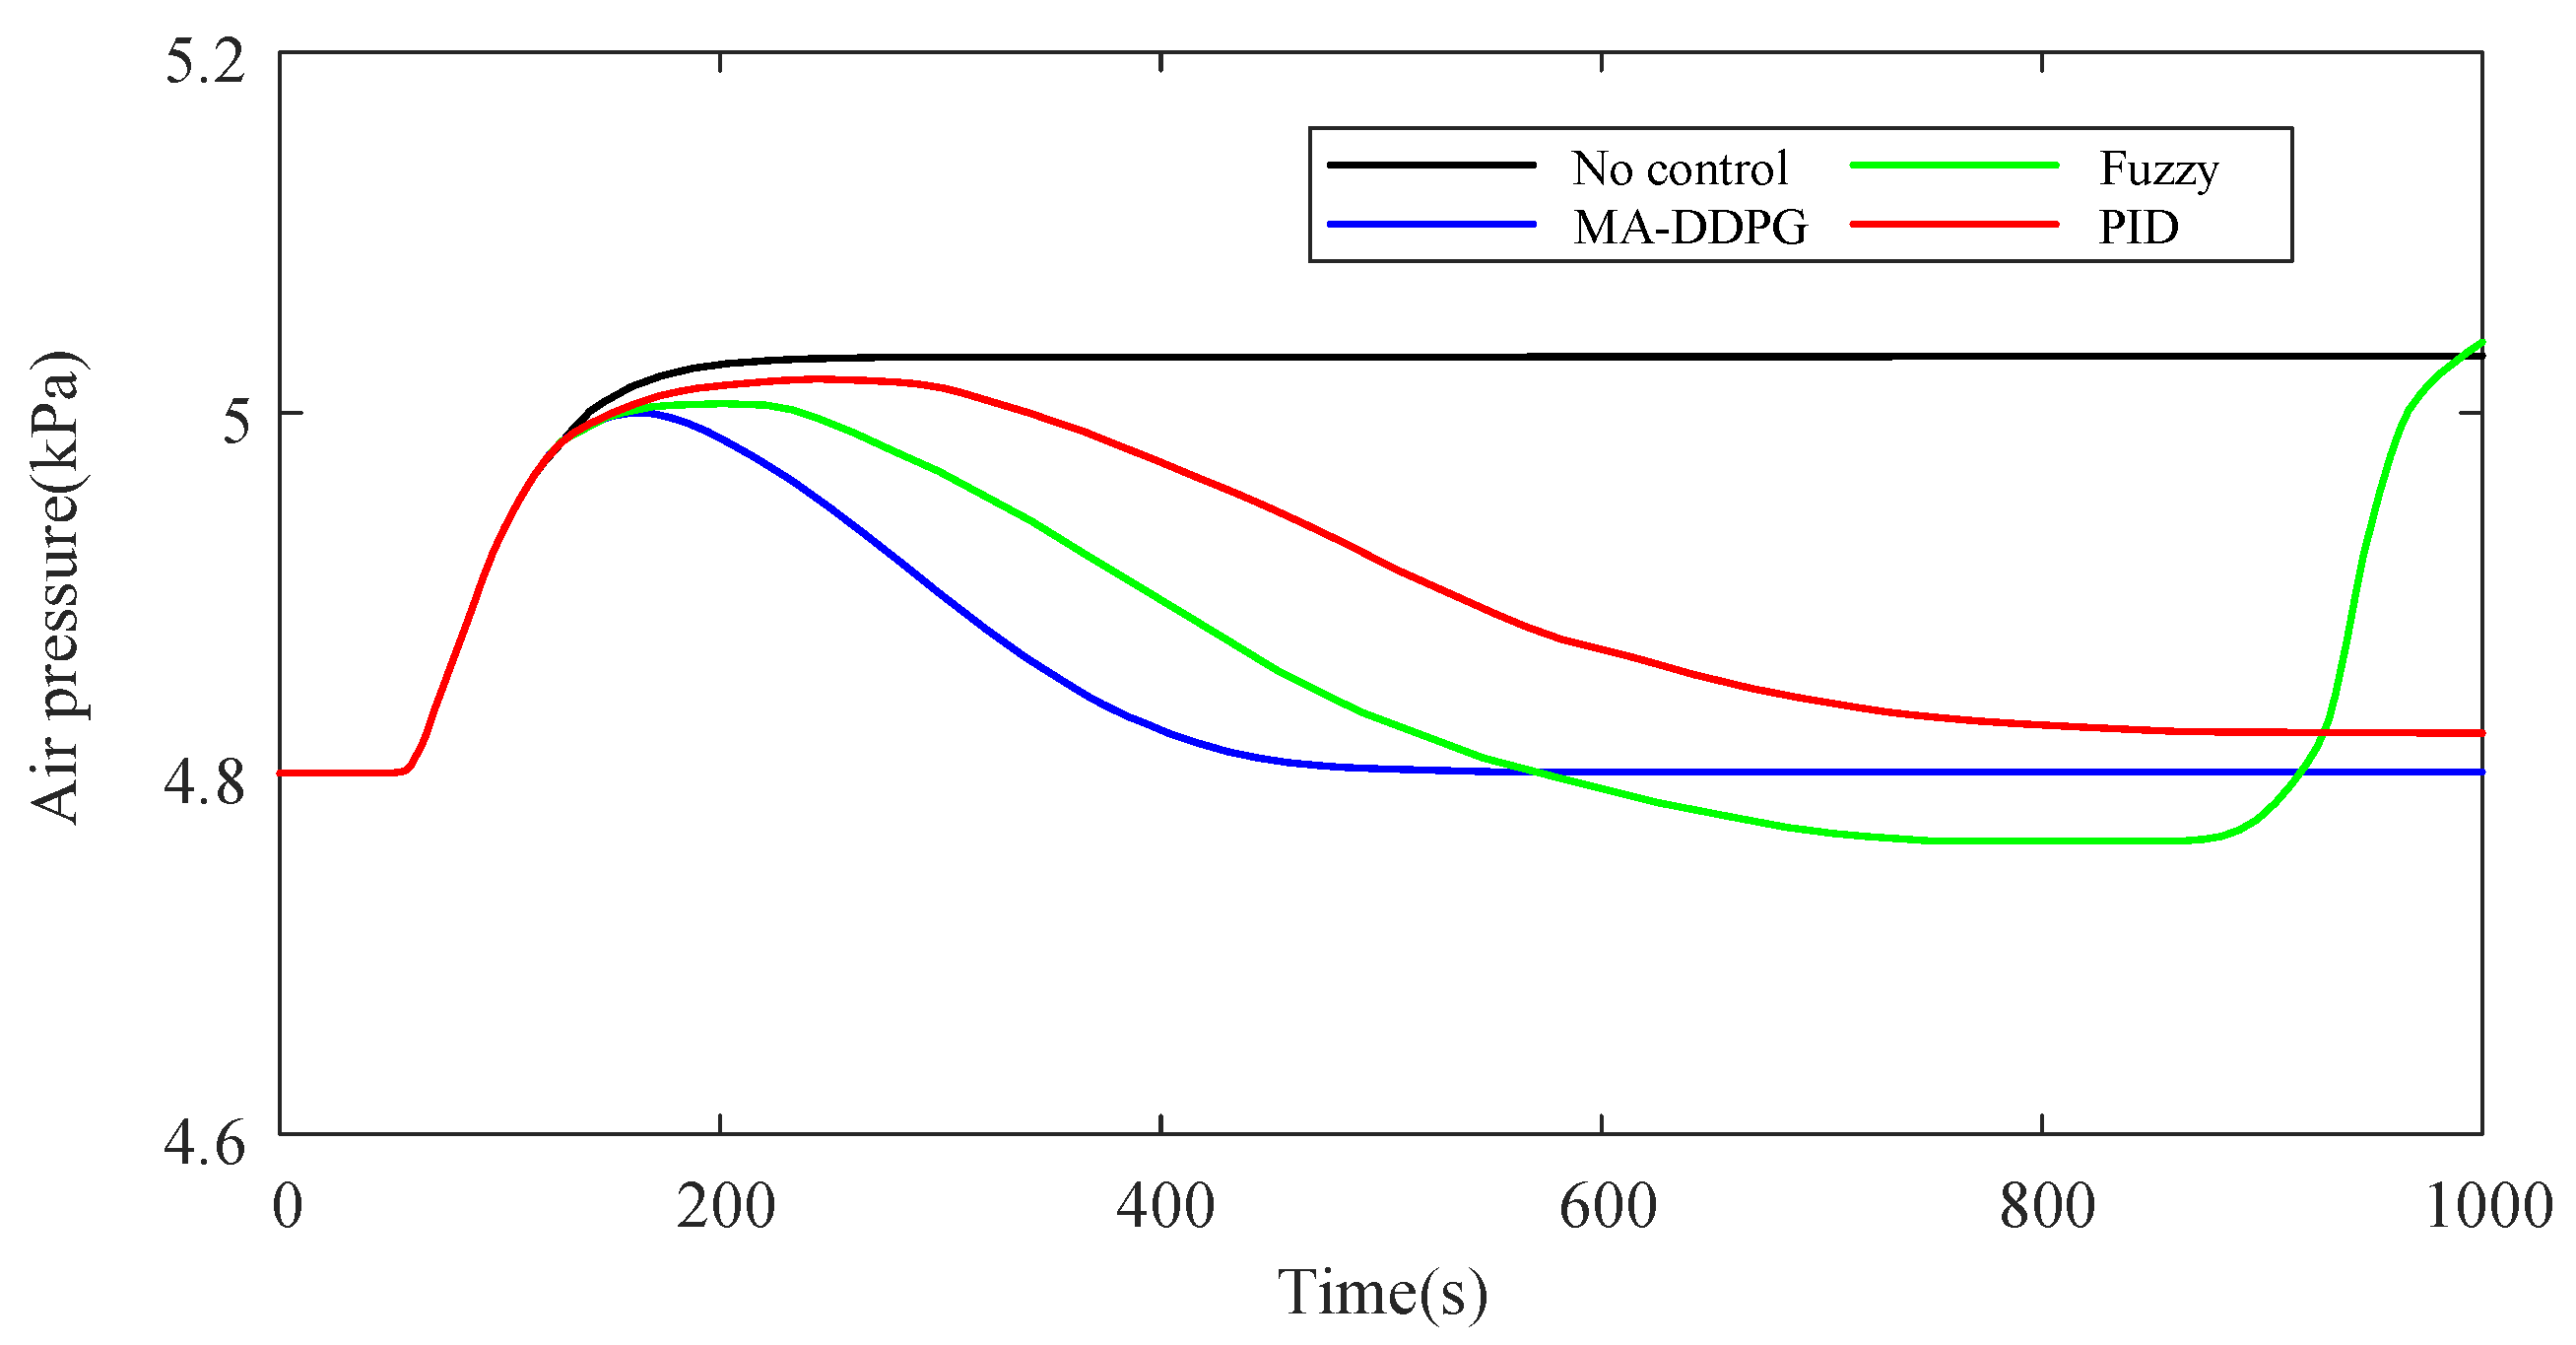
Since the MT and P2G equipment are operating in the PDG mode at this time, they cannot participate in the microgrid load frequency control, and act as a disturbance source, superimposed with the wind power disturbance and load disturbance to form a combined disturbance. Take MG 1 as an example, the power changes of the MT and P2G equipment under the control of MA-DDOG are shown in Figure 20. Moreover, the frequency variation under the action of the proposed MADDPG controller, Fuzzy controller and PI controller is shown in Figure 21. Meanwhile, the pressure changes of the natural gas network under the control of PI, fuzzy and MADDPG are shown in Figure 22.
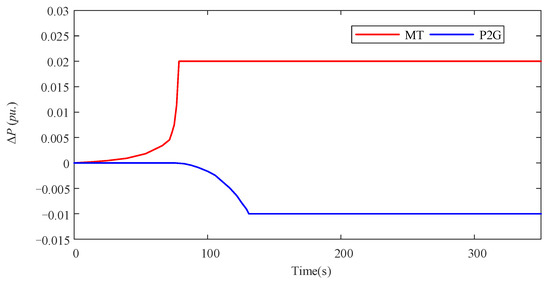
Figure 20.
The power changes of the MT and P2G equipment.

Figure 21.
Frequency deviation of MG1 under the natural gas load disturbance.
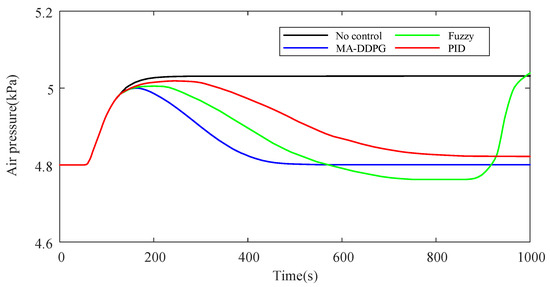
Figure 22.
The pressure changes of the natural gas network.
It can be seen that, under the combined disturbance, the load frequency controller based on MADDPG algorithm maintains excellent control effect, the amplitude of frequency fluctuation is smaller, the |Δf| can be controlled within the range of 0.03 Hz, reaching 100% excellent rate. Addirionally, the air pressure deviation can quickly return to 0. Therefore, the MADDPG controller can coordinate the frequency recovery and air pressure regulation of the microgrid with superior dynamic control characteristics.
6. Conclusions
In order to make the P2G system in the multi-microgrid have the ability to maintain frequency stability when affected by electrical load disturbances, the ability to maintain node air pressure stability when affected by natural gas load disturbances, and the ability to coordinate the overall stability of the multi-microgrid, a load frequency control strategy of multi-microgrid oriented to P2G system is proposed in this paper. The model of natural gas network and the coupling model of P2G system are built, and a multi-microgrid system including MT, P2G, EVs stations, WT and loads is established. Thus, a load frequency control strategy based on MADDPG is proposed. The simulation results show that:
- The model of P2G system with MT and P2G equipment as the coupling device is constructed, and the great interaction characteristics between the microgrid and the natural gas network are proved through simulation. The MADDPG algorithm with the cooperative regulation idea of “centralized training and decentralized execution” can meet the coordinated control of multi-microgrid.
- Compared with traditional controller, the MADDPG controller with the ability of online learning and experience playback can more effectively deal with the random disturbance of the multi-microgrid, the |Δf| can be limited in 0.03 Hz, and the excellent rate can reach 100%, which is significantly better than the PI controller and Fuzzy controller.
- The MADDPG controller can greatly coordinate the frequency recovery and air pressure adjustment of the multi-microgrid. When the node air pressure of the natural gas network changes, the MADDPG controller can ensure that the |Δf| of the microgrid is kept within 0.03 Hz, and quickly bring the node air pressure deviation close to 0.
Author Contributions
P.F. conceptualized the idea of this research, performed the experiments and data analysis in case 1, wrote the Section 1, Section 2 and Section 3 of this paper, and have read and agreed to the published version of the manuscript. J.H. conceptualized the idea of this research, performed the data analysis in case 2, wrote the Section 3, Section 4, Section 5 and Section 6 of this paper, provided supervision and reviewed the paper, and have read and agreed to the published version of the manuscript. S.K. conceptualized the idea of this research, wrote the Section 3 and Section 4 of this paper, provided supervision and reviewed the paper, and have read and agreed to the published version of the manuscript. Y.W. wrote the Section 4, Section 5 and Section 6 of this paper, and assisted in revising the English expression of the whole paper, provided supervision and reviewed the paper, provided necessary supervision and help for the experiment, and have read and agreed to the published version of the manuscript. S.Y. performed the experiments and data analysis in case 2, and assisted in revising the English expression of the whole paper, provided supervision and reviewed the paper, and provided necessary supervision and help for the experiment, provided supervision and reviewed the paper, and have read and agreed to the published version of the manuscript. J.Y. provided supervision and reviewed the paper and provided necessary laboratory site and theoretical guidance as a tutor, and have read and agreed to the published version of the manuscript. All authors have read and agreed to the published version of the manuscript.
Funding
This research was funded by Science and Technology Project of State Grid Hebei Electric Power Co., LTD. (KJ2021-061).
Conflicts of Interest
The authors declare no conflict of interest. The funders had no role in the design of the study; in the collection, analyses, or interpretation of data; in the writing of the manuscript, or in the decision to publish the results.
References
- Chu, S.; Majumdar, A. Opportunities and challenges for a sustainable energy future. Nature 2012, 488, 294–303. [Google Scholar] [CrossRef]
- Li, C. Proposal and parametric analysis of an innovative natural gas pressure reduction and liquefaction system for efficient exergy recovery and LNG storage. Energy 2021, 233, 120022. [Google Scholar] [CrossRef]
- Qin, G.; Zhang, M.; Yan, Q.; Xu, C.; Kammen, D.M. Comprehensive evaluation of regional energy internet using a fuzzy analytic hierarchy process based on cloud model: A case in China. Energy 2021, 1, 120569. [Google Scholar] [CrossRef]
- Li, Y.; Zhang, F.; Li, Y.; Wang, Y. An improved two-stage robust optimization model for CCHP-P2G microgrid system considering multi-energy operation under wind power outputs uncertainties. Energy 2021, 223, 120048. [Google Scholar] [CrossRef]
- Wang, C.; Wang, S.; Liu, F.; Bi, T.; Wang, T. Risk-loss coordinated admissibility assessment of wind generation for integrated electric-gas systems. IEEE Trans. Smart Grid 2020, 11, 4454–4465. [Google Scholar] [CrossRef]
- Martinez-Mares, A.; Fuerte-Esquivel, C.R. A unified gas and power flow analysis in natural gas and electricity coupled networks. IEEE Trans. Power Syst. 2012, 27, 2156–2166. [Google Scholar] [CrossRef]
- Bao, Z.; Ye, Y.; Wu, L. Multi-timescale coordinated schedule of interdependent electricity-natural gas systems considering electricity grid steady-state and gas network dynamics. Int. J. Electr. Power Energy Syst. 2019, 118, 105763. [Google Scholar] [CrossRef]
- Zhang, Z.; Wang, C.; Yang, M.; Chen, X.; Lv, H. Day-ahead optimal dispatch for integrated energy system considering power-to-gas and dynamic pipeline networks. IEEE Trans. Ind. Appl. 2021, 99, 1. [Google Scholar] [CrossRef]
- Chaudry, M.; Jenkins, N.; Strbac, G. Multi-time period combined gas and electricity network optimisation. Electr. Power Syst. Res. 2008, 78, 1265–1279. [Google Scholar] [CrossRef]
- Liu, Y.; Liu, T. Research on system planning of gas-power integrated system based on improved two-stage robust optimization and non-cooperative game method. IEEE Access 2021, 9, 79169–79181. [Google Scholar] [CrossRef]
- Zhong, Y.; Xie, W.; Zhang, X. A neural network compound control algorithm for complex nonlinear electric gas pressure regulating system. In 2016 Chinese Control and Decision Conference (CCDC); IEEE: Piscataway, NJ, USA, 2016; pp. 3055–3060. [Google Scholar]
- Rokrok, E.; Shafie-Khah, M.; Catalão, J.P. Review of primary voltage and frequency control methods for inverter-based islanded microgrids with distributed generation. Renew. Sustain. Energy Rev. 2018, 82, 3225–3235. [Google Scholar] [CrossRef]
- Bevrani, H.; Feizi, M.R.; Ataee, S. Robust frequency control in an islanded microgrid: H∞ and μ-Synthesis approaches. IEEE Trans. Smart Grid. 2015, 7, 706–717. [Google Scholar] [CrossRef] [Green Version]
- Jiang, Y.; Guo, L. Research on wind power accommodation for an electricity-heat-gas integrated microgrid system with power-to-gas. IEEE Access 2019, 7, 87118–87126. [Google Scholar] [CrossRef]
- Masuta, T.; Yokoyama, A. Supplementary load frequency control by use of a number of both electric vehicles and heat pump water heaters. IEEE Trans. Smart Grid 2012, 3, 1253–1262. [Google Scholar] [CrossRef]
- Long, B.; Liao, Y.; Chong, K.T.; Rodriguez, J.; Guerrero, J.M. Enhancement of frequency regulation in ac microgrid: A fuzzy-MPC controlled virtual synchronous generator. IEEE Trans. Smart Grid 2021, 12, 3138–3149. [Google Scholar] [CrossRef]
- Wang, X.; Yang, J.; Chen, L.; He, J. Application of liquid hydrogen with SMES for efficient use of renewable energy in the energy internet. Energies 2017, 10, 185. [Google Scholar] [CrossRef] [Green Version]
- Vachirasricirikul, S.; Ngamroo, I. Robust controller design of microturbine and electrolyzer for frequency stabilization in a microgrid system with plug-in hybrid electric vehicles. Int. J. Electr. Power Energy Syst. 2012, 43, 804–811. [Google Scholar] [CrossRef]
- Kelkoul, B.; Boumediene, A. Stability analysis and study between classical sliding mode control (SMC) and super twisting algorithm (STA) for doubly fed induction generator (DFIG) under wind turbine. Energy 2020, 214, 118871. [Google Scholar] [CrossRef]
- Rezaei, N.; Mazidi, M.; Gholami, M.; Mohiti, M. A new stochastic gain adaptive energy management system for smart microgrids considering frequency responsive loads. Energy Rep. 2020, 6, 914–932. [Google Scholar] [CrossRef]
- Zhang, Y.; Fu, L.; Zhu, W.; Bao, X.; Liu, C. Robust model predictive control for optimal energy management of island microgrids with uncertainties. Energy 2018, 164, 1229–1241. [Google Scholar] [CrossRef]
- Salehi, J.; Namvar, A.; Gazijahani, F.S.; Shafie-khah, M.; Catalão, J.P. Effect of power-to-gas technology in energy hub optimal operation and gas network congestion reduction. Energy 2022, 240, 122835. [Google Scholar] [CrossRef]
- Zhang, Y.; Yang, J.; Pan, X.; Zhu, X.; Zhan, X.; Li, G.; Liu, S. Data-driven robust dispatch for integrated electric-gas system considering the correlativity of wind-solar output. Int. J. Electr. Power Energy Syst. 2022, 134, 107454. [Google Scholar] [CrossRef]
- Wu, X.; Zhang, Y.; Arulampalam, A.; Jenkins, N. Electrical stability of large scale integration of micro generation into low voltage grids. Int. J. Electron. 2005, 1, 299–320. [Google Scholar]
- Goerguen, H. Dynamic modelling of a proton exchange membrane (PEM) electrolyzer. Int. J. Hydrog. Energy 2006, 31, 29–38. [Google Scholar] [CrossRef]
- Yang, J.; Zeng, Z.; Tang, Y.; Yan, J.; He, H.; Wu, Y. Load frequency control in isolated micro-grids with electrical vehicles based on multivariable generalized predictive theory. Energies 2015, 8, 2145–2164. [Google Scholar] [CrossRef]
- Fan, P.; Ke, S.; Kamel, S.; Yang, J.; Li, Y.; Xiao, J.; Xu, B.; Rashed, G.I. A frequency and voltage coordinated control strategy of island microgrid including electric vehicles. Electronics 2021, 11, 17. [Google Scholar] [CrossRef]
- Rao, Y.; Yang, J.; Xiao, J.; Xu, B.; Liu, W.; Li, Y. A frequency control strategy for multimicrogrids with V2G based on the improved robust model predictive control. Energy 2021, 222, 119963. [Google Scholar] [CrossRef]
- Huang, L.; Fu, M.; Qu, H.; Wang, S.; Hu, S. A deep reinforcement learning-based method applied for solving multi-agent defense and attack problems. Expert Syst. Appl. 2021, 176, 114896. [Google Scholar] [CrossRef]
- Yang, Q.; Zhu, Y.; Zhang, J.; Qiao, S.; Liu, J. UAV air combat autonomous maneuver decision based on ddpg algorithm. In Proceedings of the 2019 IEEE 15th International Conference on Control and Automation (ICCA) IEEE, Edinburgh, Scotland, 16–19 July 2019. [Google Scholar]
- Li, Y.; Ma, G.; Yang, J.; Wang, H.; Feng, J.; Ma, Y. Dynamic equivalent modeling for power converter based on LSTM neural network in wide operating range. Energy Rep. 2021, 7, 477–484. [Google Scholar] [CrossRef]
- Yang, Z.; Wang, J.; Gao, S.; Zhou, D. A method to estimate speed droop ratios for primary frequency control responses in power generation units. Int. J. Electr. Power Energy Syst. 2020, 119, 105868. [Google Scholar] [CrossRef]
- Yu, T.; Zhou, B.; Chan, K.W.; Yuan, Y.; Yang, B.; Wu, Q.H. R(λ) imitation learning for automatic generation control of interconnected power grids. Automatica 2012, 48, 2130–2136. [Google Scholar] [CrossRef]


Publisher’s Note: MDPI stays neutral with regard to jurisdictional claims in published maps and institutional affiliations. |
© 2022 by the authors. Licensee MDPI, Basel, Switzerland. This article is an open access article distributed under the terms and conditions of the Creative Commons Attribution (CC BY) license (https://creativecommons.org/licenses/by/4.0/).