1. Introduction
Grain is a key commodity related to national economies and the livelihood of people. This means that ensuring grain security is a key major strategic issue to maintain the healthy development of a national economy, social stability, and even independence [
1]. In 2015, the United Nations issued 17 sustainable development goals, with the top two being no poverty and zero hunger [
2]. The time for the realization of the goal of zero hunger is 2030, but now the unprecedented hunger crisis is spreading all over the world. Since the COVID-19 spread around the world in 2020, the problem of global grain security has been very serious [
3]. The supply chain disruption caused by the Russia–Ukraine war further has worsened the situation [
4]. Grain shortages have caused world grain prices to soar to record levels [
5]. The 2022 Global Report of Food Crisis pointed out that about 193 million people in 53 countries and regions faced serious grain shortages in 2021 [
6]. The outbreak of the current epidemic in DPRK is undoubtedly having a serious impact on grain production and import, and the problem of grain shortage continues to worsen. As a result of a specific geopolitical background as well as floods, droughts, lack of agricultural means of production, and many other reasons [
7], grain production in the Democratic People’s Republic of Korea (DPRK) dropped sharply throughout the 1990s, which resulted in a serious famine. Grain shortages in the DPRK have subsequently become a key issue of global concern. Thus, between 2006 and 2017 and as a result of the nuclear issue, the United Nations Security Council adopted eight resolutions to sanction the DPRK, which rendered this nation economically isolated and significantly influenced grain production. A series of major changes have, however, taken place in the DPRK since 2018; national endeavors have gradually shifted in this country from nuclear weapons development to economic construction. At the same time, interactions between China, the United States, and the DPRK have also increased, and the geopolitical situation has started to ease.
Grain problems within the DPRK have attracted considerable research attention. International endeavors have mainly emphasized the impact of floods on grain shortages in the 1990s [
8,
9,
10], and attention has been afforded to the nutritional levels and living conditions of residents from a social science perspective [
10,
11,
12,
13]. In China, research has addressed the problems, causes, and countermeasures of DPRK grain production from a range of different angles [
14,
15,
16,
17,
18,
19] and has also qualitatively assessed the policies and forms of international assistance [
20,
21,
22] that has been made available. In terms of institutional economics, some expects pay attention to the importance of the political system functioning in a given country in shaping permanent foundations for development [
23,
24]. However, no comprehensive multisource data analysis has so far been presented to assess grain supply and consumption within the DPRK.
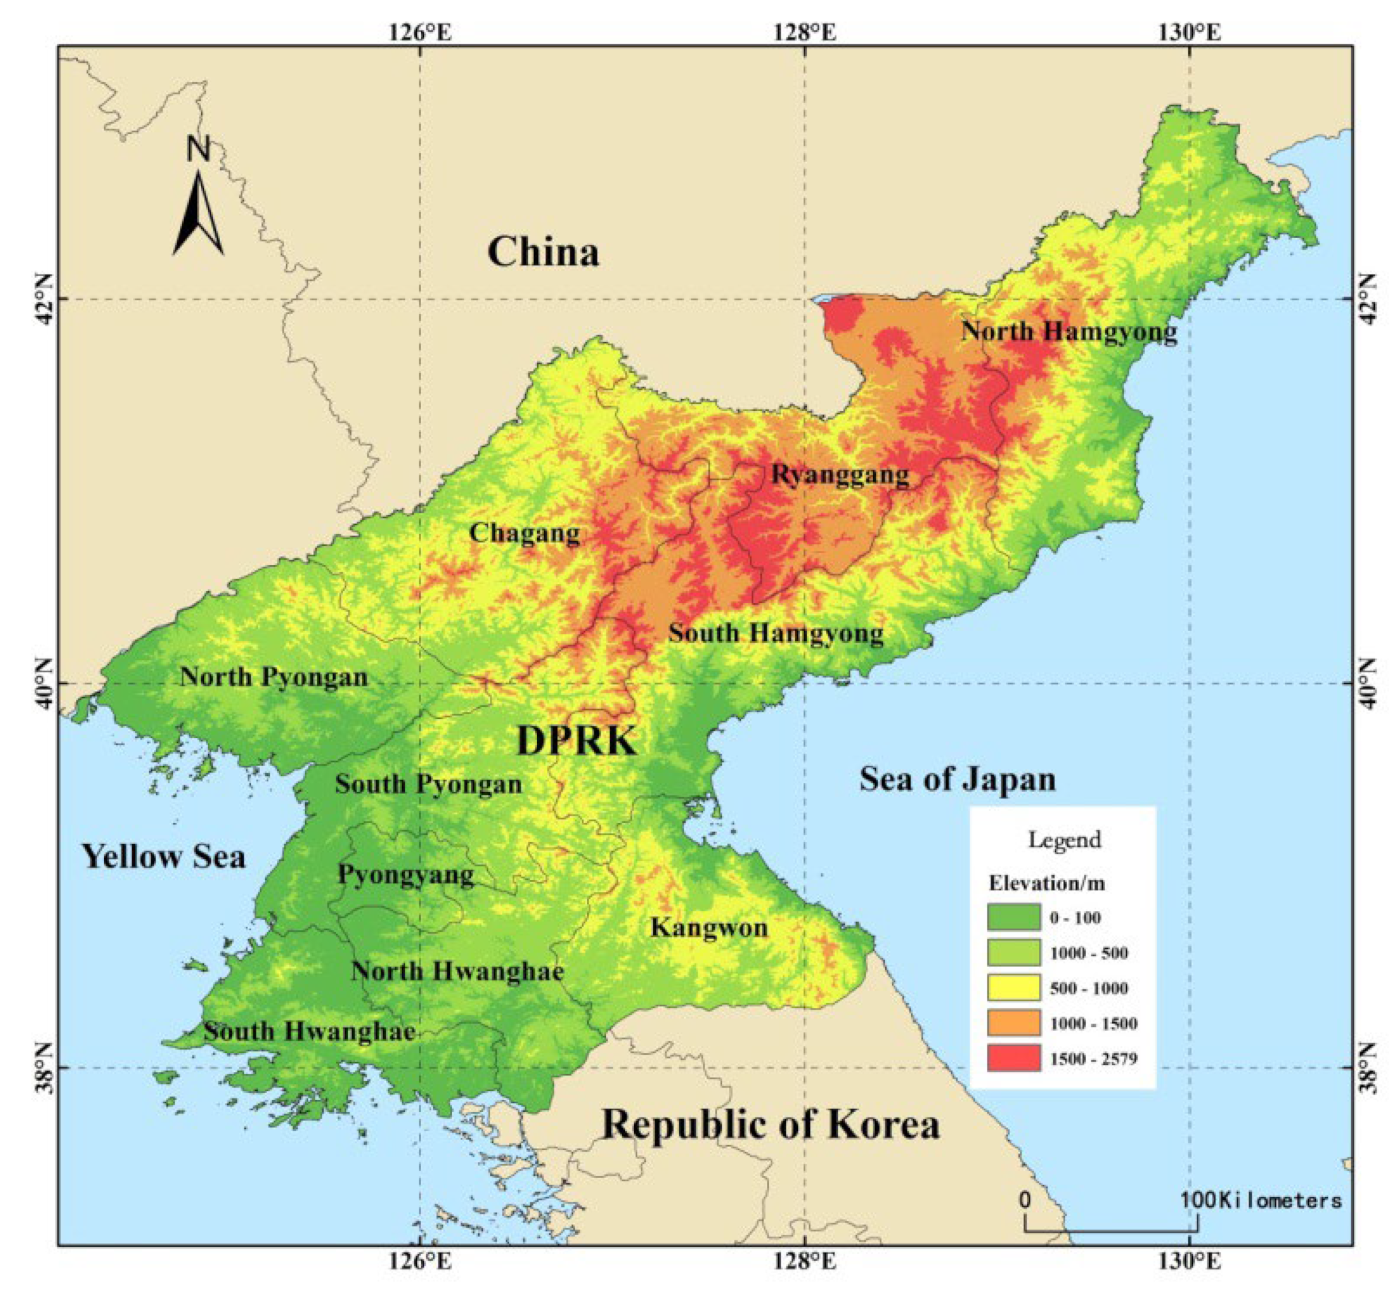
The DPRK is located in East Asia, adjacent to China in the north, Russia to the northeast, and the Republic of Korea in the south. Mountains, plateaus, and hills encompass about 80% of total land area (
Figure 1); the annual average temperature falls between 8 °C and −12 °C, while the annual average precipitation is between 580 mm and 950 mm. Precipitation across the DPRK decreases from the south to the north. The DPRK is divided into 13 provincial administrative regions, including Pyongyang, Nanpo, Rason, North Phyongan, South Phyongan, Chagang, Ryanggang, South Hamgyong, North Hamgyong, Gangwon, North Hwanghae, and South Hwanghae. The arable land is mainly located in the western and southern regions including North Phyongan, South Phyongan, Pyongyang, North Hwanghae, and South Hwanghae [
25]. Rice is the dominant crop planted across the DPRK, followed by maize, soybean, and potato [
26,
27,
28]. China has more people and less land compared to other countries in the world, and its cultivated land planting intensity is very high. China’s experience in agricultural production can help increase the agricultural production level in the DPRK, and there are good prospects for cooperation. The DPRK is an important neighbor to China, and it is thus very important to scientifically evaluate grain supply and consumption to develop agricultural cooperation between the two countries. We used statistical and remote sensing (RS) data to reveal the DPRK grain supply and consumption via time series, comparative geographical regions, and geographic information systems (GIS) spatial analyses, as well as other methods. We compared the DPRK with the Liaoning and Hebei provinces in China, as these regions possess similar natural conditions. This approach enabled us to compare the relative levels and grain production developmental stages.
2. Materials and Methods
2.1. Materials and Implications
Grain security is an often-used phrase, frequently left undefined. In this analysis, the term “grain” refers generally to cereals (i.e., rice, maize, wheat, and others), beans, and potatoes [
29]. The basic definition of grain security applied here implies that a country has sufficient grain to cover its needs; thus, ‘grain supply’ encapsulates production, imports, and grain aid. Per capita grain possession refers to the grain supply of a region divided by the total population. Grain consumption refers to the quantitative and structural changes in the per capita grain possession (for example, the quantity and structure changes of rice, wheat, maize, potatoes, and beans).
Our research aims were as follows: (1) using FAO and remote sensing data, we systematically studied the changes of DPRK’s grain production capacity in the past 60 years. (2) by comparing geographical region, we identified the possible changes in grain production in the DPRK. Agricultural production conditions included cultivated land quality, fertilization, irrigation, and farming system. Data relating to grain yield, planting, and irrigation area across the DPRK and the Republic of Korea were collected from the United Nations FAO (
http://www.fao.org, accessed on 31 May 2022) [
30] and encompassed the period between 1961 and 2019. Fertilizer production data for the DPRK were also sourced from the FAO and from the Ministry of Unification (
http://kosis.kr/bukhan/index/index.do, accessed on 31 May 2022) [
31,
32]. Chinese grain production, yield, fertilizer production, irrigation, and planting area data were extracted from the National Bureau of Statistics (
http://www.stats.gov.cn, accessed on 31 May 2022) [
33] and encompassed the period between 1949 and 2019. It is also important to note that the city of Nanpo was originally subordinate to South Phyongan but is now considered a special city within the DPRK and encompasses a small administrative area. Thus, in order to facilitate the statistical analysis, Nanpo results were included within the sample of South Phyongan, and the results of Rason were included within the sample of North Hamgyon.
A Digital Elevation Model (DEM) was developed based on information sourced from the Computer Network Information Center of the Chinese Academy of Sciences (
https://www.casdc.cn/, accessed on 31 May 2022) [
34]. Meteorological data were sourced from the National Centers for Environmental Information (NCEI) of the NOAA (
https://gis.ncdc.noaa.gov/maps/ncei, accessed on 31 May 2022) [
35] as well as from world climate data (
https://www.worldclim.org/, accessed on 31 May 2022). Data contained daily average, maximum and minimum temperatures as well as precipitation amounts, snow depth, and other data. Thus, on the basis of calculations and spatial interpolations, a distribution map of the annual average precipitation and accumulated temperature were obtained. Cropland extent land use data in 2015 for southern and northern Asia at a 30 m scale were sourced from Global Food Security-Support Analysis Data (GFSAD,
https://www.usgs.gov/centers/wgsc/science/, accessed on 31 May 2022) [
36].
2.2. Methods
(1) Time series analysis. We systematically studied temporal changes in grain supply and consumption within the DPRK over the last 60 years using multi-source data. We focused on the volatility, stages, and trends that characterize these changes in order to reveal key temporal nodes and extreme values.
(2) Comparative analysis of geographical regions. We compared natural geographic areas similar to the DPRK, especially the Liaoning and Hebei provinces in China, and used ‘time for space’ and ‘space for time’ methods to reveal possible changes in grain production.
(3) We studied the spatial distribution of grain production based on land use and FAO statistical data. The purpose of grain production spatialization is to decompose the production within each grid on the basis of certain rules [
37]. The DPRK was therefore divided into a 1 km × 1 km resolution grid. Grain production within each grid was decomposed into the product of two variables: the first of these was cultivated land area within the grid, while the other was grain yield. This was calculated as follows:
In this expression, Pi denotes production in grid i (kg), while Ai denotes cultivated land area within grid I (hm2), and Yi denotes yield in grid I (kg/hm2). This formula is used to estimate the spatial distribution of grain production in the DPRK.
3. Results
3.1. Grain Production Analysis via Spatialization
Changes in grain production across the DPRK were divided into three periods, i.e., continuous growth, violent fluctuation, and slow recovery. The data showed that grain production within the DPRK more than doubled from 4 million tons to 9.835 million tons over the period between 1961 and 1991. It is clear that the period between 1992 and 1997 was characterized by violent fluctuations in grain production. This value dropped sharply from a peak of 3.35 million tons (1996) to a value even lower than that seen in 1961. A slow recovery between 1998 and 2019 meant that DPRK grain production gradually increased to the 1975 level, that was 6 million tons.
The staple grain crop in the DPRK comprises rice and maize. Rice is the main component of grain production, providing at least 43% of grain supply, and maize is the second major constituent. The proportion of maize out in the total grain production decreased significantly throughout the 1990s, while wheat production across the DPRK remained low. Beans production nationally remained relatively stable, while potato has been an important staple for the DPRK since the 1990s. A high potato yield could effectively alleviate grain shortages.
The main grain-producing areas within the DPRK include plain areas in the west and southwest (North Phyongan, South Phyongan, Pyongyang, North Hwanghae, and South Hwanghae) (
Figure 2). The grain output of these five provincial-level administrative regions was 3.62 million tons, accounting for 60% of the total grain output of the DPRK. These regions share the characteristics of a concentrated coastal zone distribution. A number of areas along the eastern coast also boast high production levels, including the region near Chungjin. Grain production statistics revealed that South Phyongan and South Hwanghae are the largest grain-producing areas within the DPRK (1.73 million tons), accounting for about 30% of the national production volume. The area of Pyongyang encompasses less than 3000 km
2 and provides nearly 3.8% of grain production (0.23 million tons). In contrast, grain production in South Hamgyong is mainly concentrated in the surrounding coastal counties with Hamhung at their center, while production in North Hamgyong is mainly concentrated in the surrounding coastal counties with Chungjin at their center. It is also noteworthy that Chagang road and Ryangyang are located in mountainous areas, and so their grain production capacity remains low (their grain output was 0.42 million tons and 0.25 million tons, respectively). The Taedong River Basin is also an important grain production area, one of eight major river basins within the DPRK. This region also boasts the most favorable irrigation conditions and quality of cultivated land.
3.2. A Time-Series Approach to Grain Consumption Analysis
It is clear that per capita grain possession is an important index that reflects the level of regional security. The level of change in DPRK per capita grain possession between 1961 and 2019 remained similar depending on the grain supply stage. This trend can be divided into three periods, specifically, stable, fluctuation, and recovery. Data show that between 1961 and 1991, per capita grain possession within the DPRK was more than 350 kg, in some years more than 400 kg. This contrasts with the situation between 1992 and 2000, when per capita grain possession sharply declined, reaching as low as 200 kg. Data then show that per capita grain possession recovered briefly between 2001 and 2019 but did not return to the levels of stable periods.
It is informative to compare grain supplies in the DPRK, China, and the Republic of Korea. Thus, while per capita grain possession in the DPRK was 260 kg, this value was 520 kg in China and 450 kg in the Republic of Korea. The per capita grain share of possession in the DPRK was 50% that of China over this period, equivalent to the average Chinese level in the 1960s (259 kg). Similarly, per capita grain possession in the DPRK was 60% of that of the Republic of Korea, actually lower than the average level in this neighboring country in the 1960s (300 kg).
In terms of per capita grain possession, according to
Figure 3a, cereals accounted for just 66.1% of the total, and potato accounted for 25.7%. It is clear that rice and maize accounted for the largest proportion and were the main supply source for residents. Indeed, throughout this period of fluctuation, increases and decreases in maize production also led to fluctuations in per capita grain possession. The changes in the geopolitical patterns in the 1990s had a great impact on DPRK’s grain production, with great fluctuations. The long-term sanctions of the United Nations superimposed with the lack of domestic resources of the DPRK, which made the improvement of grain production relatively slow.
3.3. Grain Security Analysis
The United Nations FAO believes that it is safe for a country to reach 400 kg per capita of grain possession [
38]. In this context, and according to the DPRK grain supply and consumption situation, this relationship transitioned from a ‘supply and consumption balance’ to a ‘supply exceeding consumption’ situation between 1961 and 2019 (
Figure 4). This transition can be divided into two stages encompassing food and clothing (between 1961 and 1994) and poverty (between 1995 and 2019). Thus, between 1961 and 1994, the DPRK actually achieved grain self-sufficiency and reached a basic balance between supply and consumption. Data show that per capita grain possession was basically maintained over this period at about 400 kg and that in some years it rose close to 490 kg. Subsequent to 1995, however, grain production within the DPRK dropped sharply; considering imports and international assistance, per capita grain possession remained at about 260 kg around this time. It is noteworthy that since the implementation of international aid to the DPRK around 1995, more than 400,000 tons of grain was received each year. This equates to a cumulative total of more than 12 million tons. However, as the DPRK population has grown rapidly, pressures on the grain supply have also greatly increased. Ensuring an adequate grain supply remains a major problem that will need to be solved in the future.
3.4. Geographical Region Comparison
3.4.1. Comparisons of Similar Agricultural Factors
The total territory of the DPRK is equivalent to one province in eastern China. This means that in terms of meaningful analyses of grain production and potential, it is more useful to compare the DPRK with the Liaoning and Hebei provinces, as these regions share similar natural and geographic conditions (
Table 1). Natural factors influencing grain production mainly include hours of illumination as well as temperature, precipitation, and soil fertility. Indeed, from the perspective of geographic zonality, the DPRK is similar to both Liaoning and Hebei provinces (
Figure 5 and
Figure 6). The agricultural production capacity of these three regions is equivalent, as they share the same natural conditions.
3.4.2. Cultivated Land Quality
The quality of cultivated land directly influences grain production. Data show that cultivated land area within the DPRK has reached as high as 3.3286 million hectares, including a large proportion of slope farmland. Amongst this area, the proportion of cultivated land with slopes below 5° is 1,624,700 ha, 48.81% of the total. Similarly, the cultivated land area with slopes between 5° and 10° is 790,900 ha, 23.76% of the total. The cultivated land area with slopes greater than 10° encompasses 912,900 ha, i.e., 27.43% of the total.
The cultivated lands with slopes less than 5° are mainly distributed on the western coastal plain within the DPRK. This region includes more than 45% of high-quality cultivated land nationally (
Figure 7). In contrast, cultivated land with slopes between 5° and 10° is mainly found in South Hamgyong, North Hamgyong, and North Hwanghae, encompassing 10.75% of the total. Farmland with slopes greater than 10° tends to be distributed in the hilly areas of Ryangyang and North Phyongan; here, the proportion of slope farmland encompasses 9.17% of total cultivated land, while other regions exhibit different proportions. Cultivated land resources within the DPRK are limited therefore, and it is clear that large slope farmland areas have been developed to increase grain production. At the same time, the fertility and cultivation conditions of these lands remain relatively low; the grain production capacity therefore remains insufficient, another important factor influencing grain production.
3.4.3. Irrigation Level
Effective irrigation area refers to the proportion of cultivated land that can be irrigated in a normal year. This is therefore an important index that can be used to understand the drought resistance of cultivated land, as well as a key factor for improving grain production. Data show that the overall irrigation level within the DPRK has been high; the effective rate continued to increase in a continuous manner prior to the 1990s and then remained stable (
Figure 8). Indeed, between 1961 and 2018, the effective irrigation rate of DPRK cultivated land increased by 35.13% from 21.46, reaching 56.59%. In contrast, the cultivated land irrigation rate in China was 58.33%, specifically, 39.63% in Liaoning Province and 70.45% in Hebei Province. This means that, under normal conditions, 56.59% of cultivated land within the DPRK was effectively irrigated over this period. Similarly, before the 1990s, the DPRK irrigation level was basically equivalent to that of Hebei Province, better than that of Liaoning Province. Subsequent to the 1990s, the DPRK irrigation level remained lower than that of Hebei Province but was still higher when compared with that of Liaoning Province.
The total cultivated land area within the DPRK is 3.3286 million hm2 on the basis of cultivated land area and irrigation level calculations. This includes 1.8973 million hm2 of irrigated land and 1.4312 million hm2 of dry land area without irrigation. The cultivated irrigated land within the DPRK is mainly distributed on western plain areas, including North Phyongan, South Phyongan, Pyongyang, North Hwanghae, and South Hwanghae. These areas tend to be rich in water resources and boast intensive irrigation channels. This means that, purely in terms of irrigation conditions, the DPRK would be able to achieve the same grain production levels as those seen in Liaoning and Hebei provinces through the optimization of agricultural production factors in the future.
3.4.4. Fertilizer Applications
The amount of fertilizer is also an important factor influencing grain production. Across a certain range, therefore, the amount of applied fertilizer will be directly proportional to grain production. Historical data show that prior to the 1990s, chemical fertilizer production within the DPRK was able to meet the grain cultivation demand (
Figure 9). Subsequently, however, the supply of chemical fertilizers has been unable to meet the agricultural production demand and has declined sharply to 1970s levels.
Results show that between 1961 and 1993, the proportion of chemical fertilizer applied across the DPRK increased to 427.05 kg/hm2, while this level was only 311.90 kg/hm2 and 274.98 kg/hm2 in Liaoning and Hebei provinces, respectively. It is also clear that the application of fertilization has declined sharply subsequent to 1993, while the amount used across the DPRK was surpassed by Liaoning and Hebei provinces after 1996. Data show that fertilizer application across the DPRK in 2018 was 282.35 kg/hm2, far lower than the values of 458.19 kg/hm2 and 524.37 kg/hm2 in Hebei and Liaoning provinces, respectively. The DPRK clearly needs to increase inputs of either chemical or organic fertilizers to ensure grain production.
3.4.5. Farming System
Moderately enhancing the multiple cropping index provides an important measure to mitigate shortages in cultivated land resources. However, as crops in the DPRK are generally planted once a year, this greatly limits grain production. One change that could be implemented would be to switch to a farming system of three crops over two years or two crops in a single year in some regions of the DPRK according to temperature and precipitation conditions. The farming system across the DPRK could also be subdivided into areas where one crop is cultivated per year, three crops over two years, and two crops in a year. The results of this analysis show that both water and heat conditions are sufficient in South Hwanghae for the cultivation of two crops a year, while three crops could be planted every two years, or the original planting mode could be maintained in some areas of South Phyongan, North Hwanghae, and South Hamgyong. The current farming system of one crop a year could be maintained in other areas due to limited hydrothermal conditions. Data show that the cultivated land area within the DPRK where two crops could be grown each year reaches as high as 554,200 hectares (
Figure 10). The implementation of two crops per year would increase grain production by at least 2.3 million tons and guarantee the supply for at least 880,000 people. Similarly, cultivated land within the two-year three-crop area encompasses 1,293,600 hectares. This means that the implementation of this system will increase the grain supply by at least 2.6 million tons annually and guarantee the supply for at least one million people. The DPRK can enhance grain production significantly by changing the national farming system.
4. Discussion
It is clear that the issue of grain security is very important in the DPRK. Changes in geopolitical patterns throughout the 1990s had significant impacts on agriculture across the DPRK, especially on grain production. The impacts of eight UN sanctions over 12 years in response to a 2006 DPRK nuclear test have meant slow improvements in the grain production capacity. The basis of sustainable economic development is the free market and the democratic system. We make three basic suggestions for improvement based on comparisons with China and the Republic of Korea.
(1) It is clear that prior to 1992, the DPRK experienced a ‘golden period’ characterized by continuous improvements in grain production capacity [
8,
9,
10,
11]. The agricultural production levels throughout this period exceeded even those of China. Thus, the DPRK can solve the current grain problem by implementing an agricultural management system or a series of technological innovations [
15].
(2) The DPRK possesses favorable natural and water conservancy infrastructural conditions that can facilitate a substantial increase in its grain production capacity. As long as fertilizer production capacity and management levels are enhanced, the DPRK will maintain a significant potential to increase grain production [
19].
(3) China and the DPRK are geographically close and related to each other historically. There is thus great potential to promote agricultural cooperation, especially in grain production, given the significant improvements on the Korean Peninsula since 2018.
Due to the closeness and the lack of the research on grain security related to DPRK, research in the DPRK will face great challenges. Nevertheless, we still hope to draw some conclusions through our own views and methods. Future research hopes to use more effective methods and have richer data and more results for reference.
5. Conclusions
Comprehensive analyses of statistical, RS, DEM, meteorological, and GIS data enabled us to explore the relationship between grain supply and consumption across the DPRK. We present comparisons with the situation in China and in the Republic of Korea and compared four agricultural factors to identify the root causes of grain shortages. The results of this analysis led to a number of key conclusions.
(1) Grain production in the DPRK in 2019 was equivalent to that in 1975. Staple grains were rice and maize, with more than 43% of supply due to the former. Potato has also become an important staple grain within the DPRK since the mid-1990s; high yields of this crop have effectively alleviated grain shortage problems. The main grain-producing areas across the DPRK are plains areas in the west and southwest, including North Phyongan, South Phyongan, Pyongyang, North Hwanghae, and South Hwanghae.
(2) Data show that 2019 per capita grain possession across the DPRK was 260 kg, equivalent to the average Chinese level in the 1960s (259 kg) and lower than the average level in the Republic of Korea (300 kg) at the same time. Cereals accounted for just 66.1% while potato accounted for 25.7% at this time. This is an important conclusion because, prior to 1994, the DPRK was basically grain self-sufficient. Data show that grain production dropped sharply after 1995; the country remained unable to meet the internal demand, even relying on imports and international assistance.
(3) The cultivated land area within the DPRK is as high as 3.3286 million hectares and includes a large proportion of slope farmland. The fertility and cultivation conditions of this slope farmland remain relatively poor, another important factor influencing grain production.
(4) The DPRK possesses good irrigation infrastructure, another characteristic that is important for successful grain production. Indeed, under normal circumstances, the DPRK is able to ensure that at least half of all cultivated land is effectively irrigated.
(5) Data show that prior to the 1990s, chemical fertilizer production within the DPRK was able to meet the needs of grain production. The supply of chemical fertilizer at the moment remains unable to meet the agricultural production demand, as it remains at the 1970s levels. The DPRK therefore needs to increase inputs of chemical or organic fertilizers to ensure grain production.
(6) The southern region of the DPRK is characterized by adequate water and heat conditions. We therefore suggest that it will be necessary to implement a farming system comprising either three crops over two years or two crops in one year to further increase grain yields. The implementation of such multi-cropping farming system will increase grain production by at least 4.9 million tons and guarantee the supply for at least 1.88 million people.
Author Contributions
Conceptualization, L.J. and Y.L.; methodology, Y.L.; formal analysis, L.J.; resources, L.J. and Y.L.; data curation, L.J. and Y.L.; writing-original draft preparation, L.J. and Y.L.; writing-review and editing, L.J. and Y.L.; supervision, L.J. and Y.L.; project administration, L.J.; funding acquisition, L.J. All authors have read and agreed to the published version of the manuscript.
Funding
This research was funded by grants from the National Natural Science Foundation of China (42071253).
Institutional Review Board Statement
Not applicable.
Informed Consent Statement
Not applicable.
Data Availability Statement
The data presented in this study are available on request to authors.
Conflicts of Interest
The authors declare that they have no conflict of interest.
References
- Cheng, S.; Wang, S. Food security strategy and food supply-side reform for new development phase. Bull. Chin. Acad. Sci. 2017, 32, 1074–1082. [Google Scholar]
- Griggs, D.; Stafford-Smith, M.; Gaffney, O. Sustainable development goals for people and planet. Nature 2013, 495, 305–307. [Google Scholar] [CrossRef] [PubMed]
- Rahman, M.T.; Akter, S.; Rana, M.R.; Sabuz, A.A.; Jubayer, M.F. How COVID-19 pandemic is affecting achieved food security in Bangladesh: A perspective with required policy interventions. J. Agric. Food Res. 2022, 7, 100258. [Google Scholar] [CrossRef] [PubMed]
- Saâdaoui, F.; Jabeur, S.B.; Goodell, J.W. Causality of geopolitical risk on food prices: Considering the Russo–Ukrainian conflict. Financ. Res. Lett. 2022, 49, 103103. [Google Scholar] [CrossRef]
- World Bank. Implications of the War in Ukraine for the Global Economy; World Bank: Washington, DC, USA, 2022; Available online: https://www.worldbank.org/en/country/ukraine (accessed on 31 May 2022).
- Global Food Crisis Network (GFCN). 2020 Global Food Crisis Report. 2020. Available online: https://www.icpac.net/fsnwg/regional-focus-igad-member-states-2020-global-report-food-crisis/ (accessed on 31 May 2022).
- Yu, J.; Lim, J.; Lee, K. Investigation of drought-vulnerable regions in North Korea using remote sensing and cloud computing climate data. Environ. Monit. Assess. 2018, 190, 126. [Google Scholar] [CrossRef] [PubMed]
- Okamoto, K.; Yamakawa, S.; Kawashima, H. Estimation of flood damage to rice production in North Korea in 1995. Int. J. Remote Sens. 1998, 19, 365–371. [Google Scholar] [CrossRef]
- Bhatia, R.; Thorne-Lyman, A.L. Food shortages and nutrition in North Korea. Lancet 2002, 360, 27–28. [Google Scholar] [CrossRef]
- Schwekendiek, D. The North Korean standard of living during the famine. Soc. Sci. Med. 2008, 66, 596–608. [Google Scholar] [CrossRef]
- Liem, R. Silent famine in North Korea. Peace Rev. 1999, 11, 325–331. [Google Scholar] [CrossRef]
- Chan, E.; Schloenhardt, A. North Korean Refugees and International Refugee Law. Int. J. Refug. Law 2007, 19, 215–245. [Google Scholar] [CrossRef]
- Kim, J.E. Nutritional state of children in the Democratic People’s Republic of Korea (DPRK): Based on the DPRK final report of the National Nutrition Survey 2012. Pediatric Gastroenterol. Hepatol. Nutr. 2014, 17, 135–139. [Google Scholar] [CrossRef] [Green Version]
- Zhu, M. North Korea’s food problem. World Agric. 2000, 6, 7–8. [Google Scholar]
- Wang, Q. A discussion on agricultural resources and the grain production level in the southern area of North Korea. J. Shenyang Aric. Univ. 2004, 35, 189–191. [Google Scholar]
- Zhu, D.; Zhang, Y. Current situation and existing problems of grain production in Korea. China Rice 2005, 11, 50. [Google Scholar]
- Ma, D. Assessment of North Korea’s food problem. Int. Study Ref. 2007, 12, 8–12. [Google Scholar]
- Li, D. Analysis on the reasons and solutions of the food problem in North Korea. J. Chongqing Univ. Sci. Technol. Soc. Sci. Ed. 2012, 12, 34–36. [Google Scholar]
- Quan, Z. The problem of food insufficiency in DPRK and solution prospect. Contemporary Int. Relat. 2013, 1, 51–57. [Google Scholar]
- Tian, L. An Analysis of the International Food Aid in Post-Cold War Period: Taking the International Food Aid to the DPRK as an Example. Master’s Thesis, Central China Normal University, Wuhan, China, 2007. [Google Scholar]
- Shen, X. North Korea’s food problem and international aid channel. Pract. Foreign Econ. Relat. Trade 2009, 1, 35–37. [Google Scholar]
- Zhao, L. Political factors of WFP’s food aid to DPRK. Collect. Pap. Korean Stud. 2011, 1, 134–145. [Google Scholar]
- Li, S.; Quan, Z. Analysis of agricultural reform in North Korea. Dongjiang J. 2016, 3, 61–66. [Google Scholar]
- Cao, P. A Comparitive Study of Chinese Agricultural Contract System with DPRK’ Putian System. J. Yanbian Univ. Soc. Sci. 2016, 3, 39–44. [Google Scholar]
- Yu, H.; Zhang, B.; Wang, Z. Comparative study on changes of croplands between North Korea and South Korea during 1990–2015. Chin. Geogr. Sci. 2018, 28, 920–934. [Google Scholar] [CrossRef] [Green Version]
- Kim, H.; Jeong, E.G.; Ahn Sang, A.; Jeffrey, D.; Namrata, S.; Anthony, J.G.; Yong, J.W.; Susan, R.M. Nuclear and chloroplast diversity and phenotypic distribution of rice (Oryza sativa L.) germplasm from the Democratic People’s Republic of Korea (DPRK; North Korea). Rice 2014, 7, 7. [Google Scholar] [CrossRef] [Green Version]
- Savin, I.Y. Soil-geographical characteristics of the western part of the democratic People’s Republic of Korea. Geogr. Nat. Resour. 2014, 35, 284–292. [Google Scholar] [CrossRef]
- Yeom, J.; Jeong, S.; Jeong, G.; Chi, T.; Jonghan, K. Monitoring paddy productivity in North Korea employing geostationary satellite images integrated with GRAMI-rice model. Sci. Rep. 2018, 8, 16121. [Google Scholar] [CrossRef] [Green Version]
- Feng, Z.; Xiao, C.; Li, P. Spatio-temporal pattern changes of cereal production and trade in China-ASEAN Free Trade Area. J. Nat. Resour. 2017, 32, 937–950. [Google Scholar]
- FAO. Grain Yield, Planting Area, Yield and Irrigation Area of DPRK and the Republic of Korea, 1961–2019. The Food and Agriculture Organization of the United Nations. Available online: http://www.fao.org/faostat/en/#home (accessed on 31 May 2022).
- FAO. Fertilizers Archive of DPRK, 1961–2001. The Food and Agriculture Organization of the United Nations. Available online: http://www.fao.org/faostat/en/#data (accessed on 31 May 2022).
- MURK (Ministry of Unification, Republic of Korea). The Fertilizer Production Data of DPRK, 2002–2019. Ministry of Unification, Republic of Korea. Available online: https://kosis.kr/bukhan/index.jsp (accessed on 31 May 2022).
- NBS. China’s Grain Production, Planting Area, Yield, Fertilizer Production and Irrigation Area Data, 1949–2019. National Bureau of Statistics. Available online: http://www.stats.gov.cn (accessed on 31 May 2022).
- CNIC, CAS, Digital Elevation Model (DEM). The Computer Network Information Center of Chinese Academy of Sciences. Available online: https://www.casdc.cn/ (accessed on 31 May 2022).
- NCEI (National Centers for Environmental Information). The World Meteorological Data. National Centers for Environmental Information (NCEI) of NOAA. Available online: https://gis.ncdc.noaa.gov/maps/ncei (accessed on 31 May 2022).
- GFSAD. Land Use Data in Democratic People’s Republic of Korea. Global Food Security-Support Analysis Data Cropland Extend 2015 South and North Asia 30 m Data. Available online: https://www.usgs.gov/centers/wgsc/science/ (accessed on 31 May 2022).
- Liu, Z.; Li, B. Spatial distribution of China grain output based on land use and population density. Trans. Chin. Soc. Agric. Eng. 2012, 28, 1–7. [Google Scholar]
- Pan, J.; Zhang, J. Spatial-temporal pattern and its driving forces of per capital grain possession in China. Resour. Environ. Yangtze Basin 2017, 3, 410–418. [Google Scholar]
Figure 1.
Map showing the location and topography of the DPRK.
Figure 1.
Map showing the location and topography of the DPRK.
Figure 2.
Spatial distribution of grain production across the DPRK: (a) total grain production between 1961 and 2019, (b) grain crop production between 1961 and 2019, and (c) spatial distribution of DPRK grain production. Abbreviations: C, Chagang; NHA, North Hamgyong; SHA, South Hamgyong; NHW, North Hwanghae; SHW. South Hwanghae; K, Kangwon; NP, North Pyongan; SP, South Pyongan; P, Pyongyang; R, Ryanggang.
Figure 3.
Changes of grain consumption within the DPRK, China, and the Republic of Korea between 1961 and 2019: (a) DPRK, (b) China, and (c) Republic of Korea. Abbreviations: PCGP, per capita grain possession; PCGCP, per capita grain crop possession.
Figure 3.
Changes of grain consumption within the DPRK, China, and the Republic of Korea between 1961 and 2019: (a) DPRK, (b) China, and (c) Republic of Korea. Abbreviations: PCGP, per capita grain possession; PCGCP, per capita grain crop possession.
Figure 4.
Changes in DPRK grain supply and consumption between 1961 and 2019.
Figure 4.
Changes in DPRK grain supply and consumption between 1961 and 2019.
Figure 5.
Map showing the distribution of accumulated temperature across China and the DPRK.
Figure 5.
Map showing the distribution of accumulated temperature across China and the DPRK.
Figure 6.
Map showing the distribution of annual average precipitation across China and the DPRK.
Figure 6.
Map showing the distribution of annual average precipitation across China and the DPRK.
Figure 7.
Slopes of cultivated land within the DPRK: (
a) cultivated land quality classified on the basis of slope, and (
b) map to the spatial distribution. Abbreviations as in
Figure 2.
Figure 7.
Slopes of cultivated land within the DPRK: (
a) cultivated land quality classified on the basis of slope, and (
b) map to the spatial distribution. Abbreviations as in
Figure 2.
Figure 8.
Irrigation levels of cultivated land across the DPRK.
Figure 8.
Irrigation levels of cultivated land across the DPRK.
Figure 9.
Temporal changes in chemical fertilizer application across the DPRK.
Figure 9.
Temporal changes in chemical fertilizer application across the DPRK.
Figure 10.
Maps showing the areas of cultivated land and the grain production distribution across different regions of the DPRK.
Figure 10.
Maps showing the areas of cultivated land and the grain production distribution across different regions of the DPRK.
Table 1.
Comparison of natural factors between the DPRK and the Liaoning and Hebei provinces, China.
Table 1.
Comparison of natural factors between the DPRK and the Liaoning and Hebei provinces, China.
| Region | Area
(km2) | Illumination Hours (h) | Annual Average Temperature (°C) | Accumulated Temperature
(≥10 °C) | Annual Precipitation
(mm) | Zonal Soil Types |
|---|
| DPRK | 12.3 | 2000–2500 | 8–12 | 2500–4000 | 500–1500 | Brown and cinnamon |
| Liaoning | 14.8 | 2100–2600 | 7–11 | 2500–4000 | 500–1500 | Brown and cinnamon |
| Hebei | 18.88 | 2400–3100 | 8–13 | 2500–4500 | 500–1000 | Brown soil and cinnamon |
| Publisher’s Note: MDPI stays neutral with regard to jurisdictional claims in published maps and institutional affiliations. |
© 2022 by the authors. Licensee MDPI, Basel, Switzerland. This article is an open access article distributed under the terms and conditions of the Creative Commons Attribution (CC BY) license (https://creativecommons.org/licenses/by/4.0/).


