Article

Coupled Hydrogeochemical Approach and Sustainable Technologies for the Remediation of a Chlorinated Solvent Plume in an Urban Area

1
Department of Earth Sciences, Sapienza University of Rome, Piazzale Aldo Moro 5, 00185 Rome, Italy
2
CERI Research Center, Sapienza University of Rome, Piazzale Aldo Moro 5, 00185 Rome, Italy
3
IEG Technologie GmbH, Hohlbachweg 2, D-73344 Gruibingen, Baden-Württemberg, Germany
4
TAUW Italia, Piazza Leonardo da Vinci 7, 20133 Milano, Italy
5
Department of Chemistry, Sapienza University of Rome, Piazzale Aldo Moro 5, 00185 Rome, Italy
*
Author to whom correspondence should be addressed.
Sustainability 2022, 14(16), 10317; https://doi.org/10.3390/su141610317
Submission received: 29 June 2022 / Revised: 5 August 2022 / Accepted: 17 August 2022 / Published: 19 August 2022
(This article belongs to the Special Issue Sustainable Management and Remediation of Contaminated Sites)

Abstract

:
The presence of chlorinated solvents polluting groundwater in urbanized areas poses a significant environmental issue. This paper details a thoughtful approach to remediate a tetrachloroethylene (PCE) plume in a district that is characterized by a complex hydrological context with a limited accessibility. Through a geodatabase-driven and coupled hydrogeochemical approach, two distinct remediation technologies were chosen for the management of a contaminant plume. On one hand, coaxial groundwater circulation (CGC) wells coupled with air sparging (AS) aspire to promote the in-situ transfer of PCE from the contaminated matrices into a gaseous stream that is then treated above ground. On the other hand, reagent injection has the goal of enhancing chemical reduction combined with in situ adsorption, creating contaminant adsorbent zones, and stimulating dechlorinating biological activity. The development of an integrated conceptual site model (CSM) harmonizing geological, hydrochemical, and membrane interface probe (MIP) data captures site-specific hydrogeochemical peculiarities to support decision-making. The hydrochemical monitoring reveals contamination dynamics and decontamination mechanisms in response to treatment, quantifying the performance of the adopted strategies and investigating possible rebound effects. The estimation of masses extracted by the CGC-AS system validates the effectiveness of a new and sustainable technique to abate chlorinated solvents in groundwater.

1. Introduction

1.1. Pollution Caused by Chlorinated Solvents: Dynamics and Processes

The persistent pollution resulting from chlorinated solvent dense non-aqueous phase liquid (DNAPL) source zones has long-standing roots, posing as a serious international concern and a huge environmental problem for groundwater contamination [1,2,3,4,5]. The comprehension of contamination dynamics and mechanisms has been strengthened after more than 30 years of research [2,6,7]. The “life cycle” of a chlorinated solvent contamination source progresses through some stages of aging that start with the primary contamination episode and finish with the exhaustion of the separated phase (DNAPL) [8]. The breakdown of residual contaminants among environmental matrices is controlled by the stage of aging. The persistence of pollution in the aquifer remains because of back-diffusion and desorption processes from lower permeability media [9]. The knowledge of the evolutionary contamination scenario contributes to comprehending and explaining the pollutant behavior [8]. Among the chlorinated solvents, PCE is one of the most important subclasses of DNAPLs because of its wide use in industrial applications [10]. Due to its density and limited solubility, PCE constitutes a separate phase from water and tends to stratify below it. A fraction of spilled PCE in a separate phase penetrates the subsurface by gravity and is trapped by capillary forces in the unsaturated medium in the residual form. Once it reaches the saturated zone, the PCE migrates into the aquifer sediments, redistributing until it assumes a peculiar conformation known as the DNAPL architecture, which represents the major uncertainty in defining conceptual models of chlorinated solvent contaminated sites [8]. DNAPL remains in the subsurface in an “immobile” form, acting as a persistent source of contamination and releasing components progressively and slowly because of both piezometric surface oscillation and horizontal groundwater flow that may cross accumulations of DNAPL in the saturated portion of the subsurface [7,9]. Also, it is generally poorly retained by aquifer materials through which it is transported in dissolved form. Consequently, plumes of chlorinated solvents originating from the source area reach considerable distances, especially in cases of highly transmissive aquifers with high average linear velocities of water flow [1]. Due to its volatility, PCE can also be mobilized into the gas phase of the unsaturated zone, generating a “plume” even in the gas phase that moves by molecular diffusion rather than convective motion [11]. Besides, PCE undergoes natural biodegradation (biological reductive dechlorination, BRD) which is commonly inhibited by the scarcity of electron donors [12]. In optimal conditions, BRD proceeds from PCE, via trichloroethylene (TCE), cis-1,2-dichloroethylene (cis-DCE), and vinyl chloride (VC) to ethene [3,4,13]. Natural biotic and abiotic mechanisms acting on PCE and TCE result in the accumulation of hazardous and carcinogenic intermediates (such as DCE and VC). Anaerobic bacteria of the genera Dehalococcoides and Dehalogenimonas are known to degrade PCE and TCE to non-toxic byproducts. Characterizing anaerobic microorganisms capable of successfully dechlorinating DCE and VC to non-toxic end products expands knowledge of the reductive dechlorination process and has strong implications for the complete detoxification of chlorinated ethenes [14,15]. Characteristic genes of Dehaloccoides, reductive dehalogenases that are involved in individual reductive steps of hydrogenolysis, such as tceA, bvc, and vcrA, are well known [16]. Furthermore, the metabolic flexibility of Dehalococcoides may overcome the inhibitory impact on organohalide respiration caused by the coexistence of several species of halogenated pollutants [17]. The whole theoretical schema, which delineates the underlying mechanisms and processes involved in a DNAPL contamination scenario, has just recently been solidified and has blazed the road to the emergence of novel technologies and remedial approaches [18,19,20,21].

1.2. The Site Characterization and Big Data Package for Decision Making

DNAPLs are challenging to track down and detect in the subsoil due to their physicochemical features [22]. Conventional characterization techniques do not allow for the accurate reconstruction of the typical architecture of DNAPL redistribution [23], and this can affect the selection of effective remediation technology. Although the use of data from geological surveys and groundwater geochemical analyses is necessary, it provides limited quantitative information on contaminant distribution and real characteristics, offering poor spatial coverage of the contaminated mass [3]. The integration of direct push logging tools such as the Membrane Interface Probe (MIP) can improve the quality and resolution of the geo-environmental site characterization, providing the geotechnical site depiction, the hydrostratigraphic interpretation, and the vertical contaminant distribution [24,25,26].
As is often the case in contaminated site remediation, we may be equipped with multi-modality data, capturing diverse attributes, with varying detection depths and configurations [27]. The effort to generate a unique integrated picture of the subsoil is necessary, instead of separately manipulating each data set [28,29]. In this sense, coupled hydrogeochemical methodologies attempt to achieve data fusion. However, to date, there is a lack of a holistic approach for the joint assimilation of multi-source data [30]. A big data package and data-driven model may theoretically merge wide and varied sources of information commonly found at polluted sites, such as geological and drilling data, hydrological measurements, chemical analysis, and direct push investigations [31,32,33]. The one multiple-source scheme might aspire to synthesize a huge volume of data, by encompassing, collecting, and linking together environmental variables. In this direction, Ciampi et al. [34] emphasize the contribution of a multi-source geodatabase-driven conceptual site model (CSM) that acts as a powerful device to orient and direct the deployment of an advanced remediation strategy. Such a convergence platform of multidisciplinary components poses the interface through which the operator may both analyze geospatial data and have a quick and intuitive way to explore a complex domain. Through a multiscale and coupled hydrogeochemical approach, data are handled and then released during multiple remediation activities to monitor, examine, and manipulate information across space-time [31,33].

1.3. The Research Problem

Within such a complex, multidisciplinary framework, this paper addresses the application of combined, innovative strategies and technologies to remediate groundwater contaminated with PCE due to activities attributable to an industrial site. The industrial site has been affected in the past by accidental spills of chlorinated solvents that were used in metal degreasing and cleaning operations. The industrial plant represented the point source (PS) where high-concentration plumes were released [35]. A pump-and-treat system was installed in 2010 at the plant boundary, to operate as a hydraulic barrier and prevent the migration of contaminants into the aquifer [36]. Pump-and-treat technology is well known to require long treatment times and has high operation and maintenance requirements and costs. For pump-and-treat systems, the mass of pollutants removed with time exhibits decreasing rates of mass removal as the operations proceed [7,19]. This asymptotic tendency is linked to a significant pollutant mass which is absorbed to low-permeability layers and less accessible to groundwater flushing [37]. Also, groundwater-withdrawal induces significant water table depressions and results in significant water resource consumption [15,36]. Although the hydraulic barrier installed at the site boundary consists of 37 pumping wells, the plume reached the outer districts. This called for action in the densely populated external zones.
Due to the unique hydrogeochemical characteristics of the intervention areas and their accessibility, two distinct remediation approaches were chosen for the external plume. The first adopted innovative technology involves the application of coaxial groundwater circulation—air sparging (IEG CGC-AS®) systems, which represent an evolution of in-well vapor stripping [38,39,40]. The latter in-situ technique can potentially and continuously remove volatile organic compounds (VOCs) from groundwater without pumping water and eliminating the need to manage water discharges. Groundwater recirculation induced by CGCs opens the opportunity to optimize the mobilization, dissolution, and transport of contaminants to the well, facilitating the removal of pollutants [41,42,43]. IEG CGC-AS® wells are based on the in-situ PCE transfer from the contaminated matrices into a gaseous stream that is then externally treated. The second employed technique concerns the injection into the aquifer of activated carbon in a colloidal form in combination with sulfated micrometric zerovalent iron for the creation of in-situ adsorbent zones and the stimulation of biotic or abiotic reductive dechlorination [4,5,13,44]. Reagent injection has the goal of reducing negative impacts on downstream water quality where the hydraulic barrier may potentially fail to contain the contamination plume [45]. This paper has the purpose to investigate the effects associated with the application of IEG CGC-AS® systems and reagent injections for the removal of chlorinated solvents, through the development of a single hydrogeochemical model that becomes the tool to support decision-making. Multi-source modeling aspires to reveal the DNAPL architecture, the contamination dynamics, and the decontamination mechanisms in response to the novel interventions implemented over time since field applications related to these techniques are rare [5,38,46]. Multi-temporal analytical tests on the response of the aquifer to the treatment, in terms of concentration trends over time, aim to quantify the overall performance of the adopted strategies and investigate possible rebound effects of contamination. The observation of the chemical aquifer reaction to remediation actions has the goal to unmask biodegradation phenomena. The estimation of masses extracted by the CGC-AS systems and hydrochemical monitoring have the objective to validate the efficacy of innovative techniques for the abatement of chlorinated solvents in groundwater. The paper meaningfully progressed the essential comprehension of the interlinking between multiple domains to both govern and control the delivery of an effective remediation strategy through innovative solutions.

2. Materials and Methods

2.1. The Multi-Source and Geodatabase-Driven Modeling Approach

The configuration and deployment of the intervention strategy arose from a deep understanding of contamination features and dynamics through detailed reconstruction of both lithostratigraphic and hydrochemical attributes surrounding the plant [8]. The reconstruction of the CSM relied on characterization activities. Information from 127 geologic surveys and 155 groundwater monitoring points (wells and piezometers) were gathered to paint the hydrogeological and hydrochemical framework of the site up to a depth of about 25 m, providing evidence on the groundwater flow patterns and the picture of contamination status. Piezometric measurements and chemical analyses on water samples collected from March 2015 to December 2020 were available. Further, 19 survey verticals have been completed with MIP techniques to qualitatively evaluate the spatial distribution of contaminants, characterize with high resolution the pollution spreading, and identify potential DNAPL accumulation zones [24,25,26]. When probe refusal occurred with the direct-push system, auger drilling was used to get past gravelly cemented layers. The rig was reconfigured back to the probe when more suitable lithological conditions were encountered for direct-push probing. For this reason, MIP profiles did not record data when the augers were being utilized. MIP investigations reached a depth of about 30 m. Geological, hydrochemical, and MIP data in tabular format populated a multi-temporal geodatabase that can be updated in real-time with any newly available information [28,29,34]. The geo-referenced data management tool has been enriched with hydrogeological and chemical records that have been acquired through the realization of the IEG CGC-AS® wells, the injection of amendments, and the installation of some control points (CPs) for groundwater quality monitoring. The overlapping of the knowledge afferent to the hydrogeological and physicochemical fields in the geodatabase had the purpose to generate an integrated, solid, and digital CSM, able to conjoin multi-source data [32,33,47]. The geological-physical and hydrochemical modeling was performed through Rockworks 17 software [48]. The latter employs modeling algorithms to reconstruct an integrated three-dimensional subsurface model in a geographic information system (GIS) environment [28,29,31,34]. The interpolation of the borehole data, using the well-known and popular inverse distance weighting (IDW) algorithm, led to the generation of a 3D solid model illustrating the stratigraphic and hydrochemical context [49,50]. The data gridding was performed using four as the number of neighboring and a weighting exponent of two. A high-fidelity filter to honor the control point value and light smoothing on the surfaces were also adopted as additional geoprocessing options. Spatial representation and analysis of piezometric data aimed to delineate saturated aquifer thicknesses. The modeling operations on the hydrochemical data, focusing on the index contaminant (i.e., PCE), had the purpose of delivering a 3D digital model that depicts the aquifer contamination scenario at the site, embedded in the hydrogeological background. Concentrations of detected PCE in groundwater, within a geo-referenced space, are portrayed using an isosurface of equal concentration [25]. An isosurface, which is built by interpolation of concentration values measured at different depths, envelops a volume of saturated aquifer characterized by a contaminant concentration equal to or greater than a given value [31]. The harmonization and coupling of hydrogeological, chemical, and MIP information in an integrated CSM aimed to capture site-specific hydrogeochemical features and interpret contamination dynamics. The focus on areas relevant for strategic planning purposes had the objective to support decision-making by adapting the remediation strategies to the specific physicochemical conditions. The hydrochemical monitoring and the estimation of extracted masses by the CGC-AS system follow the implementation of the remediation strategy to explain decontamination mechanisms in response to treatment, verify the performance of the adopted remediation solutions, and investigate possible rebound effects.

2.2. Remediation Strategy with IEG CGC-AS® Systems, Activated Carbon, and Zero-Valent Iron Injections

The adopted remediation strategy involved the application of the IEG CGC-AS® technique and the coupled injection of micrometric zerovalent iron (S-MicroZVI®, Regenesis) and colloidal activated carbon (PlumeStop®, Regenesis) [29,46,51,52]. The two technologies were applied along profiles positioned at the industrial plant boundary to bar the spreading of contaminants in groundwater.
An IEG CGC-AS® process unit consists of a specifically engineered groundwater well filled with gravel and incorporates a double-cased screen, a compressor, a special pressurized air distributor, a low-vacuum extraction system, and a waste air decontamination system (regenerative granular activated carbon). Clean compressed air is injected into a pressurized air distributor set in a multi-screened well, the base of which is located between the capillary fringe and the base of the aquifer or contaminated zone. The upper screened section and the double-cased screen straddle the capillary fringe. The technology’s novel design has the goal to deliver a controlled directional air sparging effect, by regulating the injected air flow so that the air can only flow upward within the well. The higher conductivity in the gravel fill, in comparison to the aquifer, prevents the air bubbles from escaping into the aquifer. Air bubbles emanated from the pressurized air distributor rise inside the well, causing groundwater within the well casing to flow upward under the air lift effect [38,39,40]. Such an airlift effect transports polluted groundwater to the well base. The VOCs that are dissolved in the groundwater are transferred from the liquid to the gas phase in proportion to their gas-liquid partition coefficient [39] and are extracted to the surface via the special double-cased screen under low negative pressure. The double-cased screen features fine-grained polymer filter granules sandwiched between two layers of metal sieve web with an open screened area of over 50%. Air/water phase separation takes place in the double-cased screen to minimize the transport of water particles to the water knockout unit in the treatment container. Accurate positioning of the double-cased screen and regulating the appropriate air volume per unit CGC unit ensure the necessary air-lift velocity to remove dense soil air charged with contaminants. The double-cased screen is placed within the capillary zone, typically impacted by the highest pollutant concentrations. Soil air from the unsaturated zone which is drawn into the system is also extracted and remediated [11]. Stripped groundwater is redistributed throughout the aquifer via the screened well section. This generates a continuous circulation of groundwater in the area surrounding the remediation well, constantly delivering new contaminants to the stripping zone. Hence, such technology may also be advantageously applied in the case of limited saturated thicknesses (no pumping is performed which may dry out the well) and the presence of contaminants in the unsaturated portion (effective action on gases) [41,42,43]. CGC-induced groundwater recirculation has the potential to mobilize contaminants in residual form trapped in low-permeability zones [39]. Besides, the marked adaptability of these systems opens the possibility of employing them as containment systems for potential contaminant migration towards hydrologic downstream (Figure 1).
Several IEG CGC-AS® compose each intervention profile and are connected with above-ground treatment systems. The latter are stored in two containers that house a compressor for injecting air into individual wells, a blower for generating the vacuum, and the flow meter line for controlling the flow rate of gas extracted from individual wells. The blower generates the vacuum needed to extract the stripping stream and send it to the two granular activated carbon filters located immediately outside the container. Each CGC is equipped with a standalone valve to regulate the airflow rate and an outlet for gas sampling. The intervention barrier A-B consists of 12 IEG CGC-AS® wells connected to a treatment plant for extracted vapors and two CPs (CP1 and CP3) positioned alongside the line of wells. Treatment transect C-D comprises nine IEG CGC-AS® wells, the associated treatment plant, and one intervention CP (CP4). The two treatment transects were kept in function for six months after plant start-up to evaluate the technology’s performance and then stopped to investigate possible rebound effects by performing groundwater monitoring during operation and shutdown periods at selected CPs. The monitoring of the IEG CGC-AS® system also included the sampling of extracted air from all wells of the treatment process [38]. During the operational phases of the CGC unit, extracted vapor tracking was aimed at quantifying the performance of the deployed chlorinated solvent abatement remediation technology in mass terms.
Reagent injection may be preferable to IEG CGC-AS® in areas with significant logistical or accessible space restrictions. Thus, a reagent injection transect has been set up on the northeast side of the plant, at a school, providing for minimally invasive and very short site activities. Reagent injection was preceded by microbiological characterization analyses and a microcosm study to evaluate the possibility of exploiting biological reductive dechlorination as a strategy for the acceleration of natural attenuation processes. Ten piezometers were sampled for microbiological analysis (Figure S1 in Supplementary Materials) [51]. The application of Real-Time PCR (qPCR) techniques had the purpose of identifying and quantifying microorganisms involved in biodegradation processes for an assessment of the bioremediation potential of the site [52]. Microcosm tests were realized on three aquifer samples collected at transect A–B (Figure S2 of Supplementary Materials). The first microcosm was set up without the addition of an electron donor to evaluate the effectiveness of natural attenuation. The remaining microcosms were prepared to assess the possibility of stimulating dechlorinating biological activity by supplementing the electron donor (lactate) and an inoculum of active dechlorinating biomass [53]. Following the laboratory analysis, joint injection of micrometric activated carbon (PlumeStop®, Regenesis) and colloidal zero-valent iron (S-MicroZVI®, Regenesis) aimed to stimulate chlorinated solvent sorption and enhance both BRD and chemical reduction [4,13,44,46]. Approximately 140 kg of Plumestop® and 100 kg of S-MicroZVI® were mixed with 1000 L of water and injected into each well with an average injection rate of about 13 L/min. PlumeStop® is made up of very fine activated carbon particles (1–2 µm). It can be injected at low pressures reaching an optimal and homogeneous distribution [29]. Adhesion of activated carbon to the solid matrix generates an adsorbent barrier against the hydrophobic pollutant migration, promoting biodegradation. Also, biodegradation processes can enable the regeneration of activated carbon [44,54,55]. Micrometer-sized sulfated colloidal zero-valent iron (S-MicroZVI®) may both degrade chlorinated contaminants through a direct chemical reaction and establish a time-stable reducing environment that enhances either biotic or abiotic reductive dechlorination [4,5,13,46]. This remediation strategy had the goal to couple the functionality of a highly dispersible and fast-acting adsorbent matrix, capable of capturing and concentrating dissolved phase contaminants within its structure, to the biodegradative processes of chlorinated compounds and regeneration of activated carbon [29,46]. The injection points (IP) were realized thanks to continuous core drilling and installation of polyvinyl chloride (PVC) piezometric pipe, fenestrated in correspondence of the aquifer and blind throughout the overlying section. Injections were performed by direct push, using injection rods embedded in the ground to the established depth, and injecting the product mixture from the bottom to the top along the injection horizon (“bottom-up” configuration) [56,57]. Joint and near-real-time hydrochemical monitoring of selected CPs and a piezometer had the scope of unraveling the site-specific decontamination mechanisms induced by reagent injections and validating the performance of the adopted actions for the reduction of organohalogenated substances in groundwater.

3. Results and Discussion

3.1. Conceptual Model: Geological and Hydrochemical Portrait of the Site

Thanks to the numerous stratigraphic surveys and piezometers realized in the area, the lithological sequence up to a depth of about 30 m from the surface was schematized as follows:
  • Heterogeneous filling material from 0 to 1 m;
  • Alternations of clays, more or less silty, with sandy-clay silts from 1 to 10 m;
  • Gravels and sands that appear locally slightly silty with rare pebbles from 10 to 19–20 m;
  • Alternating clays and silty clays with intercalations of silts that appear clayey to slightly sandy, varying in thickness from 0 to 4–5 m;
  • Gravels and sands, with rare pebbles, presenting in some parts weakly silty fractions, with a thickness varying between 1 and 8 m, generally found between 22 m and 24 m of depth;
  • Silty clays from 24 to 33 m depth.
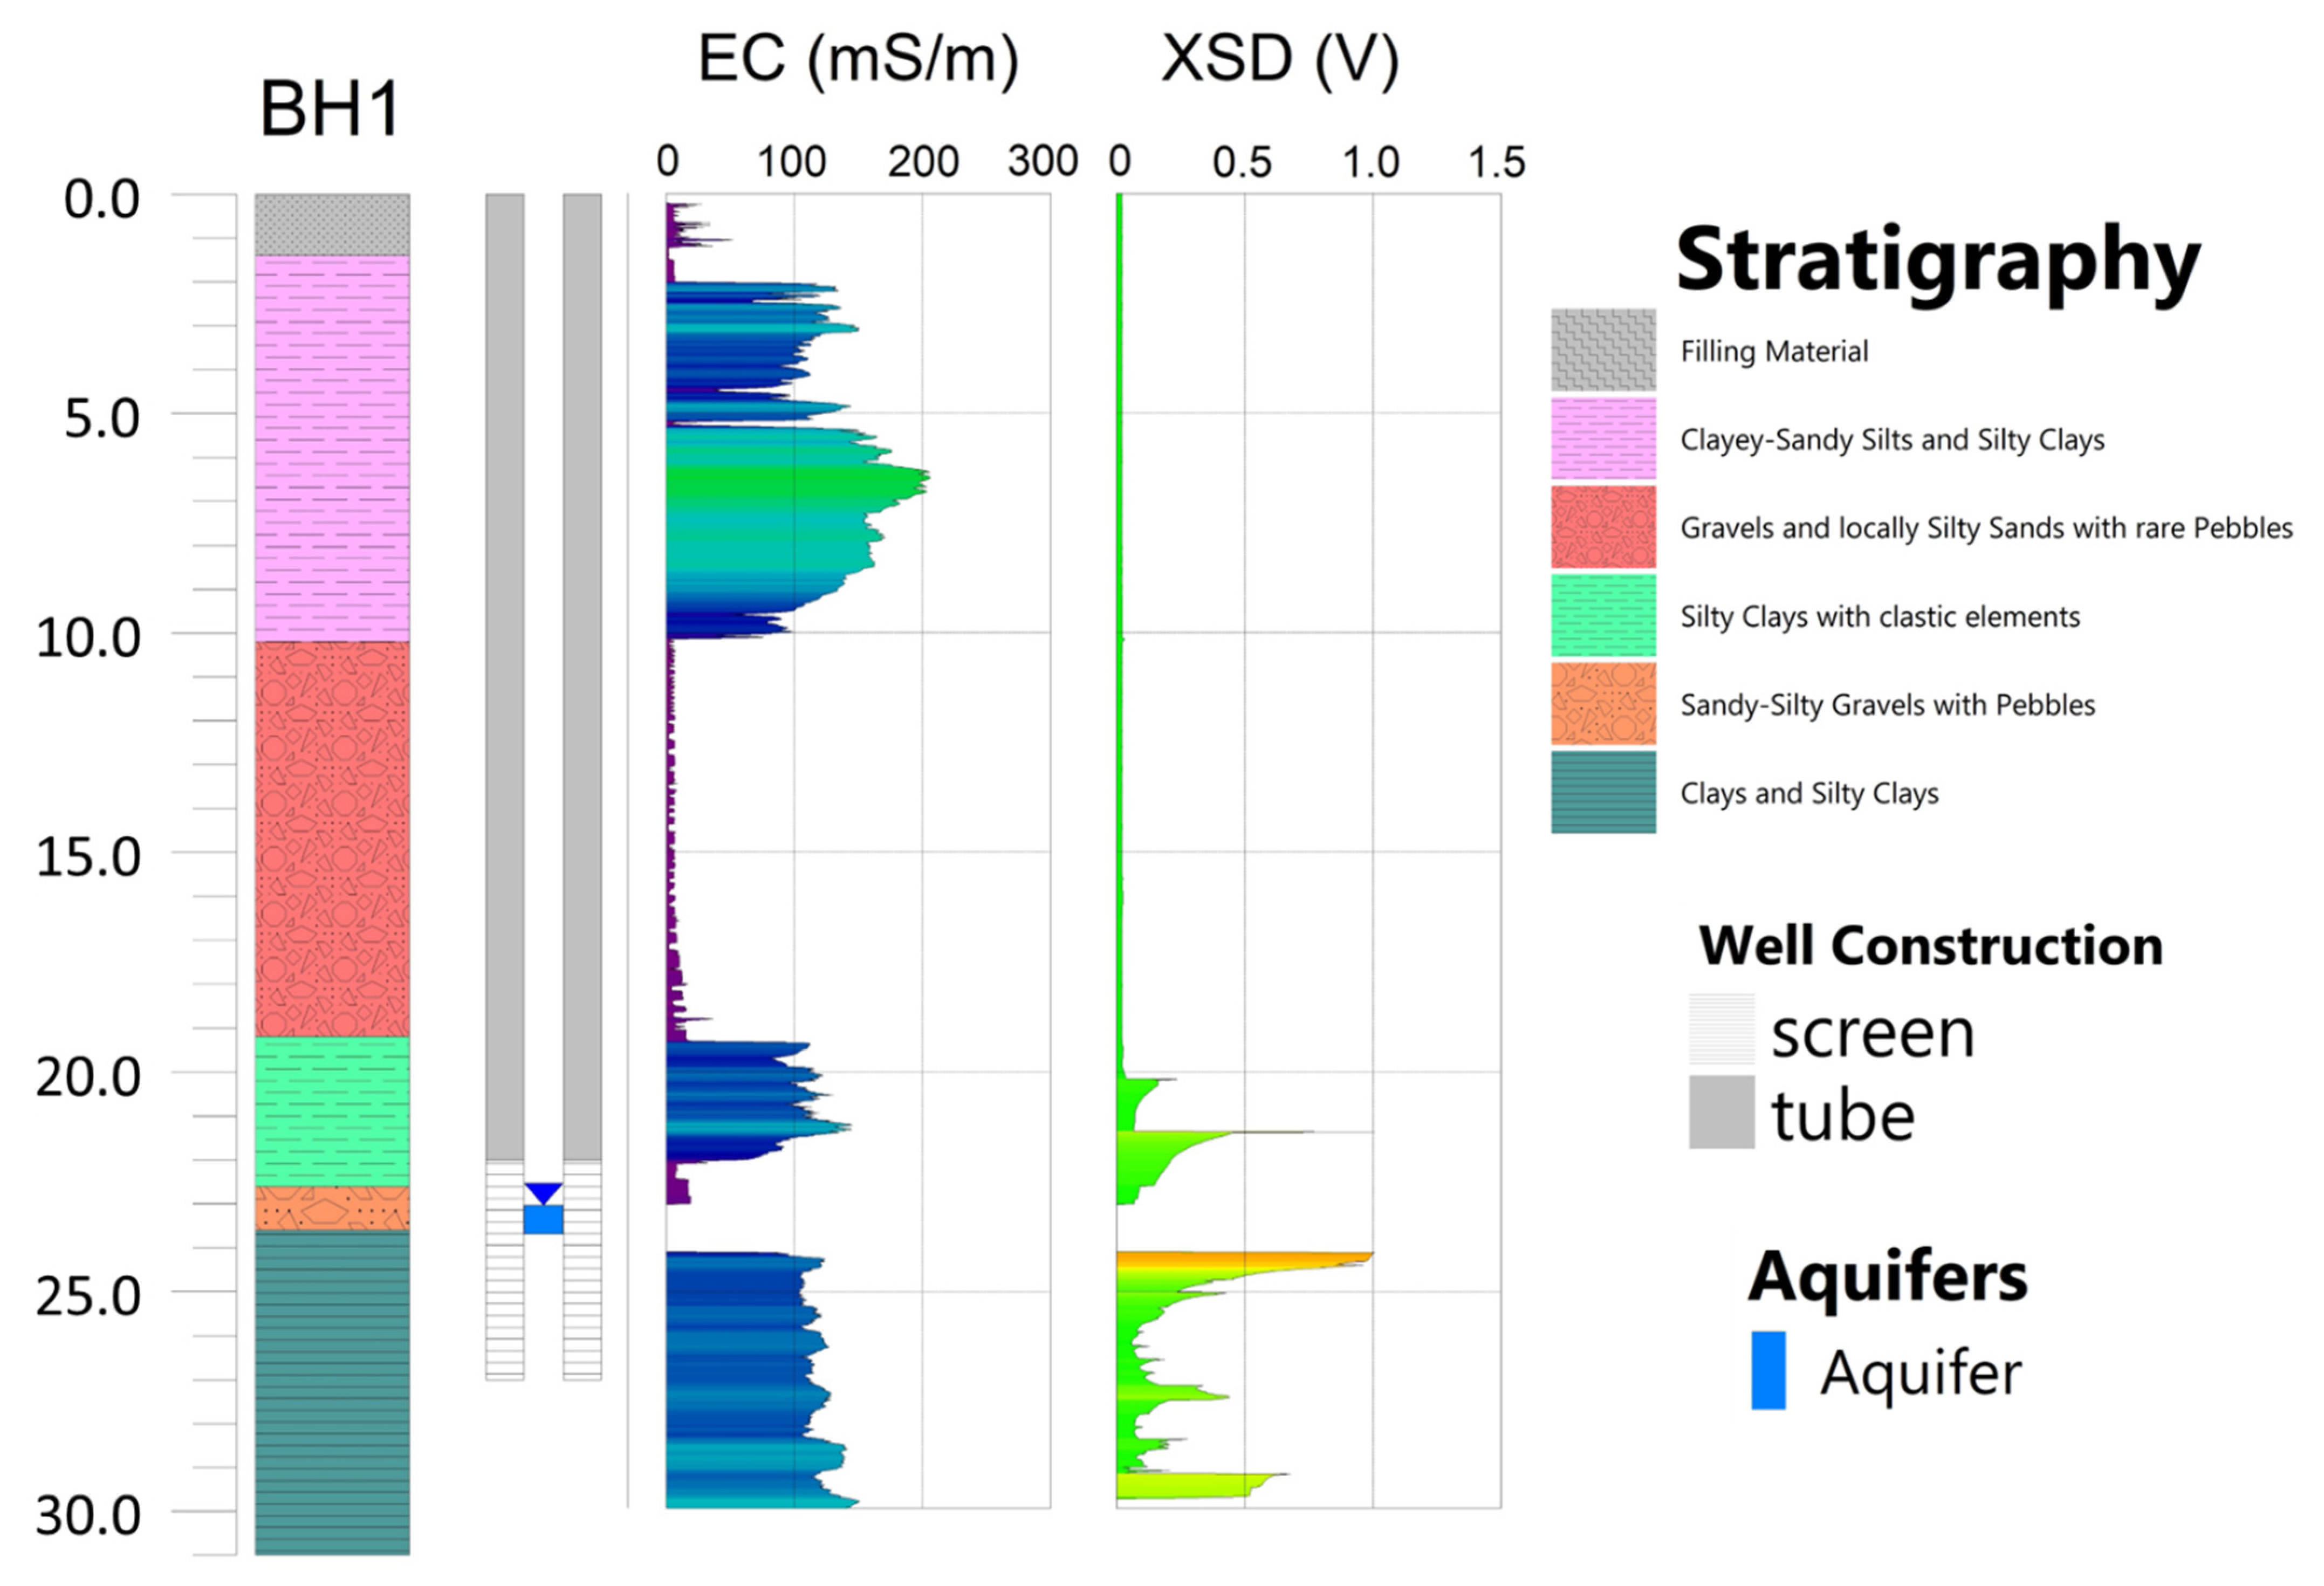
The information acquired during the realization of boreholes and piezometers individuates a single main aquifer body hosted in the gravelly deposits located at 22 m depth, exhibiting a continuous distribution in the study area. Pumping tests performed at the site in December 2010 yielded aquifer hydraulic conductivity values ranging from 8.05 × 10⁻⁵ to 1.5 × 10⁻⁴ m/s. The aquifer horizon shows a prevalently phreatic character; locally the confinement of some aquifer lenses due to impermeable lenticular levels causes sensible piezometric variations even at a distance of a few meters. Basal silty clays bound the aquifer. The saturated thicknesses are very small (varying from a few dm to 1 m in the zones placed downstream of the plant) due to the considerable pumping operated by the hydraulic barrier that induces a significant depression of the piezometric surface [36]. The results of the investigations with MIP technology strengthened the geological model and furnished the electrical parameterization of the different lithotypes found in the sequence. Also, the evidence rendered by the MIP investigations discretizes the portions of the subsurface associated with the presence of organochlorine compounds in the residual phase [24,25,26,56] (Figure 2).
Direct investigations associate high electrical conductivity (EC) values with fine horizons, whereas coarse sediments are characterized by low EC [24]. Fine-grained deposits reveal EC values averaging 100 mS/m, with local increases up to 200 mS/m. Coarse-grained deposits feature EC values generally between 5 and 10 mS/m. Besides, the halogen-specific detector (XSD) registers two remarkable peaks of about 1 V at 21.37 and 24.11 m below ground level, respectively. Overall, the set of findings on the entire area excludes the presence of active secondary sources except for three vertical profiles (Figure S3 of Supplementary Materials). XSD signal peaks are detected at the transition bands between low-permeability horizons and more permeable coarse-grained levels. In detail, the XSD signal recorded at the bottom of the aquifer could suggest a zone of accumulation of DNAPL penetrated to the top of the clayey layer bounding the groundwater flow and aged as a result of groundwater dissolution [58]. Some peaks are also located in the low-permeability layer overlying the aquifer or in the unsaturated levels of gravelly deposits hosting groundwater flow. These accumulations may have been determined over time by (i) the diffusion of dissolved contaminants to the upper low-permeability zones when the piezometric level reached these horizons or (ii) the concentration of vapors resulting from the volatilization of solvents from the underlying reduced saturated thicknesses [11]. Interpretation of multi-modality information suggests that fractions of aged and residual contaminants are potentially adsorbed or trapped in the aquifer matrix or low permeability levels bounding aquifer deposits [9].
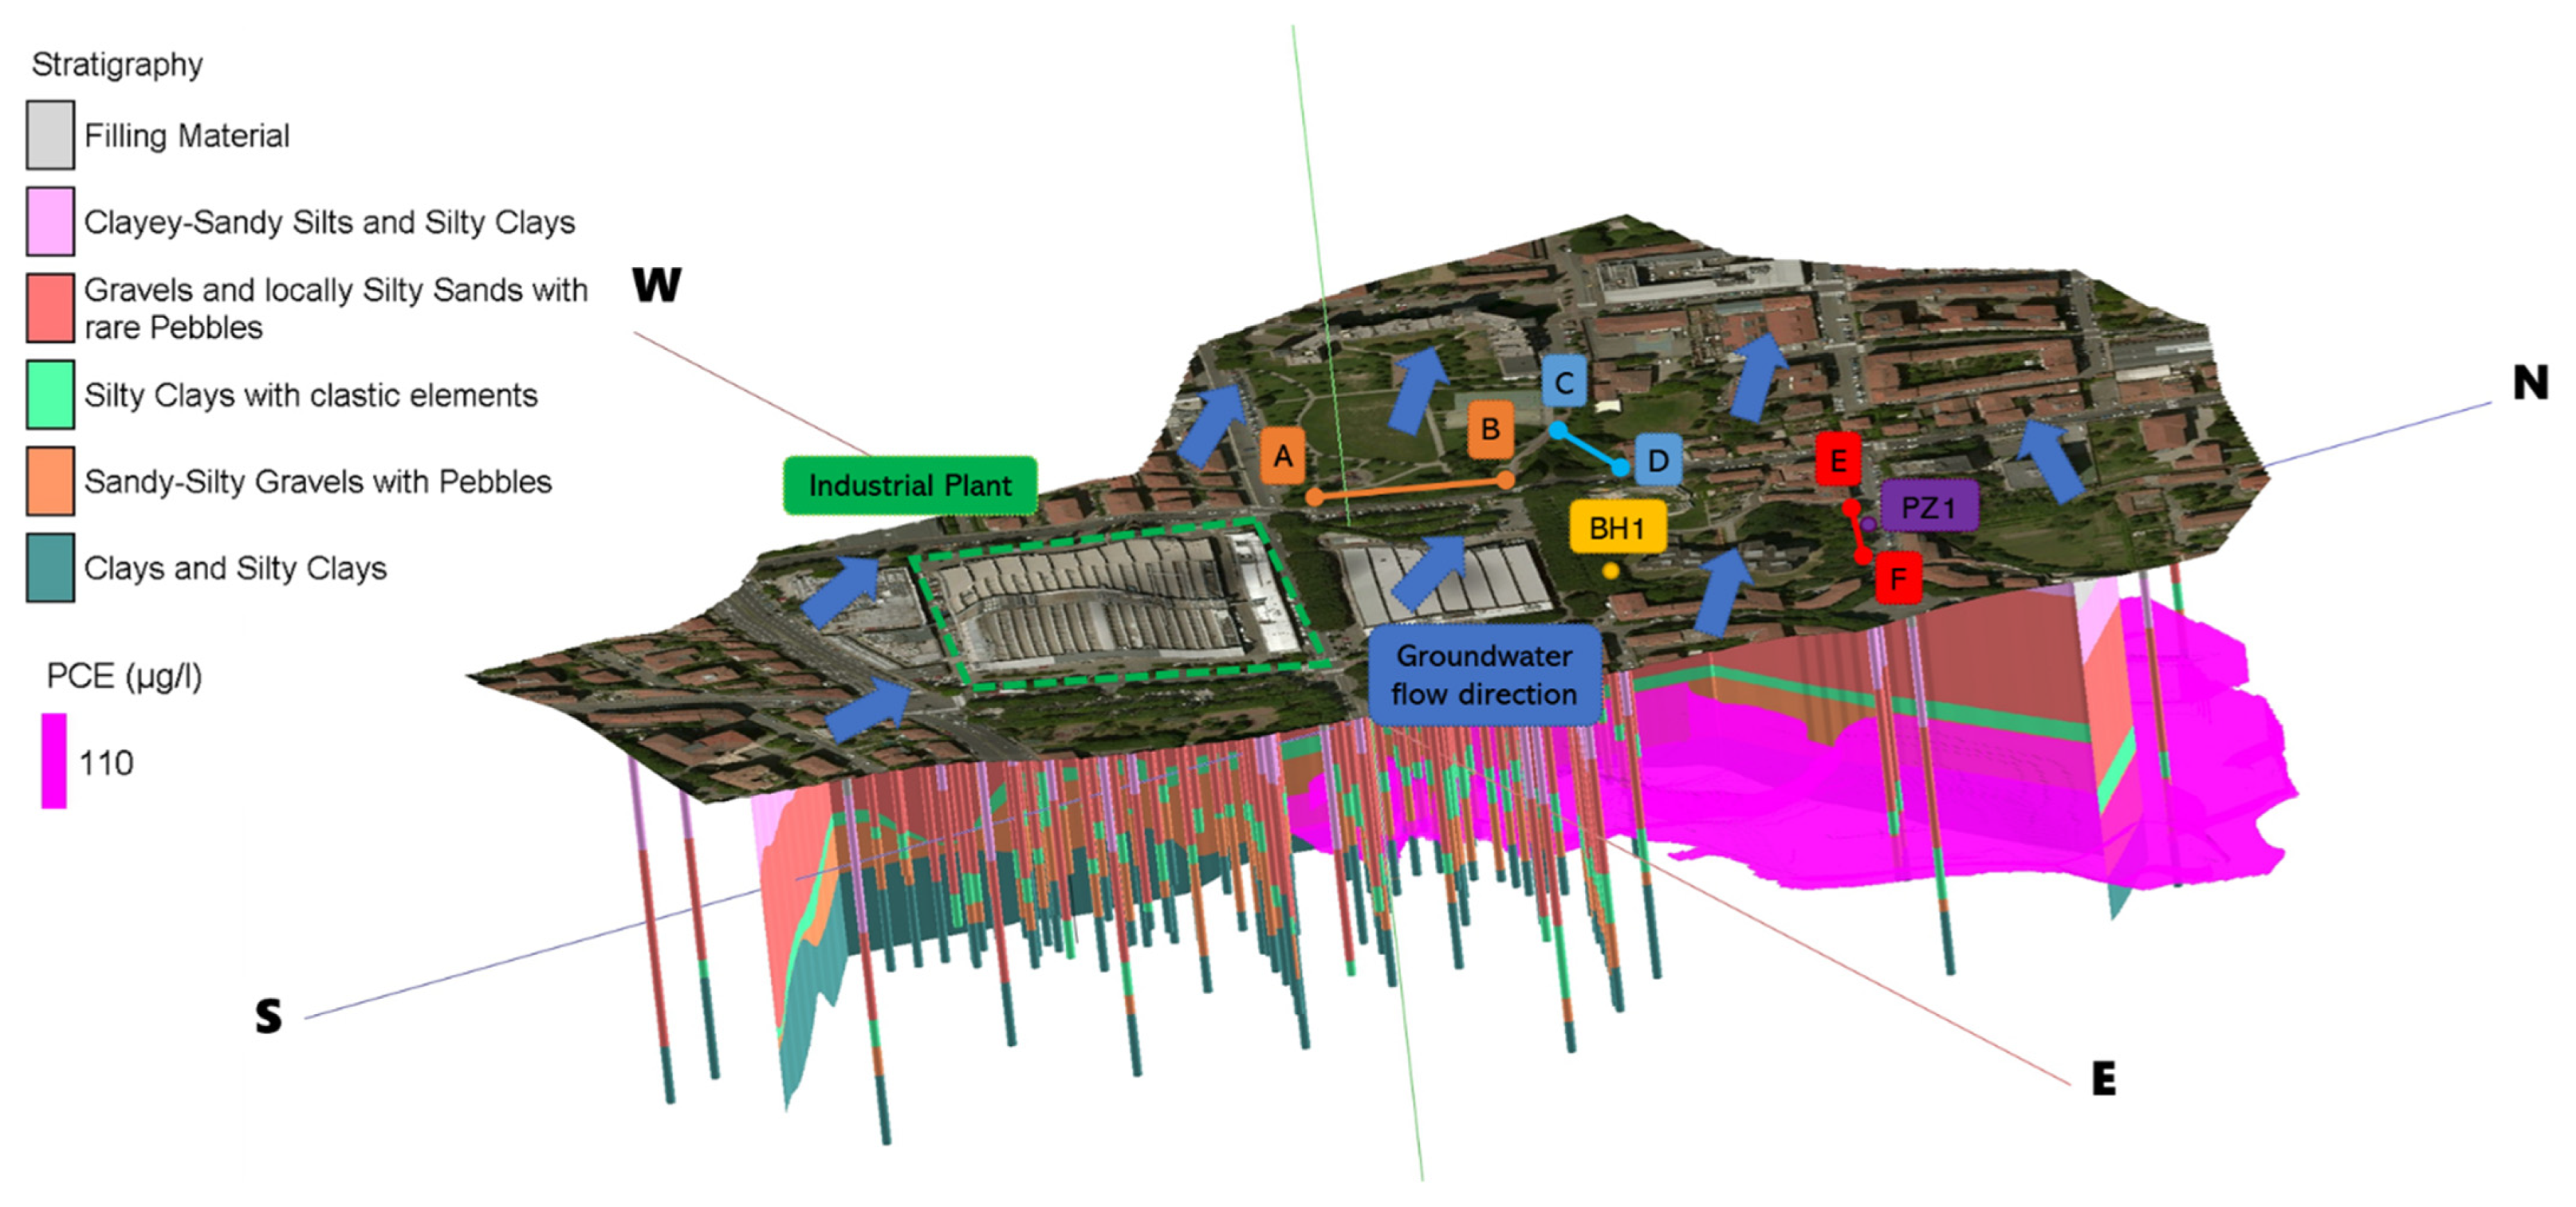
A PCE pollution plume that migrates along the highly permeable aquifer was detected in samples collected down-gradient to the industrial site. While low-permeability zones may be diffusion-dominated and act as both sinks and sources (i.e., via back-diffusion) of pollutants over a long time, high-permeability zones are the main pathways for contaminant transport in groundwater [37]. A 3D portrait of the PCE distribution downstream of the plant underlines that the contamination plume is distributed in the aquifer located at 22 m depth from the ground level, characterized by modest and irregular thickness. The industrial plant corresponds to a PS releasing a plume at high concentrations (Figure 3).
The elongation of the contamination plume follows the direction of groundwater flow, which is inferred from piezometric measurements (Table S1 of Supplementary Materials), showing a SE-NW orientation at the site scale. From the multidisciplinary picture, the plume propagation in external residential areas appears unequivocally determined by the direction of underground flow vectors. For this reason, the intervention profiles were arranged orthogonally to the direction of groundwater flow, acting as a physical barrier to prevent the migration of dissolved contaminants into the aquifer and reduce the contamination load in the residual hot spots identified through the MIP investigations. In harmony with the studies of Freedman et al. [59] and Utom et al. [60], the combination of multiple lines of evidence captures the small-scale features that control contamination dynamics in the geological and hydrodynamic context. Consistent with Fjordbøge et al. [61] and Nivorlis et al. [26], the combination of geologic information, MIP data, and contaminant concentrations detail an effective and advanced characterization, high-resolution imaging, and conceptual understanding of DNAPL architecture. Such a multi-source model has been exploited for its well-known potential in monitoring and evaluating the performance and sustainability of two groundwater remediation technologies in an urban area, unmasking the physicochemical dynamics and decontamination mechanisms [31,33,34].

3.2. Configuration and Performance of IEG CGC-AS® Barriers

The geological–hydrogeological joint model illustrates the local geometric irregularity of stratigraphic contacts and the conspicuous thickness of the saturated aquifer in the action zones. Also, the hydrostratigraphic picture captures the small variations of the piezometric level in correspondence with stratigraphic transects (Figure 4).
Although both the saturated thickness reveals consistent fluctuations over modest distances and the piezometric surface exhibits decimetric oscillations of a seasonal nature, the configuration of the IEG CGC-AS® wells has been customized to the hydrostratigraphic patterns of the areas. The gravel fill of the remediation wells, where air/water mixture rise takes place, is positioned astride the piezometric surface, at the XSD peaks that were identified through MIP prospecting. The air distributor, which triggers groundwater recirculation, lies inside the saturated horizon. Groundwater recirculation within the radius of influence of each CGC potentially acts on residual or adsorbed contaminants to the saturated solid matrix [7]. Besides, groundwater recirculation may result in the leaching of contaminants trapped in the unsaturated horizon [9]. Simultaneously, the depressurized fenestrated element on the capillary fringe can affect the gas pollutant fraction present in the unsaturated domain [11].
Regarding the treatment barrier A-B, periodic monitoring of the system flow rate and treatment inlet sections since plant start-up determines the mass extraction estimate (in kg) of PCE (the contamination tracer) [38]. The graph in Figure 5a depicts the trend of extracted PCE mass (in kg) since the intervention launch, comprising the first exercise period (extracted mass 16.2 kg) and the second exercise period (extracted mass 28.3 kg). The total extracted mass amounts to about 44.5 kg (Table S2 of Supplementary Materials). CP1 and CP3 sampling provides trends in PCE concentrations over time in relation to the employed remedial actions (Table S3 of Supplementary Materials, Figure 5b,c).
Figure 5a discloses a greater amount of removed mass in the second exercise period compared to the first phase. Such an effect is attributed to an improvement in the system’s operating efficiency due to specialized maintenance activities that were performed at individual wells during plant shutdowns. Figure 5b plots the decreasing trend in PCE concentrations at the CP1. These concentrations diminish during plant functioning, from the start-up of the system (2550 µg/L) up to a concentration of 288 µg/L that is detected in the last available monitoring campaign. On the other hand, observed PCE concentrations at CP3 (Figure 5c) exhibit a fluctuating behavior. An abnormal peak in concentrations with a value of 1900 µg/L, which is probably attributable to possible rebound effects, was recorded when the plant was shut down [62]. Rebound effects could potentially be associated with the mobilization and desorption of residual contaminant fractions that are adsorbed to the fine matrix and the slow release of contamination during non-recirculation [9]. In the second period of the run, the registered values decrease in a regular way to concentrations close to 100 µg/L. Removing PCE from the action transect led to a clear improvement in groundwater quality at both control points (i.e., CP1 and CP3). In CP1 a decline in concentrations of the order of thousands of µg/L already in the first phase of the intervention is observed. This trend is confirmed in the second phase of operation in CP3, leading concentrations to decrease by an order of magnitude. Combining these aspects with the negligible presence of PCE in the monitoring piezometer that is located at about 15 m from the barrier of intervention (not shown here), the absence of a plume of contamination extending downstream is likely to be assumed [22].
Concerning the installation C-D, the collected data corroborate the effectiveness of the applied technology in terms of removal and abatement of PCE concentrations in the groundwater. The removed mass of pollutants, which is estimated based on incoming treatment stream and plant flow rates, amounts to 29.5 kg in the first six operational months (Table S4 of Supplementary Materials and Figure 6a). Also, CP4 monitoring data reveal trends in PCE concentrations that widely vary, with values ranging from a minimum of 1080 µg/L (start-up) to a maximum of 8700 µg/L (Table S5 of Supplementary Materials and Figure 6b).
Figure 6a testifies to the significant capacity of the CGC barrier in removing PCE. Based on periodic monitoring of the extracted gas streams, more than 29.5 kg of PCE were removed in the first six months of activity. The above aspect highlights both the technical efficiency and the appropriate location of the remedial measures, which have been configured and adapted to the specific hydrogeological and chemical features of the site, as well as to the contaminant’s real properties [8,18]. The graph in Figure 6b depicts a fluctuating trend in PCE concentrations, which are detected at CP4 during the first period of plant operation. CGC-induced recirculation may have mobilized residual fractions of PCE, which were removed in the form of a gas stream [9,11,39]. The mobilization of adsorbed contaminant to the solid matrix that is induced by recirculation is demonstrated by the increase in dissolved PCE concentrations in water at CP4 during the first four months of operation. During the same time frame, the highest concentrations, which are detected at CP4 (Figure 6b), correspond to a sudden increase in the mass rate of PCE extracted and sent to the treatment plant (Figure 6a). Starting from about four months of measures implementation, a decreasing trend of PCE values can be noticed, passing from a maximum of 8.300 µg/L to a minimum of 1.750 µg/L in the last monitoring campaign of CP4. Such a decreasing trend could be evidence of the progressive depletion of the secondary contamination source.
The field application of IEG CGC-AS® systems is scarcely documented [38]. Similar remediation technologies revealed that the synergistic effect of in-well air stripping, air sparging, and dynamic subsurface circulation results in a sustainable, cost-efficient, and effective remedy [63,64]. The main advantages of applying such a system over traditional remediation technologies, such as pump-and-treat, lie in the intrinsic conservativeness of the water resource, the limited impact on land use, and the competitiveness of overall remediation costs. Also, the versatility of the system permits its application where hydrogeology and limited saturated thicknesses reduce the potential for the water to be recirculated by a classic groundwater recirculation system [65]. Such an innovative technology represents a sustainable remediation solution to address urban areas where current land use does not allow for more invasive technologies [66].

3.3. The Impact of the Adsorbent and Reducing Barrier in the Peculiar Hydrogeological Framework

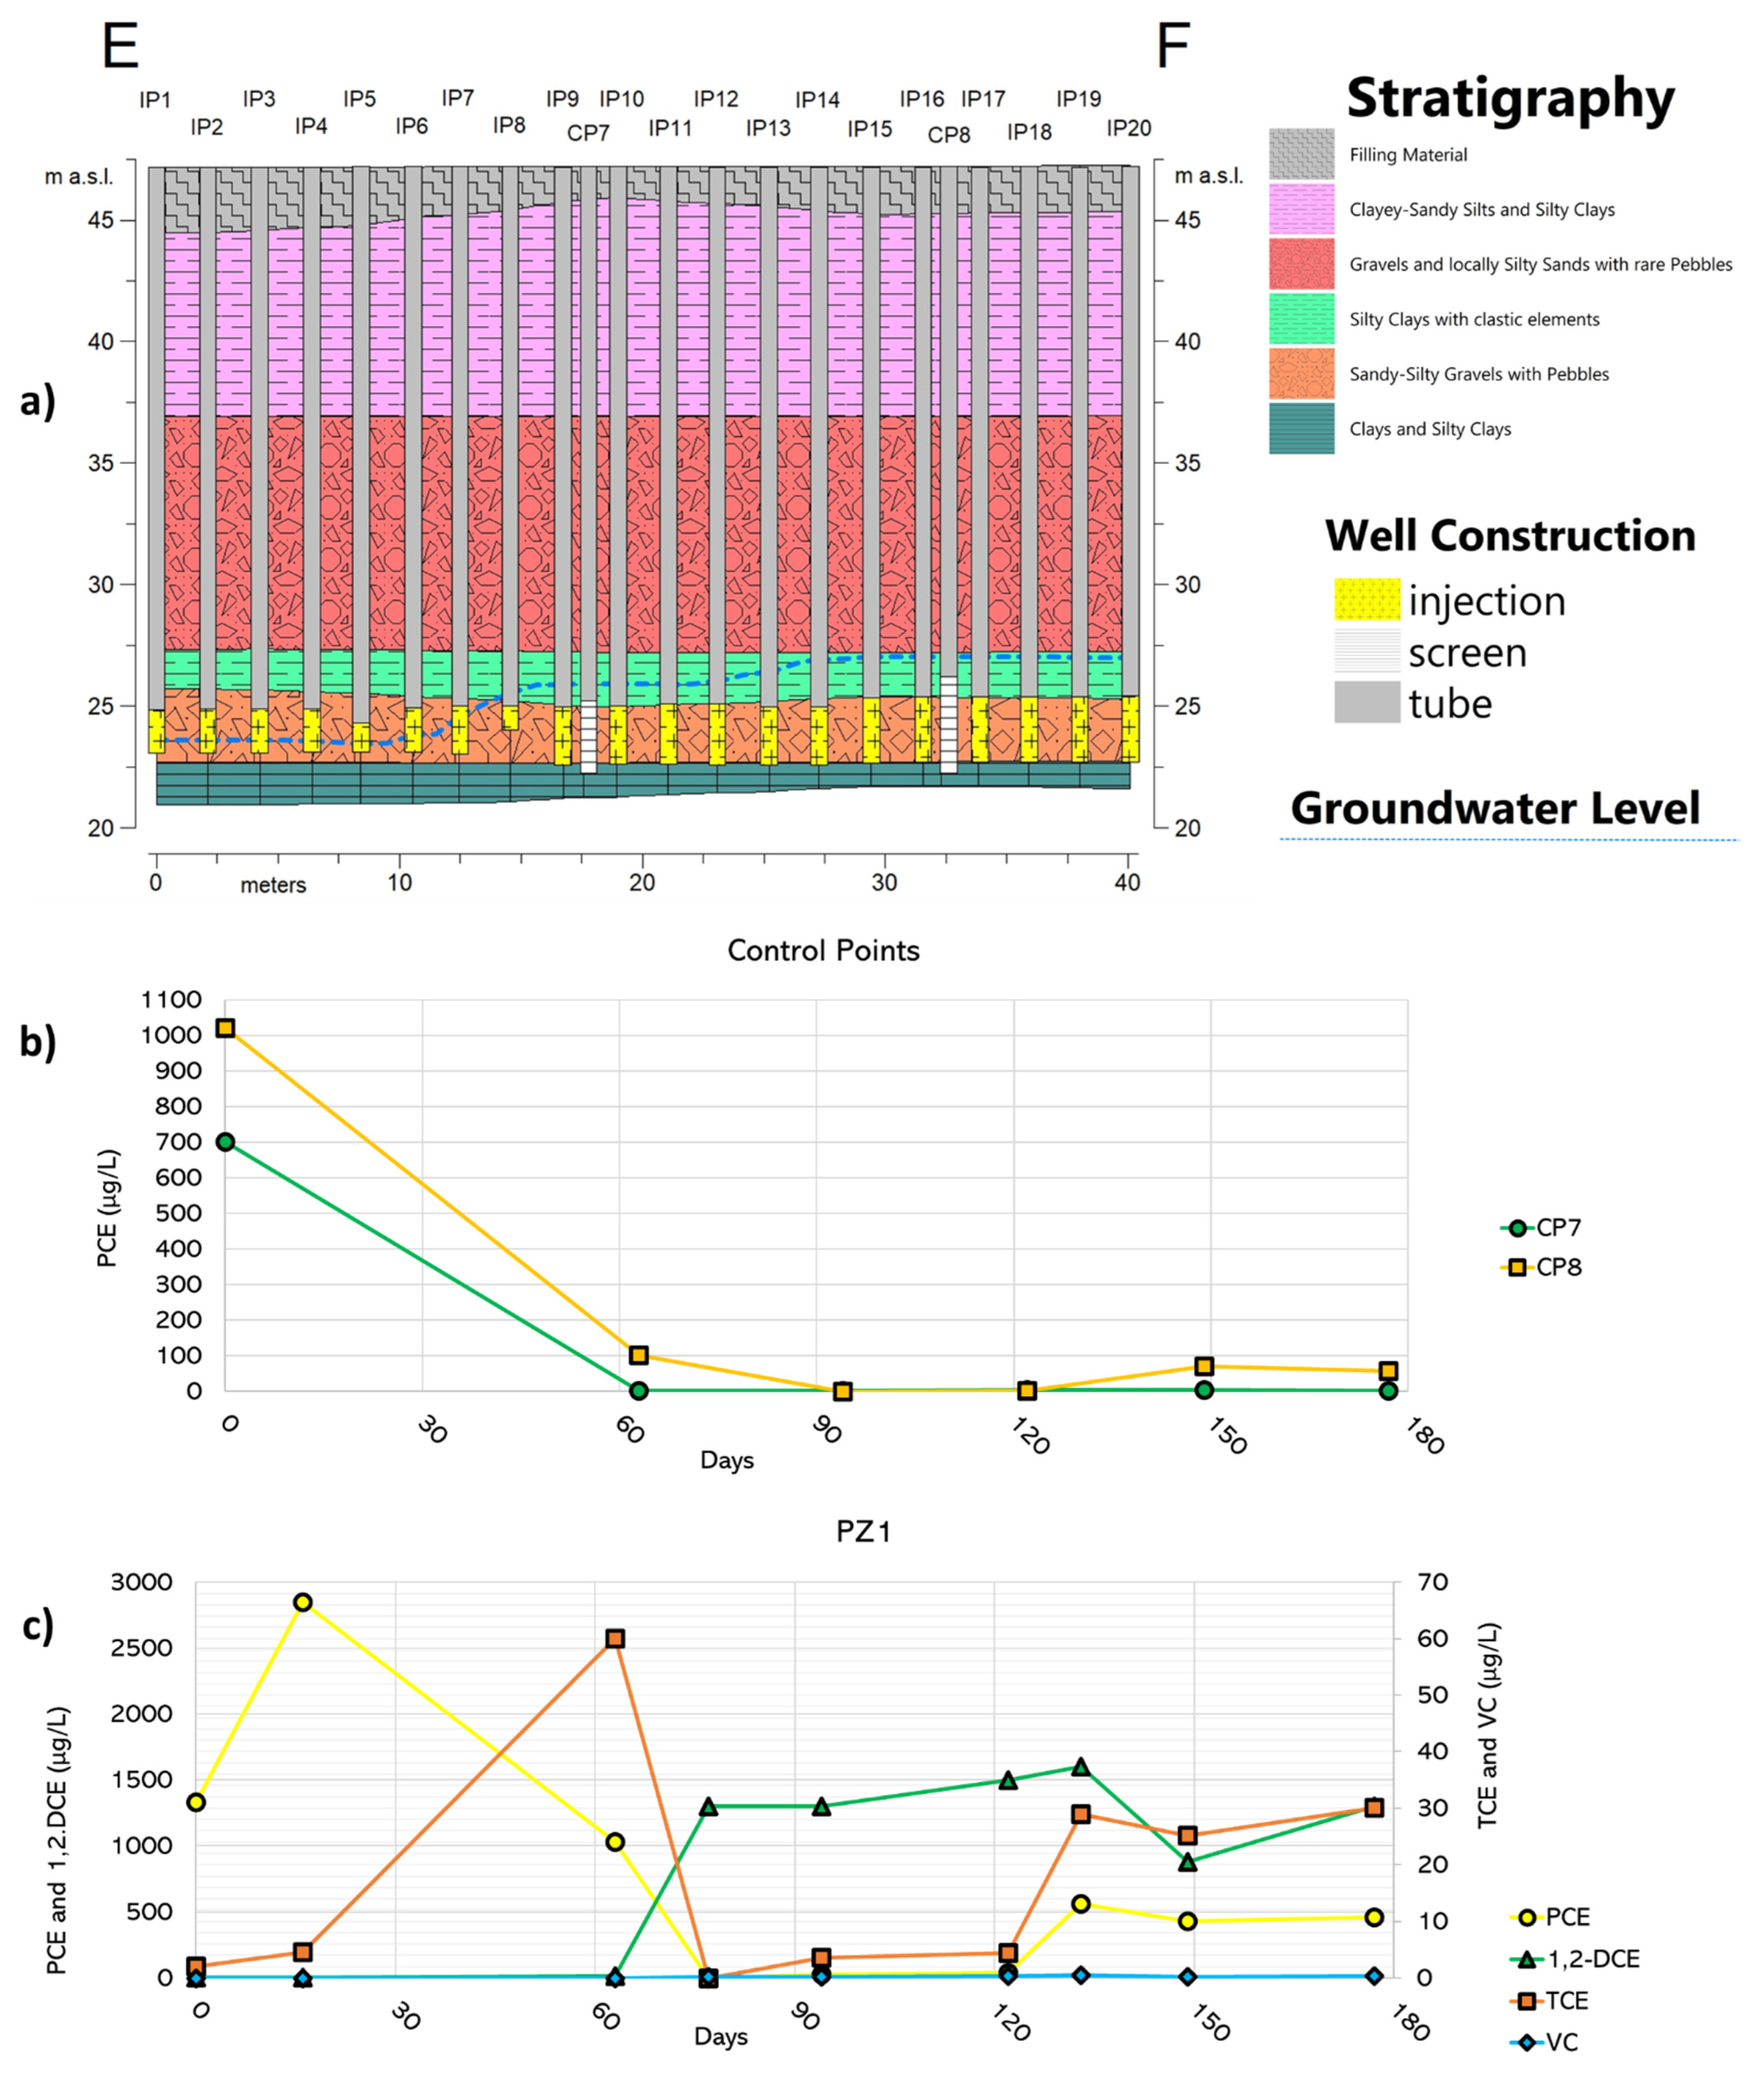
The configuration of the 20 IPs for the combined injection of PlumeStop® and S-MicroZVI® along the E-F barrier was tailored to site-specific hydrostratigraphic conditions, both to impact the sandy-gravel horizon of the aquifer, which is encountered at a depth of 22 m, and to account for the significant change in groundwater level along the profile (Figure 7a). The outcomes returning from the first six months of monitoring at CP7 and CP8 reveal a rapid contamination abatement. The values of PCE concentrations exhibit a reduction of approximately 90% from the first two months post-injection onwards (Table S6 of Supplementary Materials and Figure 7b). In the monitoring piezometer, PZ1, which is located approximately 5 m downstream of the injection profile, the rapid and quantitative decrease in PCE occurred with a subsequent increase in the concentration of 1,2-DCE (Table S7 of Supplementary Materials and Figure 7c).
In the monitoring piezometer PZ1, the evident reduction of PCE is attributable to a biodegradation event by autochthonous bacteria [12,13]. The rapid and quantitative decrease in PCE occurred with a subsequent increase in the concentration of 1,2-DCE, a typical anaerobic degradation subproduct and a compound certainly less impactful than PCE from an environmental point of view [5,55]. This indicates partial reductive dechlorination by autochthonous bacteria that are present in the saturated soil, as a first response to the changed oxide-reducing conditions of the aquifer around the piezometer due to the injections [55,62]. It might appear plausible to hypothesize that the dechlorinating activity of microorganisms is naturally inhibited due to the lack of electron donor and therefore reasonably destined to be exhausted without the possibility of leading to the formation of subsequent subproducts (i.e., VC and ethene) [12,13]. An alternative explanation for the low production of dechlorination products arises from microbiological analyses (Figure S1 of Supplementary Materials). These reveal that natural attenuation phenomena are kinetically limited. Although genes characteristic of reductive dehalogenases that catalyze the stages of hydrogenolysis and lead to the formation of ethene are present, the concentrations found appear generally insufficient to effectively support the biological reductive dechlorination process [15,17,51]. This evidence is consistent with the contamination scenario at the site, which is characterized by the absence of reductive dechlorination intermediates (TCE, cis-DCE, and VC) in significant concentrations relative to the parent contaminant (PCE). The microcosm test findings confirm a lack of natural dechlorinating activity and disclose that the addition of the electron donor does not appear to be a suitable strategy for the acceleration of natural attenuation processes at the site. External dechlorinating inoculum addition stimulates PCE reduction leading to ethene formation, but with significant transient accumulations of vinyl chloride (Figure S2 of Supplementary Materials) [52,53]. For these reasons, the mZVI technique was assessed to be suitable for the specific case in combination with micrometric activated carbons and BRD, as it integrates abiotic degradation with biotic degradation, limiting the accumulation of typical toxic intermediates from reductive dechlorination of PCE. The potential sustainability of the adopted technology in the site-specific situation lies in the possibility of preventing and avoiding VC accumulation, since its reduction is known to remain the bottleneck step in the biological dechlorination reaction, minimizing environmental impacts and reducing the risks of volatilization of toxic compounds in a highly urbanized area [67,68]. The data currently collected do not allow quantitative discrimination between the removal effect due to adsorption on activated carbon, chemical reduction promoted by zerovalent iron, and biological reductive dechlorination. Nevertheless, the selected remediation technique rapidly abates the dissolved PCE concentration (contribution of activated carbon) and in parallel degrades the PCE present in the aquifer through the action of micrometric sulfated zerovalent iron [44,46,54,55,57]. The latter is capable of both chemically reducing the organochlorines and inducing optimal conditions for the stimulation of potential biological reducing activity by autochthonous microbial populations (thus favoring the longevity of the adsorptive capacity of the activated carbon) [5]. Different authors have dealt with the injection of colloidal activated carbon and ZVI to treat groundwater contaminated with chlorinated ethenes [29,44,46,55,69]. Previous studies have generally observed incomplete dechlorination, transient generation of DCE and VC, and no accumulation of lower chlorinated VOCs in long-term degradation. Since it is challenging to determine whether changes in VOC concentrations are related to chemical reduction or biodegradation, a strategy for distinguishing biotic and abiotic degradation processes may lie in the comparison of the isotope signatures of the dechlorination products [33,55,70]. Sometimes the uneven distribution of injectates is strongly influenced by small-scale geological heterogeneities, which can limit the performance of this technology [44,46,55]. To overcome this obstacle, sediment sampling and visual analysis, hydrogeochemical monitoring, and near-real-time electrical tomography can be exploited for the assessment of the reactant distribution in the subsurface [29]. The adopted remediation strategy demonstrates very significant results in terms of extracted contaminant mass and abatement of contaminant load, testifying to the effectiveness of all the solutions configured based on site-specific hydrogeochemical characteristics, different concentrations of PCE, and variable thicknesses of treated saturated horizons.

4. Conclusions

This paper discusses a coupled hydrogeochemical approach for the model-based conceptualization of the geological, hydrogeological, biogeochemical, and geophysical relationships of a chlorinated solvent contaminated site. Fusion of geological, chemical, and physical data frames contaminant aging state, pollution mechanisms, and plume conformation in geologic matrices. The MIP results suggest the spotty presence of active secondary sources at the base of the saturated aquifer, above the contained water thicknesses, and in the overlying low-permeability levels. DNAPL that reached the top of the clayey layer bounding the groundwater flow, diffusion of dissolved contaminants to the upper low permeability zones, vapor concentrations due to solvent volatilization from the groundwater, and trapped contaminant on the aquifer matrix may result in accumulation of secondary pollution. The multidisciplinary architecture of the geodatabase and the resulting composite multi-source model direct the deployment of interventions, according to the pollutant partitioning modality between phases. The IEG CGC-AS® barriers intersect the plume of contamination, acting on secondary sources that are identified through MIP surveys and interrupting the path of dissolved contaminants towards downstream areas. Hydrochemical monitoring and extracted mass estimation prove the significant ability of the IEG CGC-AS® device in abating the primary contaminant. The IEG CGC-AS® barrier systems removed a total of 74 kg of PCE over activity periods ranging from 6 to 12 months. Chemical analyses of sampled water unveil the general decline of dissolved PCE concentrations in groundwater and the rebound effects that could potentially be ascribable to the slow release of contamination during non-recirculation. PlumeStop® and the S-MicroZVI® injection treatment reveal the significant lowering of PCE concentrations (approximately 90% from the first two months post-injection onwards) and the simultaneous formation of DCE. This is likely attributable to the limited kinetics of biological reductive dechlorination processes and the presence of dechlorinating microorganisms with insufficient concentrations to effectively support the biological reductive dechlorination pathway. The findings emphasize the value of a coupled hydrogeochemical methodology for the predisposition of an effective remediation strategy through innovative, versatile, adaptable, sustainable, and effective solutions in industrialized urban areas.

Supplementary Materials

The following supporting information can be downloaded at: https://www.mdpi.com/article/10.3390/su141610317/s1, Figure S1. Location of the 10 piezometers that were sampled for microbiological analysis (a). Results of microbiological characterization in terms of gene copies per liter of groundwater. The graph shows both the total concentrations of Dehalococcoides and the individual functional genes re-sponsible for individual steps in the reductive dechlorination of PCE (b); Figure S2. Detected concentrations of PCE, TCE, cis-DCE, VC, and ethene during microcosm tests without the addition of electron donor (a), with supplementation of electron donor only (b), by adding both electron donor and inoculum (c); Figure S3: Location of MIP investigation north of the industrial plant (a). Electrical conductivity (EC) and halogen-specific detector (XSD) vertical profiles acquired via MIP at the MIP05 and MIP17 points (b); Table S1: Observed groundwater levels at the measurement points of the monitoring network; Table S2: Extracted PCE mass (in kg) over time (days) since the startup of the IEG CGC-AS®-annexed plant along with the A-B barrier; Table S3: Detected PCE concentrations (µg/L) over time (days) at the CP1 and CP3; Table S4: Extracted PCE mass (in kg) over time (days) since the start-up of the IEG CGC-AS®-annexed plant along with the C-D barrier; Table S5: Measured PCE concentrations (µg/L) over time (days) at the CP4; Table S6: Measured PCE concentrations at the injection intervention control points, CP7 and CP8; Table S7: Concentrations of the parameters PCE, TCE, 1,2-DCE, and VC in the PZ1 monitoring piezometer.

Author Contributions

Conceptualization, P.C. and M.P.P.; methodology, P.C., C.E. and M.P.P.; software, P.C.; validation, E.J.A., C.N. and L.L. (Laura Ledda); formal analysis, E.B., C.N., L.L. (Laura Lorini) and M.P.P.; investigation, E.B., C.N. and L.L. (Laura Ledda); data curation, P.C., E.B., C.N. and L.L. (Laura Ledda); writing—original draft preparation, P.C.; writing—review and editing, E.J.A., E.B. and L.L. (Laura Lorini); visualization, P.C., C.E. and M.P.P.; supervision, C.E., E.B., C.N., L.L. (Laura Ledda) and M.P.P.; project administration, M.P.P. All authors have read and agreed to the published version of the manuscript.

Funding

This research received no external funding.

Institutional Review Board Statement

Not applicable.

Informed Consent Statement

Not applicable.

Data Availability Statement

Due to the sensitive nature of the questions asked in this study, some restrictions apply to the availability of these data, which were used under license for the current study, and so are not publicly available. Data are however available from the authors upon reasonable request.

Acknowledgments

We would like to thank Paola Goria and Marcello Carboni of Regenesis, for their technical support and their collaboration during the design, assistance, and realization of the coupled injection of micrometric zerovalent iron (S-MicroZVI®, Regenesis) and colloidal activated carbon (PlumeStop®, Regenesis).

Conflicts of Interest

The authors declare no conflict of interest.

References

  1. Filippini, M.; Nijenhuis, I.; Kümmel, S.; Chiarini, V.; Crosta, G.; Richnow, H.H.; Gargini, A. Multi-element compound specific stable isotope analysis of chlorinated aliphatic contaminants derived from chlorinated pitches. Sci. Total Environ. 2018, 640–641, 153–162. [Google Scholar] [CrossRef] [PubMed]
  2. Rivett, M.O.; Turner, R.J.; Murcott, P.G.; Cuthbert, M.O. The legacy of chlorinated solvents in the Birmingham aquifer, UK: Observations spanning three decades and the challenge of future urban groundwater development. J. Contam. Hydrol. 2012, 140–141, 107–123. [Google Scholar] [CrossRef] [PubMed]
  3. Walaszek, M.; Cary, L.; Billon, G.; Blessing, M.; Bouvet-Swialkowski, A.; George, M.; Criquet, J.; Mossmann, J.R. Dynamics of chlorinated aliphatic hydrocarbons in the Chalk aquifer of northern France. Sci. Total Environ. 2021, 757, 143742. [Google Scholar] [CrossRef]
  4. Wang, X.; Xin, J.; Yuan, M.; Zhao, F. Electron competition and electron selectivity in abiotic, biotic, and coupled systems for dechlorinating chlorinated aliphatic hydrocarbons in groundwater: A review. Water Res. 2020, 183, 116060. [Google Scholar] [CrossRef]
  5. Wu, N.; Zhang, W.; Wei, W.; Yang, S.; Wang, H.; Sun, Z.; Song, Y.; Li, P.; Yang, Y. Field study of chlorinated aliphatic hydrocarbon degradation in contaminated groundwater via micron zero-valent iron coupled with biostimulation. Chem. Eng. J. 2020, 384, 123349. [Google Scholar] [CrossRef]
  6. Mackay, D.M.; Roberts, P.V.; Cherry, J.A. Transport of organic contaminants in groundwater. Distribution and fate of chemicals in sand and gravel aquifers. Environ. Sci. Technol. 1985, 19, 384–392. [Google Scholar] [CrossRef]
  7. Mackay, D.M.; Cherry, J.A. Groundwater contamination: Pump-and-treat remediation. Environ. Sci. Technol. 1989, 23, 630–636. [Google Scholar] [CrossRef]
  8. Kueper, B.H.; Stroo, H.F.; Vogel, C.M.; Ward, C.H. Chlorinated Solvent Source Zone Remediation; Springer: New York, NY, USA, 2014. [Google Scholar] [CrossRef]
  9. Yang, L.; Wang, X.; Mendoza-Sanchez, I.; Abriola, L.M. Modeling the influence of coupled mass transfer processes on mass flux downgradient of heterogeneous DNAPL source zones. J. Contam. Hydrol. 2018, 211, 1–14. [Google Scholar] [CrossRef]
  10. Guleria, A.; Chakma, S. Fate and contaminant transport model-driven probabilistic human health risk assessment of DNAPL-contaminated site. Environ. Sci. Pollut. Res. 2020, 28, 14358–14371. [Google Scholar] [CrossRef]
  11. Guo, Y.; Holton, C.; Luo, H.; Dahlen, P.; Johnson, P.C. Influence of Fluctuating Groundwater Table on Volatile Organic Chemical Emission Flux at a Dissolved Chlorinated-Solvent Plume Site. Ground Water Monit. Remediat. 2019, 39, 43–52. [Google Scholar] [CrossRef]
  12. Sleep, E.B.; Brown, A.J.; Lollar, B.S. Long-term tetrachlorethene degradation sustained by endogenous cell decay. J. Environ. Eng. Sci. 2005, 4, 11–17. [Google Scholar] [CrossRef]
  13. Ebrahimbabaie, P.; Pichtel, J. Biotechnology and nanotechnology for remediation of chlorinated volatile organic compounds: Current perspectives. Environ. Sci. Pollut. Res. 2021, 28, 7710–7741. [Google Scholar] [CrossRef]
  14. He, J.; Ritalahti, K.M.; Yang, K.-L.; Koenigsberg, S.S.; Löffler, F.E. Detoxification of vinyl chloride to ethene coupled to growth of an anaerobic bacterium. Nature 2003, 424, 62–65. [Google Scholar] [CrossRef] [PubMed]
  15. Chen, G.; Murdoch, F.K.; Xie, Y.; Murdoch, R.W.; Cui, Y.; Yang, Y.; Yan, J.; Key, T.A.; Löffler, F.E. Dehalogenation of Chlorinated Ethenes to Ethene by a Novel Isolate, “Candidatus Dehalogenimonas etheniformans”. Appl. Environ. Microbiol. 2022, 88, 12. [Google Scholar] [CrossRef] [PubMed]
  16. Clark, K.; Taggart, D.M.; Baldwin, B.R.; Ritalahti, K.M.; Murdoch, R.W.; Hatt, J.K.; Löffler, F.E. Normalized Quantitative PCR Measurements as Predictors for Ethene Formation at Sites Impacted with Chlorinated Ethenes. Environ. Sci. Technol. 2018, 52, 13410–13420. [Google Scholar] [CrossRef]
  17. Ding, C.; Rogers, M.J.; He, J. Dehalococcoides mccartyi Strain GEO12 Has a Natural Tolerance to Chloroform Inhibition. Environ. Sci. Technol. 2020, 54, 8750–8759. [Google Scholar] [CrossRef]
  18. Brooks, M.C.; Yarney, E.; Huang, J. Strategies for Managing Risk due to Back Diffusion. Ground Water Monit. Remediat. 2021, 41, 76–98. [Google Scholar] [CrossRef]
  19. Brusseau, M.L.; Guo, Z. Assessing contaminant-removal conditions and plume persistence through analysis of data from long-term pump-and-treat operations. J. Contam. Hydrol. 2014, 164, 16–24. [Google Scholar] [CrossRef]
  20. Colombano, S.; Davarzani, H.; van Hullebusch, E.; Huguenot, D.; Guyonnet, D.; Deparis, J.; Lion, F.; Ignatiadis, I. Comparison of thermal and chemical enhanced recovery of DNAPL in saturated porous media: 2D tank pumping experiments and two-phase flow modelling. Sci. Total Environ. 2021, 760, 143958. [Google Scholar] [CrossRef]
  21. Mateas, D.J.; Tick, G.R.; Carroll, K.C. In situ stabilization of NAPL contaminant source-zones as a remediation technique to reduce mass discharge and flux to groundwater. J. Contam. Hydrol. 2017, 204, 40–56. [Google Scholar] [CrossRef]
  22. Engelmann, C.; Händel, F.; Binder, M.; Yadav, P.K.; Dietrich, P.; Liedl, R.; Walther, M. The fate of DNAPL contaminants in non-consolidated subsurface systems–Discussion on the relevance of effective source zone geometries for plume propagation. J. Hazard. Mater. 2019, 375, 233–240. [Google Scholar] [CrossRef] [PubMed]
  23. Kang, X.; Shi, X.; Deng, Y.; Revil, A.; Xu, H.; Wu, J. Coupled hydrogeophysical inversion of DNAPL source zone architecture and permeability field in a 3D heterogeneous sandbox by assimilation time-lapse cross-borehole electrical resistivity data via ensemble Kalman filtering. J. Hydrol. 2018, 567, 149–164. [Google Scholar] [CrossRef]
  24. McCall, W.; Christy, T.M.; Pipp, D.; Terkelsen, M.; Christensen, A.; Weber, K.; Engelsen, P. Field Application of the Combined Membrane-Interface Probe and Hydraulic Profiling Tool (MiHpt). Ground Water Monit. Remediat. 2014, 34, 85–95. [Google Scholar] [CrossRef]
  25. Netto, L.G.; Barbosa, A.M.; Galli, V.L.; Pereira, J.P.S.; Gandolfo, O.C.B.; Birelli, C.A. Application of invasive and non-invasive methods of geo-environmental investigation for determination of the contamination behavior by organic compounds. J. Appl. Geophys. 2020, 178, 104049. [Google Scholar] [CrossRef]
  26. Nivorlis, A.; Dahlin, T.; Rossi, M.; Höglund, N.; Sparrenbom, C. Multidisciplinary Characterization of Chlorinated Solvents Contamination and In-Situ Remediation with the Use of the Direct Current Resistivity and Time-Domain Induced Polarization Tomography. Geosciences 2019, 9, 487. [Google Scholar] [CrossRef]
  27. Pollard, S.J.T.; Brookes, A.; Earl, N.; Lowe, J.; Kearney, T.; Nathanail, C.P. Integrating decision tools for the sustainable management of land contamination. Sci. Total Environ. 2004, 325, 15–28. [Google Scholar] [CrossRef]
  28. Ciampi, P.; Esposito, C.; Papini, M.P. Hydrogeochemical Model Supporting the Remediation Strategy of a Highly Contaminated Industrial Site. Water 2019, 11, 1371. [Google Scholar] [CrossRef]
  29. Ciampi, P.; Esposito, C.; Viotti, P.; Boaga, J.; Cassiani, G.; Papini, M.P. An Integrated Approach Supporting Remediation of an Aquifer Contaminated with Chlorinated Solvents by a Combination of Adsorption and Biodegradation. Appl. Sci. 2019, 9, 4318. [Google Scholar] [CrossRef]
  30. Binley, A.; Hubbard, S.S.; Huisman, J.A.; Revil, A.; Robinson, D.; Singha, K.; Slater, L. The emergence of hydrogeophysics for improved understanding of subsurface processes over multiple scales. Water Resour. Res. 2015, 51, 3837–3866. [Google Scholar] [CrossRef]
  31. Ciampi, P.; Esposito, C.; Bartsch, E.; Alesi, E.J.; Papini, M.P. 3D dynamic model empowering the knowledge of the decontamination mechanisms and controlling the complex remediation strategy of a contaminated industrial site. Sci. Total Environ. 2021, 793, 148649. [Google Scholar] [CrossRef]
  32. Ciampi, P.; Esposito, C.; Cassiani, G.; Deidda, G.P.; Flores-Orozco, A.; Rizzetto, P.; Chiappa, A.; Bernabei, M.; Gardon, A.; Papini, M.P. Contamination presence and dynamics at a polluted site: Spatial analysis of integrated data and joint conceptual modeling approach. J. Contam. Hydrol. 2022, 248, 104026. [Google Scholar] [CrossRef] [PubMed]
  33. Ciampi, P.; Esposito, C.; Bartsch, E.; Alesi, E.J.; Rehner, G.; Petrangeli Papini, M. Remediation of chlorinated aliphatic hydrocarbons (CAHs) contaminated site coupling groundwater recirculation well (IEG-GCW®) with a peripheral injection of soluble nutrient supplement (IEG-C-MIX) via multilevel-injection wells (IEG-MIW). Heliyon, 2022; submitted. [Google Scholar]
  34. Ciampi, P.; Esposito, C.; Cassiani, G.; Deidda, G.P.; Rizzetto, P.; Papini, M.P. A field-scale remediation of residual light non-aqueous phase liquid (LNAPL): Chemical enhancers for pump and treat. Environ. Sci. Pollut. Res. 2021, 28, 35286–35296. [Google Scholar] [CrossRef]
  35. Alberti, L.; Colombo, L.; Formentin, G. Null-space Monte Carlo particle tracking to assess groundwater PCE (Tetrachloroethene) diffuse pollution in north-eastern Milan functional urban area. Sci. Total Environ. 2018, 621, 326–339. [Google Scholar] [CrossRef] [PubMed]
  36. Wu, Y.-X.; Shen, J.S.; Cheng, W.-C.; Hino, T. Semi-analytical solution to pumping test data with barrier, wellbore storage, and partial penetration effects. Eng. Geol. 2017, 226, 44–51. [Google Scholar] [CrossRef]
  37. You, X.; Liu, S.; Dai, C.; Guo, Y.; Zhong, G.; Duan, Y. Contaminant occurrence and migration between high- and low-permeability zones in groundwater systems: A review. Sci. Total Environ. 2020, 743, 140703. [Google Scholar] [CrossRef]
  38. Goltz, M.N.; Gandhi, R.K.; Gorelick, S.M.; Hopkins, G.D.; Smith, L.H.; Timmins, B.H.; McCarty, P.L. Field Evaluation of In Situ Source Reduction of Trichloroethylene in Groundwater Using Bioenhanced in-Well Vapor Stripping. Environ. Sci. Technol. 2005, 39, 8963–8970. [Google Scholar] [CrossRef]
  39. Gonen, O.; Gvirtzman, H. Laboratory-scale analysis of aquifer remediation by in-well vapor stripping 1. Laboratory results. J. Contam. Hydrol. 1997, 29, 23–39. [Google Scholar] [CrossRef]
  40. Katz, Y.; Gvirtzman, H. Capture and cleanup of a migrating VOC plume by the in-well vapor stripping: A sand tank experiment. J. Contam. Hydrol. 2000, 43, 25–44. [Google Scholar] [CrossRef]
  41. Leins, C. Hydrogeologische Untersuchungen zur Sanierung eines LCKW-Schadensfalles mit Koaxialer Grundwasserbelüftung. Mitt. Ing. Hydrogeol. 1994, 56, 105. [Google Scholar]
  42. Leins, C.; Alesi, E.J.; Rehner, G. Zirkulationsströmungen im Aquifer Infolge Koaxialer Grundwasserbelüftung zur Entfernung von LHKW; TerraTech 4/5: Mainz, Germany, 1994; pp. 54–56. [Google Scholar]
  43. Leins, C.; Rehner, G. Coaxial Groundwater Aeration for In Situ Remediation of Volatile Contaminants in Soil and Groundwater. In Proceedings of the Fifth International KfK/TNO Conference on Contaminated Soil and Groundwater, Maastricht, The Netherlands, 30 October–3 November 1995. [Google Scholar]
  44. Fan, D.; Gilbert, E.J.; Fox, T. Current state of in situ subsurface remediation by activated carbon-based amendments. J. Environ. Manag. 2017, 204, 793–803. [Google Scholar] [CrossRef] [PubMed]
  45. Hamed, M.M.; Bedient, P.B.; Conte, J.P. Numerical stochastic analysis of groundwater contaminant transport and plume containment. J. Contam. Hydrol. 1996, 24, 1–24. [Google Scholar] [CrossRef]
  46. McGregor, R.; Zhao, Y. The in situ treatment of TCE and PFAS in groundwater within a silty sand aquifer. Remediat. J. 2021, 31, 7–17. [Google Scholar] [CrossRef]
  47. Orozco, A.F.; Ciampi, P.; Katona, T.; Censini, M.; Papini, M.P.; Deidda, G.P.; Cassiani, G. Delineation of hydrocarbon contaminants with multi-frequency complex conductivity imaging. Sci. Total Environ. 2021, 768, 144997. [Google Scholar] [CrossRef] [PubMed]
  48. Shishaye, H.A.; Tait, D.R.; Befus, K.M.; Maher, D.T.; Reading, M.J. New insights into the hydrogeology and groundwater flow in the Great Barrier Reef catchment, Australia, revealed through 3D modelling. J. Hydrol. Reg. Stud. 2020, 30, 100708. [Google Scholar] [CrossRef]
  49. Liu, Z.; Zhang, Z.; Zhou, C.; Ming, W.; Du, Z. An Adaptive Inverse-Distance Weighting Interpolation Method Considering Spatial Differentiation in 3D Geological Modeling. Geosciences 2021, 11, 51. [Google Scholar] [CrossRef]
  50. Zhang, Q.; Zhu, H. Collaborative 3D geological modeling analysis based on multi-source data standard. Eng. Geol. 2018, 246, 233–244. [Google Scholar] [CrossRef]
  51. Van der Zaan, B.; Hannes, F.; Hoekstra, N.; Rijnaarts, H.; de Vos, W.M.; Smidt, H.; Gerritse, J. Correlation of Dehalococcoides 16S rRNA and Chloroethene-Reductive Dehalogenase Genes with Geochemical Conditions in Chloroethene-Contaminated Groundwater. Appl. Environ. Microbiol. 2010, 76, 843–850. [Google Scholar] [CrossRef]
  52. Lendvay, J.M.; Löffler, F.E.; Dollhopf, M.; Aiello, M.R.; Daniels, G.; Fathepure, B.Z.; Gebhard, M.; Heine, R.; Helton, R.; Shi, J.; et al. Bioreactive Barriers: A Comparison of Bioaugmentation and Biostimulation for Chlorinated Solvent Remediation. Environ. Sci. Technol. 2003, 37, 1422–1431. [Google Scholar] [CrossRef]
  53. Volpe, A.; Del Moro, G.; Rossetti, S.; Tandoi, V.; Lopez, A. Remediation of PCE-contaminated groundwater from an industrial site in southern Italy: A laboratory-scale study. Process Biochem. 2007, 42, 1498–1505. [Google Scholar] [CrossRef]
  54. Georgi, A.; Schierz, A.; Mackenzie, K.; Kopinke, F.-D. Colloidal activated carbon for in-situ groundwater remediation—Transport characteristics and adsorption of organic compounds in water-saturated sediment columns. J. Contam. Hydrol. 2015, 179, 76–88. [Google Scholar] [CrossRef] [PubMed]
  55. Ottosen, C.B.; Bjerg, P.L.; Hunkeler, D.; Zimmermann, J.; Tuxen, N.; Harrekilde, D.; Bennedsen, L.; Leonard, G.; Brabæk, L.; Kristensen, I.L.; et al. Assessment of chlorinated ethenes degradation after field scale injection of activated carbon and bioamendments: Application of isotopic and microbial analyses. J. Contam. Hydrol. 2021, 240, 103794. [Google Scholar] [CrossRef] [PubMed]
  56. Lhotský, O.; Kukačka, J.; Slunský, J.; Marková, K.; Němeček, J.; Knytl, V.; Cajthaml, T. The Effects of Hydraulic/Pneumatic Fracturing-Enhanced Remediation (FRAC-IN) at a Site Contaminated by Chlorinated Ethenes: A Case Study. J. Hazard. Mater. 2021, 417, 125883. [Google Scholar] [CrossRef] [PubMed]
  57. Velimirovic, M.; Tosco, T.; Uyttebroek, M.; Luna, M.; Gastone, F.; De Boer, C.; Klaas, N.; Sapion, H.; Eisenmann, H.; Larsson, P.-O.; et al. Field assessment of guar gum stabilized microscale zerovalent iron particles for in-situ remediation of 1,1,1-trichloroethane. J. Contam. Hydrol. 2014, 164, 88–99. [Google Scholar] [CrossRef]
  58. Parker, B.L.; Cherry, J.A.; Chapman, S.W.; Guilbeault, M.A. Review and Analysis of Chlorinated Solvent Dense Nonaqueous Phase Liquid Distributions in Five Sandy Aquifers. Vadose Zone J. 2003, 2, 116–137. [Google Scholar] [CrossRef]
  59. Freedman, V.; Connelly, M.; Rockhold, M.; Hasan, N.; Mehta, S.; McMahon, W.J.; Kozak, M.; Hou, Z.J.; Bergeron, M. A multiple lines of evidence approach for identifying geologic heterogeneities in conceptual site models for performance assessments. Sci. Total Environ. 2019, 692, 450–464. [Google Scholar] [CrossRef]
  60. Utom, A.U.; Werban, U.; Leven, C.; Müller, C.; Dietrich, P. Adaptive observation-based subsurface conceptual site modeling framework combining interdisciplinary methodologies: A case study on advancing the understanding of a groundwater nitrate plume occurrence. Environ. Sci. Pollut. Res. 2019, 26, 15754–15766. [Google Scholar] [CrossRef]
  61. Fjordbøge, A.S.; Janniche, G.S.; Jørgensen, T.H.; Grosen, B.; Wealthall, G.; Christensen, A.G.; Kerrn-Jespersen, H.; Broholm, M.M. Integrity of Clay till Aquitards to DNAPL Migration: Assessment Using Current and Emerging Characterization Tools. Ground Water Monit. Remediat. 2017, 37, 45–61. [Google Scholar] [CrossRef]
  62. Schaefer, C.E.; Lavorgna, G.M.; Haluska, A.A.; Annable, M.D. Long-Term Impacts on Groundwater and Reductive Dechlorination Following Bioremediation in a Highly Characterized Trichloroethene DNAPL Source Area. Ground Water Monit. Remediat. 2018, 38, 65–74. [Google Scholar] [CrossRef]
  63. Odah, M. ART in-well air stripping-An innovative technology succeeds where other technologies have failed. Remediat. J. 2002, 12, 107–114. [Google Scholar] [CrossRef]
  64. Sutton, P.T.; Ginn, T.R. Sustainable in-well vapor stripping: A design, analytical model, and pilot study for groundwater remediation. J. Contam. Hydrol. 2014, 171, 32–41. [Google Scholar] [CrossRef] [PubMed]
  65. Elmore, A.C.; Graff, T. Best Available Treatment Technologies Applied to Groundwater Circulation Wells. Remediat. J. 2002, 12, 63–80. [Google Scholar] [CrossRef]
  66. Caliman, F.A.; Robu, B.M.; Smaranda, C.; Pavel, V.L.; Gavrilescu, M. Soil and groundwater cleanup: Benefits and limits of emerging technologies. Clean Technol. Environ. Policy 2010, 13, 241–268. [Google Scholar] [CrossRef]
  67. Rossi, M.M.; Matturro, B.; Amanat, N.; Rossetti, S.; Papini, M.P. Coupled Adsorption and Biodegradation of Trichloroethylene on Biochar from Pine Wood Wastes: A Combined Approach for a Sustainable Bioremediation Strategy. Microorganisms 2022, 10, 101. [Google Scholar] [CrossRef]
  68. Ottosen, C.B.; Rønde, V.; McKnight, U.S.; Annable, M.D.; Broholm, M.M.; Devlin, J.F.; Bjerg, P.L. Natural attenuation of a chlorinated ethene plume discharging to a stream: Integrated assessment of hydrogeological, chemical and microbial interactions. Water Res. 2020, 186, 116332. [Google Scholar] [CrossRef]
  69. Davis, D.; Miller, O.J. Addition of divalent iron to electron donor mixtures for remediation of chlorinated ethenes: A study of 100 wells. Remediat. J. 2018, 29, 37–44. [Google Scholar] [CrossRef]
  70. Garcia, A.N.; Boparai, H.K.; Chowdhury, A.I.; de Boer, C.V.; Kocur, C.M.; Passeport, E.; Lollar, B.S.; Austrins, L.M.; Herrera, J.; O’Carroll, D.M. Sulfidated nano zerovalent iron (S-nZVI) for in situ treatment of chlorinated solvents: A field study. Water Res. 2020, 174, 115594. [Google Scholar] [CrossRef]
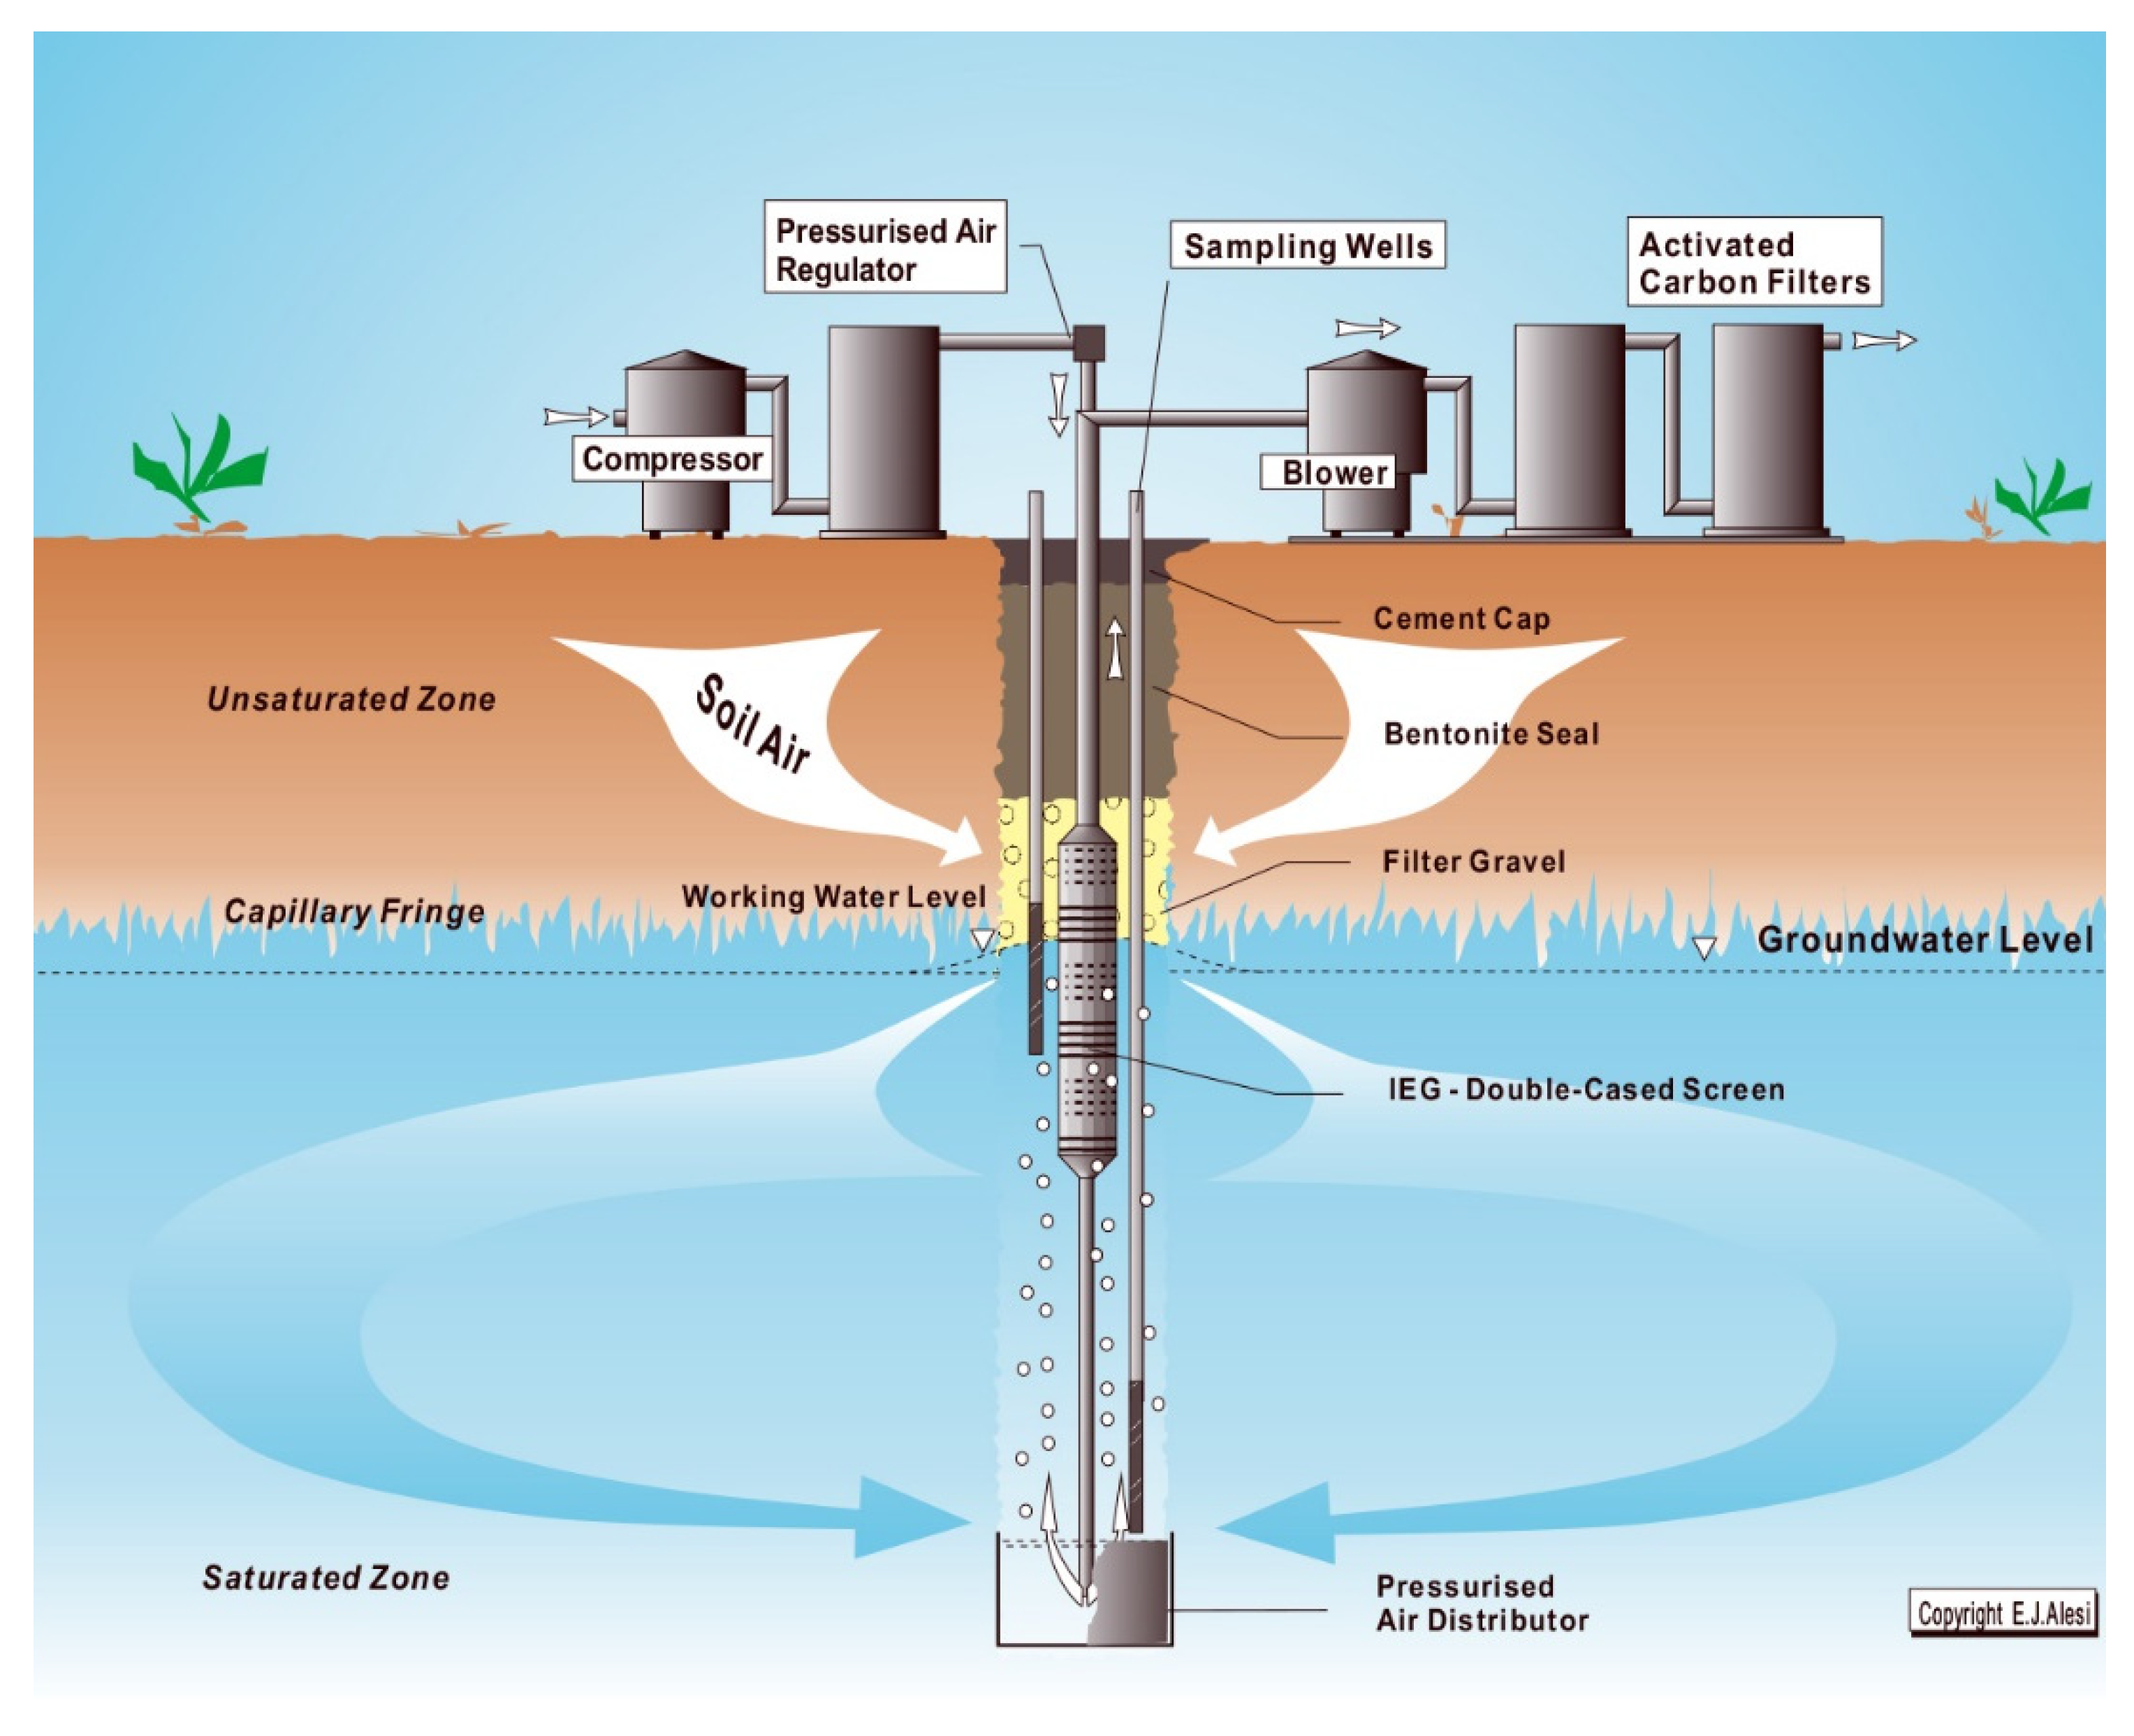
Figure 1. Operational scheme of an IEG CGC-AS® well with the associated treatment plant.
Sustainability 14 10317 g001
Figure 2. Stratigraphic sequence, piezometric level, and construction scheme of the BH1 piezometer. Acquired electrical conductivity (EC) and halogen-specific detector (XSD) vertical profiles via MIP survey at the same point.
Sustainability 14 10317 g002
Figure 3. 3D view of drilled geologic boreholes in the plant area, lithologic section illustrating stratigraphic relationships, and depiction of the PCE plume with an isoconcentration of 110 µg/L situated downstream of the plant. Position of the intervention barriers with IEG CGC-AS® (A-B, C-D) and amendment injection (E-F). Representation of groundwater flow vectors, location of the investigation point BH1, and the monitoring piezometer PZ1.
Sustainability 14 10317 g003
Figure 4. Hydrostratigraphic sections that are realized in correspondence of the intervention barriers A-B (a) and C-D (b) with IEG CGC-AS® technology and that are superimposed both to the constructive schemes of the wells and to the measured piezometric level.
Sustainability 14 10317 g004
Figure 5. Trend of extracted PCE mass (in kg) over time (days) since the startup of the IEG CGC-AS®-annexed plant along with the A-B barrier (a). Trends of PCE detected concentrations (µg/L) over time (days) at the CP1 (b) and CP3 (c).
Sustainability 14 10317 g005
Figure 6. Trend of extracted PCE mass (in kg) over time (days) since the start-up of the IEG CGC-AS®-annexed plant along with the C-D barrier (a). The trend of measured PCE concentrations (µg/L) over time (days) at the CP4 control point (b).
Sustainability 14 10317 g006
Figure 7. E-F hydrostratigraphic profile of the adsorbent and reducing barrier where PlumeStop® and S-MicroZVI® were injected, which is superimposed on the configuration of the injection stations and the measured piezometric level (a). Measured PCE concentrations at the injection intervention control points, CP7, and CP8 (b). Trends in concentrations of the parameters PCE, TCE, 1,2-DCE, and VC in the PZ1 monitoring piezometer (c).
Sustainability 14 10317 g007
Publisher’s Note: MDPI stays neutral with regard to jurisdictional claims in published maps and institutional affiliations.