
Research on Coupled Cooperative Operation of Medium- and Long-Term and Spot Electricity Transaction for Multi-Energy System: A Case Study in China

Abstract
:1. Introduction
- (1)
- This research realizes the medium- and long-term electricity markets and the spot market to be coupled with a cooperative operation for a multi-energy hybrid system.
- (2)
- A new dispatching model to promote fresh energy consumption is proposed to deal with the uncertainty of power decomposition in medium- and long-term contracts and the incompleteness of the spot market pilot operation.
- (3)
- The MTCS model, based on the objective function of minimizing the operating cost of thermal power, can effectively dispatch thermal power and hydropower units to cut peaks and fill valleys and maximize renewable energy consumption.
- (4)
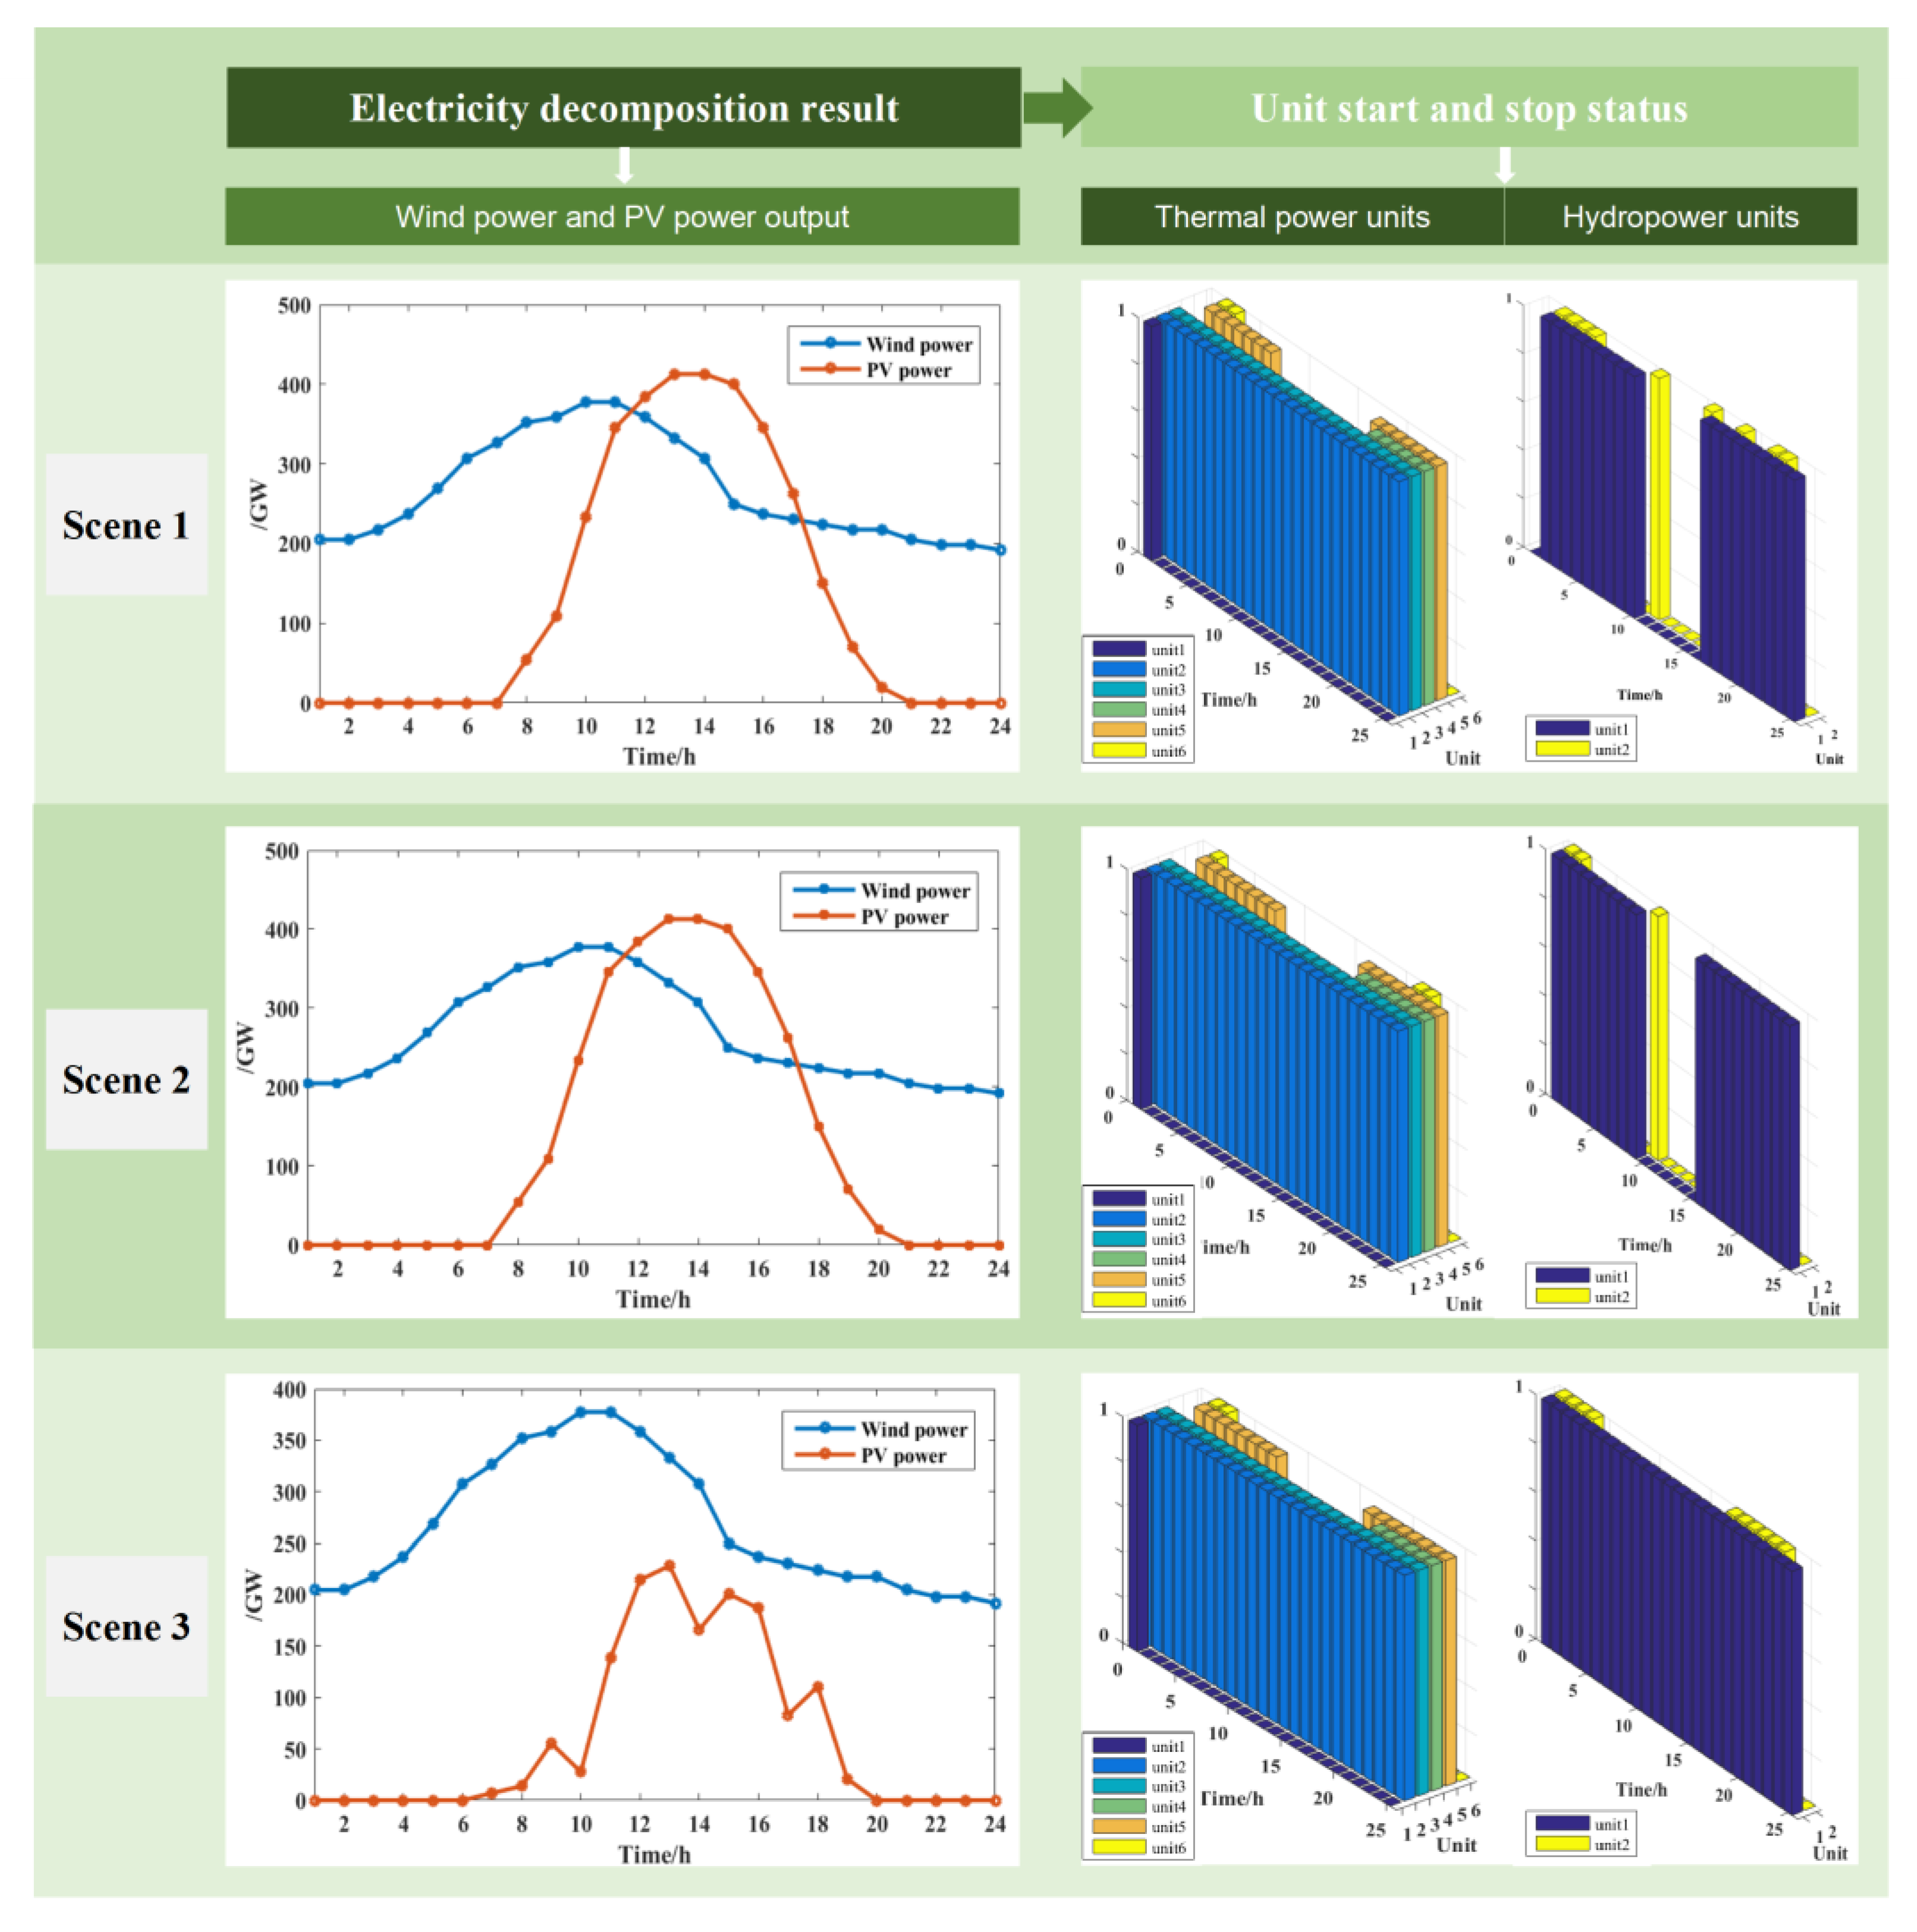
- A two-stage solution method that includes electricity decomposition and unit start and stop status is introduced to solve the complex multi-agent, multi-period, and multi-energy model.
- (5)
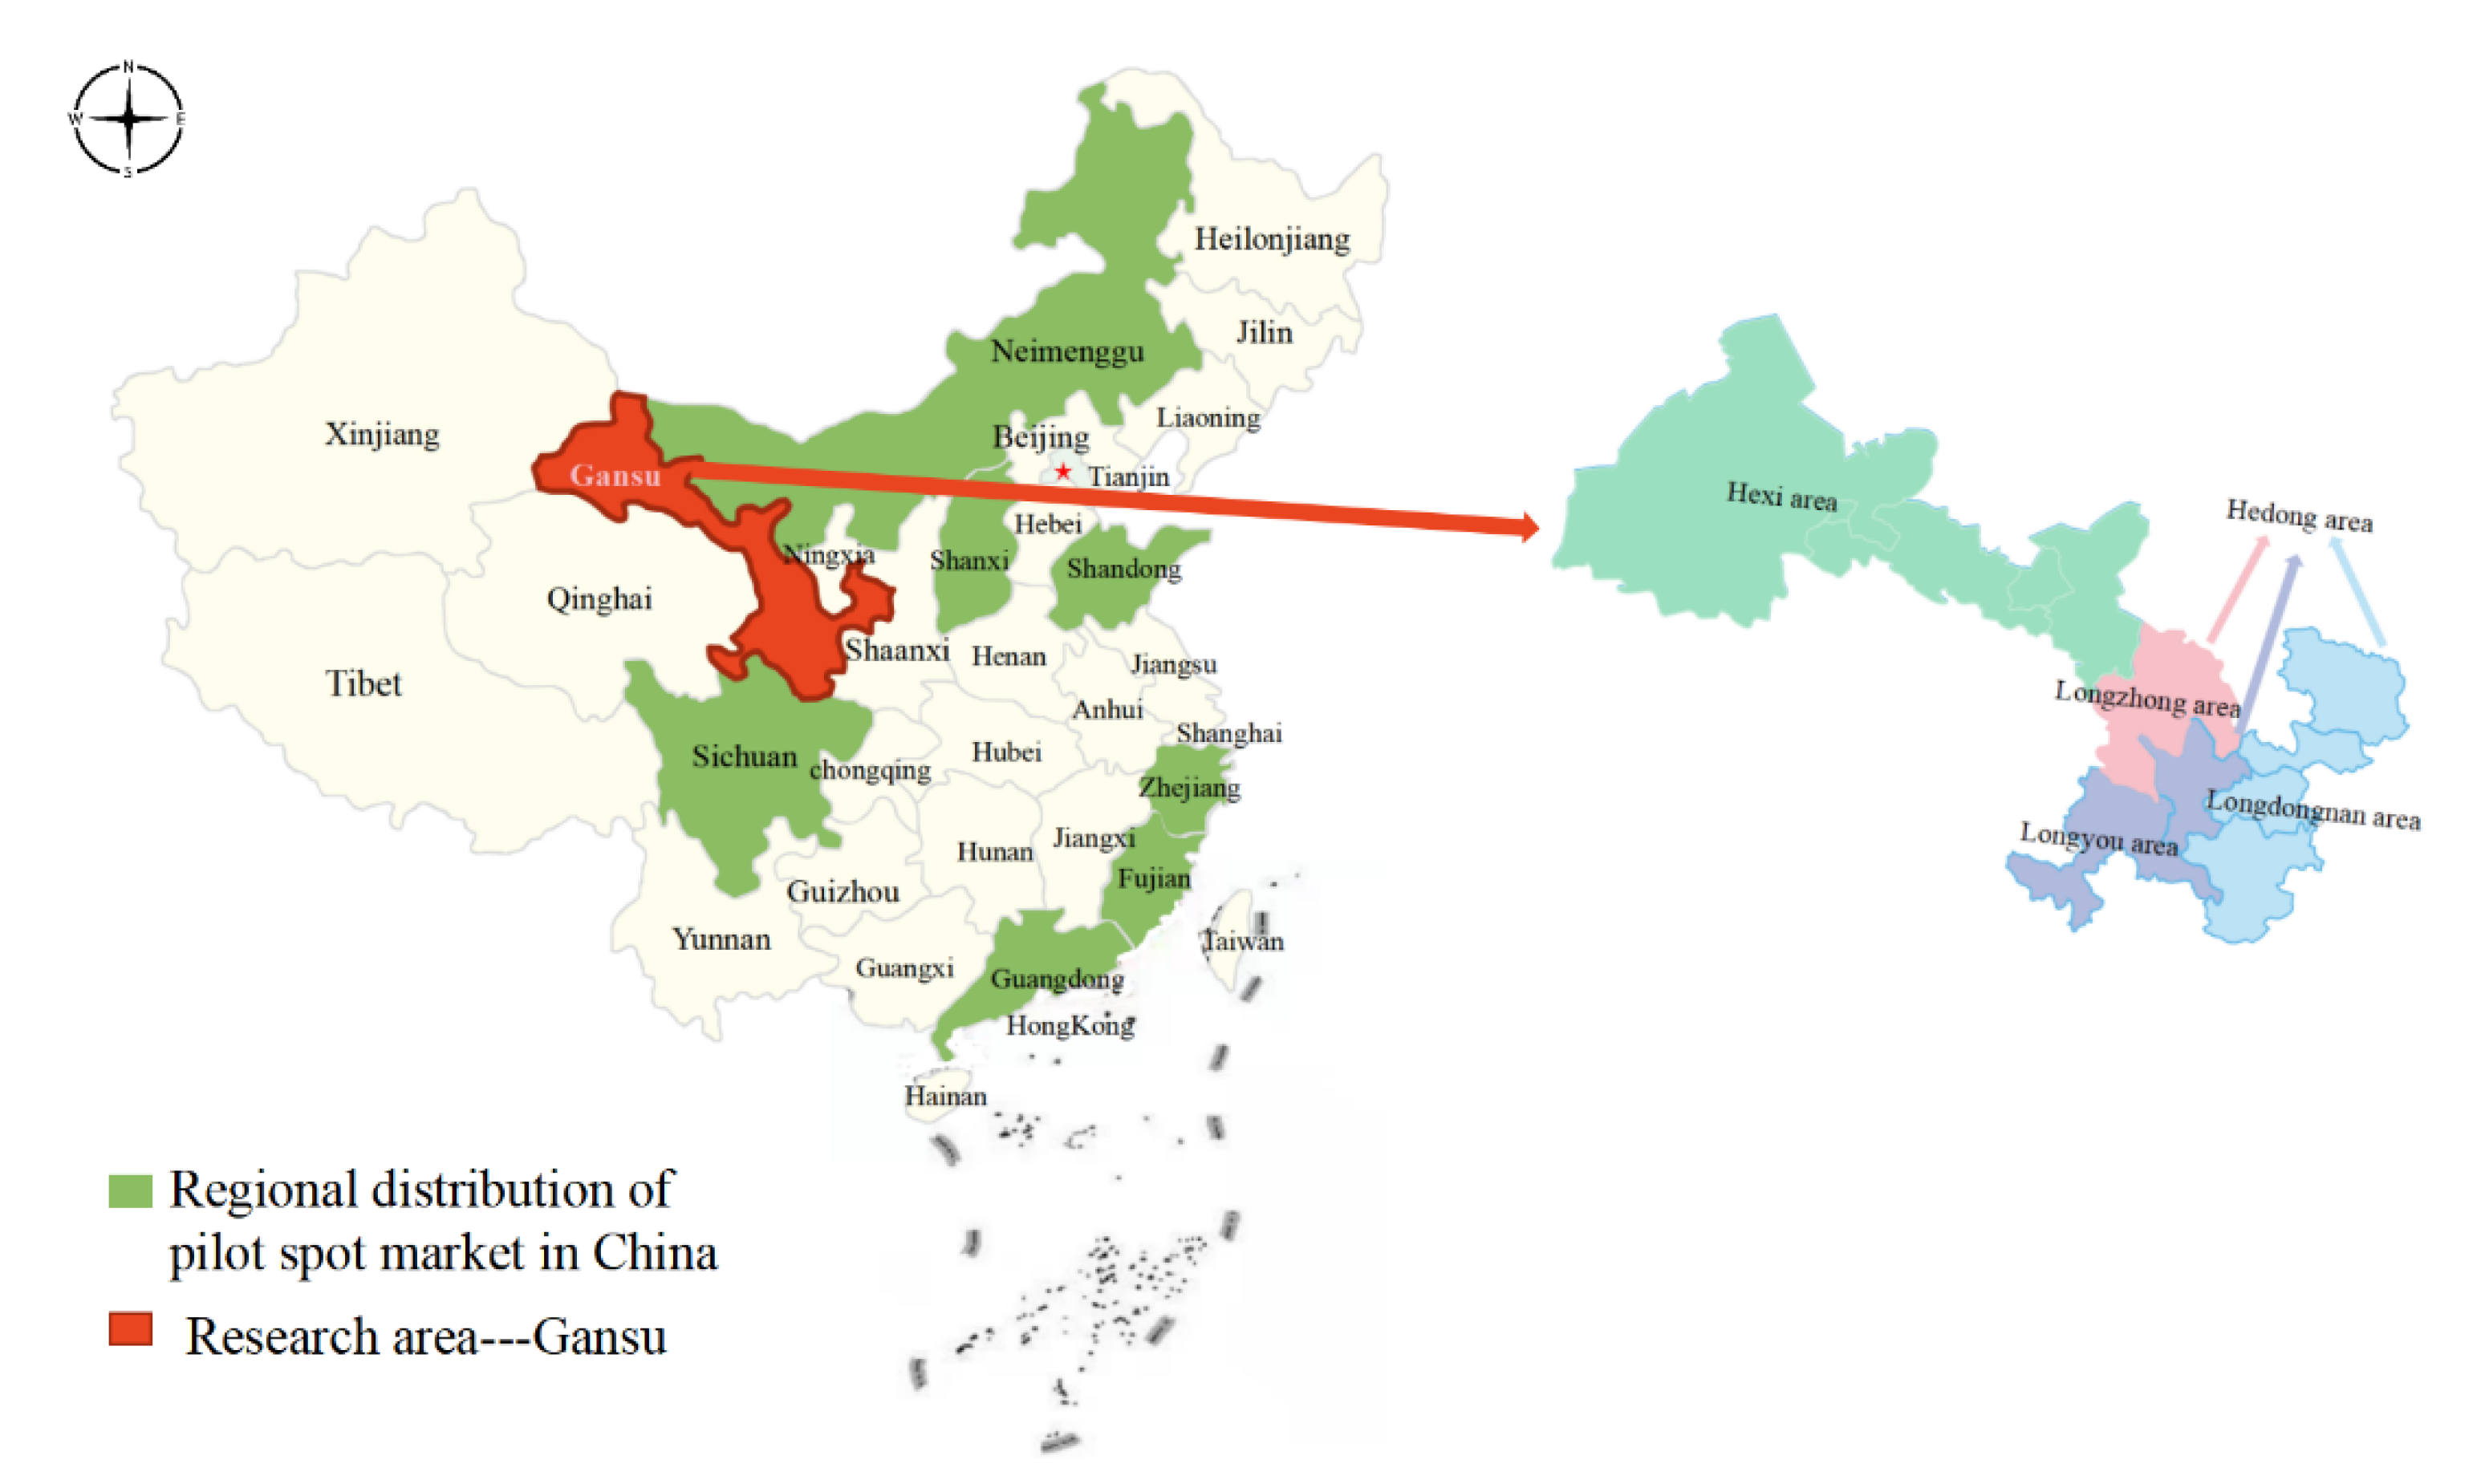
- Gansu province is China’s earliest pilot spot market region, and typical scenes are introduced to cross-validate the MTCS model.
2. Problem Statement and Study Area Description
2.1. Study Area
2.2. Data Source
2.3. Problem Summary
3. The Development of Mid-Long-Term Spot Transaction Coordination Scheduling Model (MTCS)
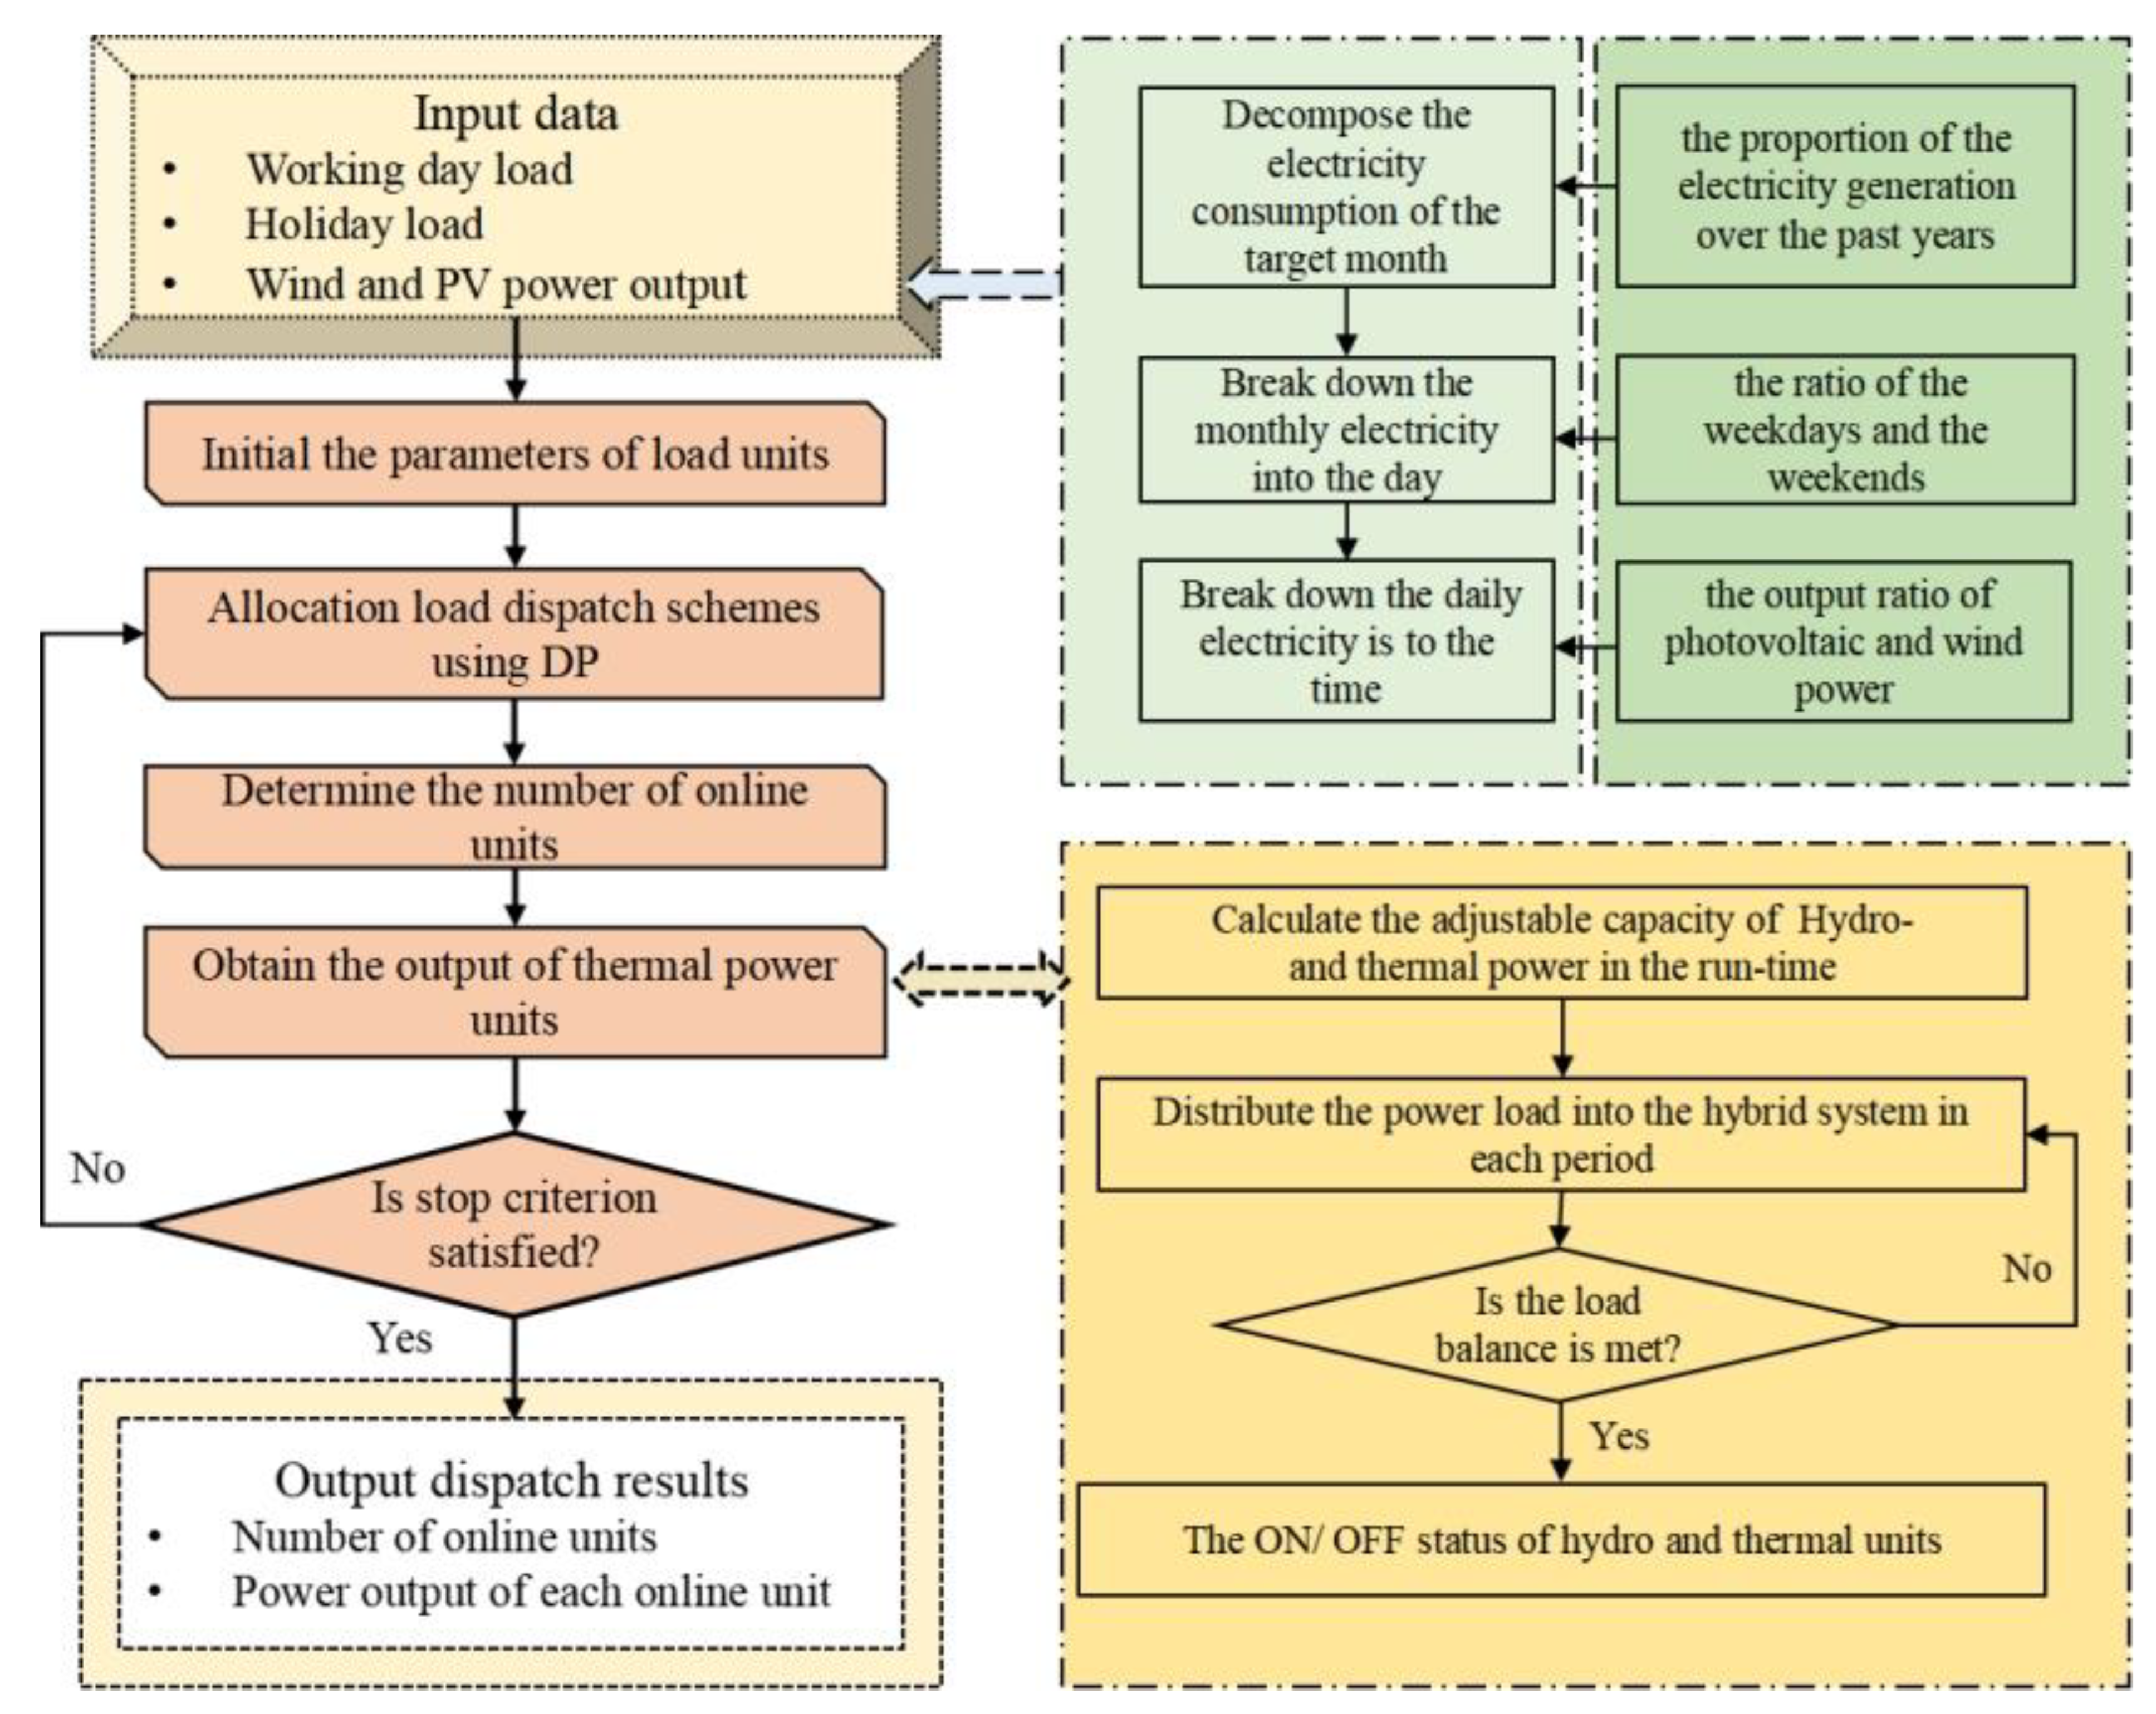
3.1. Basic Framework of the MTCS Model
3.2. Mid-Long-Term Spot Transaction Coordination Scheduling Model
3.2.1. Objective Function
3.2.2. Constraint Condition
- Power balance constraint:where refers to the output power of hydropower unit H at time t; refers to the output power of wind farm K at time t; refers to the output power of photovoltaic farm M at time t; NH represents the whole number of hydropower units; NW represents the total number of wind farms; NP represents the total number of photovoltaic farms; and refers to the power grid at time t Load demand.
- Output limit constraints:where and are the minimum and maximum actual output power of the thermal power unit t and the hydropower unit h, respectively.
- System rotation and standby constraints:where refers to the positive and negative spinning reserve capacity required by the grid load at time t; and refers to the positive and negative spinning reserve capacity required by the wind farm at time t.
- Minimum start–stop time limit:where refers to the continuous online time of thermal power unit i until t − 1; refers to the continuous offline time of thermal power unit i until t − 1; is the minimum start − up time of thermal power unit I; and is the minimum downtime of thermal power unit i.
- Climbing rate constraints:where refers to the lower limit and upper limit of the climbing rate of thermal power unit i.
- Inventory water constraints:where the storage volume of the hydropower station at the t; are the maximum storage volume and minimum storage volume of hydropower station h; is the stock water volume of hydropower station h at the initial time of scheduling; is the inbound flow of the hydropower station h at the moment tc; is the quoted flow of the hydropower station h at the moment tc; and is the discarded water flow of the hydropower station h at the moment tc.where is the water consumption function coefficient of the output of the hydropower station unit and the quoted flow rate of the unit; is the output power of hydropower station h at time t; represents the reservoir head of hydropower station h at time t; and is the unit efficiency of hydropower station h.
3.3. Two-Stage Solution Process
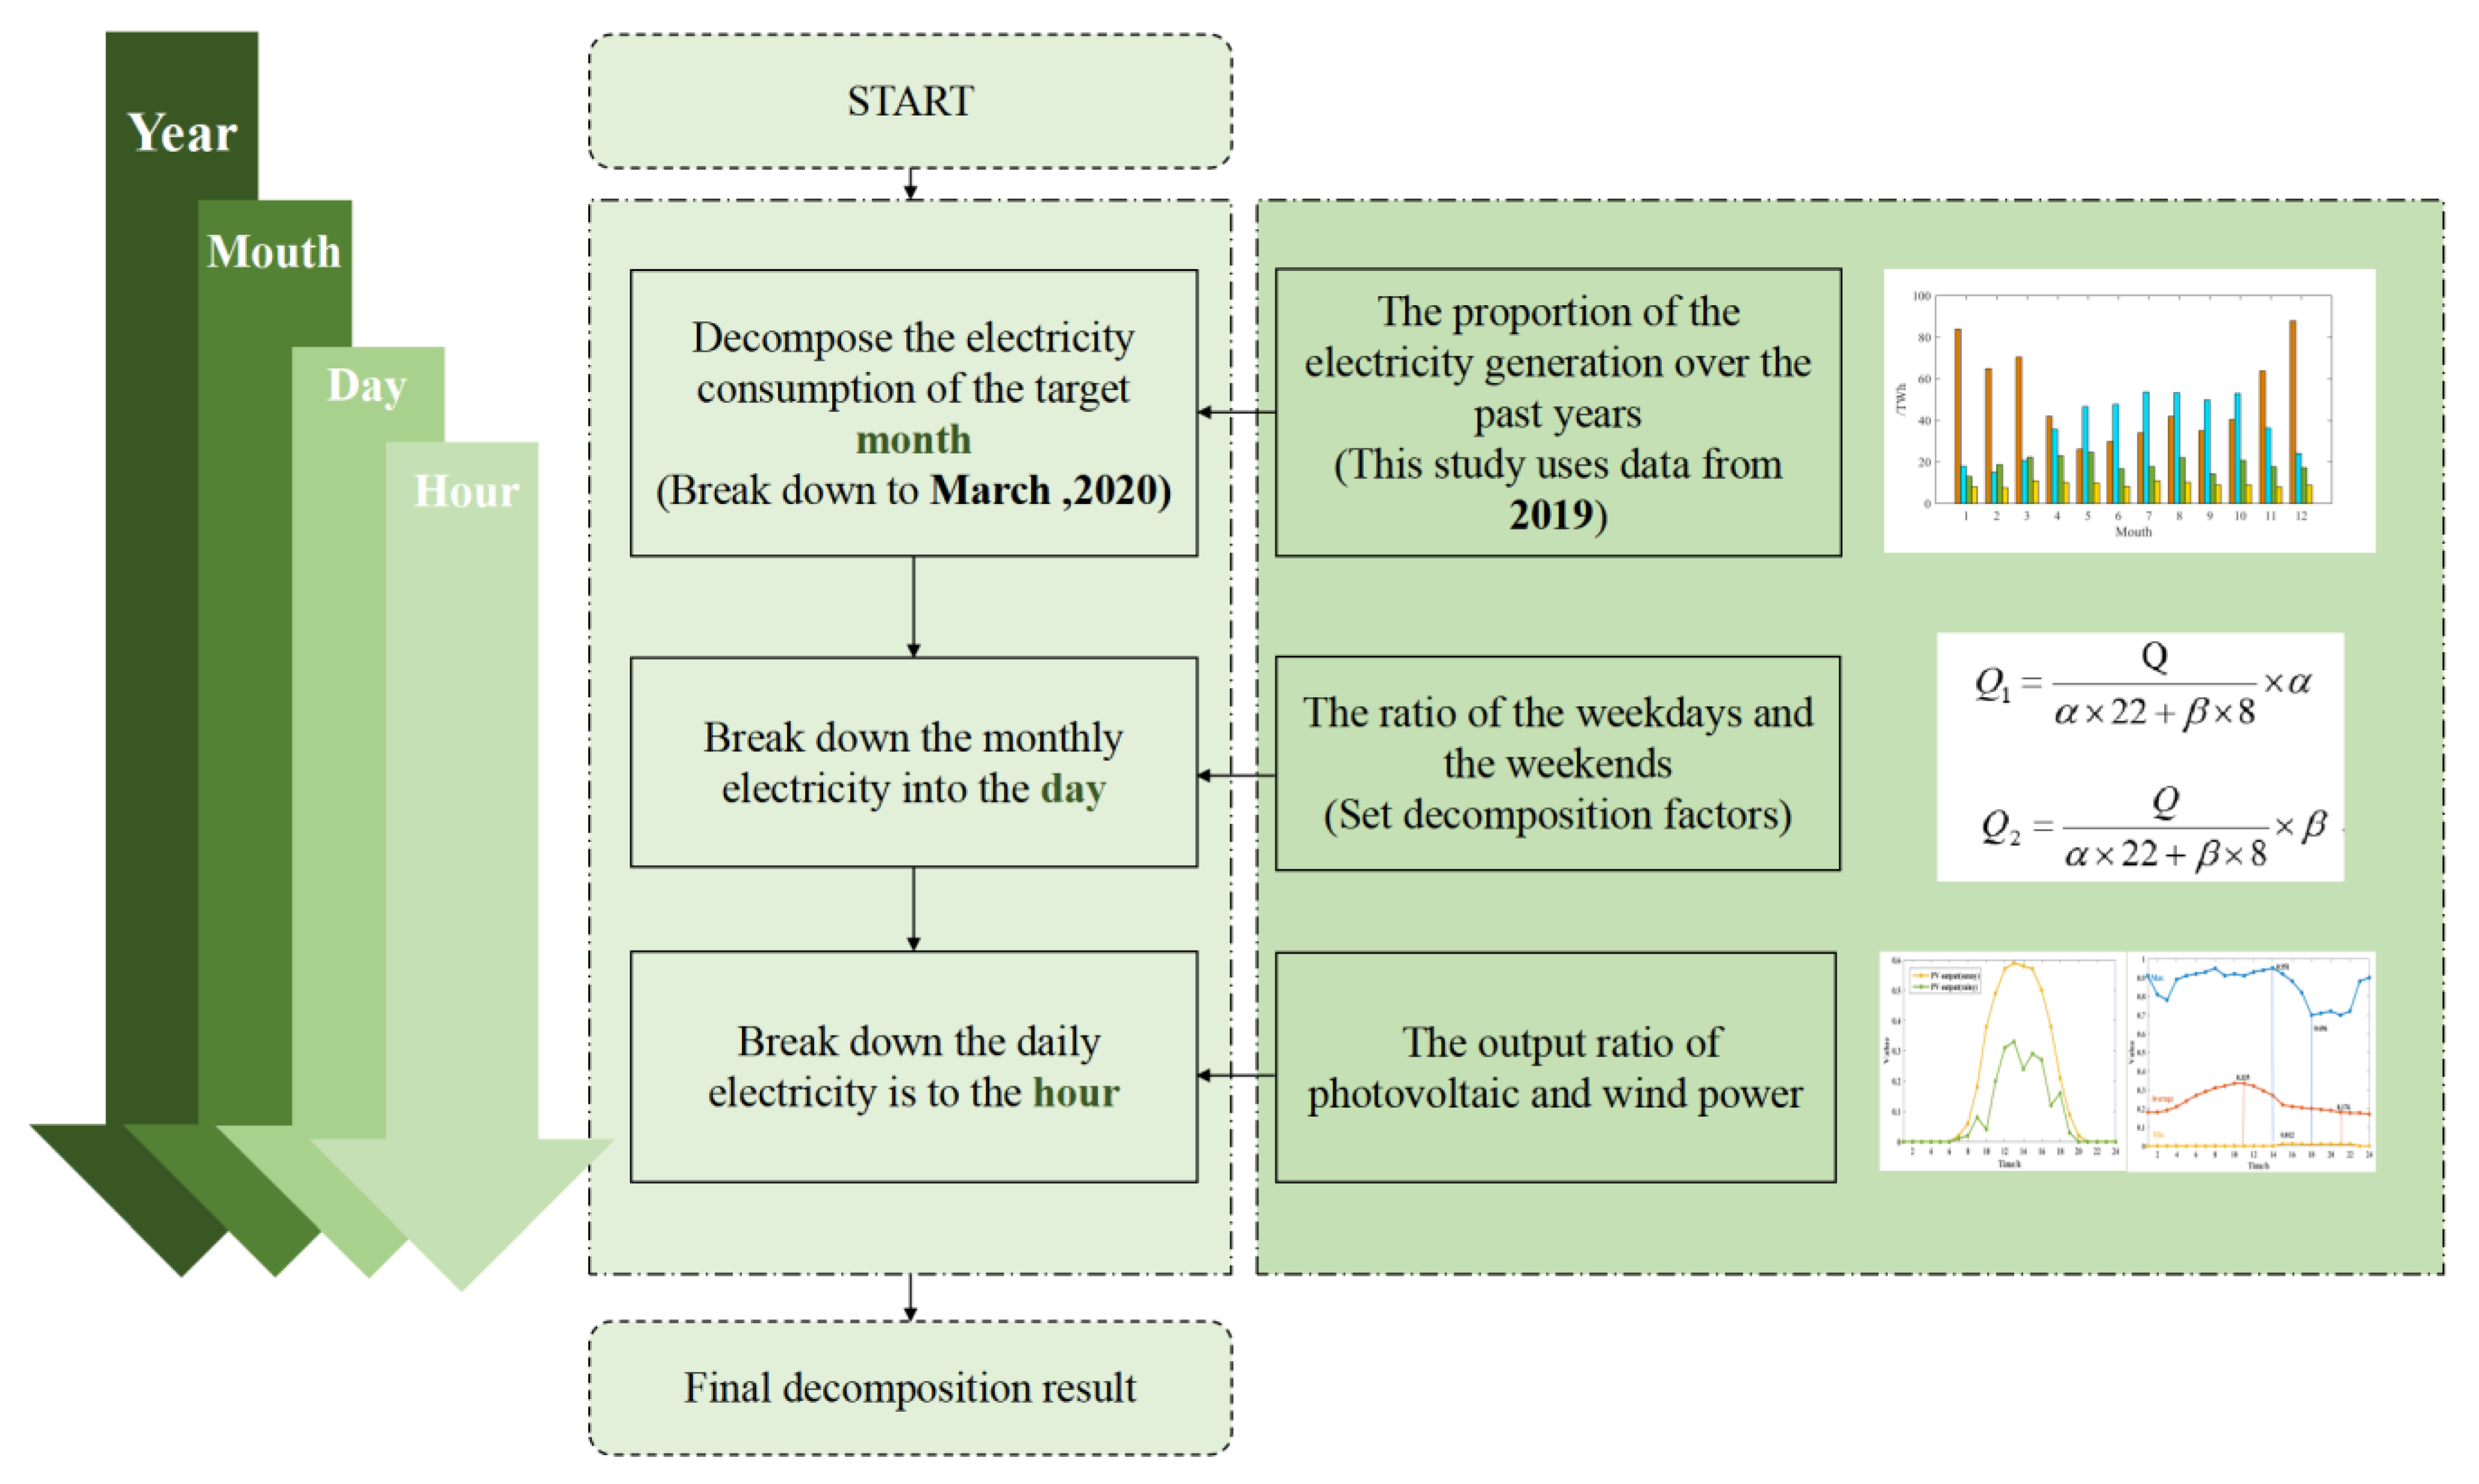
3.3.1. Medium- and Long-Term Contract Electricity Breakdown
3.3.2. Dynamic Programming
- Dividing the stages to decompose the problem into multiple interconnected steps appropriately in order to solve them in a particular order;
- The state, which means the initial natural state or objective condition of each stage, is defined;
- Making the decision, which means different choices that can be made when the process is in a particular state at a specific stage;where k is the stage variable, used to describe the stage variable, and represents the decision variable when the state is in the k-th stage, which is a function of the state variable.
- A strategy is formulated to a set of decisions arranged in order. The state transition equation refers to the evolution process of the decision process from one state to another, generally the evolution of two adjacent states; the index function is a quantitative indicator used to measure the quality of the process achieved.
4. Case Analysis and Main Results
4.1. Energy Type and Unit Parameter Setting
4.2. Electric Quantity Decomposition Result
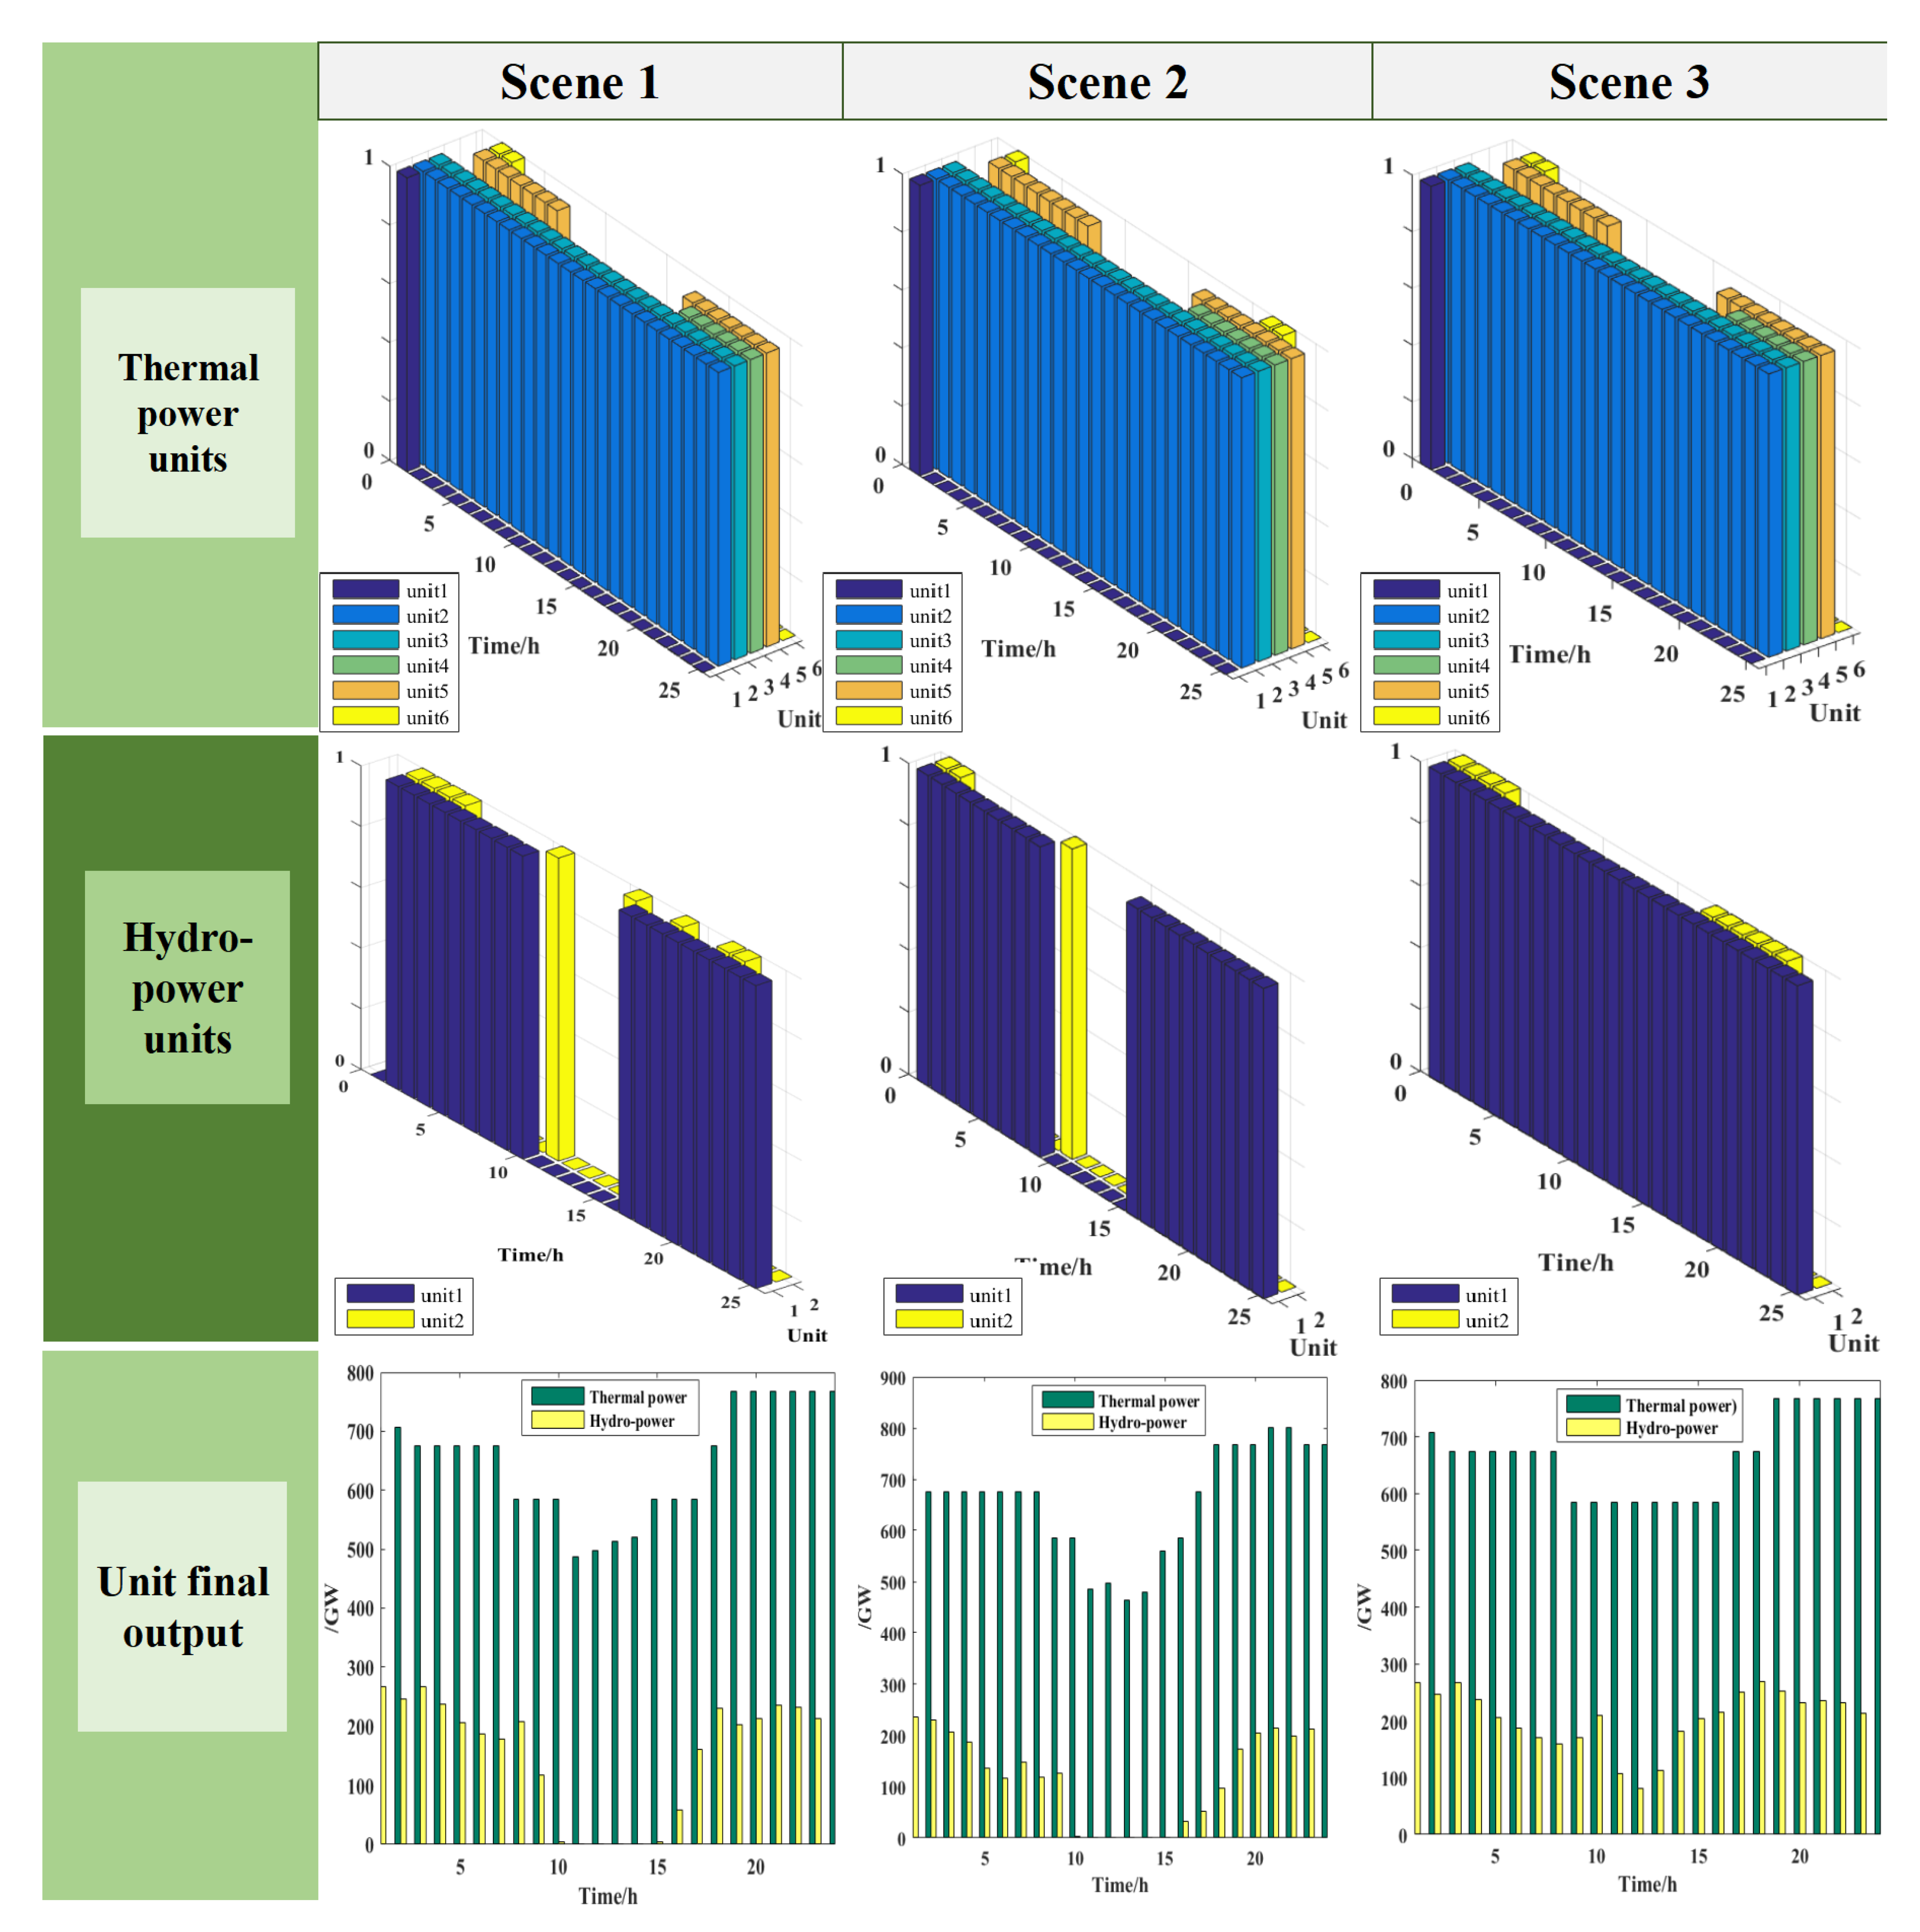
4.3. Scheduling Model Results
5. Discussion
6. Conclusions
Author Contributions
Funding
Institutional Review Board Statement
Informed Consent Statement
Data Availability Statement
Acknowledgments
Conflicts of Interest
References
- Ying, Z.; Zhao, X. The impact of Renewable Portfolio Standards on carbon emission trading under the background of China’s electricity marketization reform. Energy 2021, 226, 120322. [Google Scholar] [CrossRef]
- Hasankhani, A.; Hakimi, S.M. Stochastic energy management of smart microgrid with intermittent renewable energy resources in electricity market. Energy 2021, 219, 119668. [Google Scholar] [CrossRef]
- Wang, S.; Jia, R.; Shi, X.; An, Y.; Huang, Q.; Guo, P.; Luo, C. Hybrid Time-Scale Optimal Scheduling Considering Multi-Energy Complementary Characteristic. IEEE Access 2021, 9, 94087–94098. [Google Scholar] [CrossRef]
- Kühnbach, M.; Bekk, A.; Weidlich, A. Towards improved prosumer participation: Electricity trading in local markets. Energy 2021, 239, 122445. [Google Scholar] [CrossRef]
- Lin, J.; Kahrl, F.; Yuan, J.; Chen, Q.; Liu, X. Economic and carbon emission impacts of electricity market transition in China: A case study of Guangdong Province. Appl. Energy 2019, 238, 1093–1107. [Google Scholar] [CrossRef]
- Bao, M.; Guo, C.; Wu, Z.; Wu, J.; Li, X.; Ding, Y. Review of Electricity Spot Market Reform in China: Current Status and Future Development. In Proceedings of the 2019 IEEE Sustainable Power and Energy Conference (iSPEC), Beijing, China, 21–23 November 2019; pp. 1444–1448. [Google Scholar] [CrossRef]
- Martins, J.; Miles, J. A techno-economic assessment of battery business models in the UK electricity market. Energy Policy 2021, 148, 111938. [Google Scholar] [CrossRef]
- Zarnikau, J.; Tsai, C.; Woo, C. Determinants of the wholesale prices of energy and ancillary services in the U.S. Midcontinent electricity market. Energy 2020, 195, 117051. [Google Scholar] [CrossRef]
- Tanaka, N. Big Bang in Japan’s energy policy. Energy Strat. Rev. 2013, 1, 243–246. [Google Scholar] [CrossRef]
- Zhang, Y.; Xie, S.; Shu, S. Multi-stage robust optimization of a multi-energy coupled system considering multiple uncertainties. Energy 2021, 238, 122041. [Google Scholar] [CrossRef]
- Ma, T.; Pei, W.; Deng, W.; Xiao, H.; Yang, Y.; Tang, C. A Nash bargaining-based cooperative planning and operation method for wind-hydrogen-heat multi-agent energy system. Energy 2021, 239, 122435. [Google Scholar] [CrossRef]
- Zhao, X.; Zheng, W.; Hou, Z.; Chen, H.; Xu, G.; Liu, W.; Chen, H. Economic dispatch of multi-energy system considering seasonal variation based on hybrid operation strategy. Energy 2021, 238, 121733. [Google Scholar] [CrossRef]
- Li, P.; Guo, T.; Abeysekera, M.; Wu, J.; Han, Z.; Wang, Z.; Yin, Y.; Zhou, F. Intraday multi-objective hierarchical coordinated operation of a multi-energy system. Energy 2021, 228, 120528. [Google Scholar] [CrossRef]
- Cai, Z.; Zhang, C.; Hu, X.; Zhang, G.; Lu, Y. Design of Hydropower Dominated Provincial Electricity Spot Markets in China. In Proceedings of the 2020 4th International Conference on Power and Energy Engineering (ICPEE), Xiamen, China, 19–21 November 2020; pp. 206–212. [Google Scholar] [CrossRef]
- Wang, M.; Tan, Z.; Ma, Z.; Zhong, H.; Hu, C.; Luo, Z.; Yang, J. Inter-Provincial Electricity Spot Market Model for China. In Proceedings of the 2020 IEEE/IAS Industrial and Commercial Power System Asia (I&CPS Asia), Weihai, China, 13–15 July 2020; pp. 110–115. [Google Scholar] [CrossRef]
- Mu, C.; Xing, Y.; Zhang, F.; Ma, G.; Chen, Q.; Liu, X.; Yang, D. The coordination mechanism of forward market and spot market under the cost-based electricity market model for Yunnan. In Proceedings of the 2021 6th Asia Conference on Power and Electrical Engineering (ACPEE), Chongqing, China, 8–11 April 2021; pp. 634–639. [Google Scholar] [CrossRef]
- Goudarzi, A.; Swanson, A.G.; Van Coller, J.; Siano, P. Smart real-time scheduling of generating units in an electricity market considering environmental aspects and physical constraints of generators. Appl. Energy 2017, 189, 667–696. [Google Scholar] [CrossRef]
- Bhatia, K.; Mittal, R.; Varanasi, J.; Tripathi, M.M. An ensemble approach for electricity price forecasting in markets with re-newable energy resources. Util. Policy 2021, 70, 101185. [Google Scholar] [CrossRef]
- Sahoo, A.; Hota, P.K. Impact of renewable energy sources on modelling of bidding strategy in a competitive electricity market using improved whale optimization algorithm. IET Renew Power Gener. 2021, 15, 839–853. [Google Scholar] [CrossRef]
- Flammini, M.G.; Prettico, G.; Mazza, A.; Chicco, G. Reducing fossil fuel-based generation: Impact on wholesale electricity market prices in the North-Italy bidding zone. Electr. Power Syst. Res. 2021, 194, 107095. [Google Scholar] [CrossRef]
- Dynge, M.F.; Crespo del Granado, P.; Hashemipour, N.; Korpås, M. Impact of local electricity markets and peer-to-peer trading on low-voltage grid operations. Appl. Energy 2021, 301, 117404. [Google Scholar] [CrossRef]
- Oprea, S.V.; Bâra, A. Ultra-short-term forecasting for photovoltaic power plants and real-time key performance indicators analysis with big data solutions. Two case studies - PV Agigea and PV Giurgiu located in Romania. Comput. Ind. 2020, 120, 103230. [Google Scholar] [CrossRef]
- Zhu, H.; Goh, H.H.; Zhang, D.; Ahmad, T.; Liu, H.; Wang, S.; Li, S.; Liu, T.; Dai, H.; Wu, T. Key technologies for smart energy systems: Recent developments, challenges, and research opportunities in the context of carbon neutrality. J. Clean. Prod. 2022, 331, 129809. [Google Scholar] [CrossRef]
- Huang, S.; Abedinia, O. Investigation in economic analysis of microgrids based on renewable energy uncertainty and demand response in the electricity market. Energy 2021, 225, 120247. [Google Scholar] [CrossRef]
- Zhang, S.; Andrews-Speed, P.; Li, S. To what extent will China’s ongoing electricity market reforms assist the integration of renewable energy? Energy Policy 2018, 114, 165–172. [Google Scholar] [CrossRef]
- Scott, I.J.; Carvalho, P.M.; Botterud, A.; Silva, C.A. Long-term uncertainties in generation expansion planning: Implications for electricity market modelling and policy. Energy 2021, 227, 120371. [Google Scholar] [CrossRef]
- Song, Y.; Liu, T.; Ye, B.; Li, Y. Linking carbon market and electricity market for promoting the grid parity of photovoltaic elec-tricity in China. Energy 2020, 211, 118924. [Google Scholar] [CrossRef]
- Huuki, H.; Karhinen, S.; Kopsakangas-Savolainen, M.; Svento, R. Flexible demand and supply as enablers of variable energy integration. J. Clean. Prod. 2020, 258, 120574. [Google Scholar] [CrossRef]
- Tan, X.; Lin, S.; Liu, Y.-L.; Xie, B.-C. Has the inter-regional transmission grid promoted clean power development? A quantitative assessment on China’s electricity sector. J. Clean. Prod. 2020, 269, 122370. [Google Scholar] [CrossRef]
- Guo, H.; Davidson, M.R.; Chen, Q.; Zhang, D.; Jiang, N.; Xia, Q.; Kang, C.; Zhang, X. Power market reform in China: Motivations, progress, and recommendations. Energy Policy 2020, 145, 111717. [Google Scholar] [CrossRef]
- Djørup, S.; Thellufsen, J.Z.; Sorknæs, P. The electricity market in a renewable energy system. Energy 2018, 162, 148–157. [Google Scholar] [CrossRef]
- Cirés, E.; Marcos, J.; de la Parra, I.; García, M.; Marroyo, L. The potential of forecasting in reducing the LCOE in PV plants under ramp-rate restrictions. Energy 2019, 188, 116053. [Google Scholar] [CrossRef]
- Shi, X.; Lei, X.; Huang, Q.; Huang, S.; Ren, K.; Hu, Y. Hourly Day-Ahead Wind Power Prediction Using the Hybrid Model of Variational Model Decomposition and Long Short-Term Memory. Energies 2018, 11, 3227. [Google Scholar] [CrossRef]
- Huang, H.; Jia, R.; Shi, X.; Liang, J.; Dang, J. Feature selection and hyper parameters optimization for short-term wind power forecast. Appl. Intell. 2021, 51, 6752–6770. [Google Scholar] [CrossRef]
- Liu, S.; Xie, M. Modeling the daily generation schedules in under-developed electricity markets with high-share renewables: A case study of Yunnan in China. Energy 2020, 201, 117677. [Google Scholar] [CrossRef]
- Zhang, D.; Zhu, H.; Zhang, H.; Goh, H.H.; Liu, H.; Wu, T. Multi-Objective Optimization for Smart Integrated Energy System Considering Demand Responses and Dynamic Prices. IEEE Trans. Smart Grid 2021, 13, 1100–1112. [Google Scholar] [CrossRef]
- Zhang, D.; Liu, T. A Multi-Step Modeling and Optimal Operation Calculation Method for Large-Scale Energy Hub Model Considering Two Types Demand Responses. IEEE Trans. Smart Grid 2019, 10, 6735–6746. [Google Scholar] [CrossRef]
- Mankowski, M.; Moshkov, M. Dynamic programming bi-criteria combinatorial optimization. Discret. Appl. Math. 2020, 284, 513–533. [Google Scholar] [CrossRef]
- Materi, S.; D’Angola, A.; Renna, P. A dynamic decision model for energy-efficient scheduling of manufacturing system with renewable energy supply. J. Clean. Prod. 2020, 270, 122028. [Google Scholar] [CrossRef]


| Functions | Description |
|---|---|
| Start-up cost of thermal power unit I. | |
| Total number of thermal power units | |
| T | Total scheduling time |
| The output power of thermal power unit i at time t. [MW] | |
| The load demand at time t. [MW] | |
| The actual output power of thermal power unit T. [MW] | |
| The actual output power of hydropower unit H. [MW] | |
| The positive and negative spinning reserve capacity required by the grid load at time t. [MW] | |
| The positive and negative spinning reserve capacity required by the wind farm at time t. [MW] | |
| The lower limit and upper limit of the climbing rate of thermal power unit i. [MW/h] | |
| The storage volume of hydropower station h at time t. [103 m3] | |
| The water consumption function coefficient of the output of the hydropower station unit and the quoted flow rate of the unit. | |
| The output power of hydropower station h at time t. | |
| The reservoir head of hydropower station h at time t. |
| Unit | T1 | T2 | T3 | T4 | T5 | T6 | H1 | H2 |
|---|---|---|---|---|---|---|---|---|
| 250 | 250 | 110 | 110 | 100 | 100 | 0 | 0 | |
| 600 | 600 | 330 | 330 | 300 | 300 | 225 | 30.4 |
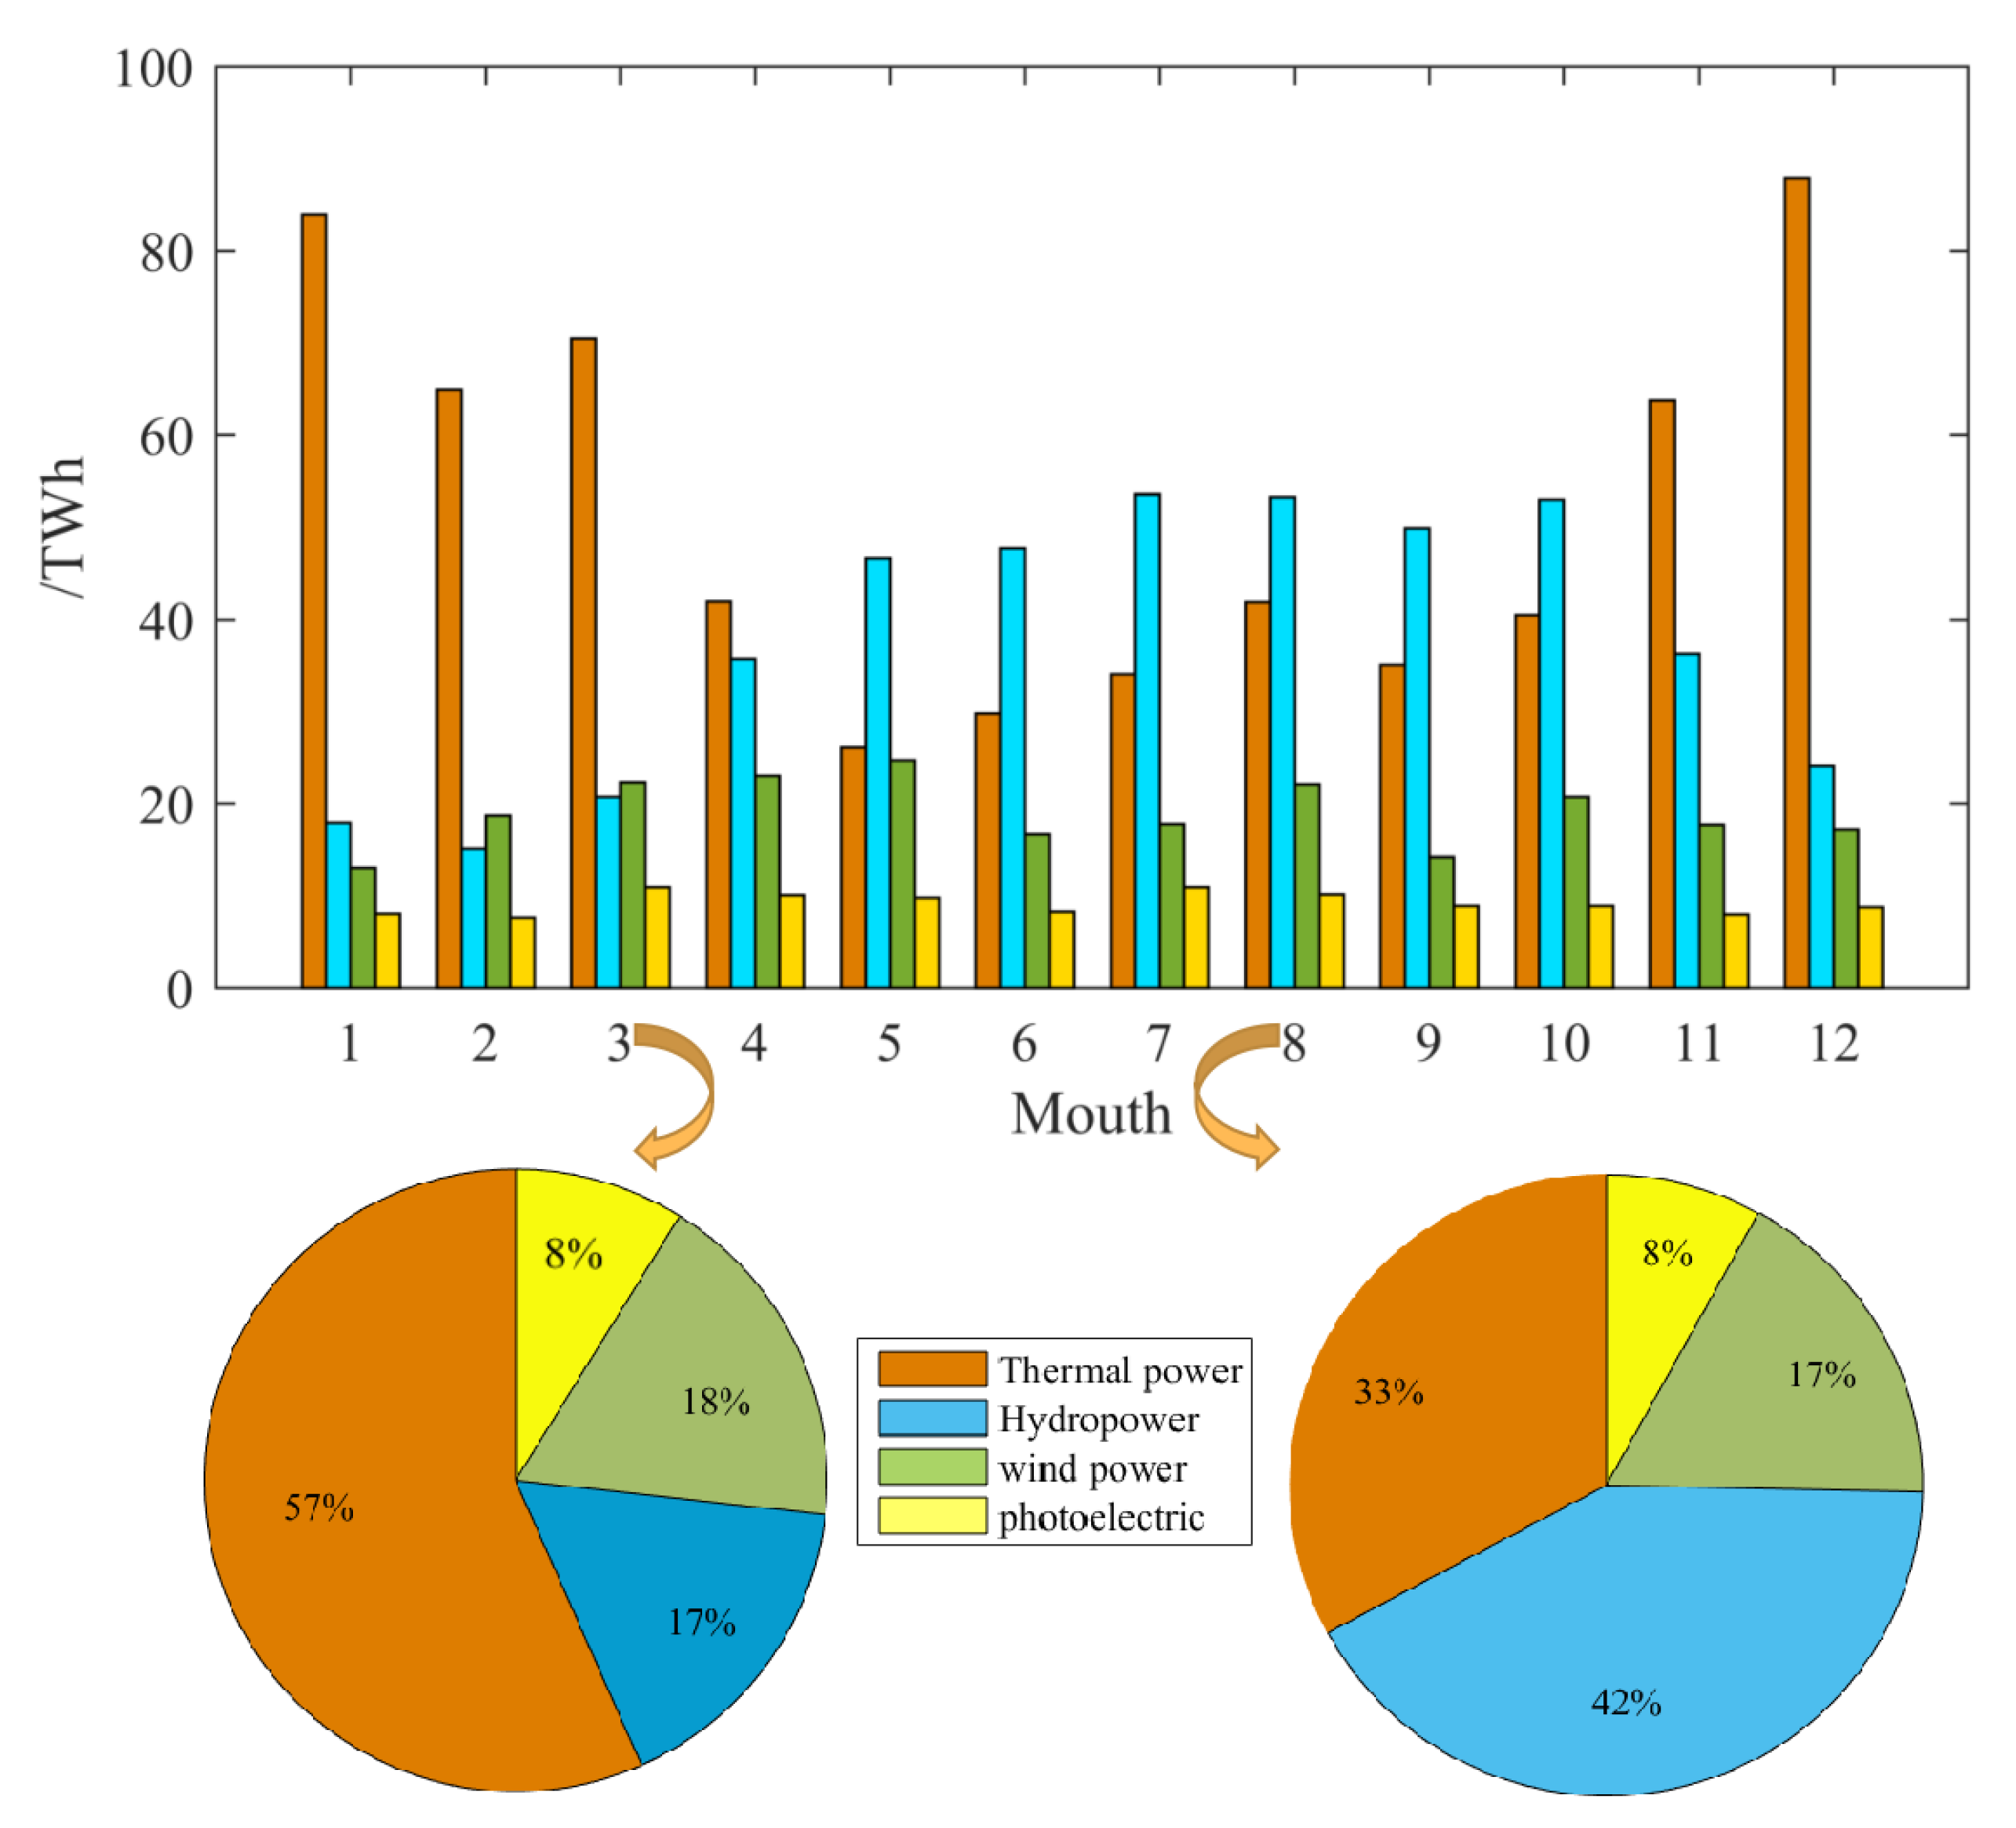
| Type of Power Supply | Should Generate Electricity | Proportion |
|---|---|---|
| Thermal power | 58.65 | 56.62% |
| Hydropower | 17.22 | 16.63% |
| Wind power | 18.56 | 17.91% |
| Photoelectric | 9.16 | 8.84% |
| Type of Power Supply | Workdays Power Generation | Weekends Power Generation |
|---|---|---|
| Thermal power | 2.03 | 1.73 |
| Hydropower | 0.61 | 0.52 |
| Wind Power | 0.64 | 0.55 |
| Photoelectric | 0.32 | 0.27 |
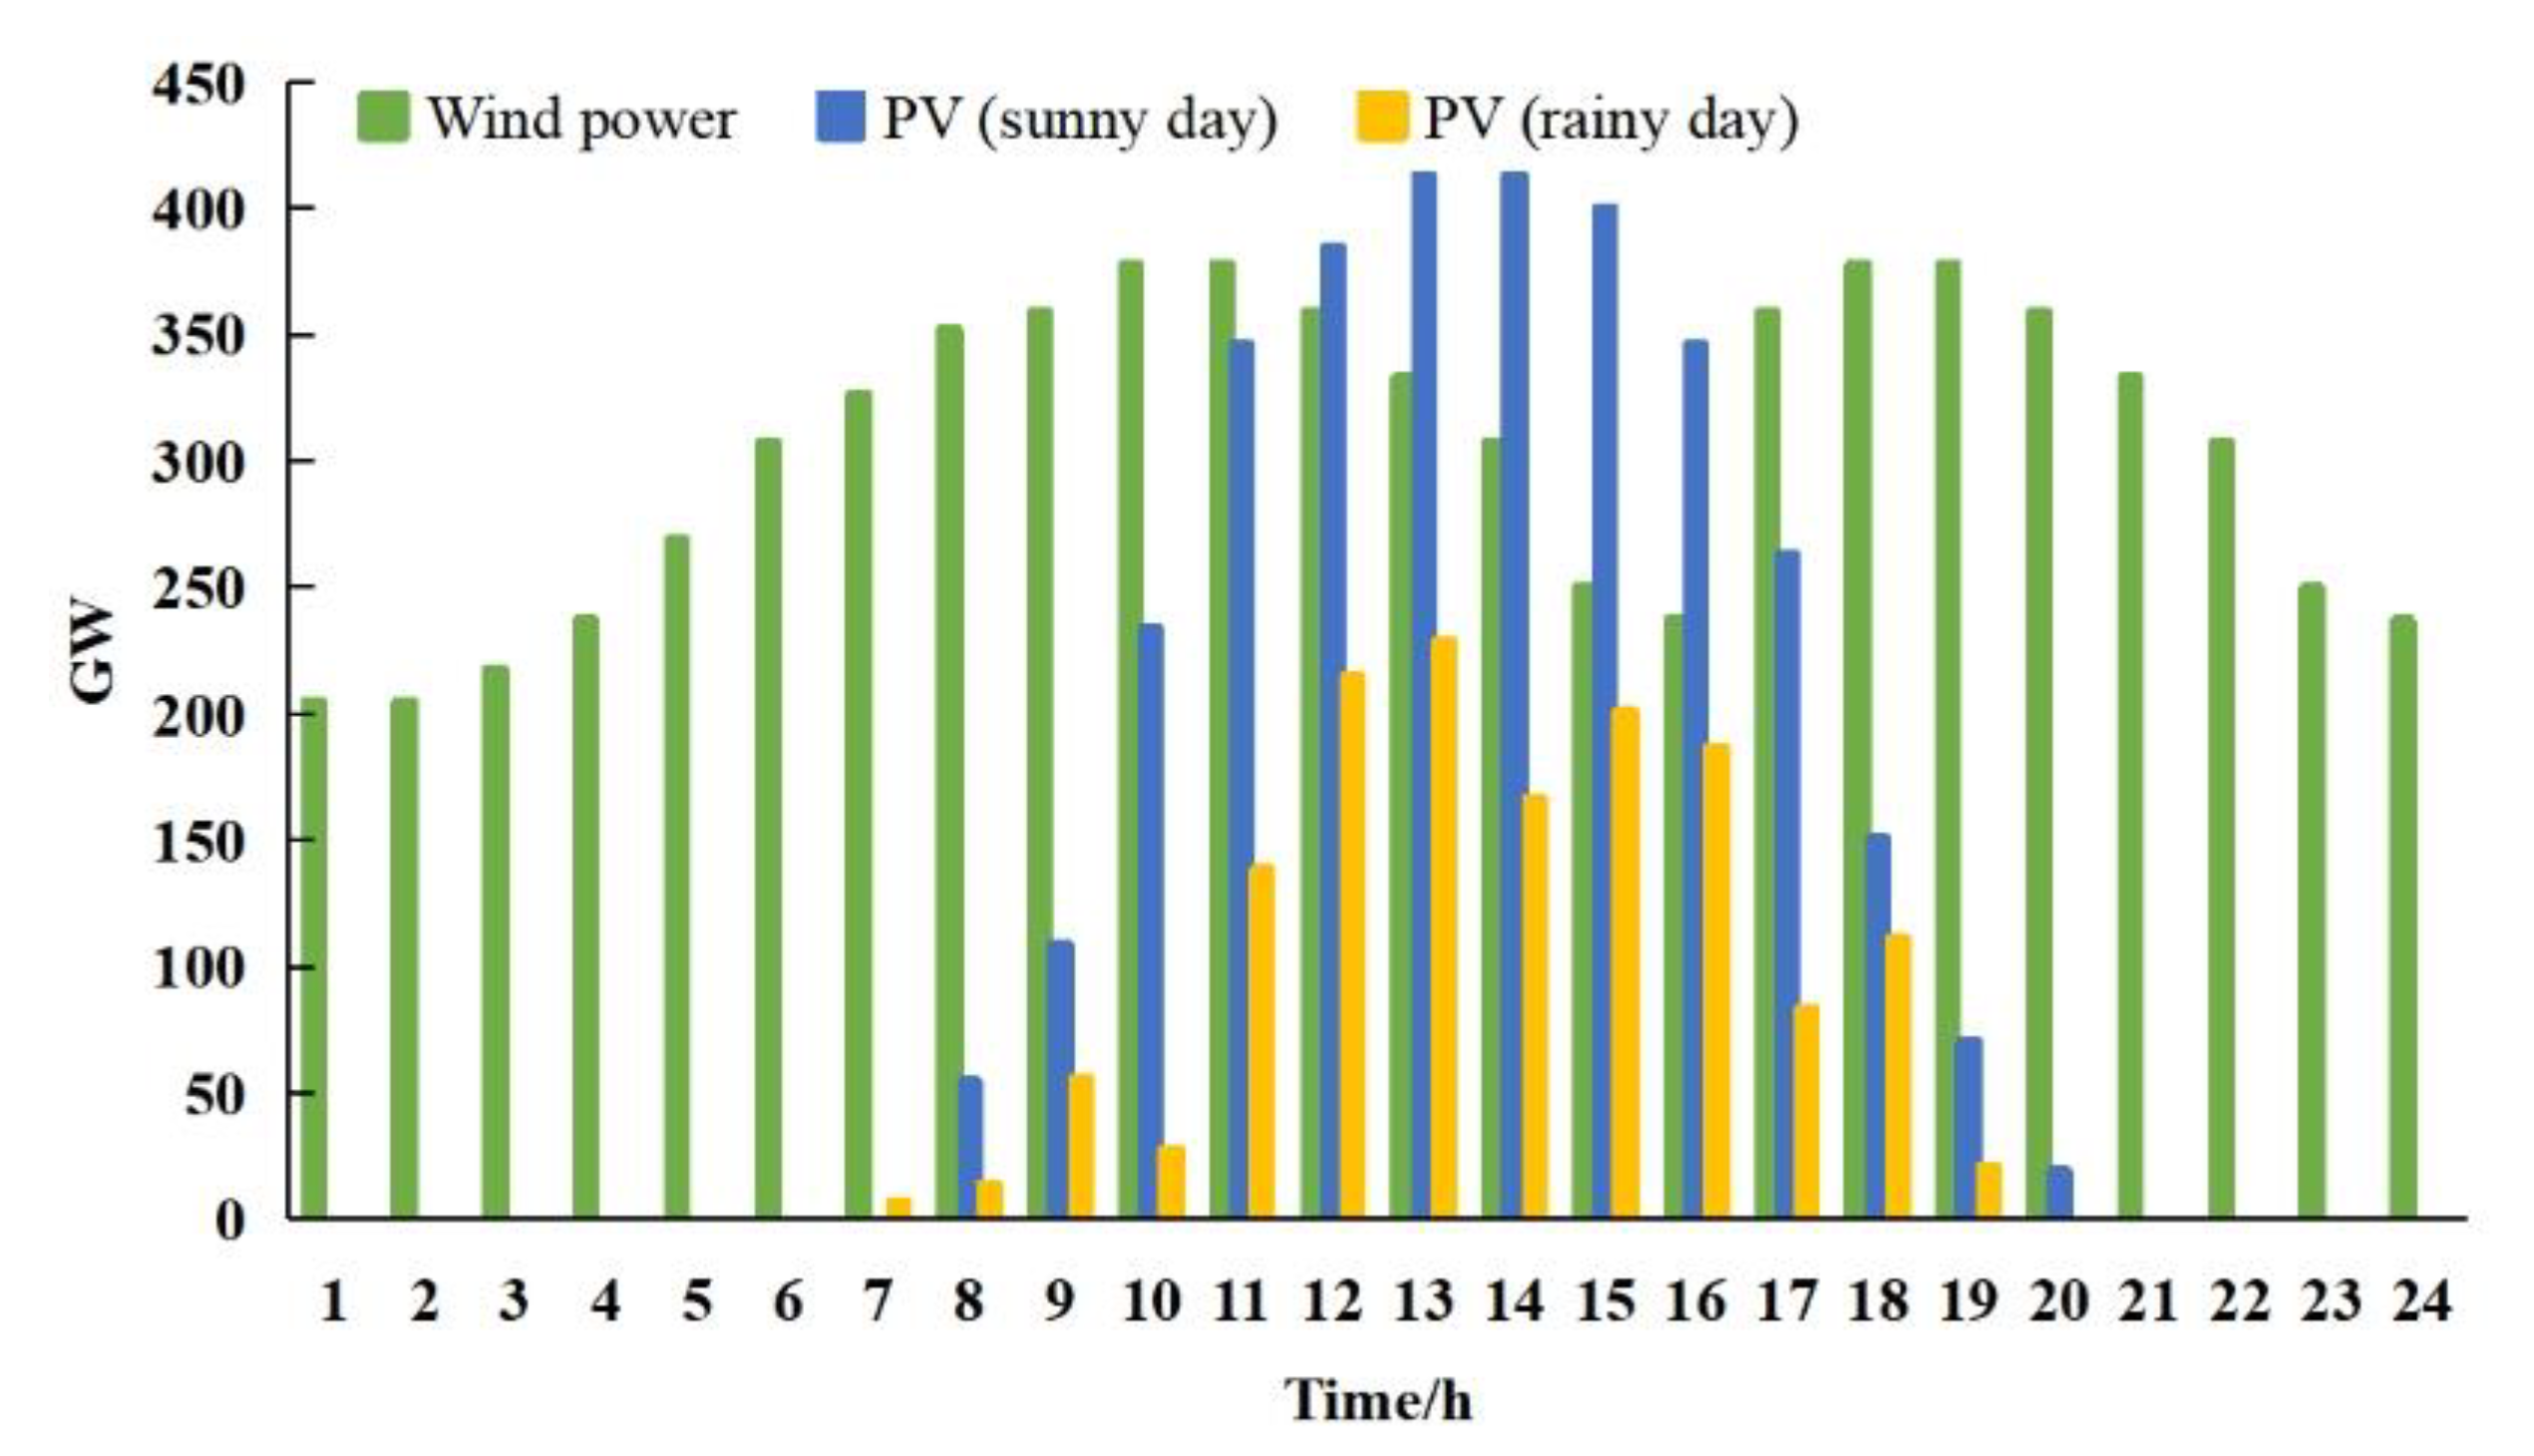
| Period | Wind Power | PV Power | |
|---|---|---|---|
| Sunny | Rainy | ||
| 1 | 204.8 | 0 | 0 |
| 2 | 204.8 | 0 | 0 |
| 3 | 217.6 | 0 | 0 |
| 4 | 236.8 | 0 | 0 |
| 5 | 268.8 | 0 | 0 |
| 6 | 307.2 | 0 | 0 |
| 7 | 326.4 | 0 | 6.98 |
| 8 | 352 | 54.4 | 13.8 |
| 9 | 358.4 | 108.8 | 55.4 |
| 10 | 377.6 | 233.6 | 27.6 |
| 11 | 377.6 | 345.6 | 138.4 |
| 12 | 358.4 | 384 | 214.6 |
| 13 | 332.8 | 412.8 | 228.4 |
| 14 | 307.2 | 412.8 | 166.2 |
| 15 | 249.6 | 400 | 200.8 |
| 16 | 236.8 | 345.6 | 186.9 |
| 17 | 230.4 | 262.8 | 83.1 |
| 18 | 224 | 150.4 | 110.8 |
| 19 | 217.6 | 70.4 | 20.8 |
| 20 | 217.6 | 19.2 | 0 |
| 21 | 204.8 | 0 | 0 |
| 22 | 198.4 | 0 | 0 |
| 23 | 198.4 | 0 | 0 |
| 24 | 192 | 0 | 0 |
| Start–Stop Costs/RMB | Running Costs/RMB | Total Cost/RMB | |
|---|---|---|---|
| Scene 1 | 2830 | 229,893 | 232,723 |
| Scene 2 | 2860 | 224,536 | 227,396 |
| Scene 3 | 2830 | 248,578 | 251,408 |
Publisher’s Note: MDPI stays neutral with regard to jurisdictional claims in published maps and institutional affiliations. |
© 2022 by the authors. Licensee MDPI, Basel, Switzerland. This article is an open access article distributed under the terms and conditions of the Creative Commons Attribution (CC BY) license (https://creativecommons.org/licenses/by/4.0/).
Share and Cite
Wang, K.; Wang, X.; Jia, R.; Dang, J.; Liang, Y.; Du, H. Research on Coupled Cooperative Operation of Medium- and Long-Term and Spot Electricity Transaction for Multi-Energy System: A Case Study in China. Sustainability 2022, 14, 10473. https://doi.org/10.3390/su141710473
Wang K, Wang X, Jia R, Dang J, Liang Y, Du H. Research on Coupled Cooperative Operation of Medium- and Long-Term and Spot Electricity Transaction for Multi-Energy System: A Case Study in China. Sustainability. 2022; 14(17):10473. https://doi.org/10.3390/su141710473
Chicago/Turabian StyleWang, Kaiyan, Xueyan Wang, Rong Jia, Jian Dang, Yan Liang, and Haodong Du. 2022. "Research on Coupled Cooperative Operation of Medium- and Long-Term and Spot Electricity Transaction for Multi-Energy System: A Case Study in China" Sustainability 14, no. 17: 10473. https://doi.org/10.3390/su141710473
APA StyleWang, K., Wang, X., Jia, R., Dang, J., Liang, Y., & Du, H. (2022). Research on Coupled Cooperative Operation of Medium- and Long-Term and Spot Electricity Transaction for Multi-Energy System: A Case Study in China. Sustainability, 14(17), 10473. https://doi.org/10.3390/su141710473