Abstract
Building resilient cities is the foundation and guarantee for the Chengdu-Chongqing economic circle to achieve high-quality and sustainable development. This research uses the entropy TOPSIS method to evaluate the urban resilience level of the Chengdu-Chongqing Economic Circle and uses the Fuzzy Set Qualitative Comparative Analysis (fsQCA) approach to analyze the configuration of contributing factors. Research indicates that the overall urban resilience level is relatively low, with more than 70% of the areas being less than 0.3. Overall, Chengdu (Level 1) and Chongqing central districts (Level 2) are 1–3 levels higher than their surrounding areas, which indicates insufficient spatial balance. The consistency scores of the single-antecedent condition necessity analyses were all less than 0.9, and the consistencies of all configuration analysis results were all greater than 0.8. This research proves that the creation of urban resilience is the result of a combination of factors, rather than the independent influence from any individual factor. Financial and innovation forces are the key driving factors that affect the level of urban resilience. The multiple driving model also helps to improve the level of resilience. The lack of cultural and innovation forces in Chongqing area has been proven to inhibit the level of urban resilience, and the lack of openness and political focus has resulted in a low level of resilience in the Sichuan area. We propose to promote the construction of a “dual core”, to create synergies between Chongqing and Chengdu, and to achieve balanced and integrated development in the entire region. We focus on the key factors affecting the resilience level of the Chengdu-Chongqing economic circle. In the future, we suggest further opening the market and implementing a developing strategy that is driven by economy and innovation. Regarding the construction of the Sichuan and the Chongqing areas, we encourage the two regions to adjust policies based on local conditions. First, the administration should solve the driving force deficiencies for development, then adopt differentiation strategies for regional development.
1. Introduction
On 20 October 2021, the Central Committee of the Communist Party of China and the State Council issued the “Outline of the Construction Plan for the Chengdu-Chongqing Economic Circle “. This outline is to build the “fourth pole” to support national economic growth and to provide a strong power source for high-quality development in western China. The construction of the Chengdu-Chongqing Economic Circle has been escalated to a national strategy that aims to turn the Chengdu-Chongqing area into an economic circle with its strengths, and form a distinctive, reasonable layout, and an efficient urban agglomeration development pattern [1]. Therefore, the scale of cities has expanded rapidly, and the functions of cities and urban agglomerations have become more complex than before. Coupled with the combined impacts of rising temperatures, world changes and the COVID-19 pandemic, the economic, social, ecological, infrastructure and cultural construction of the Chengdu-Chongqing economic circle are potentially threatened [2]. Therefore, it is of great significance for cities and urban agglomerations to take measures to mitigate disturbances, and prevent and resolve urban risks.
Urban resilience refers to the capacity of cities to endure risks, reduce losses, and judiciously allocate resources in order to quickly recover, rebuild, and expand in the wake of predictable or unforeseen hazards, catastrophic shocks, and disturbances [3,4]. Resilience is a feature that helps cities respond and ensure their functioning and sustainable development [5]. China attaches great importance to the construction of resilient cities, as evidenced by the “14th Five-Year Plan (2021–2025) for National Economic and Social Development and the Long-Range Objective Through the Year 2035”. The Chengdu-Chongqing economic circle needs to cultivate sustainable and resilient cities. First of all, we attach great importance to improving the resilience level of each city. On the other hand, it is necessary to plan and deploy from the perspective of urban agglomerations to enhance the overall effect of urban agglomeration resilience. Under the social background of frequent global disasters and urbanization developments, the resilience construction of the Chengdu-Chongqing economic circle must rely on the construction of cities and urban agglomerations at the same time.
Improving the level of urban resilience requires to understand a series of basic issues of urban resilience, such as conceptual evolution, evaluation framework, research methods, and influencing factors. Resilience comes from the Latin word resilire; meaning to spring back [6]. The cognition of resilience has gone through three stages, namely engineering resilience, ecological resilience, and evolutionary resilience. Engineering resilience regards resilience as the ability to return to its original state after being subjected to external forces, which is the restoration of the initial homeostasis [7]. Ecological resilience was first proposed by Canadian ecologist Holling [8]. He emphasizes resilience as the ability of an ecosystem to absorb change, sustain and restore equilibrium [9], thereby shaping a new homeostasis. In the 1990s, the concept of evolutionary resilience emerged, which considered resilience as a dynamic system property with adaptability, learning ability and innovation [5]. Evolutionary resilience is the ability of complex social-ecological systems to adapt and change in response to stress and constraints [10]. Under the framework of evolutionary resilience, the urban resilience assessment system has attracted the attention of many scholars and has become one of the most important contents of urban resilience research. For example, CUTTER constructs a total of 49 indicators in six dimensions including social, economic, institutional, infrastructure, ecological and social functions to explore the improvement effect and spatial pattern distribution of urban resilience in the United States [11]. Jha believes that urban resilience should be decomposed into infrastructure, economic, social, and institutional dimensions [12]. Joerin finds that urban spatial planning in developing countries less reflects the attitudes of the community public [13]. He defines community resilience by dividing it into 125 variables in five dimensions: infrastructure, society, economy, institutions and nature [13]. Liu measured the resilience system of 288 cities in China by constructing the City Resilience Development Index (CRDI) framework from five thematic layers: cultural, economic, social, environmental, and image [14]. Paulo considers urban resilience as a complex system consisting of natural, economic, social, physical, and institutional components of cities [15]. Shi et al. constructs a system of indicators covering economic, social, and engineering dimensions to evaluate the resilience of urban networks [16]. Zheng, Yan, et al. constructs an urban resilience index system in four dimensions: economic, social, ecological and infrastructural [17]. Zhu and Sun measure the urban resilience in the three major urban agglomerations in China with 25 indicators from four dimensions of ecology, economy, society and engineering with 25 indicators [18]. Liu et al. analyze four levels of economic resilience, social resilience, ecological resilience, and infrastructural resilience on the spatial pattern of urban resilience and its influencing factors in Henan Province of China [19]. It can be concluded from the above literature that there is no fully unified resilience assessment system currently. Social resilience and economic resilience are the dimensions that scholars prefer to choose, which reflects the unity of constructing evaluation frameworks. However, the selection of other dimensions and indicators is based on the location, resources, and development stages of the research objects. Scholars tend to adopt the method of classification and evaluation, thus showing obvious differentiated characteristics [20]. It is precise because the urban resilience’s background conditions, and the disturbances and shocks it faces are different, and the regular relationships among the main variables that affect or determine the level of urban resilience are also different. At present, scholars mainly focus on the influence of administrative power, openness, innovation, etc. [19], and rarely involve the influence of culture. The established literature mainly uses the spatial panel econometric model and panel regression analysis to study the factors influencing urban resilience, staying on the mono- or binary analysis of causality [18]. The existing literature mainly analyzes the driving effect of a single variable on urban resilience, emphasizing the independent net effect of each variable [21]. A city is a giant system closely linked by multiple elements and systems such as space, industry, population, environment and culture. The various elements and systems in the city are interdependent, and influence and interact with each other. The prosperity or decline of cities and urban agglomerations are the results of a combination of factors, rather than the independent effects of an individual factor. Therefore, we cannot just stop at the analysis of a single influencing factor. Instead, we should start from an overall perspective innovatively. This paper adopts a holistic and configurational approach to explain the impact and mechanism of influencing factors and their combinations on urban resilience and the overall resilience of urban agglomerations.
Building resilient cities and improving the resilience level of urban agglomeration are an important part of the Chengdu-Chongqing economic circle to achieve high-quality development. We need to measure and evaluate the resilience levels of cities in the domain and analyze the key influencing factors and combinations. In comparison with other urban resilience studies, our contribution is to propose a new urban resilience framework for measuring the level of urban resilience. We add cultural dimension on the basis of general research, which is under the fully considerations the strategic position, resource conditions, historical origin, cultural heritage and characteristics of urban construction of the Chengdu-Chongqing economic circle. There are differences between the overall construction of the Chengdu-Chongqing economic circle and the construction of single city, and the key elements suitable for the overall development may not be suitable for the development of each city. Therefore, we innovatively adopt the qualitative comparative analysis method of fuzzy sets to analyze the nonlinear interaction from various variables, and accurately reflect the key factors affecting the improvement of urban resilience through the configuration effect. Our contribution lies in the analysis of urban agglomerations, regions and intra-regional cities. We try our best to avoid the contradiction between urban agglomeration construction and intra-regional city construction and find the best way to improve the resilience for both.
In summary, firstly, we use the entropy-weighted-TOPSIS comprehensive evaluation method (Technique for Order Preference by Similarity to Ideal Solution) to measure the urban resilience level of 44 cities in the Chengdu-Chongqing economic circle in five dimensions: economic, social, ecological, infrastructure and cultural. Secondly, we employ the urban resilience level as the outcome variable; political, market, financial, openness, innovation and cultural forces as the condition variables. We also utilize the fuzzy-set Qualitative Comparative Analysis (fsQCA) to find out the relationship between the factor configurations and the outcome, and to investigate the factors that generate high (or low) urban resilience level. (or low) levels of urban resilience. At last, under the guidance of the core driving force, we propose an optimum path for the urban development overall, regional and intra-regional levels, which can synergistically promote the improvement of the overall resilience level of cities and urban agglomerations. In future, achieve high-quality and sustainable development of the Chengdu-Chongqing economic circle.
2. Materials and Methods
2.1. Frameworks and Variables for Urban Resilience
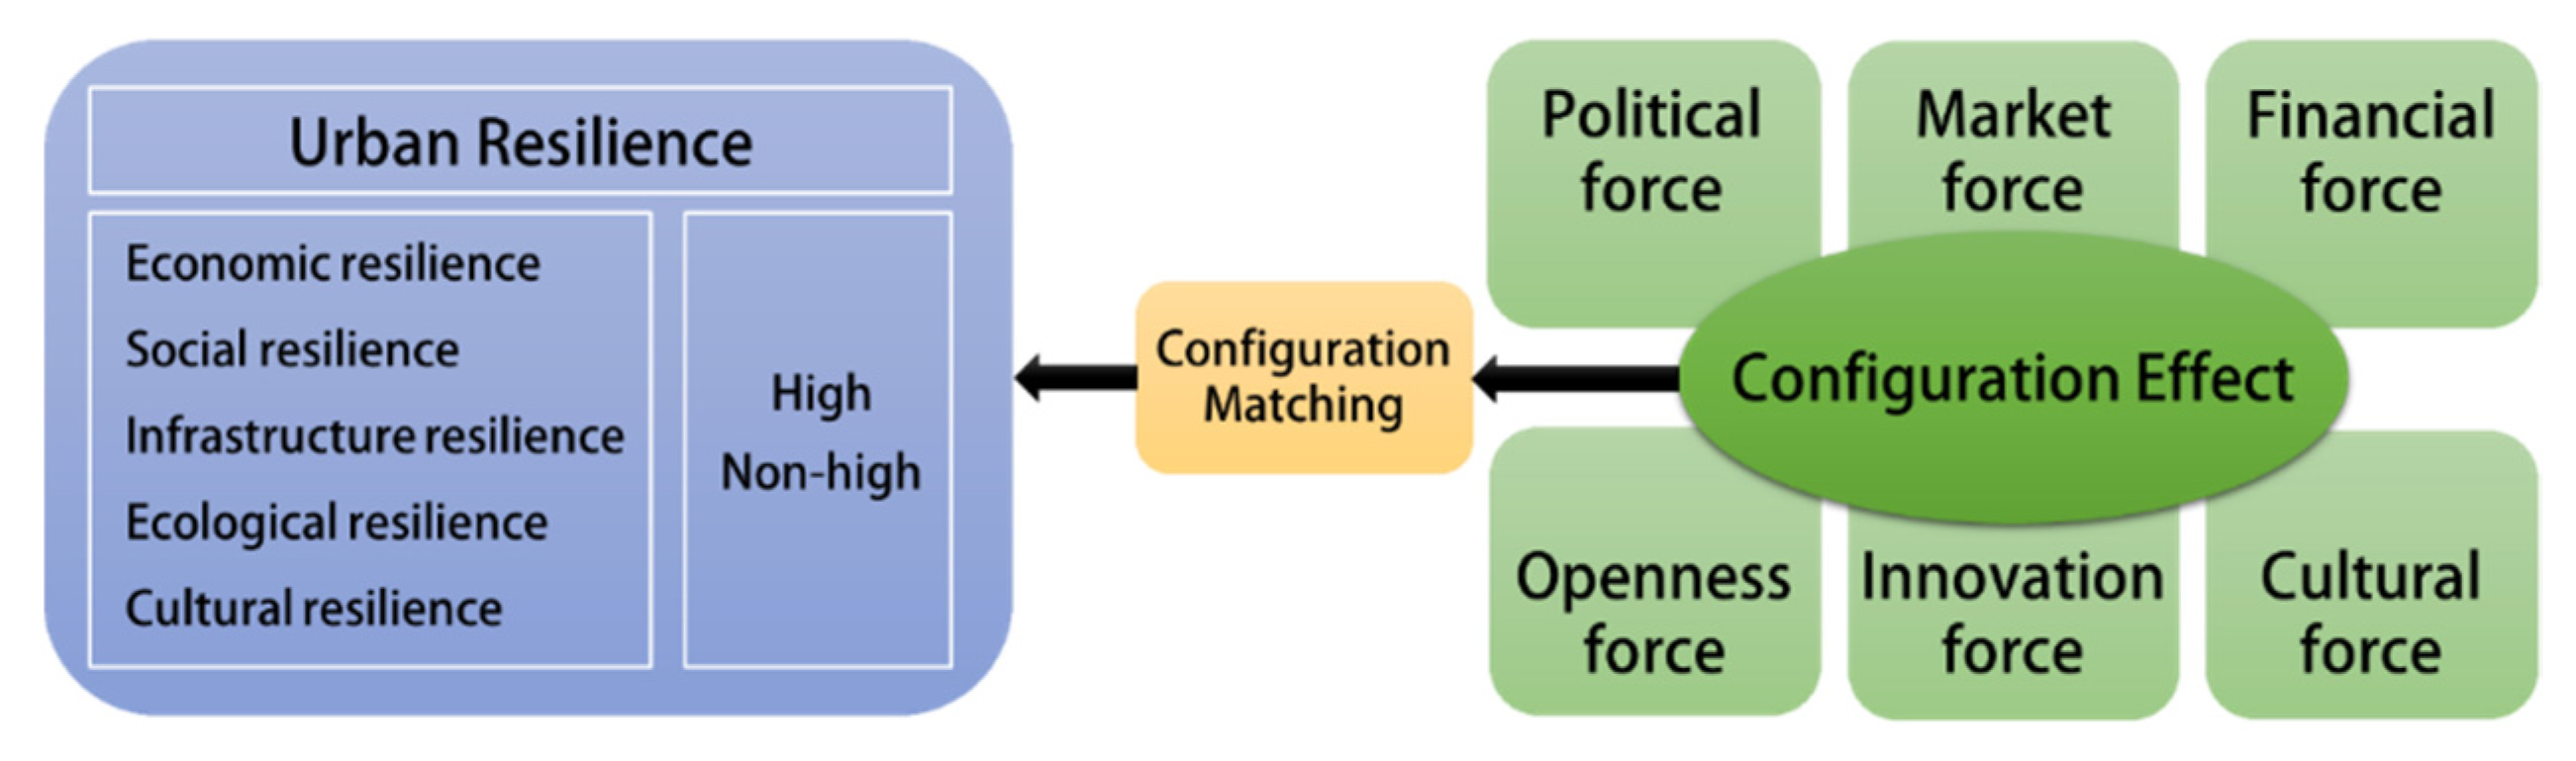
This paper draws on the assessment framework of the existing literature [14,15,22], takes China’s construction plan for the Chengdu-Chongqing economic circle as the central idea, and confirms that the further development of the Chengdu-Chongqing region requires assistance from the economy and technology aspects. Meanwhile, we also indicate people’s increasing demand for high-quality of lifestyles and urban functions. Based on the current conditions of the Chengdu-Chongqing economic circle, we have conducted an in-depth analysis of the factors such as location, resources, ecology and population. We finally developed a city resilience evaluation system with economic, social, ecological, infrastructure and cultural resilience as the main dimensions. At the same time, we use political force, market force, financial force, openness force, innovation force and cultural force as the conditional variables of the configuration analysis framework (Figure 1).
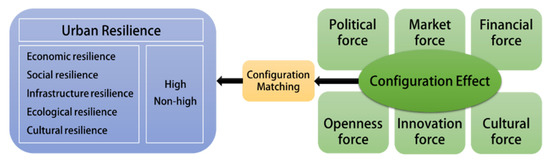
Figure 1.
Urban resilience evaluation and configuration analysis framework.
Cities and urban agglomerations are environmental-economic-social mega systems that integrate and share space, functions, industries, management, and services. “Social resilience”, “Economic resilience”, “Ecological resilience”, and “Infrastructure resilience” are the common dimensions in the existing studies, followed by “institutional resilience” and “cultural resilience” [14,15,23], referenced to the existing research results [24,25,26], based on the principle of objectivity, representativeness, availability and comparability of data [18]. This paper dissects the urban resilience into five dimensions: economic, social, infrastructure, ecological and cultural resilience, and selects 30 indicators to build a comprehensive evaluation index system for the urban resilience in the Chengdu-Chongqing economic circle (Table 1).

Table 1.
Urban Resilience Evaluation Index System.
Firstly, the construction of the Chengdu-Chongqing economic circle is a national strategy in which institutional forces such as the government’s governance behaviors and effects play an important role. However, since institutions generally act and are reflected in other dimensions, there are characters of institutions that are difficult to quantify and not easily captured accurately by the indicator data. Therefore, this paper does not list the institutional resilience dimensions separately but considers and incorporates the effects of institutions in the selection of each dimensional indicator. Secondly, culture is the soft power for the development of cities and urban agglomerations, which can boost economic development and achieve innovative and comprehensive development through penetrating and consolidating different fields. Culture is also a source to support the resilience of cities and urban agglomerations. The construction process of the Chengdu-Chongqing economic circle is also a part of deep, internal and long-lasting synergistic development of the Ba-Shu culture. The construction process is an important support for urban cohesion and creativity, and therefore it is crucial to construct the cultural dimension in the evaluation index system of the resilience of the Chengdu-Chongqing economic circle.
The variable selection of the influencing factors of urban resilience based on the fsQCA method is as follows:
In this paper, the urban resilience level is used as the outcome variable. The closeness of each evaluation object to the optimal solution in the Chengdu-Chongqing economic circle is evaluated by the entropy-weight-TOPSIS method, and the closeness of each evaluation object, i.e., the value of urban resilience level in each region, is obtained.
Considering the qualitative comparative analysis (QCA) approaches can lead to individualization of cases. It is not a conducive way to obtain results that provide regular and comprehensive explanations across cases [27]. In this paper, one representative indicator is selected as a condition variable from each of the six dimensions, including political force, market force, financial force, openness force, innovation force and cultural force.
Political force refers to the government’s ability to enhance the level of urban resilience by guiding the direction of fiscal policy inputs, supporting infrastructure construction, and equipping resources for macroeconomic regulation. In this research, we refer to the study of Song and Ding [28,29], and select local fiscal revenue/local fiscal expenditure to reflect the level of urban political force. The more local fiscal revenue and the less the proportion of external fiscal expenditure, the greater the fiscal freedom of local government, the more resource industry available for deployment, and the higher the administrative power.
Market force refers to the ability to improve the level of resilience by guiding the way of resilience resource allocation through market demand and prompting the effective allocation of each production factor based on the law of market development. Market force can significantly enhance the economic and social resilience of cities, strengthen regional resource integration capacity and urban economic growth through the diffusion and radiation effects of the market and enrich internal social capital [30]. In this research, we refer to the study of Zhang [30] and select the per capita retail sales of consumer goods in municipal districts as a measure of market force.
Financial force refers to the ability of financial institutions to steadily expand the financial environment and financial scale through the rational use of savings, thus contributing to the improvement of urban resilience levels. Our choice for the measure of financial force in this paper is the deposit and loan balance/GDP, which is based on research by Song and Chen [28,31]. The high year-end deposit and loan balance of financial institutions as a percentage of GDP indicates that the region has sufficient financial capital and a good financial environment to ensure that the city maintains strong viability under uncertainty shocks.
Openness force refers to the ability to use conditions such as foreign capital funding and foreign trade policies to promote diversification of industrial structure, expand the field of regional cooperation, increase the resilience of the city system to the outside world and improve the level of resilience. The level of foreign trade exchange is a direct manifestation of openness force, and its improvement helps the gathering and accumulation of urban resource elements. In this paper, we refer to the study of Zhu and Chen [18,31], and select the foreign trade dependence (total regional import and export/GDP), selected as the measure of openness force.
Innovation force refers to the ability to promote the quality upgrading of industrial structure, optimize the urban structure and improve urban quality through science and technology innovation based on the changes and development of contemporary urban system [32]. The higher the innovation force, the greater the ability and opportunity to promote the innovative development and transformation, and upgrading of cities, and thus improve urban resilience. In this paper, we refer to the study of Ding and Chen [29,33] and select the number of patents granted at the end of the year as a measure of innovation force.
Cultural force refers to the ability of culture to promote urban resilience through the integration of historical traditions, values, and behavioral habits of urban social systems into social institutions and human conceptual awareness. Sichuan and Chongqing share similar regional cultures (Ba-Shu culture) and folk blood ties, and the synergistic development of culture is a deeper, intrinsic, and lasting motivation for the construction of the Chengdu-Chongqing economic circle. In this paper, we refer to the study of Zhang [32] and select the proportion of the population with a college education or above as the measure of cultural force.
2.2. Research Methods and Data Sources
2.2.1. Entropy Weight-TOPSIS Model
For the assessment of urban resilience, the commonly used methods are Technique for Order Preference by Similarity to an Ideal Solution (TOPSIS), Entropy method, Thiel index, Analytic Hierarchy Process (AHP), Grey Fuzzy Evaluation, etc. TOPSIS, also known as “Approximation to an Ideal Solution Order Method”, is a comprehensive evaluation method for multi-objective decision analysis from finite schemes proposed by C.L. Hwang and K. Yoon in 1981, which is an old method that detects the approximation to an ideal solution by calculating the distance [33], with the advantages of simple calculation, being easy to understand, and better integration of other methods [34]. However, the TOPSIS method uses a subjective weighting method, which is susceptible to bias caused by personal factors and has strong subjective arbitrariness. Therefore, this paper adopts the entropy-TOPSIS method and assigns weights to the indicators by the entropy method, which can reflect the weight information truly and objectively and make the results more reasonable. The specific calculation steps are as follows:
- The entropy method is used to determine the weight of each index. The weight score of each dimension is the sum of the weights of its six indicators. (Table 1)
- The TOPSIS method is used to determine the closeness of each region, that is, the level of urban resilience. (Table 2)
Table 2. Urban Resilience Evaluation Index System.
2.2.2. Qualitative Comparative Analysis Method (QCA)
The Chengdu-Chongqing economic circle is a complex giant system, which necessitates to systematically examine the causes of events and the interaction between factors [35] and tap into the complex nonlinear relationships among multiple factors. QCA is based on set theory and Boolean algebra to effectively and systematically deal with the research data of multi-case comparison of the Chengdu-Chongqing economic circle by simplifying the relationship between antecedent conditions and outcome variables, to explore how the combination of antecedent conditions of multiple influencing factors drive the outcome variables [36]. QCA method is more objective than the case analysis, and more clearly reflects the complexity of cause and effect than the latter. The level of urban resilience (outcome variable) and the multiple condition variables selected in this paper are continuous variables, and the fuzzy set qualitative analysis method can ensure the accuracy of data processing. Therefore, this paper specifically adopts the fuzzy set qualitative comparative analysis (fsQCA) method to analyze how urban resilience in the Chengdu-Chongqing economic circle can be driven by multiple motivational configurations by constructing a dichotomous data table, constructing a Truth Table, resolving contradictory grouping, and performing Boolean minimization and result interpretation [37]. Multiple different combinations of conditional variables in the form represent multiple differentiated paths with outcome equivalence [38,39], reflecting the impact on the urban resilience of the Chengdu-Chongqing economic circle.
2.2.3. Data Sources
This paper takes 2019 as the research period, and the original data are obtained from the China City Statistical Yearbook (2020), the Sichuan Statistical Yearbook (2020), the 2020 Statistical Yearbook of Chongqing districts and counties, and the Statistical Communique of the People’s Republic of China on the 2019 National Economic and Social Development of Sichuan cities and Chongqing districts and counties; the State Council approves the First Batch of National Intangible Cultural Heritage List and the Second List of National Intangible Cultural Heritage determined by the Ministry of Culture and other relevant data. Some of these missing data are calculated and synthesized using data from existing yearbooks and bulletins and other sources. It should be noted that the research scope of this paper includes the central district of Chongqing (Yuzhong, Yubei, Jiangbei, Nan’an, Jiulongpo, Shapingba, Dadukou, Banan, Beibei) and 27 Chongqing districts and counties (Wanzhou, Fuling, Qijiang, Dazu, Qianjiang, Changshou, Jiangjin, Hechuan, Yongchuan, Nanchuan, Bishan, Tongliang, Tongnan, Rongchang, Liangping, Fengdu, Dianjiang, Zhongxian), because the planning scope of the Chengdu-Chongqing economic circle only includes parts of Kaizhou, Yunyang, Mianyang, Dazhou and Ya’an, in order to facilitate statistics and processing, we choose to include all areas in the research scope, and use the city’s caliber as an approximate substitute.
3. Results
3.1. The Level of Urban Resilience
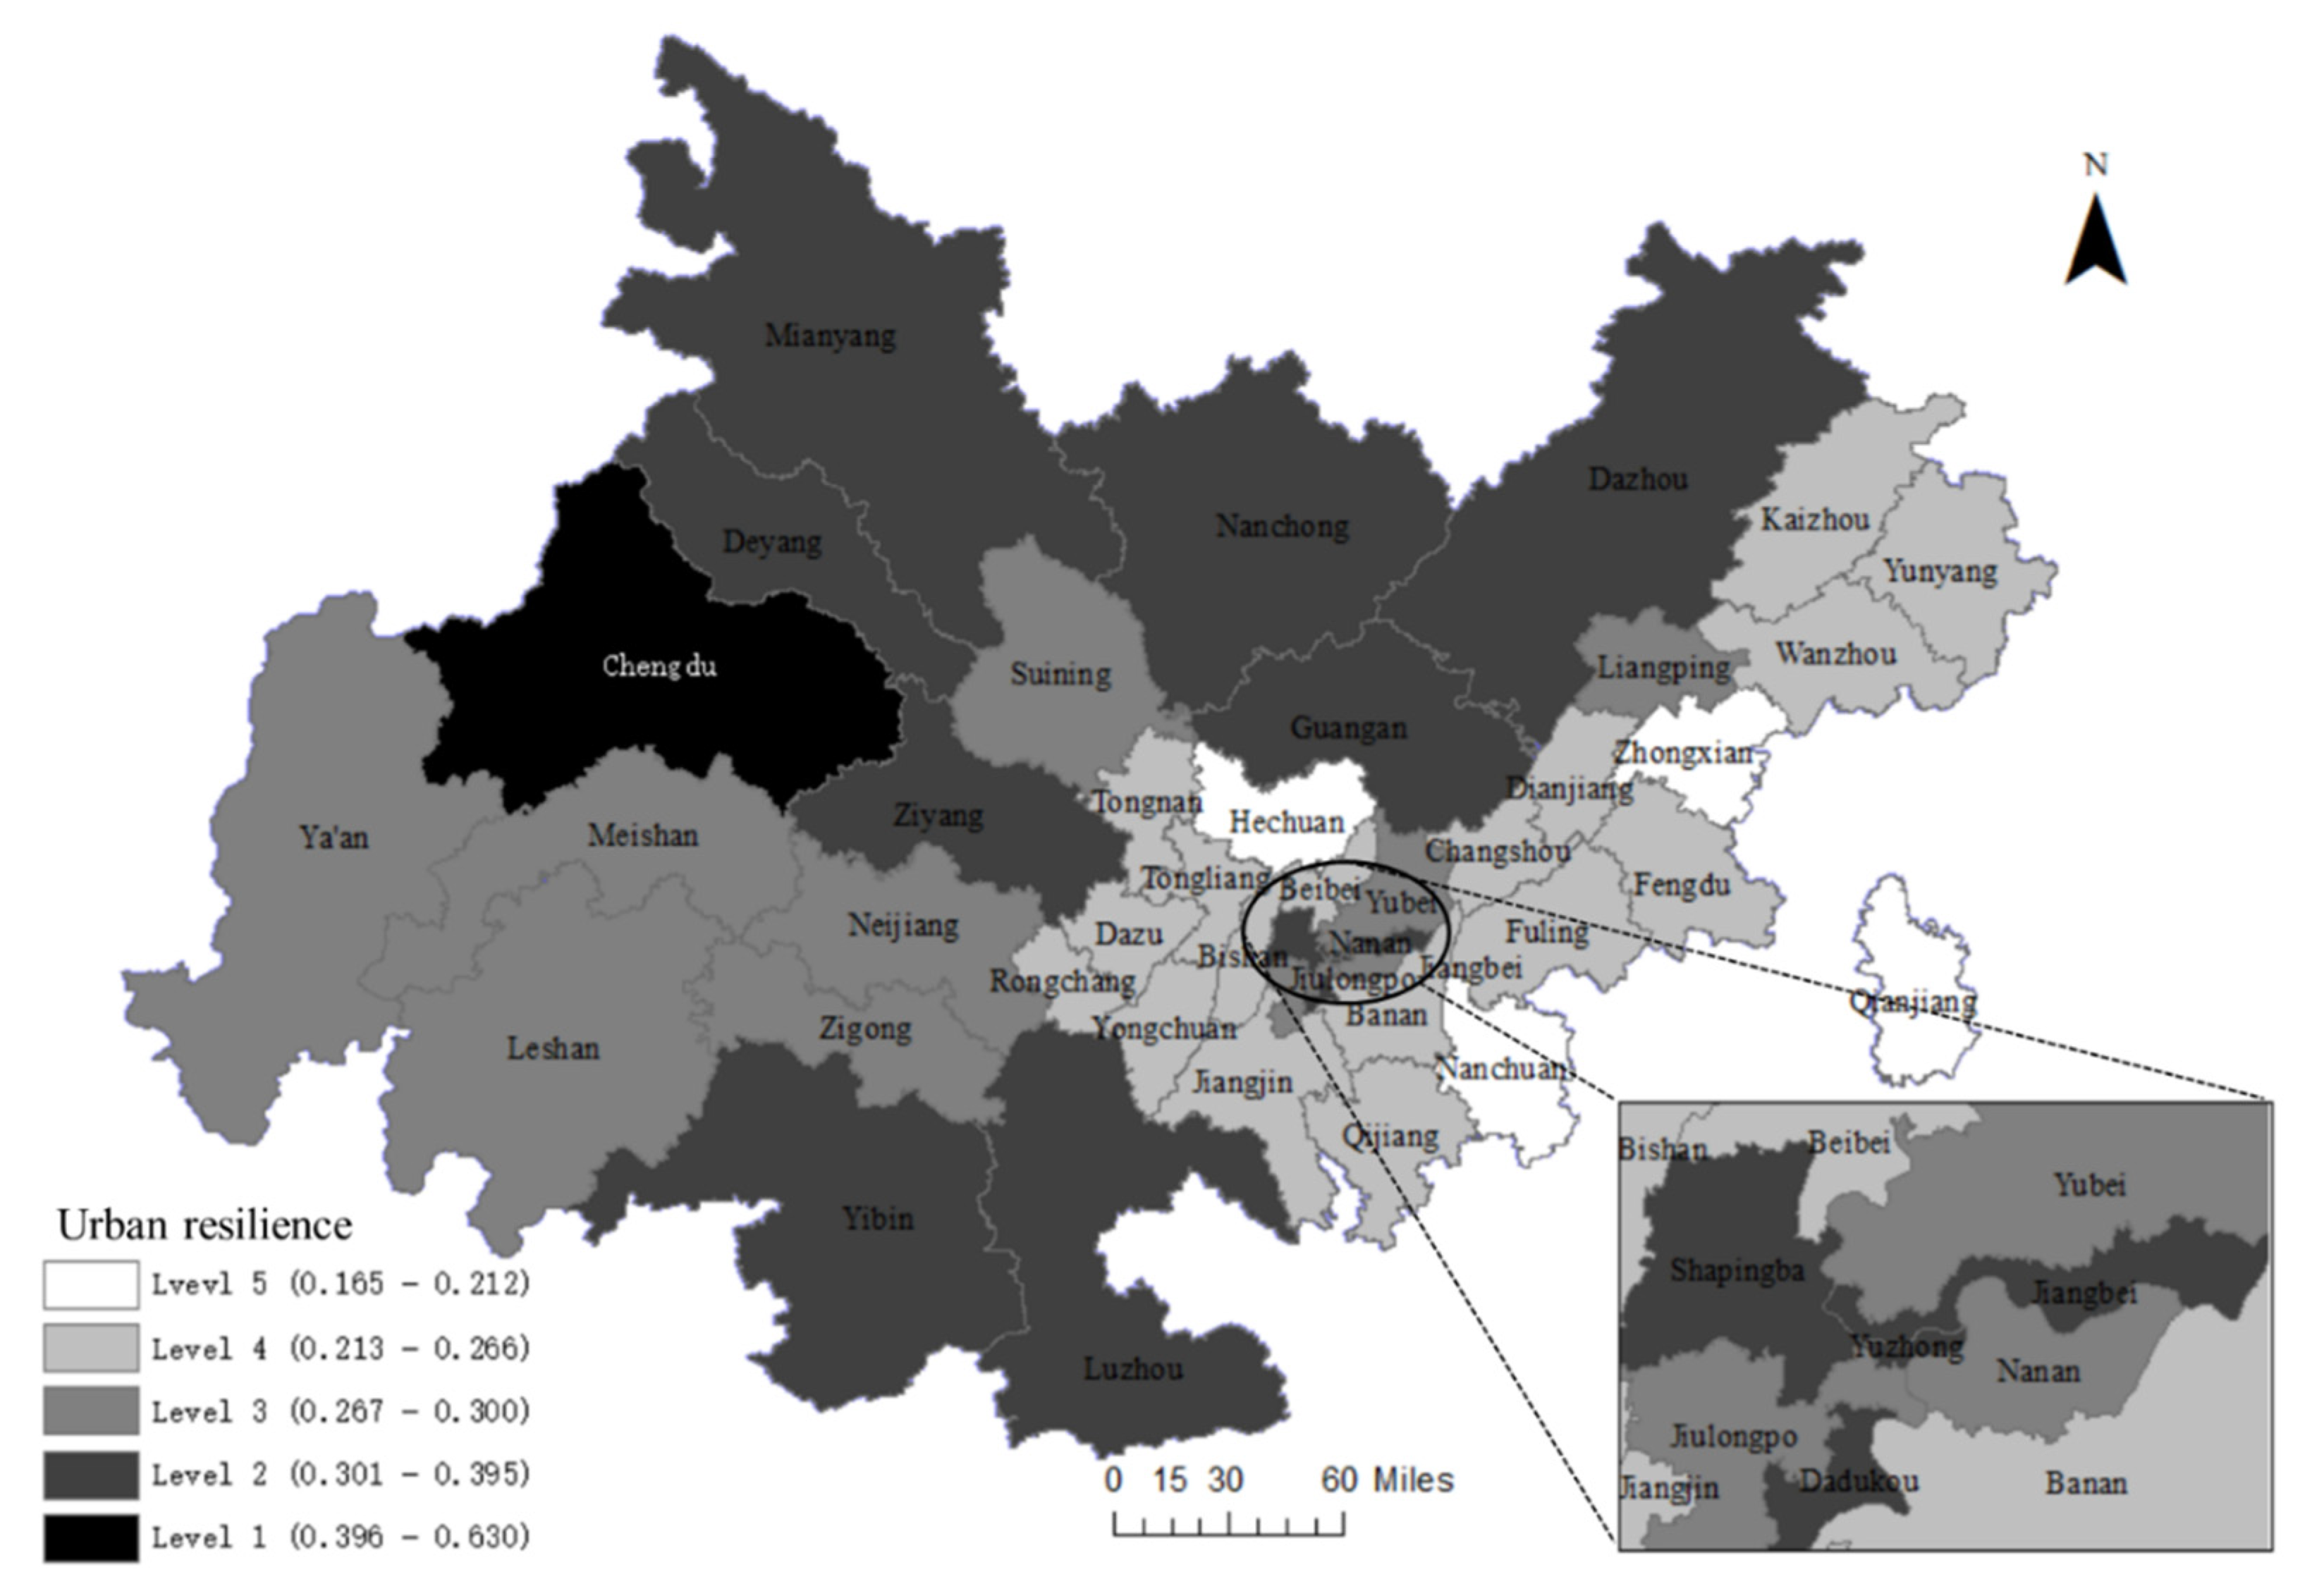
This paper firstly constructs the urban resilience model of the Chengdu-Chongqing economic circle. Secondly, the paper uses Equations (1) and (2) to calculate the weight of each index and uses Equations (3)–(8) to calculate the closeness of each evaluation object to the optimal solution. The above calculation operation is performed by the software MATLAB2020-b. The closeness is the value of urban resilience in each region, and we rank them based on their values (Table 2). At last, the paper uses ArcGIS 10.7 software (Environmental Systems Research Institute, Redlands, CA, USA) to describe the spatial distribution of urban resilience in the Chengdu-Chongqing economic circle (Figure 2), which can more intuitively and clearly reflect the spatial pattern of urban resilience. To highlight the spatial differences in resilience levels, this paper classifies urban resilience according to the natural breakpoint classification metho [40]. The natural breakpoint classification method is based on the natural grouping inherent in the data, and the classification interval is differentiated to maximize the difference between the different categories [41]. Therefore, this paper uses the natural breakpoint classification method to divide the data into five levels. Level 1 corresponds to the resilience level of 0.396–0.630, Level 2 corresponds to the resilience level of 0.301–0.395, Level 3 corresponds to the level of 0.267–0.300, Level 4 corresponds to the level of 0.213–0.266, and Level 5 corresponds to the level of 0.165–0.212. (Figure 2)
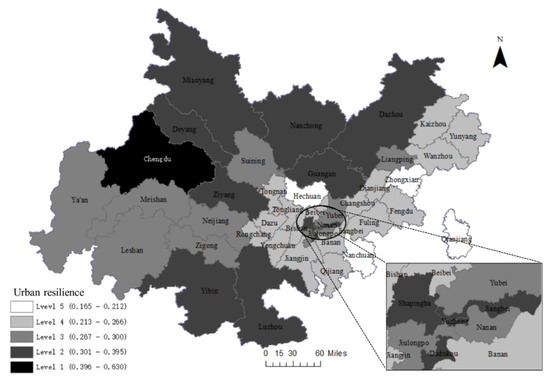
Figure 2.
Spatial distribution of urban resilience level in the Chengdu-Chongqing economic circle.
In general, the overall level of urban resilience in the Chengdu-Chongqing economic circle is at a low level, and the balance of the whole region is insufficient, with the east (Sichuan area) being strong and the west (Chongqing area) being weak. Cities with an urban resilience level of less than 0.3 account for more than 70%. Only Chengdu in the whole region has reached Level 1 (0.630136), and there are significant differentiations among cities, with a large gap in internal resilience level, and the difference between cities with Level 2 and Chengdu City is more than 0.30, and the lowest score of resilience level is only 0.164931 in Hechuan, Chongqing.
From the perspective of each area, the city resilience level in the Sichuan area is higher than that in the Chongqing area. Ya’an (0.268356) is the city with the lowest resilience level in the Sichuan area, while 72.41% of the cities in the Chongqing area have lower resilience level values than Ya’an city. There is a small difference in the resilience level of cities in the Sichuan region, with the whole region being at Level 1, Level 2, and Level 3. Ziyang has a better performance in urban resilience level of 0.320246, only second to Chengdu City. Meanwhile, Luzhou, Deyang, Mianyang, Dazhou, Nanchong, Yibin, and Guang’an are also at the Level 2 of urban resilience. These cities are mainly located in northeast and southeast Sichuan and are between Chengdu and Chongqing, showing relatively high urban resilience levels. The Chongqing area, except for the central district, is below the average urban resilience level (0.281684) and is generally at the Level 4, while Zhongxian (0.21203), Qianjiang (0.208182), Nanchuan (0.196074) and Hechuan (0.164931) are the cities at the Level 5. This is mainly caused by the shortcomings of the region’s single urban industrial structure, imperfect infrastructure, unreasonable town scale structure, and low degree of industrial chain division and synergy which leads to weak urban planning, urban operation, and other capabilities, and generally low urban resilience level as the results.
3.2. Spatial Distribution of Urban Resilience
The spatial distribution characteristics of “dual core” supported by Chengdu and the central district of Chongqing have been formed. Both Chongqing and Sichuan have shown a significant “core-edge” pattern. This is closely related to the government’s national positioning of the Chengdu-Chongqing economic circle to tell the tale of the Chengdu-Chongqing twin city, highlighting the central city’s leading position as the core, and creating a new situation of national and local joint promotion of the twin-city leading, twin-circle interaction, and two-wing cooperation, as well as joint construction of an urban governance system for high-quality development and improvement of the quality of life. However, since Chongqing was just separated from Sichuan province to become a municipality directly under the Central Government’s administration in 1997, the central city of Chongqing is not as powerful as Chengdu in terms of factor allocation, industrial upgrading, population gathering, and its role and influence is limited.
As a result, the difference between the resilience levels of the two core cities (Chengdu and Chongqing central district) is relatively significant, and the resilience level values of Chongqing central districts such as Yuzhong, Jiangbei, Dadukou, and Yubei are basically at Levels 2 and 3, with the highest-ranked, Yuzhong (0.394664), having a much lower resilience level value than Chengdu (0.630136). The results indicate the uneven development of one strong (Chengdu city) and one weak (Chongqing central district) cores. As can be seen from Figure 2, the resilience level values of cities in western Chongqing and eastern Sichuan between Chengdu and the central district of Chongqing are also relatively high, showing a tendency to cluster around the “double core”. This is mainly because the promotion of the linkage between the twin cores is inevitably coupled with the phenomenon of polarization and diffusion effects of the cores, and the twin cores extend some industrial functions to the intermediate regions, leading to regional synergistic development.
As far as the area is concerned, both the Sichuan and Chongqing areas have formed a “core-edge” resilience level pattern, and the urban resilience level values of the provincial capital and the central district are significantly higher than those of the surrounding cities. The Sichuan area has formed a situation with Chengdu as the core and other cities surrounding on three sides, although the difference between the core and the periphery is small (at the Level 1, Level 2, Level 3), the difference between the values is large. For example, Ziyang, which ranks 2nd in the Sichuan area in terms of resilience level (Level 2), has a closeness of 0.320246, which is around 50% of the value of Chengdu (0.630136). The high level of resilience in Chongqing is the central district, such as the Yuzhong, Jiangbei, Dadukou, Shapingba, Yubei, and Jiulongpo areas, which is connected into blocks, and other low toughness cities are distributed contiguously around the central district. Although there is a certain level gap in urban toughness between the core and the edge of the Chongqing area, the value gap is small, with the highest-level value of 0.394664 for the vicinity of Yuzhong and 0.164931 for the lowest Hechuan.
3.3. Configuration Analysis of Influencing Factors
3.3.1. Calibration and Necessity Analysis of fsQCA
The process of assigning affiliation to a collection of cases is calibration, which is centered on giving “meaning” to variables [42]. Recalibrating variables into sets requires setting three anchors based on theoretical and practical external knowledge or criteria: full membership, cross over point, and full nonmembership. We choose to directly target 75%, 50% and 25% of the sample data distribution [43] and input the variable name and the values of the three anchors in turn through the “calibrate” function in the fsQCA3.0 software. If the calibrated result has 0.5, we need to modify it to 0.501 to avoid ignoring the cross over point during the analysis [44]. Calibration information for the six conditional and outcome variables is shown in Table 3.
Table 3.
Calibration table for condition and result data.
Identification of a single necessary condition is determined by the consistency threshold [45], and the condition becomes a necessary condition for the outcome variable when the consistency score is greater than 0.9. Through the necessity analysis, it shows that the consistency scores of single antecedent conditions are all less than 0.9. Therefore, none of these six condition variables alone constitutes the necessary conditions to affect urban resilience.
3.3.2. Configuration Analysis of the Overall Area
The specific operation steps of fsQCA configuration analysis are as follows: setting case frequency and threshold, counterfactual analysis and solution, distinguishing core conditions and edge conditions, reporting results with symbols, and interpretation of results. In the actual operation in fsQCA3.0 software (Environmental Systems Research Institute, Redlands, CA, USA), due to the small sample size of this paper, the case frequency is set to 1 [42], the consistency threshold is set to 0.8 [46], and the PRI value is set to 0.75 [42]. After running, the configurations of urban resilience are obtained. By adjusting the case scope to the overall area, Sichuan area and Chongqing area, we obtain the configurations of Table 4, Table 5 and Table 6. The actual operation of the fsQCA configuration analysis will use the consistency and coverage as indicators to test the reliability of the results, and this research determines that consistency should not be less than 0.8 [47]. As shown in Table 4, the total coverage of the high urban resilience configuration from the whole area of the Chengdu-Chongqing economic circle is 0.7465, indicating that the five configurations have good explanatory power for the outcome variables, and the total coverage of the non-high urban resilience configuration is 0.5119, showing that the non-high configurations are also able to explain more than 50% of cases. The overall consistency between the high and non-high configuration solutions were 0.8499 and 0.9368 (>0.8) respectively, implying that the solutions were meaningful, and the consistency level of each configuration solution was in the range of 0.8143–0.9891, both greater than 0.8, demonstrating that each combination of conditions was highly convincing for the outcome variable.
Table 4.
Overall high urban resilience and non-high urban resilience configuration analysis.
Table 5.
Configuration Analysis of High Urban Resilience in Chongqing Area and Sichuan Area.
Table 6.
Configuration Analysis of Non-high Urban Resilience in Chongqing Area and Sichuan Area.
Given the causal asymmetry of the QCA approach, we explored both high and non-high results, and used different cause combinations to explain them. It is useful to explore the driving mechanism to make up for shortcomings and devise precise improvements. According to Table 4, the high urban resilience configuration contains five configurations (H1-H5) and the non-high urban resilience configuration contains six configurations (NH1-NH6). Considering that the fsQCA3.0 software amplifies the subtle differences between the calculation results of each case, which leads to the duplication of cases with similar but different sources of configurations, we used the core conditions as the criteria to merge the configuration cases [48] and obtained the following three high urban resilience explanation paths and three non-high urban resilience explanation paths.
- Overall high urban resilience interpretation path
Finance-driven, including the configurations H1 (~P*~M*F*~O*~C), when the core role of politics, market, and cultural forces is missing, but financial force plays a core role as the main driver, urban resilience can still reach a high level. As a case for explaining this path, Ziyang actively uses financial technology tools such as Internet big data, and Dazhou injects financial power into the development of key industries to effectively meet the demand for capital operation and continuously improve the financial business environment. It indicates that a stable and strong financial environment helps to improve the resilience of cities.
Innovation-driven, containing H2 (~P*~M*I*~O*~C) and H3 (~M*F*I*O*~C), plays a central role in an environment where the overall level of cultural force is low and financial force is dispensable, and a high level of urban resilience can be achieved regardless of whether openness force manifests as a marginal condition of presence (H3) or absence (H2). As an interpretative case of this path, regions such as Neijiang, Dazhou and Suining have improved the level of urban resilience by deepening the cooperation between schools and enterprises in the integration of industry and education, accelerating the support platforms in various fields of innovation and development, stimulating the vitality and power of research institutions, and promoting the construction of high-level science and technology innovation centers.
Multiple-driven, including the configurations H4 (P*~M*F*O*C) and H5 (M*F*I*O*C), the path in which the openness force, cultural force, and financial force all play core driving roles, greatly enhance the level of urban resilience. The path has a greater effect on high urban resilience and covers a wider extent, and its coverage cases include the financial center and highlands of science and technology innovation and reform and development of Chengdu and Yuzhong, Jiangbei of Chongqing.
- Overall non-high urban resilience interpretation path
Innovation-deficient, containing the configurations NH1 (M*~F*~I*~O*~C), NH2 (~P*M*F*~I*O*~C), and NH3 (~P*M*F*~I*~O*C), indicates that even though cities have high market force, the level of city resilience is suppressed by the lack of innovation force. For example, the number of patents granted at the end of the year is 156 in Nanchuan and 91 in Qianjiang of Chongqing, which indicates a lack of science and technology, and the performance of the innovation force is weak, thus the value of city resilience level is low. The path highlights the core driving role of innovation force on urban resilience level.
Finance-deficient, containing the configuration NH4 (P*M*~F*I*O*C), the path suggests that the absence of financial force, even with high market force and political force, leads to lower values of urban resilience levels. The path highlights the central driving role of financial power on the level of urban resilience.
Finance and Innovation-deficient, containing the configurations NH5 (P*~M*~F*~I*O*~C) and NH6 (P*~M*~F*~I*~O*C), the path shows that when both financial and innovation force conditions are insufficient, the market-based resource integration ability is not high and the innovation ability is low. Even if the city is in a higher political force environment, it is not conducive to the improvement of the city’s resilience level. For example, although the Banan area of Chongqing has a superior geographical location, high supportive external policies and financial freedom, and strong market-based resource integration ability, many conflicts in the regional economic operation are accumulated on banks and the problem of increasing financial risks needs to be solved, which affects the low value of urban resilience level of Banan (0.265600).
3.3.3. Configuration Analysis of Sichuan Area and Chongqing Area
Chongqing and Sichuan regions belong to different administrative divisions and have different background conditions of urban resilience, which are manifested in obvious heterogeneity in terms of resource endowment and institutional environment. In this research, all sample data are divided into Chongqing (29 districts and counties) and Sichuan (15 prefecture-level cities), and the configuration of urban resilience levels are analyzed separately.
- High urban resilience interpretation path in Chongqing area
The high urban resilience of the Chongqing area contains four configurations, in which the consistency of the solution is 0.9426 (>0.8), implying that the solution is meaningful. The core conditions were used as criteria to subsume the four configurations to form three explanatory paths (Table 5).
Administration and Finance-driven, containing the configuration H6 (P*~M*F*O*C), in which administrative and financial forces exist as core conditions, suggests that urban resilience is more likely to be at a high level even when innovation force is dispensable, with the aids of high political force and high financial volume circulation.
Finance and Innovation-driven, containing the configuration H7 (~P*~M*F*I*~O*~C), the path suggests that financial and innovation forces, as core conditions, are the core drivers of high levels of urban resilience.
Multiple-driven, containing the configurations H8 (P*~M*F*I*C) and H9 (P*F*I*O*C), under which political, financial, and innovation forces exist as core conditions and show a higher influence role and coverage of the outcome variables, covers several cases of Chongqing central urban areas such as Jiangbei, Yubei, Yuzhong, and Jiulongpo, all of which are important administrative functional areas, the financial heartland, and the highland of science and technology innovation of the Chongqing area.
- High urban resilience Interpretation path in Sichuan area
The high urban resilience of the Sichuan area contains three configurations, where the consistency of the solution is 0.8887 (>0.8), indicating that the solution is meaningful, and the subsumed form three explanatory paths (Table 5).
Finance-driven, containing the configuration H10 (~P*~M*F*~I*~O*~C), the path cultural force core variable is missing, and other condition variables are also missing as marginal variables, and the presence of financial force alone as a core condition drives high levels of urban resilience, indicating that financial force is a core driver of urban resilience.
Finance and Innovations-driven, containing the configuration H11 (~P*M*F*I*~O*~C), the path cultural force is missing as a core variable, political and openness forces are missing as marginal conditions, market force exists as auxiliary conditions, and financial and innovation forces driving high levels of urban resilience are as core conditions.
Multiple-driven, containing the configuration H12 (P*M*F*I*O), cultural force is dispensable under this path, political and market forces exist as auxiliary conditions, and financial, innovation, and openness forces are as core conditions jointly drive high levels of urban resilience and show a higher effect on the outcome variable (0.3136).
- Non-high urban resilience interpretation path in Chongqing area
The non-high urban resilience interpretation path in the Chongqing area contains six configurations, of which the consistency of the solution is 0.9385 (>0.8), suggesting that the solution is effective, and three main interpretation paths are formed after the consolidation (Table 6).
Culture-deficient, containing the configurations NH7 (P*~M*~F*~I*~O*~C) and NH8 (P*~M*~F*I*O*~C), the pathway suggests that technological innovation and openness are of limited impact on the cities when they in the lack of cultural force (NH8); or when political force is strong and urban cultural force is limited, it can also be inhibitory to urban resilience (NH7).
Finance-deficient, which contains the configurations NH9 (~P*~M*~F*~I*~O*C), NH10 (~P*M*~F*I*~O*C), and NH11 (P*M*~F*I*O*C), the path suggests that when financial force is absent as a core condition, it is difficult to effectively enhance the urban resilience even in a friendly policy and market environment.
Innovation and Culture-deficient, contains the configuration NH12 (~P*~M*F*~I*~C), the path indicates that even with high financial force, the level of urban resilience is inhibited by the lack of innovation and cultural forces.
- Non-high urban resilience interpretation path in Sichuan area
The non-high urban resilience of the Sichuan area contains three configurations, where the consistency of the solution is 0.9712 (>0.8), showing that the solution is meaningful, and two main interpretation paths are formed after subsumption (Table 6).
Openness-deficient, containing the configuration NH13 (P*~M*F*~I*~O*C), the path indicates that despite good cultural and financial force, the city has a low level of external openness, leading to a suppressed level of resilience.
Administrative and Finance-deficient, which contains the configurations NH15 (~P*~F*~I*~O*~C) and NH14 (~P*~M*~F*~O*~C), is the path that misses political and financial forces are missing as core conditions, and misses other condition variables as marginal conditions, which predispose to the occurrence of low-level resilience outcomes.
4. Discussion
We measure the urban resilience level of Chengdu-Chongqing economic circle by using the entropy weight TOPSIS model, and then select six aspects of political force, market force, financial force, innovation force, openness force and cultural force as the outcome variables and applies the fsQCA method to conduct conditional configuration analysis on the case cities of Chengdu-Chongqing economic circle as a whole and in the local area respectively to explore the configuration effects and driving paths of these six conditional variables, so as to deeply reveal the multiple concurrent factors and complex causal mechanisms affecting the resilience level of Chengdu-Chongqing economic circle.
The urban resilience level of each region in the Chengdu-Chongqing economic circle is significantly different and the regional balance is insufficient. Low levels of resilience and uneven spatial distribution are also important features of other urban agglomerations, cities, and communities, as demonstrated by other scholars [18,24]. Therefore, improving urban resilience and achieving balanced development will be important issues for the future construction of the Chengdu-Chongqing economic circle. We propose to use the research results of this paper as a guide, based on the overall development of the Chengdu-Chongqing economic circle, and promote the overall improvement of the resilience of cities and urban agglomerations in the economic circle. The results of the urban resilience level measurement in this research show that there is a large gap in the ability of regions to cope with internal and external disturbances. The urban resilience ability of Chengdu and Chongqing central district function well. The surrounding cities, on the other hand, suffer from the huge siphoning effect of the two core regions at the same time due to their weak economic base conditions and single industrial structure, and thus their capacity for urban resilience is underperformed. Wang and Zhang et al. also proved that cities in the Chengdu-Chongqing economic circle are more inclined to flow into large cities due to the influence of resources such as location, policies and innovative technologies [49,50]. Therefore, we should focus on the overall development of the Chengdu-Chongqing economic circle and promote the overall improvement of the resilience of the cities and urban agglomerations in the economic circle. We suggest continuing to emphasize the importance of “dual core” and giving full play to the agglomeration and spillover effects of core cities. Following the opposite development trend of Chongqing’s westward expansion and Chengdu’s eastward development, improve the urban resilience level of western Chongqing and eastern Sichuan. Then, through the strategy of near-regional synergy, the integrated improvement of the resilience level of Sichuan and Chongqing areas and urban agglomerations is promoted.
Although the related research on the influencing factors of urban resilience is not as much as that of economic resilience and engineering resilience [51], the research on the influencing factors of urban resilience has gradually become a research hotspot in recent years [21]. Current scholars are keener to use the method of correlation, focusing on the independent role of a single factor [52]. However, this paper further explores from the perspective of configuration, and comprehensively analyzes the configuration results of the overall region, Sichuan region and Chongqing region. This is consistent with the findings of Zhu and Ma [18,52]. The key driving forces for improving the resilience of the overall regional cities are financial and innovation forces, as are the Sichuan and Chongqing areas. However, the key factors inhibiting the level of urban resilience vary significantly across regions. In addition to emphasizing the important impact of lacking financial and innovation forces, the Chongqing and Sichuan areas also emphasized the huge role of cultural and openness forces on their own. Cultural and openness forces are important soft powers for regional development, and they are also the breakthrough points for the Chongqing and Sichuan areas to improve urban resilience. This result further confirms that it is reasonable and scientific to add cultural dimension to the index system of this paper. Therefore, to enhance the level of urban resilience in the most efficient way, we need to start from the commonality of urban agglomerations and regions, and drive as many regions as possible to enhance their resilience capacity through the investment of limited resources. We suggest implementing finance-driven and innovation-driven development strategies, coordinating region-wide financial resources, and enhancing regional collaborative innovation development capabilities, thus effectively enhancing the level of urban resilience. At the same time, we need to combine the planning and deployment of the construction and development of the Chengdu-Chongqing economic circle according to the background conditions of urban resilience. Encourage the Chengdu-Chongqing area and cities in the region to make up for the shortcomings of the driving force according to local conditions, and formulate focused, differentiated and refined urban resilience enhancement strategies. In the future, the Sichuan area will increase its efforts in external development, especially the opening up of finance, technology, medical care, trade and other fields. The Sichuan area has joined hands with the construction of urban agglomerations to actively discuss the connection between China-Indochina Peninsula, Bangladesh-China-India-Myanmar economic corridors and cooperation in the construction of China-Europe trains. Chongqing area should pay attention to the improvement of science and technology, especially the science and technology innovation of the northeast Chongqing and southeast Chongqing city clusters. Meanwhile, we should also promote the cultural synergy between Chongqing and the Sichuan areas, and also explore the ethnic culture and modern urban culture with Chongqing characteristics. We propose to use cultural power as the internal driving force to promote the integrated development of urban systems and improve the level of urban resilience.
Our research has limitations in the selection of variables for each dimension of the urban resilience index system, which is limited by the research object. For the study of Chongqing region, we treat each district and county of Chongqing as a research object separately, instead of regarding Chongqing as a whole research object [49]. This treatment can explore the resilience capacity of the Chengdu-Chongqing economic circle from a more microscopic perspective, but it also brings a thorny problem that it is difficult to obtain the original data of each district and county in Chongqing. Therefore, the construction of the indicator system of this study is affected by the different data of each district and county in Chongqing and the different standards of each yearbook. At the same time, this study lacks consideration of the dynamics of the urban resilience level and influencing factors, and a static configuration study is commonly conducted in QCA analysis [42]. This study profoundly reveals the configuration effect of the impact factors of the Chengdu-Chongqing economic circle from both global and local perspectives. However, the complex phenomenon is the result of the joint action of multiple conditional trajectory changes, coupled with the increasing attention of the academic community on the time effect, the time dimension into the analysis of QCA is a key direction for future research to advance.
5. Conclusions
By measuring the level of urban resilience in the Chengdu-Chongqing economic circle and analyzing the configuration of influencing factors, this paper draws the following conclusions. Regarding resilience levels, the overall level of urban resilience in the Chengdu-Chongqing economic circle is relatively low, and the overall balance is insufficient, forming a “core-edge” spatial pattern. Regarding the configuration analysis of urban resilience, we found that the influence paths of high and non-high urban resilience levels are the result of a combination of multiple factors. This also proves that a single factor cannot exist as its necessary condition. Financial force and innovation force simultaneously serve as key factors in the interpretation path of high (finance-driven, innovation-driven) and non-high (finance-deficient, innovation-deficient) urban resilience. They are the core drivers of urban resilience. The original coverage rate (0.3499) and the unique coverage rate (0.2988) of multiple driven are the highest, which indicates that multiple-driven forces have a greater impact on high urban resilience. By comparing the interpretation paths of high and non-high urban resilience levels in Chongqing Area and Sichuan Area, it can be seen that the driving forces have common and asymmetric characteristics. In consistence with the results of the path of high urban resilience in the whole region, financial and innovation forces are also the core drivers of the high urban resilience level in Sichuan area and Chongqing area. Among the multiple-driven forces, political, financial and technological forces play a central role in the Chongqing area. Moreover, the financial, innovation and openness forces of the Sichuan area play a central role. From the explanation path of non-high urban resilience, it can be discovered that finance-deficient is the same path that inhibits the urban resilience of both zones. The lack of cultural and innovation forces in the Chongqing area resulted in a non-high level of urban resilience, while the lack of cultural and innovation force in the Chongqing area and the lack of openness and political forces in the Sichuan area resulted in a suppressed level of resilience.
Author Contributions
Conceptualization, M.Y. and M.J.; methodology, M.Y. and M.J.; software, M.J. and J.Z.; formal analysis, M.Y.; data curation, M.J.; writing—original draft preparation, M.Y. and M.J. writing—review and editing, M.Y. visualization, M.J. and J.Z.; funding acquisition, M.Y. All authors have read and agreed to the published version of the manuscript.
Funding
This research was funded by National Social Science Foundation of China (18XSH017), Mei Yang. Chongqing Municipal Education Commission Humanities and Social Sciences Key Project (2022CJ27), Mei Yang. The Action Plan for High Quality Development of Postgraduate Education of Chongqing University of Technology (gzlcx20223120), Mei Yang.
Institutional Review Board Statement
Not applicable.
Informed Consent Statement
Not applicable.
Data Availability Statement
Not applicable.
Conflicts of Interest
The authors declare no conflict of interest.
References
- China Urban Planning Network. Available online: http://www.planning.org.cn/solicity/view_news?id=832 (accessed on 26 May 2022).
- He, B.J.; Wang, J.; Zhu, J.; Qi, J. Beating the urban heat: Situation, background, impacts and the way forward in China. Renew. Sustain. Energy Rev. 2022, 161, 112350. [Google Scholar] [CrossRef]
- Wilbanks, T.J.; Sathaye, J. Integrating Mitigation and Adaptation as Responses to Climate Change: A Synthesis. Mitigation and Adaptation Strategies for Global Change. Mitig. Adapt. Strateg. Glob. Chang. 2007, 12, 957–962. [Google Scholar] [CrossRef]
- Bruneau, M.; Chang, S.E.; Eguchi, R.T.; Lee, G.C.; O’Rourke, T.D.; Reinhorn, A.M.; Shinozuka, M.; Tierney, K.; Wallace, W.A.; Von Winterfeldt, D. A Framework to Quantitatively Assess and Enhance the Seismic Resilience of Communities. Earthq. Spectra 2007, 19, 957–962. [Google Scholar] [CrossRef]
- Jing, L.B. The theoretical connotation and operational logic of resilient cities and their new opportunities in the context of digital economy. Guizhou Soc. Sci. 2021, 373, 108–115. [Google Scholar]
- Davoudi, S. On resilience. DisP-Plan. Rev. 2013, 49, 4–5. [Google Scholar] [CrossRef]
- Yodo, N.; Wang, P. Engineering resilience quantification and system design implications: A literature survey. J. Mech. Des. 2016, 138, 111408. [Google Scholar] [CrossRef]
- Holling, C.S. Resilience and Stability of Ecological Systems. Annu. Rev. Ecol. Syst. 1973, 4, 1–23. [Google Scholar] [CrossRef]
- Bozza, A.; Asprone, D.; Manfredi, G. Developing an integrated framework to quantify resilience of urban systems against disasters. Nat. Hazards 2015, 78, 1729–1748. [Google Scholar] [CrossRef]
- Walker, B.; Holling, C.S.; Carpenter, S.R.; Kinzig, A. Resilience, Adaptability and Transformability in Social-Ecological Systems. Ecol. Soc. 2014, 9, 5. [Google Scholar] [CrossRef]
- Cutter, S.L.; Boruff, B.J.; Shirley, W.L. Social vulnerability to environmental hazards. In Vulnerability and Environmental Justice; Routledge: London, UK, 2012; pp. 143–160. [Google Scholar]
- Jha, A.K.; Miner, T.W.; Stanton-Geddes, Z. Building Urban Resilience Principles, Tools, and Practice Environment and Sustainable Development; The World Bank: Washington, DC, USA, 2017. [Google Scholar]
- Joerin, J.; Shaw, R.; Takeuchi, Y.; Krishnamurthy, R. Action-oriented resilience assessment of communities in Chennai, India. Environ. Hazards 2012, 11, 226–241. [Google Scholar] [CrossRef]
- Liu, Y.P. Urban Resilience System Development Measurement: Based on an Empirical Study of 288 Chinese Cities. Urban Dev. Stud. 2021, 28, 93–100. [Google Scholar]
- Ribeiro, P.J.G.; Gonçalves, L.A.P.J. Urban resilience: A conceptual framework. Sustain. Cities Soc. 2019, 50, 2210–6707. [Google Scholar] [CrossRef]
- Shi, J.; Wang, X.; Wang, C.; Liu, H.; Miao, Y.; Ci, F. Evaluation and Influencing Factors of Network Resilience in Guangdong-Hong Kong-Macao Greater Bay Area: A Structural Perspective. Sustainability 2022, 14, 8005. [Google Scholar] [CrossRef]
- Zheng, Y.; Xin, X.L.; Li, C.Z.; Wang, M.; He, X.J. Development as adaptation: Framing and measuring urban resilience in Beijing. Adv. Clim. Chang. Res. 2018, 9, 234–242. [Google Scholar] [CrossRef]
- Zhu, J.H.; Sun, H.X. Research on Spatial—Temporal Evolution and Influencing Factors of Urban Resilience of China’s Three Metropolitan Agglomerations. Soft Sci. 2020, 34, 72–79. [Google Scholar]
- Liu, L.; Luo, Y.; Pei, J.; Wang, H.; Li, J.; Li, Y. Temporal and Spatial Differentiation in Urban Resilience and Its Influencing Factors in Henan Province. Sustainability 2021, 13, 12460. [Google Scholar] [CrossRef]
- Wang, Q.Z.; Zhu, Y.M. Research on Urban Economic Resilience and Its Influencing Factors in China. Ecol. Econ. 2021, 37, 84–92. [Google Scholar]
- Huang, G.Y.; Li, D.Z.; Zhu, X.; Zhu, J. Influencing factors and their influencing mechanisms on urban resilience in China. Sustain. Cities Soc. 2021, 74, 103210. [Google Scholar] [CrossRef]
- Cutter, S.L.; Barnes, L.; Berry, M. A place-based model for understanding community resilience to natural disasters. Glob. Environ. Chang. 2008, 18, 598–606. [Google Scholar] [CrossRef]
- Yang, Y.; Lin, L.; Zhong, Z.P.; Ou, Y.Y. Comprehensive evaluation and spatial differentiation of community resilience in Guangzhou based on response of the city to public health hazards. Acta Geogr. Sin. 2019, 74, 266–284. [Google Scholar]
- Cutter, S.L.; Ash, K.D.; Emrich, C.T. The geographies of community disaster resilience. Glob. Environ. Chang. 2014, 29, 65–77. [Google Scholar] [CrossRef]
- Cellini, R.; Torrisi, G. Regional Resilience in Italy: A Very Long-Run Analysis. Reg. Stud. 2014, 48, 1779–1796. [Google Scholar] [CrossRef]
- Zhang, M.D.; Feng, X.Q. A Comparative Study of Urban Resilience and Economic Development Level of Cities in Yangtze River Delta Urban Agglomeration. Urban Dev. Stud. 2019, 26, 82–91. [Google Scholar]
- Benot, R.; Charles, C.R. QCA Design Principles and Applications: A New Approach Beyond Qualitative and Quantitative Research, 1st ed.; Du, Y.Z., Li, Y.F., Eds.; Machine Industry Press: Beijing, China, 2017; Volume 3, pp. 31–58. [Google Scholar]
- Song, G.; Zhong, S.; Song, L. Spatial Pattern Evolution Characteristics and Influencing Factors in County Economic Resilience in China. Sustainability 2022, 14, 8703. [Google Scholar] [CrossRef]
- Ding, J.J.; Wang, Z.; Liu, Y.H.; Yu, F.W. Measurement of economic resilience of contiguous poverty-stricken areas in China and influencing factor analysis. Prog. Geog. 2020, 39, 924–937. [Google Scholar] [CrossRef]
- Zhang, P.; Yu, W.; Zhang, Y.W. Spatial and temporal differentiation of urban resilience in Shandong Province and its influencing factors. Urban Prob. 2018, 278, 27–34. [Google Scholar]
- Chen, Y.; Su, X.; Zhou, Q. Study on the Spatiotemporal Evolution and Influencing Factors of Urban Resilience in the Yellow River Basin. Int. J. Environ. Res. Public Health 2021, 18, 10231. [Google Scholar] [CrossRef]
- Zhang, Y.L.; You, W.J. Assessment of Social Vulnerability to Natural Disasters of Cities Based on TOPSIS: A Case Study of Shanghai City. J. Catastrophology 2014, 29, 109–114. [Google Scholar]
- Hwang, C.L.; Yoon, K.P. Multiple Attribute Decision Making Methods and Applications: A State-of-the-Art Survey; Springer-Verlag: New York, NY, USA, 1981; pp. 139–262. [Google Scholar]
- Zhao, D.Y.; Ma, Y.Y.; Lin, H.L. Using the Entropy and TOPSIS Models to Evaluate Sustainable Development of Islands: A Case in China. Sustainability 2022, 14, 3707. [Google Scholar] [CrossRef]
- Li, W.; He, H.B. The Logic and Application of Qualitative Comparative Analysis in Social Science Research. J. Shanghai Admin. Inst. 2015, 16, 92–100. [Google Scholar]
- Ragin, C. Redesigning Social Inquiry: Fuzzy Set and Beyond; University of Chicago Press: Chicago, IL, USA, 2008; pp. 36–49. [Google Scholar]
- Fiss, P.C. Building better causal theories: A fuzzy set approach to typologies in organization research. Acad. Manag. J. 2011, 54, 393–420. [Google Scholar] [CrossRef]
- Judge, W.Q.; Fainshmidt, S.; Iii, J. Which model of capitalism best delivers both wealth and equality? J. Int. Bus. Stud. 2014, 45, 363–386. [Google Scholar] [CrossRef]
- Bell, R.G.; Filatotchev, I.; Aguilera, R.V. Corporate governance and investors’ perceptions of foreign IPO value: An institutional perspective. Acad. Manag. J. 2014, 57, 301–320. [Google Scholar] [CrossRef]
- Xiao, W.; Lv, X.; Zhao, Y.; Sun, H.; Li, J. Ecological resilience assessment of an arid coal mining area using index of entropy and linear weighted analysis: A case study of Shendong Coalfield, China. Ecol. Indic. 2019, 109, 105843. [Google Scholar] [CrossRef]
- Zhang, Q.; Huang, X.; Xu, Y.; Bhuiyan, M.A.; Liu, P. New energy demonstration city pilot and green energy consumption: Evidences from China. Energy Rep. 2022, 8, 7735–7750. [Google Scholar] [CrossRef]
- Du, Y.Z.; Jia, L.D. Configuration Perspective and Qualitative Comparative Analysis (QCA): A New Way of Management Research. Manag. World 2017, 6, 155–167. [Google Scholar]
- Lou, Z.K.; Ye, A.L.; Mao, J.Y.; Zhang, C. Supplier selection, control mechanisms, and firm innovation: Configuration analysis based on fsQCA. J. Bus. Res. 2022, 139, 81–89. [Google Scholar] [CrossRef]
- Harms, R.; Alfert, C.; Cheng, C.-F.; Kraus, S. Effectuation and causation configurations for business model innovation: Addressing COVID-19 in the gastronomy industry. Int. J. Hosp. Manag. 2021, 95, 102896. [Google Scholar] [CrossRef]
- Jan, D.L. Identifying single necessary conditions with NCA and fsQCA. J. Bus. Res. 2016, 69, 1516–1523. [Google Scholar]
- Schneider, C.Q.; Wagemann, C. Set-Theoretic Methods for the Social Sciences: A Guide to Qualitative Comparative Analysis; Cambridge University Press: Cambridge, UK, 2012. [Google Scholar]
- Jerry, M.M.; Mohammad, M.K. Theoretical aspects of Fuzzy Set Qualitative Comparative Analysis (fsQCA). Inform. Sci. 2013, 237, 137–161. [Google Scholar]
- Shen, J.X.; Li, S.; Zhang, J.Y. Research on Influencing Factors of Big Data Industry Development Capability—Based on fsQCA Method. Sci. Tech. Manag. Res. 2019, 39, 140–147. [Google Scholar]
- Wang, B.; Han, S.; Ao, Y.; Liao, F. Evaluation and Factor Analysis for Urban Resilience: A Case Study of Chengdu–Chongqing Urban Agglomeration. Buildings 2022, 12, 962. [Google Scholar] [CrossRef]
- Zhang, M.; Chen, W.; Cai, K.; Gao, X.; Zhang, X.; Liu, J.; Wang, Z.; Li, D. Analysis of the Spatial Distribution Characteristics of Urban Resilience and Its Influencing Factors: A Case Study of 56 Cities in China. Int. J. Environ. Res. Public Health 2019, 16, 4442. [Google Scholar] [CrossRef] [PubMed] [Green Version]
- Wang, H.; Li, Y.; Liu, Y.; Qing, F.; Zhou, Y.; Chen, Y.; Fang, D. Study on the Influencing factors of urban economic resilience in post epidemic Era—A case study of Kunming City. J. Urban Manag. 2021, 10, 255–264. [Google Scholar] [CrossRef]
- Ma, F.; Wang, Z.; Sun, Q.; Yuen, K.F.; Zhang, Y.; Xue, H.; Zhao, S. Spatial–Temporal Evolution of Urban Resilience and Its Influencing Factors: Evidence from the Guanzhong Plain Urban Agglomeration. Sustainability 2020, 12, 2593. [Google Scholar] [CrossRef] [Green Version]
Publisher’s Note: MDPI stays neutral with regard to jurisdictional claims in published maps and institutional affiliations. |
© 2022 by the authors. Licensee MDPI, Basel, Switzerland. This article is an open access article distributed under the terms and conditions of the Creative Commons Attribution (CC BY) license (https://creativecommons.org/licenses/by/4.0/).