Abstract
Epidemiological studies have established a strong relationship between poor air quality and deteriorating human health, demanding urgent remedial measures. Specifically, indoor pollution is more critical, and outdoor pollutants significantly contribute towards indoor pollution, its strength depending on various parameters, including ventilation strategy, meteorological conditions, building design, outdoor sources, etc. This report analyses the various factors reported influencing the transmission of pollutants between the two environments. The report critically reviews various studies investigating the inter-environment variability and transmission, providing an overview of various factors and their impacts and covering both experimental and modelling studies. The review suggests that while many studies have helped to quantify the long-term personal exposure to pollutants, they have not paid special attention to the mechanism of the transmission of pollutants from the outdoor to the indoor environment and vice versa. The findings demonstrate that the proper indexing of various mechanisms and their relative strength is necessary before an effective intervention strategy can be applied in the built environment to counter the effect of pollution.
1. Introduction
The global COVID-19 pandemic has brought about lockdowns in various places around the globe, causing steep reductions in economic activities and the significant curtailment of emissions. The importance of good air quality was re-emphasised when multiple studies accentuated the improvement in urban air quality due to the restricted anthropogenic activities in early 2020 [1,2,3,4,5]. Observations by NASA [6] indicated a significant drop in NO2 emissions over Wuhan during the early stages of the pandemic against the data from the preceding year. As more and more people opt to work from home [7,8,9,10], along with future low-carbon emission trends, where exhausts from automobiles and factories are reduced, buildings become more air tight to meet energy efficiency targets, etc., it is pertinent to know the changes in indoor air quality and its likely impact on health and wellbeing. Renewed interest in studying the indoor–outdoor air quality and the interface between the two has been rekindled due to this transformation of indoor space usage [11]. Figure 1 shows how the two domains are variably connected, and how pollutants from either source can affect the air quality as air exchanges occur between them.
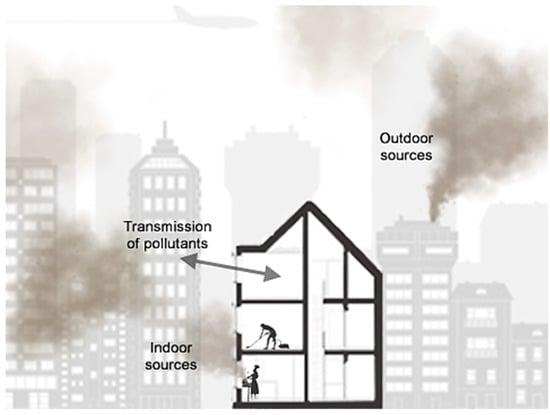
Figure 1.
Transmission of pollutants between indoor and outdoor environments.
While, conventionally, fixed air quality monitoring stations have been employed to monitor outdoor pollution levels, the actual inhalation exposure by people is quite different. This is because people spend a major portion of their time within indoor environments [12,13,14] (although there may be variations depending on the development stage of the country), soliciting the need to monitor indoor air quality (IAQ) closely. The study by Pope et al. [15] demonstrated that reductions in air pollution (particulate matter) are one key factor to improving life expectancy. Approximately 4.9 million deaths in the year 2017 were attributed to air pollution, both indoor and outdoor [16]. Concurrently, the State of Global Air [17] study indicated that approximately 6.67 million deaths occurred prematurely due to poor indoor air quality in 2019. Some reports also suggest that underlying conditions due to poor air quality could aggravate COVID-19 symptoms [18,19].
In addition, recent studies [20,21] have shown that atmospheric pollutants may provide a substrate for the transmission of viruses, including SARS-CoV-2. Realising the importance of air quality, it is no surprise that increased focus has been given to IAQ. For instance, the WHO has been advocating for improved air quality as part of their Sustainable Development Goals [22] since 2015. Similarly, various nations and states have set up pollution indices and controlling mechanisms to control the emission and spread of air pollutants due to increasing attention from political institutions [23]. Some regulations governing indoor air quality are shown in Table 1.

Table 1.
Maximum limit of pollutants as recommended by some bodies, sourced from [24,25,26].
Although, on the one hand, natural ventilation is considered to be a great strategy for improving IAQ, preventing the occurrence of sick building syndrome and reducing demand for energy [27], many other studies have indicated that natural ventilation may deteriorate indoor air quality [28,29] by transporting outdoor pollutants. The relationship can be seen in Figure 1. However, this is dependent on the pollutant, its chemical properties and source strength. Nevertheless, fresh air needs to be circulated in indoor spaces to flush out foul air, CO2 and indoor pollutants [30,31,32], and various guidelines have been created that dictate the rate of minimum fresh air to be circulated in indoor zones [33,34,35]. Outdoor pollution levels are, therefore, important components of indoor pollution [36], regardless of some variability. The aim of this work is to provide an overview of the various factors that influence the relationship between indoor and outdoor air quality.
2. Materials and Methods
The study by Milner et al. [14] reviewed various techniques and methodologies to assess indoor pollution levels. Although the study described each tool in detail with its applicability, the authors did not consider the impact of various external factors on the estimation. The review by Leung [37] discussed the effect of meteorology, and climate change on indoor air quality and how various studies established the relation between indoor and outdoor environments. The author stressed that although the use of the I/O ratio as an indicator of indoor pollution concentration with respect to ambient levels often has large variations, it is still a commonly assessed parameter. The I/O ratio is a dimensionless number, and is calculated by dividing the indoor pollutant concentration with the outdoor one. Additionally, there are varying influencing parameters, which have not been exhaustively considered in the literature. Their study, moreover, did not discuss these mechanisms of transmission or ways to mitigate the high levels of indoor transmission. The review by Ai and Mak [28] assessed the environmental quality of naturally ventilated buildings and concluded that urban planning and the building envelope design were the primary ways to mitigate poor air quality within them. This was further corroborated by Santamouris et al. [38]. They, however, did not investigate other modes of transmission or assess the influence of indoor activity.
This paper systematically reviewed the measured and modelled studies of pollutant transmission and relationships between indoor and outdoor environments. A better understanding of the transmission and infiltration characteristics of naturally ventilated buildings is necessary to allow for the design of healthy indoor spaces. Further, the urban context and meteorological parameters can influence the mechanism of pollution transmission. Despite the increasing studies on indoor pollution, the mechanism of the transmission of ambient pollutants is not clearly understood for naturally ventilated buildings due to a number of confounding factors. This review, thus, sought to address the gap in the literature pertaining to the review of the determinants of transmission and interaction between the two domains. The search criteria and methodology of investigation is shown in Figure 2. An extensive literature search was performed to identify publications on existing studies. Peer-reviewed journals, conference papers, technical reports and books from the last decade (with some exceptions) were searched using the Scopus and ScienceDirect search engines. The search was carried out using keywords such as “air pollution transmission”, “indoor outdoor relationship”, “factors affecting transmission” and “natural ventilation and indoor pollution”. Following a data collection process of identification, screening, eligibility analysis and inclusion, we selected and reviewed 120 articles (from an initial list of 440 articles). The study was limited to the review of factors or parameters linked to the increased severity of indoor air pollution and transmission, while discussions on mitigation and intervention strategies were considered beyond the scope.
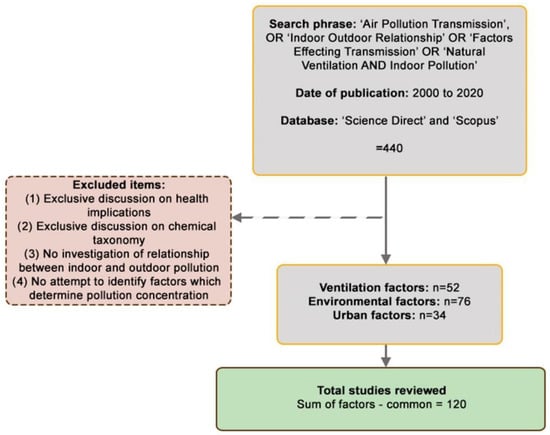
Figure 2.
Methodology of article selection.
While the health implications of pollution exposure are an important subject, it was not considered in this paper. Health-, wellbeing-, medical-, etc., themed journals have vastly covered this aspect, including the chemical composition and source apportion of pollutants. As more knowledge is gained about the role of spatial design on pollution distribution, better interventions could be planned to limit the infiltration, for instance, the window-opening angle. Further, future studies could explore the sensitivity of parameters, such as the penetration factor, with respect to different opening characteristics. Only studies that focused on transmission between the indoor and outdoor domains were reviewed.
3. Factors Affecting the Indoor–Outdoor Relationship
Outdoor sources of pollution primarily include the burning of fossil fuels (such as internal combustion engines in vehicles), industrial processes, fires, agriculture and volcanic eruptions [39,40]. Particularly, SO2, NOx, VOCs, NH3, CO, heavy metals, ozone, benzene, etc., and exposure to PM2.5 account for a significant health burden [41,42]. In some instances, such as PCBs, the primary source is indoors, which can migrate to an outdoor environment [13,43,44]. Indoor sources, such as smoking, cooking, cleaning and cleaning products, shedding from skin and/or clothes, indoor heating, etc., release pollutants such as VOCs, SO2, NOx, radon, etc., along with a microbial composition [45]. Even general daily objects, such as newspapers, fresh magazines and polishing agents, may release pollutants such as toluene [46]. A few of the prevalently studied pollutants are shown in Table 2. Many studies investigated the general concoction of solid particles and liquid droplets found in the air, called particulate matter (PM) [47], rather than focusing on an individual chemical. Apart from the chemical toxicity of the pollutants, their size is also responsible for many detrimental effects on humans [48]. The finer the PM, the deeper the penetration into the body and its consequent health implications.
Table 2.
Some commonly studied indoor pollutants and their sources, from [49].
Recent studies have shown that a pollutant generated inside a room can be transferred to other nearby indoor environments [50]. Many pollutants are common to both indoor and outdoor sources. Additionally, these pollutants may also penetrate into or outside the building, depending on the buildings and their surrounding conditions. The three primary modes of the transmission of pollutants between the two zones are natural ventilation, mechanical ventilation and infiltration [51,52]. Additionally, indoor–outdoor parameters further influence the transmission, such as outdoor weather condition, temperature difference between the two environments, surrounding urban landscape, indoor activity, furnishing, etc. A typical cross-section of a building next to a street is shown in Figure 3, along with various factors affecting the transmission of pollutants.
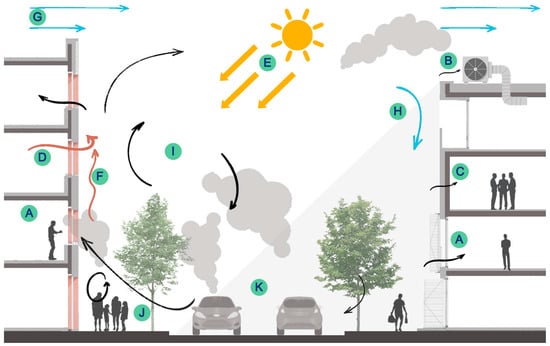
Figure 3.
Factors affecting transmission between indoor and outdoor environments: A—natural ventilation; B—mechanical ventilation intake; C—infiltration; D—buoyancy-driven ventilation and cross-contamination; E—solar radiation; F—thermal plume due to surface heating; G—prevailing wind (speed/direction); H—flow into canyon; I—recirculation in urban canyon; J—local amplification due to street elements such as trees; K—local source such as cars.
4. Natural Ventilation
In this mode, doors, vents, windows, skylights and other purpose-built fenestrations are merely left open to the outside environment, allowing for the exchange of air [53,54] In most cases, the air is driven by pressure and thermal gradient across the opening, shown as factors A and D in Figure 3. This mode of ventilation does not include the unintentional air exchanges that may occur across buildings, such as infiltration via ducts, cracks, etc. When configured correctly, NV can substantially offset the energy consumption in comparison to mechanical ventilation systems [28], and it is also associated with better indoor air quality with fewer occurrences of sick building syndrome [55]. While MV has a small percentage of fresh air intake (depending on the system configuration), ordinary buildings may have to open doors/windows to dilute stale indoor air and maintain a good IAQ. However, as the air, in this case, is not conditioned, it also allows the entry of outside air contaminants (Figure 4). Thus, openings on a building envelope allow the movement of pollutants from either environment depending on the indoor conditions, local weather and surrounding context. Many schools, residences, etc., and major building stock in developing countries—which, in particular, are highly polluted areas—the indoor air is naturally ventilated [56], necessitating the appraisal of parameters that influence the transmission of pollutants in this mode of ventilation.
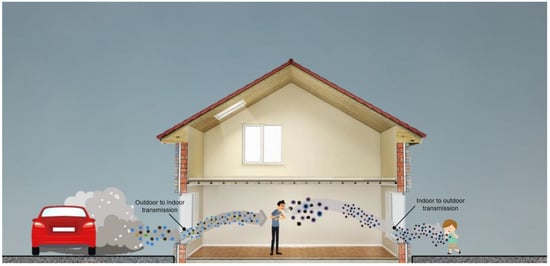
Figure 4.
Pollutant transmission between indoor and outdoor environments through crossflow natural ventilation.
Several studies have analysed the existing pollution level in such naturally ventilated spaces in relation to the ambient levels occurring in the building vicinity. Błaszczyk [24] measured indoor and outdoor pollution levels in two naturally ventilated kindergarten schools in Poland. In the urban school, all measured I/O ratios were less than one, including SO2, NO2 and PM2.5, where the author did not find an indoor source of pollutants. However, in the case of the rural school, the I/O ratios were greater than one, as the school had a kitchen stove fired with coal and a gas stove. Further, the authors were able to identify a statistically higher concentration of NO2 in an urban school environment due to the presence of road and traffic nearby. Although the author established that the calculated I/O ratios indicated the presence of ambient pollutants inside the school, the observation could not be generalised, since their sample size was small and the sampling period extended for a few weeks only. They investigated just one room in the two schools, one on either site.
Similarly, Stabile et al. [57] investigated air quality in five naturally ventilated classrooms, spread across three schools in the urban area of a central Italian town. Although the focus of the experiment was on measuring CO2 levels, they also quantified PM2.5 and PM10. The researchers identified an inverse relationship between window-opening time and CO2 levels, while a positive trend was observed for particulate matter number concentration. Winter days had a distinctly higher CO2 level compared to summer, as the fenestrations were usually kept shut. They observed a sudden increase in particulate matter concentration when the window or door was open during winters, indicative of higher outdoor PM concentrations, despite indoor sources such as chalk, student movement, etc. However, the study was conducted on a typical day during either season and cannot be extended for other buildings. Site conditions were also not reported, which caused it to be difficult to assess the influencing parameters.
Chen et al. [58] and Hassanvand et al. [59] measured indoor and outdoor particulate matter concentrations in various naturally ventilated sites, including schools and old-age homes. Both studies observed a close correlation between the indoor and outdoor concentration for fine PM levels, independent of the activity inside. However, coarse particles showed a weak correlation, and the contribution from the outdoor air in this size range was low. They concluded that while fine particles (PM2.5 and PM1) primarily travelled from the outdoor environment, the coarse particles were primarily of indoor origin, which were subjected to the dynamic internal environment. However, the authors did not indicate the window-opening/operating schedule, which was implemented during the experimental campaign.
Apart from particulate matter, bacterial composition in indoor air also impacts the quality and wellbeing of occupants. To this end, Harbizadeh et al. [60] measured bacterial and particulate matter concentrations in six day-care centres in the city of Ahzad, Iran. Among the three site conditions, the highest I/O ratio for bacterial and PM concentration was found for the buildings located in the high-traffic region (see Figure 4). Further, the highest pollutant levels were observed during the cold month of February, which the authors attributed to dust storms. They observed a positive correlation between airborne bacteria and particulate matter, and concluded that the use of open windows for natural ventilation was the main cause of transmission. Although the small number of samples and sampling period used in the study prevents the generalisation of results, the authors point to the fact that despite a lower bacterial I/O ratio in winters, the absolute concentration of aerial bacteria was worst in winter amongst all other seasons. Thus, the measurement of only the I/O ratio may not reveal finer details of air quality, and pollution studies should attempt to measure the absolute pollutant levels as well. This can be observed in Figure 5, where the I/O ratio of 4.38 had a higher absolute concentration of bacteria than the I/O ratio of 19.33.
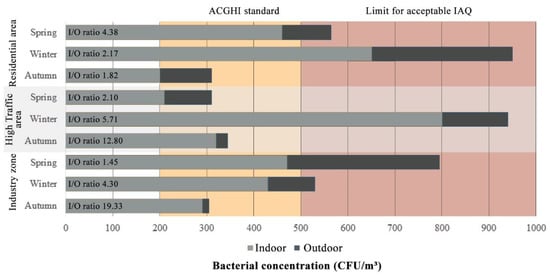
Figure 5.
Bacterial concentration and I/O ratio in three seasons and three site conditions, results from [60].
Zhao et al. [61] studied aerosol particles from 0.01 μm to 10 μm in 40 different houses in two cities in Germany over two seasons. Natural ventilation by window opening was the primary mode of fresh air. They observed two indoor peaks of coarse PMC during the day, which they related to indoor activity in the morning and evening. However, the indoor PM1 trend closely followed the outdoor trend, indicating an outdoor influence. In terms of PNC, the majority of the indoor population of particles comprised of ultrafine particles. They demonstrated that, during the cold season, due to lower ventilation rates, the particles remained longer indoors, while, in summer, due to increased ventilation rates, the air from outside diluted the concentration and the particles were removed.
Nevertheless, the indoor variation followed the outdoor variation closely in the warm season due to longer window-opening times. Further, they establish that the I/O ratio of particles in the size range 100–200 nm was the highest under steady-state conditions. The study, however, lacked a large representation of houses within each site condition, and they were not able to identify the impact of environmental conditions on the pollution level. However, they indicated that submicrometric particles were primarily of outdoor origin.
To explicitly evaluate the impact of window opening on pollution transmission, Chiesa et al. [23] carried out an experiment involving the measurement of PMC and PNC before and after opening a window in a room. Results from the winter measurement of 35 dwellings located in Brescia, Italy, were presented. It was observed that the I/O ratio of all PM sizes increased after the window was opened. Further, the range of the data was reduced, indicating a strong influence of outdoor sources of PM. The results were further corroborated when the indoor PN distribution curve closely followed the outdoor trends. Similar conclusions were drawn by Wang et al. [62], who showed that the indoor concentration of PM2.5 in a residential flat with an open window was closely associated with outdoor levels. However, when the window was shut, the concentration gradually declined. Even under occupied conditions, Rim et al. [63] observed a strong dependence of pollution levels on window-opening time. Their results showed that, while temperature and CO2 concentration increased when the windows were shut, the concentration of particulate matter decreased in the PM2.5 and PM10 range.
Similarly, Yang et al. [64] measured the indoor and outdoor concentrations of PM2.5 and O3 in a student dormitory in Nanjing, China. Additionally, 353 dormitories were surveyed with a questionnaire, wherein general air quality and window-opening responses were captured. Although they showed that closing the window was an effective way to reduce the transmission of outdoor pollutants, the mere measurement of just one sample for a period of a month did not account for generalising this claim. The study was limited, wherein, based on a qualitative survey, they drew a correlation between natural ventilation and air quality. Nevertheless, the study revealed that people perceived indoor air quality based on outdoor air quality. Future studies should aim to explore this relationship rigorously.
In brief, the opening of windows has a large effect on the air exchange rate, varying between 1 and 2 ACH [65]. Higher rates are also possible, albeit sporadically and based on meteorology. While some studies indicated a strong outdoor link to finer-sized particles, others came to the same conclusion for all size bins, yet others derived inverse trends. This may prove difficult to establish health regulations, as various studies claim contradictory results. Moreover, the opening of windows is also governed by other factors, such as thermal comfort and CO2 accumulation, which may have an inverse relationship with the concentration of other pollutants. The interplay of rather contradicting factors usually confounds the effective operation of this mode of ventilation.
In the case of experimental measurement of the indoor–outdoor link of pollution in naturally ventilated zones, most researchers assumed a well-mixed air zone. However, this simplified approach may not represent the true scenario, as was indicated by [66], who observed a rapid drop in tracer gas concentration near a window when opened from a closed-state—an indication of an increased air exchange rate—while the other areas of the house had relatively no change. Additionally, most assessment studies did not indicate the impact of window dimension on the air exchange rate or particle penetration, which also affects the air exchange rate [66,67] and, consequently, air quality. Table 3 lists the I/O ratios presented in a few studies of naturally ventilated spaces.
Table 3.
Mean I/O ratios for naturally ventilated building studies; * indicates the median value.
5. Mechanical Ventilation
In this mode of ventilation, the air is supplied, regulated and conditioned with a mechanical system such as a ventilation fan or an air conditioner or by a central conditioning system [37]. In some cases, mechanically ventilated buildings have no operable windows or cannot be operated by occupants, and all the fresh air is directed through installed systems [53]. In such cases, the location of the intake vent, the filtration and air treatment efficiency of the HVAC systems, the location of ducts, etc., determine the transmission of pollutants. This is shown in Figure 6. Most commercial building stock in developed countries uses mechanical ventilation, necessitating the need to understand the mechanism of air filtration in these systems.
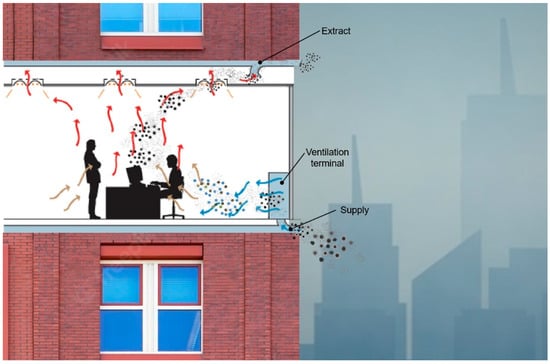
Figure 6.
Pollutant transmission between indoor and outdoor environments through mechanical ventilation.
Indoor and outdoor measurements were conducted in a mechanically ventilated office building in Helsinki, Finland, by Koponen et al. [73] for 25 days. They observed that the indoor concentration was one order of magnitude less than the outside pollution concentration, and the diurnal variation of the indoor level was quite small. Particle concentrations in the accumulation mode (0.09 μm to 0.5 μm size range) were observed to increase when the ventilation was switched on, while the concentration of particles of less than 0.09 μm decreased simultaneously. In fact, the indoor concentration level closely followed the outdoor levels during weekdays, indicating a strong relationship between indoor and outdoor levels of PM0.09–0.5. The study was, however, conducted for a short duration, and no correlation was drawn with outdoor environmental conditions. Chen et al. [74] carried out a monitoring study in a mechanically ventilated campus building in Singapore before and after a haze incident, where the outdoor PM2.5 mass concentration rose to 10 times the average clear day values. They observed that the filter (MERV 7) installed in the air conditioning system was effective in filtering coarse particles (>3 μm), whereas the fine particles, especially in the range of 0.3–1.0 μm, freely penetrated into the indoor space and was closely associated with outdoor conditions. In fact, the working of the air conditioner system increased the I/O ratio in the finer particle range; however, the observation was not statistically significant.
The type of ventilation system and filter put in place significantly affects the transmission of pollutants. Quang et al. [75] measured indoor–outdoor PN and PM2.5 mass concentrations in three office buildings in Brisbane, Australia, with three different filter systems. They found the highest efficiency of filtration for electrostatic filters, approximately 60%, as they recorded the lowest I/O ratios in particle number concentration. The FCU filters were the least effective (20%), followed by deep bag filters, which ranged from approximately 26 to 46%. However, the I/O ratio of PM2.5 mass concentration followed a reversed trend, which was likely due to indoor sources. They also noted a high concentration in one of the buildings due to the placement of the intake duct in the proximity of an outdoor source. In fact, the review by Yu et al. [76] provided a good comparison between the various air conditioning systems in terms of their filtration efficiency and impact on human health.
Similarly, Zhou et al. [77] investigated two offices with different ventilation conditions in Nanjing, China. Both were located on the seventh floor of the same building. Their results showed that when occupants were in the space, the I/O ratio increased if the space was mechanically ventilated, while the trend was the opposite for a naturally ventilated space. The occupants’ activity, they claim, led to the resuspension of particles, which, in the case of NV, were diluted by the higher air exchange rate. They indicated that the I/O ratios for both PM10 and PM2.5 were lower in the case of the mechanically ventilated space when compared with natural ventilation; however, the ratio was quite high in the case of an occupied mechanically ventilated space with no filters. An inverse association was found between particle size and the corresponding I/O ratio when the space was mechanically ventilated. Wang et al. [62] also showed that the use of MV in airtight spaces increased the I/O ratio due to the higher air exchange rate. However, both studies were conducted over a short period, thereby limiting the ability to generalise the results or identify the underlying factors.
Thus, the improvement of air quality with MV requires a detailed analysis of operation times, filter type and their location, indoor source/sinks, etc. Figure 7 shows the efficiency of HVAC filter types for various particle size ranges. Most studies were limited in space and time, and generalised the results based on a small period of measurement. Very few studies actually investigated the transformation mechanism of pollutants when transported indoors. The mechanism was shown to modify the I/O ratio [78]. While the effectiveness of particular systems is well researched, including a comparative analysis of operation modes, the transmission mechanisms are still understudied. Future studies should investigate this in detail to help understand how various environmental factors may influence the choice of operation.
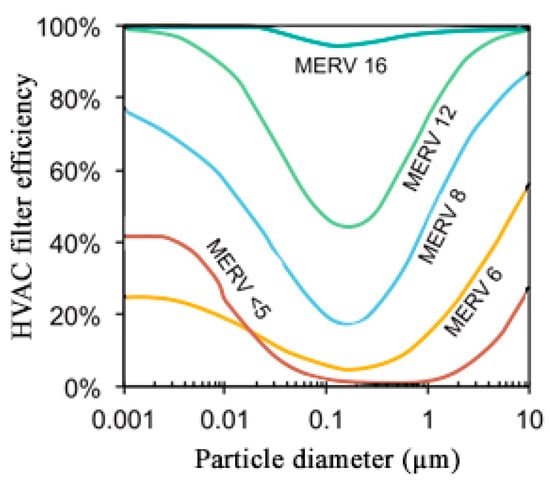
Figure 7.
Variation of filter efficiency through various particle sizes, reprinted with permission from [79].
6. Infiltration
Pollutants can also enter buildings through envelope cracks, gaps around fenestrations and other building faults (see Figure 8), apart from the above-listed modes, which are not intentionally designed for this. Factors such as the air exchange rate, pressure gradient across the building fabric, size of the particle and crack geometry strongly determine the penetration of particles [80,81] and can be significant for buildings with poor sealing [37]. A study by de Blas et al. [82] showed that I/O ratios inside a test room, which was sealed with no windows or fresh air supply, had an I/O ratio close to one for outdoor source pollutants, whereas the pollutants which were known to be produced within the same building showed a ratio greater than one. The study, however, did not conduct a detailed transformation and accumulation analysis of the pollutants.
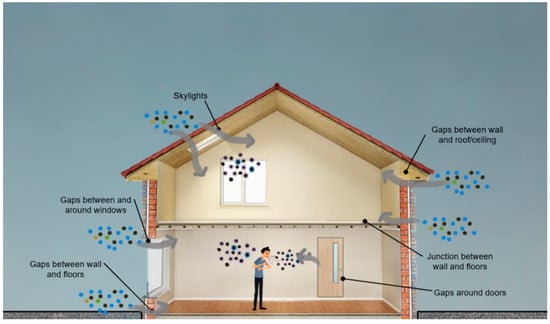
Figure 8.
Pollutant transmission between indoor and outdoor environments through infiltration.
Additionally, building elements such as stairwells, elevator shafts, electrical conduits, etc., may also serve as pathways for air infiltration, especially in commercial buildings [83]. To this effect, Choi and Kang [84] studied the effect of envelope airtightness on the penetration of particles in 14 residential flats in Korea (Figure 9). They observed that the I/O ratio of finer particles was consistently higher for all air tightness conditions. Additionally, the I/O ratio decreased within each size bin with an increasing air change rate. A positive relation was found between effective leakage areas (ELAs), which quantified the equivalent number of holes in the envelope, and the penetration of particles, although the results were not statistically significant. They concluded that even moderately airtight apartments in the region were susceptible to outdoor infiltration, and as the buildings grew taller, and were exposed to higher pressure differences, the penetration was significant. The units chosen were, however, naturally ventilated with a range hood in the kitchen and an exhaust fan.
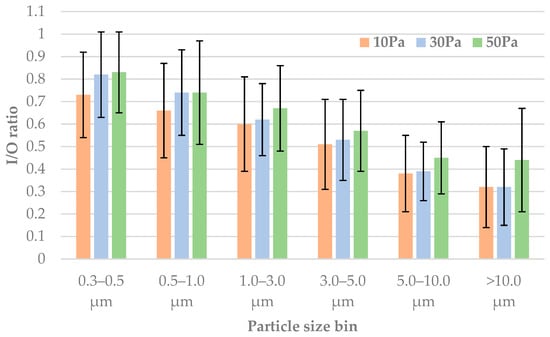
Figure 9.
Measured I/O ratios from the study by [84].
Infiltration studies, such as [23,85], investigated the impact of the energy class of buildings on the infiltration of pollutants. High-energy-class buildings have better insulation and airtightness of the building fabric. While Chiesa et al. [23] found that the energy class had a strong negative correlation with indoor concentration for both ultrafine and coarse particle size ranges, Thomas et al. [85] found a similar relationship for ultrafine particles only. Wang et al. [86] showed that the I/O ratios of PM2.5 were high when the outdoor PM2.5 mass concentration was less than 75 μg/m3. They indicated that, in such instances, the particles accumulated more in the coarse size range, penetrate less into the indoor space or the deposition of such large particles played a more significant role in building cracks. The mean I/O ratios varied from 0.25 to 0.91 for the different monitored spaces, which were unoccupied and closed. The study, however, failed to collect a significant number of data points, so much so that one of the locations was measured only once. The relative absence of data and other information such as size distribution, etc., makes it difficult to generalise the conditions. Their aim, being to assess the effectiveness of using iron as a tracer element for PM2.5, also lacked enough analysis to indicate its reliability. Another inherent limitation of field experiments is that there are many factors which influence the results which cannot be measured or accounted for.
In summary, particle penetration is significantly affected by airtightness and fabric design. In spite of the variation in published results, most studies found that finer particles penetrate into buildings much more easily as compared to the coarser size range. The PM size of approximately 0.3 μm had the highest penetration, which gradually decreased towards either size range. The reduction was more prominent towards larger size ranges up to approximately 10 μm. Areas around windows/door jambs are prone to penetration due to faults. Coupled with increasing airtightness standards around the world (such as Passivhaus), in response to more awareness about energy and climate change issues, it becomes essential to understand the relation between building fabric design and the transmission of pollutants and accordingly design mitigating strategies Such buildings usually have reduced dilution of indoor-generated pollutants [85].
7. Meteorology
Most exposure studies, while measuring pollution concentrations, also take note of meteorological data such as temperature, humidity, etc., since weather conditions significantly affect outdoor pollution concentrations and dispersion, which, subsequently, affect the interactions with indoor environment [87]. The focus of the review was restricted to the impact on transmission, and not on the absolute conditions in the outdoor environment. The difference in indoor and outdoor temperature can result in the exchange of air due to the stack effect, also known as buoyancy [88]. Niu and Tung [89] found that warmer air near the upper portion of a floor was driven out by incoming cold air from the bottom of the window in the case of single-sided naturally ventilated buildings (factor D in Figure 3). The rising warm air outside could re-enter upper floors with pollutants from below (Figure 10). The phenomenon was amplified during windless conditions and the presence of solar radiation, which heated up the canyon and building surface (factor F in Figure 3). This was further corroborated by Mao et al. [90], who showed that, in gentle breeze conditions, the re-entry ratio of a high-rise flat immediately above the source was approximately 25%, driven primarily by the rising thermal plume. Simultaneously, the coverage of the tracer gas on the shady side was found to be nearly half of the sunny side.
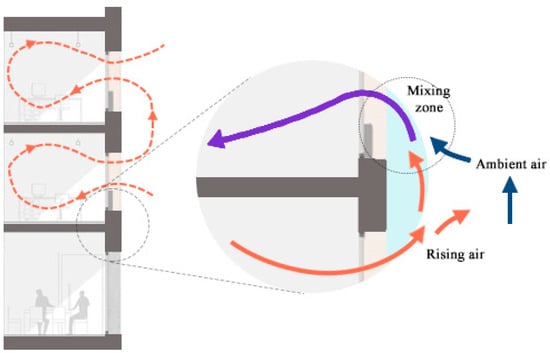
Figure 10.
Transmission of air particles in the case of buoyancy-driven single-sided ventilation, adapted with permission from [88].
Studies of particulate exposure have also indicated a diverse range of relationships between temperature, humidity and PM levels. Tippayawong et al. [91] found a significant negative correlation between temperature and indoor PM2.5 concentration in a naturally ventilated school on top of a four-story building during daytime in Thailand, while, during night-time, a negative correlation was observed. They further indicated a strong positive correlation of relative humidity with submicrometer particles during the daytime. However, the larger particles showed a negative correlation during the night. On the contrary, Chan [87] reported that an increase in outdoor temperature led to a higher migration of particles into indoor spaces. Wallace et al. [65] calculated an increase in air change rate of 0.2 h-1 when the temperature difference was 10 °C. Lv et al. [52] found a statistically significant positive correlation between relative humidity and indoor PM2.5 concentration of 110 buildings measured during the summer period in Daqing, China (see Table 4). On the other hand, Chithra and Nagendra [69] found an inverse relation. However, the period of high humidity was associated with rains, which could have washed away outdoor pollutants. Finally, the difference in indoor and outdoor temperatures can also force pollutants (such as PAHs) to undergo redistribution between the gaseous and particulate phases, altering the exposure levels [72].
Table 4.
Correlation (Pearson coefficient) between indoor PM2.5 and relative humidity [52].
Temperature may also play an indirect role in transmission by influencing the mode of ventilation. Many studies have indicated that occupants keep windows open for a longer duration during summer to allow for a higher air exchange rate [92,93,94]. Thus, the seasonal variation of window-opening schedule and ventilation practice could significantly impact indoor pollution. Fromme et al. [95] found that, on average, indoor PM levels of 64 Munich schools were strongly dependent on outdoor levels during summer periods, while winter PM levels were dependent mainly on indoor activity. However, they did not find a statistically significant relation with humidity. Rosati et al. [96] found that relative humidity played a role in the resuspension of particles from carpets, although the relationship was dependent on the age of the carpet. While RH had an inverse relation with the emission factor for old carpets, a positive correlation was observed for new carpets. The authors attributed this observation to the presence of a stronger electrostatic charge in new carpets. The presence of a damp atmosphere may also exacerbate air quality by elevating the growth of microorganisms and inducing chemical reactions [45].
Wind direction and speed are known to alter the indoor air quality regime, specifically high wind speeds and pressure differences that promote air exchanges, consequently leading to the transportation of particles into buildings [72] (see factor G in Figure 3). Although, in some cases, if the indoor sources are strong, higher wind speeds can be desirable to remove the pollutants [97]. A two-year-long measurement study of a classroom by Chithra et al. [69] found that the effect of wind was dependent on regional pollution sources. They found a significant positive correlation between wind speed and indoor PM concentration when the wind was blowing from the direction of a major road. Consequently, no such observation was determined when the direction was from elsewhere. In general, I/O ratios of PM2.5 and PM1 decreased with increasing speeds. Additionally, in hot and dry conditions, strong winds may increase outdoor PM concentration through resuspension [69]. On the contrary, [23] found that wind speeds greater than 1 m/s improved the air quality of a naturally ventilated room by increasing the air exchange rate. On the other hand Orza et al. [98] showed an inverse relation between wind speed and particle concentration for particles smaller than 0.8 μm and a positive relation for particles larger than 7.5 μm. Similarly, the study by Lang et al. [99] indicated that wind speed had a positive correlation with the PNC of particles in Aitken and the accumulation mode, and a negative correlation with the nucleation mode. Figure 11 shows the size ranges of the various pollutant particles.
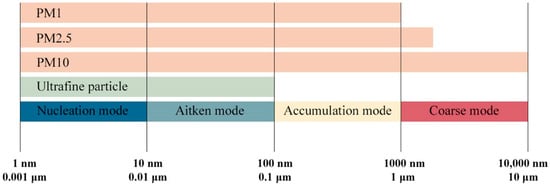
Figure 11.
Particle size classification, adopted from [100].
Drawing a generalised conclusion about the effect of meteorology is difficult, as various studies have reported a broad range of impacts. For instance, solar radiation may heat up the building façade and drive a thermal plume to aggravate pollution levels on some floors, while it may also induce an unstable atmospheric condition and cause the dispersion of pollutants. Thus, local and regional context plays an important part in determining the relative contribution of each factor. Moreover, very few studies measured all parameters and pollution levels concurrently and for a sustained duration of time to be able to derive a statistically significant relationship. Most studies were limited in time, space and budget to be able to cover enough samples spread across a diverse range of characteristics.
8. Urban Context
Urban features, such as deep street canyons, massive building footprints, inadequate open spaces, etc., can amplify outdoor pollution levels by hindering dispersion [101,102]. Even street elements, such as trees, can prevent the dispersion of pollutants in certain wind conditions [103] (see factors H–K in Figure 3 and Figure 12).
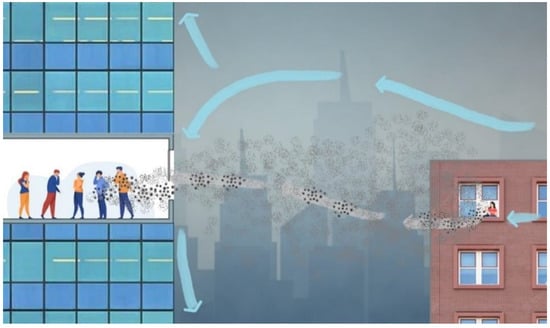
Figure 12.
Transmission of air particles from a source building to a naturally ventilated leeward space, impacted by urban wind patterns.
A review by Ai and Mak [28] indicated that when street canyons are deep, the winds in the canyon and above the canyon become decoupled at lower speeds. This potentially leads to local airflow in street canyons when ambient wind is perpendicular to the street. This can concentrate pollutants on the leeward side of the building, significantly deteriorating the air quality there. Yuan [40] simulated eight different urban geometry forms using CFD. Their results showed that strategies such as the higher permeability of urban forms, building separation, stepped podiums, etc., facilitated the convection of air, thereby dispersing pollutants (Figure 13).
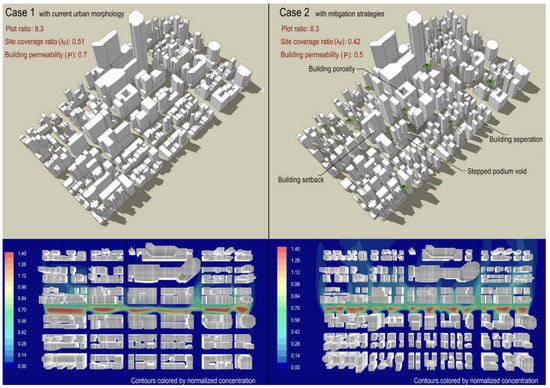
Figure 13.
Simulation results from the study by [40] (Reprinted with permission from [40]), comparing pollutant concentration in an urban area with and without intervention strategies. The main street in Case 1 shows higher patches of red as compared to Case 2, which implemented some design strategies to make the urban form permeable to the wind.
Pollutant concentration may also vary with height, governed by atmospheric conditions and source strength. Menichini et al. [13] found that, on average, the BaP concentration in Rome, Italy, at road level was double the concentration found at the height of 20–30 m. Air monitoring on four building roofs revealed a drop in PAH concentration by a factor of ten in comparison to the road level. Similar observations were determined by Challoner and Gill [104], who showed a general decrease in outdoor PM concentration with increasing height in Dublin. They stressed the importance of carefully locating the intake duct of a mechanically ventilated building to avoid the entry of pollutants. Two of the ten MV offices unusually recorded high PM concentrations, even when the intake duct was located on the roof. The researchers attributed this to a local exhaust duct near the intake of the mechanical system, which amplified the indoor concentration through re-entry. Similarly, other estimates showed that, at a height of 25 m, the concentration of pollutants was one-fifth of the value at road level [105].
The presence of nearby buildings can modify the ambient wind flow and, subsequently, pollution dispersion. Chavez et al. [106] showed that when a building was introduced downstream of a pollutant source, the recirculation of air could concentrate the pollutant in the space between them (Figure 14). The presence of a downstream building further amplified the concentration. Similarly, studies such as [103,107,108,109,110] investigated the effect of roadside vegetation on the dispersion of pollutants. While some studies have claimed that trees can amplify local pollution levels [103,107] in streets, other studies have claimed the opposite [108,111,112]. This was dependent on the parameters considered, such as tree porosity, height, deposition velocity, emission source and strength, wind speed and direction, canyon depth, etc. [110,113]. Therefore, the results greatly varied between studies, as the combinations of parameters considered were not consistent between them. While Refs. [107,109] did not take into account the deposition of pollutants on tree surfaces, Refs. [110,114] combined the dispersion and deposition models. Since the influence of outdoor urban features does not directly impact indoor–outdoor transmission, further discussion is beyond the scope of this paper. Janhäll [115] provided an in-depth analysis of the effect of urban vegetation on pollution levels.
Figure 14.
Normalised pollutant concentration from study [106] (Reprinted with permission from [106]), showing the change in the dispersion of pollutants with the addition of buildings: (a) isolated building case; (b) additional building upstream of pollutant source; (c) a third building downstream of the pollutant source.
In most of the studies, the focus was on outdoor environmental quality, and how urban features may modify the ambient concentration. Although by knowing the ambient concentrations and modifying parameters, the exposure occurring indoors could be calculated. However, there is a high level of uncertainty in this method. Very few studies have attempted to quantify transmission by varying outdoor parameters. This may require measuring or modelling both the indoor as well as outdoor environments simultaneously and performing sensitivity analyses. The studies which simulated a coupled environment, such as [116,117], did not vary outdoor and urban features to reflect their impact on indoor air quality. A future investigation should look into this and develop a combined model for the assessment of indoor quality. Studies which used an analytical tool to predict indoor concentration based on outdoor concentration may lack in sufficient accuracy.
9. Indoor Activity
There is a myriad of indoor pollution sources, such as cooking, cleaning, smoking, etc. Even the movement of occupants can cause the resuspension of particles or release microorganisms. Pallarés et al. [70] measured indoor and outdoor PM2.5 and PM10 concentrations in three schools in Spain during and after the occupancy period. They observed an increase in the I/O ratio of two schools when it was occupied, suggesting that student movement and activities such as chalk on the blackboard contributed to particulate matter in the indoor environment. This was further corroborated by studies such as [118] and [58], which also found an increase in coarse size particle concentration during occupancy hours of a naturally ventilated school. On the contrary, [91] did not find any evidence of occupancy on the I/O ratio when carrying out a monitoring study in a NV school in Thailand.
Similarly, studies by Lazaridis et al. [119] and Heo et al. [120] found higher I/O ratios during occupied periods. The observations were determined in an apartment, office and subway station. However, the results were inconsistent in many studies, as other monitored sites did not record a similar trend [70,119]. The authors explained these inconsistencies with various hypotheses, including limited air exchange during unoccupied hours, which would, as a corollary, cause the accumulation of pollutants in indoor spaces. In general, the presence of occupants suggests physical activity in the space, which causes the resuspension of particles, in addition to the exhalation of CO2. However, due to the complex interaction of occupants with their environment, such as window opening, the absolute air quality in the internal space may greatly vary, and determining a pollution prevention strategy depends on the specific case.
Cooking is another significant indoor activity which releases particulate and organic aerosols. Ji and Zhao [121] conducted a measurement of 90 residential rooms in Beijing during a two-month period. They found that, on average, cooking contributed approximately 19.34 μg/m3 and 3.85 μg/m3 to the indoor PM2.5 concentration when the windows were closed and open, respectively. However, the relative contribution of outdoor sources was always greater in both cases. Cooking contributed to approximately 15%~50% to indoor pollution levels, depending on the intensity of cooking activity and window ventilation mode. MacNeill et al. [122] reported that cooking activities contributed to fine and ultrafine particles and estimated approximately 6–7 μg/m3 of indoor PM2.5. According to Lebret et al. [123], from measurements in over 300 homes, one cigarette would add 0.8 μg/m3 to the daily average indoor PM2.5 concentration. Other studies, such as [122,124,125], assessed contributions from various daily activities, such as washing, vacuuming, candles, incense, etc., and presented their findings. For instance, Shinohara et al. [126] observed that dusting increased PM2.5 and PM10 concentrations by up to 6.3 and 16 times, respectively, against ambient levels. This was much more than the increase due to the use of vacuum cleaners (both the cyclone type and paper-pack unit). Vacuum cleaners led to an increase ranging from 1.3 to 3.3 times the ambient levels, depending on the machine and the particulate size.
In summary, the number of studies focusing on the effect of indoor activity on the transmission of pollutants remains limited. Most studies investigated the exposure level due to a certain activity or without one, rather than identifying how such an activity would change the transport of pollutants. For instance, the movement of occupants resuspending particles is well studied, while the change in the air exchange rate due to their activity is not. Future studies should focus on such aspects as well, to understand their mechanism better. Nazaroff [127] noted that more sophisticated models, such as CFDs, were required to accurately model and understand source–concentration relationships; however, the same holds true for understanding activity–transmission links.
10. Particle Deposition
While penetration factors determine the efficiency with which outdoor particles migrate inside, the particle deposition rate quantifies the percentage of indoor particles lost from indoor air by settling and depositing on surfaces. Some studies suggested that the deposition of particles, such as PM2.5, is beneficial, as deposited particles cannot be inhaled unless resuspended [128]. Particle deposition is described in the unit hr−1, and is driven via three major mechanisms [129]: gravitational settling, Brownian diffusion and inertial impaction. The relative contribution of each mechanism is dependent upon the particle size and nature of the surface.
The study by Ji and Zhao [121] showed that as deposition velocity varied from 0.21 hr−1 to 0.63 hr−1, more particles were deposited on indoor surfaces, leading to a decrease in PM2.5 concentration. Similarly, the study by Park et al. [51] found that for both modes of ventilation (NV and MV), the indoor concentration of PM2.5 was less than outdoor when there were no indoor sources. They suggested that deposition on indoor surfaces and/or inside air filtration devices led to lower concentrations indoors, as well as reduced daily swing as compared to outdoor conditions.
The deposition rate is a function of particle size, airflow property, deposition surface characteristics, etc. [12]. Using the results by Feng et al. [130], Zhou et al. [77] showed that large-sized particles had a higher deposition rate in building cracks. On the contrary, finer particles were easily transported indoors. This was further corroborated by Riley et al. [131], although there was disagreement about this in the literature, and was shown by Lazaridis et al. [119], who suggested that smaller particles have a higher deposition rate as compared to particles in the accumulation mode. The review by Diapouli et al [132] notes a significant variation of reported values in literature and Table 5 shows few of the reported deposition rates.
Table 5.
Deposition rate as a function of particle size, as reported by [132].
The study by Liu et al. [67] measured the variation of the PM2.5 deposition rate as a function of the air exchange rate. They conducted field measurements in two unoccupied, naturally ventilated classrooms of a university in Nanjing, China. On average, they observed that the particle deposition rate increased with an increased ventilation rate. They presented the results in the form of particle deposition velocity given by,
where is the deposition velocity representing mass transfer from air to surfaces, β is the deposition rate in hr−1, V is the total volume of the room, while ∑A represents the sum of all available areas for deposition. They suggested that assuming a constant deposition rate could give an incorrect I/O ratio, as the rate also depends on the ventilation and air exchange rate, and, as such, the equation connecting the two is shown below, where a is the air exchange rate.
While deposition can constitute the loss of particles, modelling the same can be quite a challenge. Depending on the focus of the study, various models have been incorporated and used to explain the observation [12]. The wide range of reported values and the absence of a uniform mode of evaluation could produce erroneous results. Moreover, many modelling studies, especially the ones involving CFDs, used a simplified model, ignoring the phenomena of deposition altogether. Future studies should look at standardising the process to account for deposition and characterising its contribution in various scenarios.
11. Summary, Knowledge Gaps and Recommendations for Future Research
The review identified several factors influencing the exchange of pollutants between indoor and outdoor environments. Results from relevant studies were presented and discussed within each factor. The following Table 6 list the knowledge gap and aspects of further investigation within each factor.
Table 6.
Summary of identified determinants and recommendations for future studies.
12. Conclusions
The review highlighted various factors and determinants which play a role in the transmission of pollutants between the indoor and outdoor environments. Three primary modes of air exchange are natural ventilation (through intentional openings across the building fabric), mechanical ventilation (through the use of active systems to force airflow) and infiltration (i.e., unintended air leakage/entry via openings and faults). Outdoor and indoor conditions further affect these modes of ventilation. Temperature differences, wind pressure, humidity, atmospheric stability, urban context, fabric design, indoor activity, etc., can differentially modify particle transmission. Studies have attempted to establish how these factors may influence pollutant flow using a variety of methods, ranging from experimental observation to physics-based simulation. The following areas were identified as requiring more research and analysis:
- A number of factors influence the transmission of pollutants between the indoor and outdoor environments. This includes both from indoors to outdoors and vice versa. Most studies were unable to account for the diverse range of factors and instead, focused on a couple. There is a need to simultaneously measure the contribution of each factor and its relative magnitude. More studies should explore this.
- Studies which endeavoured to ascertain the impact of various determinants often performed measurements in different buildings/spaces, which had differences in construction technology and/or fabric design. Very few studies have attempted to draw a comparison between the same buildings/spaces when subjected to multiple environmental conditions. Perhaps a manufactured unit placed in multiple spots such that the building’s characteristics remain the same and only a comparison of influencing parameters can be performed.
- While long-term exposure models are definitely essential to understand the role of indoor IAQ and health, short-term studies can gauge how building design and sheltering mechanisms can prevent episodic scenarios, such as disease outbreaks, dust storms, volcanic eruption, etc. Thus, increased attention is needed on the sheltering mechanism of building fenestration. Very few studies have been carried out in this regard.
- Within the studies on the transmission of pollutants, building typology is unequally represented. While a significant quantity of studies has investigated residential buildings and schools, commercial complexes and offices are underrepresented. A diverse range of houses and schools has been studied, with differences in ventilation strategies, occupancy, daily routine layouts, etc., while most studies on commercial spaces investigated the variations in filters used in mechanical ventilation or the distance from the pollution source. However, a detailed study of the impact of building permeability, façade design, etc., has not been conducted.
- Although windows are the primary mode of penetration of pollutants, there have been very few studies investigating the mechanism of transmission for different window styles and openings. Modern commercial façades usually install a double-skin façade, which has not been investigated in terms of pollutant filtering mechanism.
- Exposure models have not explicitly modelled variations in pollutant concentrations as a function of window schedule or opening parameter. Even differences amongst various windows are rarely accounted for. There are few studies which have investigated the ventilation potential of different window configurations; however, the focus was on the air exchange rate rather than pollutant transmission.
- There exists a wide range of indoor–outdoor relationships, such as the I/O ratio, penetration factor, infiltration factor, etc. There is always uncertainty in the measurement/prediction and often disagreement amongst researchers. For instance, while using the I/O ratio as a measure of outdoor influence, some studies claim that ratios greater than unity mean an indoor influence, while some claim that ratios greater than five indicate an outdoor influence [82]. Discretion in the use of these factors is advised and careful attention to be paid to the site and conditions.
- The use of CFDs as a potential tool for quantifying indoor pollutants of outdoor origin is significantly lacking. Most studies on CFDs either focus on urban level or canyon dispersion. A coupled indoor–outdoor simulation could reveal finer details of the transmission mechanism. Existing studies, such as [142,143], did not account for multiple phenomena acting in the environments. There is a great need to develop detailed models to account for the dynamic nature of street canyons.
- A coupled study of the indoor–outdoor environment would also help to understand how indoor exposure levels are modified by outdoor conditions. CFD simulations offer the potential to investigate the impact of outdoor conditions on the indoor environment and how air flow is modified by various window/façade types. The review revealed a general lack of CFD studies exploring transmission mechanisms on different building envelope designs using indoor–outdoor-coupled environment simulations.
- The use of experimental methods and measurements is resource and time-intensive, and, hence, primarily used for long-term average exposure assessments and pollution transmission. Modelling studies can help refine the spatiotemporal resolution and generate detailed transmission and exposure reports. They also provide an effective tool to assess multiple factors simultaneously, which is not possible with experimental methods.
- Machine learning and prediction algorithms can be trained with combined results from experimental and modelling methodologies to develop a more accurate and robust exposure prediction tool and quantify the transmission of pollutants.
While experimental observations are helpful in understanding long-term exposure assessments, CFD simulations can help visualise how the transmission of pollutants occurs over a short spatial and temporal range. The review identified the lack of a clear understanding between fluctuations in determinants and their consequent impact on transmission. Previous epidemic outbreaks and the current pandemic highlighted the importance of air quality and fear of airborne contamination. It is envisaged that future studies should investigate this direction and fill the knowledge gap, including mitigation and intervention strategies for indoor air contamination.
Author Contributions
Conceptualisation, M.M. and J.C.; methodology, M.M.; software, M.M.; validation, M.M. and J.C.; formal analysis, M.M.; investigation, M.M. and J.C.; resources, J.C.; data curation, M.M.; writing—original draft preparation, M.M.; writing—review and editing, J.C.; visualisation, M.M.; supervision, J.C.; project administration, J.C.; funding acquisition, J.C. All authors have read and agreed to the published version of the manuscript.
Funding
This research was funded by the Faculty of Engineering (UoN) for the Engineering Research Excellence Scholarship.
Institutional Review Board Statement
Not applicable.
Informed Consent Statement
Not applicable.
Data Availability Statement
Not applicable.
Conflicts of Interest
The authors declare no conflict of interest.
References
- Saadat, S.; Rawtani, D.; Hussain, C.M. Environmental perspective of COVID-19. Sci. Total Environ. 2020, 728, 138870. [Google Scholar] [CrossRef]
- Sharma, S.; Zhang, M.; Anshika; Gao, J.; Zhang, H.; Kota, S.H. Effect of restricted emissions during COVID-19 on air quality in India. Sci. Total Environ. 2020, 728, 138878. [Google Scholar] [CrossRef]
- Otmani, A.; Benchrif, A.; Tahri, M.; Bounakhla, M.; El Bouch, M.; Krombi, M.H. Impact of COVID-19 lockdown on PM10, SO2 and NO2 concentrations in Salé City (Morocco). Sci. Total Environ. 2020, 735, 139541. [Google Scholar] [CrossRef]
- Helm, D. The Environmental Impacts of the Coronavirus. Environ. Resour. Econ. 2020, 76, 21–38. [Google Scholar] [CrossRef]
- Rugani, B.; Caro, D. Impact of COVID-19 outbreak measures of lockdown on the Italian Carbon Footprint. Sci. Total Environ. 2020, 737, 139806. [Google Scholar] [CrossRef]
- Patel, K. Airborne Nitrogen Dioxide Plummets Over China. Earth Observatory NASA. 2020. Available online: https://earthobservatory.nasa.gov/images/146362/airborne-nitrogen-dioxide-plummets-over-china#:~:text=NASA%20and%20European%20Space%20Agency,following%20the%20outbreak%20of%20coronavirus (accessed on 17 July 2022).
- University of Southampton. Aftermath of Working from Home. 2020. Available online: https://www.southampton.ac.uk/news/2020/07/long-term-implications-wfh.page (accessed on 30 September 2020).
- Deloitte UK. The Impact of COVID-19 on Productivity and Wellbeing; Deloitte UK: London, UK, 2020. [Google Scholar]
- UK Productivity Could Be Improved by a Permanent Shift towards Remote Working. Cardiff University. 2020. Available online: https://www.cardiff.ac.uk/news/view/2432442-uk-productivity-could-be-improved-by-a-permanent-shift-towards-remote-working,-research-shows (accessed on 30 September 2020).
- Spataro, J. The Future of Work; Microsoft 365 Blog. 2020. Available online: https://www.microsoft.com/en-us/microsoft-365/blog/2020/07/08/future-work-good-challenging-unknown/ (accessed on 17 July 2022).
- NERC. Announcement of Opportunity: Preparing for Future Clean Air Challenges: Interdisciplinary Research and Innovation Consortia; NERC: Atlanta, Georgia, 2020. [Google Scholar]
- Chen, C.; Zhao, B. Review of relationship between indoor and outdoor particles: I/O ratio, infiltration factor and penetration factor. Atmos. Environ. 2011, 45, 275–288. [Google Scholar] [CrossRef]
- Menichini, E.; Iacovella, N.; Monfredini, F.; Turrio-Baldassarri, L. Relationships between indoor and outdoor air pollution by carcinogenic PAHs and PCBs. Atmos. Environ. 2007, 41, 9518–9529. [Google Scholar] [CrossRef]
- Milner, J.; Vardoulakis, S.; Chalabi, Z.; Wilkinson, P. Modelling inhalation exposure to combustion-related air pollutants in residential buildings: Application to health impact assessment. Environ. Int. 2011, 37, 268–279. [Google Scholar] [CrossRef]
- Pope, C.A.; Ezzati, M.; Dockery, D.W. Tradeoffs between income, air pollution and life expectancy: Brief report on the US experience, 1980–2000. Environ. Res. 2015, 142, 591–593. [Google Scholar] [CrossRef]
- “Indoor Air Pollution”, Published Online at OurWorldInData.org. 16 November 2013. Available online: https://ourworldindata.org/indoor-air-pollution (accessed on 5 September 2020).
- Health Effects Institute. State of Global Air 2020; Health Effects Institute: Boston, MA, USA, 2020. [Google Scholar]
- Wu, X.; Nethery, R.C.; Sabath, B.; Braun, D.; Dominici, F.; James, C. Exposure to air pollution and COVID-19 mortality in the United States: A nationwide cross-sectional study. MedRxiv 2020. [Google Scholar] [CrossRef]
- Manoj, M.G.; Kumar, M.K.S.; Valsaraj, K.T.; Sivan, C.; Vijayan, S.K. Potential link between compromised air quality and transmission of the novel corona virus (SARS-CoV-2) in affected areas. Environ. Res. 2020, 190, 110001. [Google Scholar] [CrossRef]
- Copat, C.; Cristaldi, A.; Fiore, M.; Grasso, A.; Zuccarello, P.; Santo Signorelli, S.; Conti, G.O.; Ferrante, M. The role of air pollution (PM and NO2) in COVID-19 spread and lethality: A systematic review. Environ. Res. 2020, 191, 110129. [Google Scholar] [CrossRef]
- Coker, E.S.; Cavalli, L.; Fabrizi, E.; Guastella, G.; Lippo, E.; Parisi, M.L.; Pontarollo, N.; Rizzati, M.; Varacca, A.; Vergalli, S. The Effects of Air Pollution on COVID-19 Related Mortality in Northern Italy. Environ. Resour. Econ. 2020, 76, 611–634. [Google Scholar] [CrossRef]
- United Nations. Transforming Our World: The 2030 Agenda for Sustainable Development; UN General Assembly: New York, NY, USA, 2015. [Google Scholar]
- Chiesa, M.; Urgnani, R.; Marzuoli, R.; Finco, A.; Gerosa, G. Site- and house-specific and meteorological factors influencing exchange of particles between outdoor and indoor domestic environments. Build. Environ. 2019, 160, 106181. [Google Scholar] [CrossRef]
- Błaszczyk, E.; Rogula-Kozłowska, W.; Klejnowski, K.; Kubiesa, P.; Fulara, I.; Mielżyńska-Švach, D. Indoor air quality in urban and rural kindergartens: Short-term studies in Silesia, Poland. Air Qual. Atmos. Health 2017, 10, 1207–1220. [Google Scholar] [CrossRef]
- Kukadia, V.; Upton, S. Ensuring Good Indoor Air Quality in Buildings; BRE Trust: Watford, UK, 2019. [Google Scholar]
- UK Government. The Building Regulations 2010, Ventilation-Approved Dcoument F; UK Government: London, UK, 2010.
- Emmerich, S.J.; Persily, A.K.; Dols, W.S.; Axley, J.W. NISTIR 7062 Impact of Natural Ventilation Strategies and Design Issues for California Applications, Including Input to ASHRAE Standard 62 and California Title 24; National Institute of Standards and Technology: Gaithersburg, ML, USA, 2003. [CrossRef]
- Ai, Z.T.; Mak, C.M. From street canyon microclimate to indoor environmental quality in naturally ventilated urban buildings: Issues and possibilities for improvement. Build. Environ. 2015, 94, 489–503. [Google Scholar] [CrossRef]
- Meier, R.; Schindler, C.; Eeftens, M.; Aguilera, I.; Ducret-Stich, R.E.; Ineichen, A.; Davey, M.; Phuleria, H.C.; Probst-Hensch, N.; Tsai, M.Y.; et al. Modeling indoor air pollution of outdoor origin in homes of SAPALDIA subjects in Switzerland. Environ. Int. 2015, 82, 85–91. [Google Scholar] [CrossRef]
- Wallis, S.L.; Hernandez, G.; Poyner, D.; Holmes, W.; Birchmore, R.; Berry, T.A. Particulate matter in residential buildings in New Zealand: Part II. The impact of building airtightness, mechanical ventilation using simulated occupancy. Atmos. Environ. X 2019, 2, 100026. [Google Scholar] [CrossRef]
- Ben-David, T.; Waring, M.S. Impact of natural versus mechanical ventilation on simulated indoor air quality and energy consumption in offices in fourteen U.S. cities. Build. Environ. 2016, 104, 320–336. [Google Scholar] [CrossRef]
- Sundell, J.; Levin, H.; Nazaroff, W.W.; Cain, W.S.; Fisk, W.J.; Grimsrud, D.T.; Gyntelberg, F.; Li, Y.; Persily, A.K.; Pickering, A.C.; et al. Ventilation rates and health: Multidisciplinary review of the scientific literature. Indoor Air 2011, 21, 191–204. [Google Scholar] [CrossRef]
- Standard 62.2-2019; Ventilation and Acceptable Indoor Air Quality in Residential Buildings. ASHRAE: Peachtree Corners, GA, USA, 2019.
- Standard 62.1-2019; Ventilation for Acceptable Indoor Air Quality. ASHRAE: Peachtree Corners, GA, USA, 2019.
- NBS Publications. Domestic Ventilation Compliance Guide 2010 Edition; NBS Publications: St. Chicago, IL, USA, 2011. [Google Scholar]
- Chen, C.; Zhao, B.; Weschler, C.J. Indoor Exposure to “Outdoor PM₁₀”: Assessing Its Influence on the Relationship Between PM₁₀ and Short-term Mortality in U.S. Cities on JSTOR. Epidemiology 2012, 23, 870–878. [Google Scholar] [CrossRef] [PubMed]
- Leung, D.Y.C. Outdoor-indoor air pollution in urban environment: Challenges and opportunity. Front. Environ. Sci. 2015, 2, 69. [Google Scholar] [CrossRef]
- Santamouris, M.; Papanikolaou, N.; Koronakis, I.; Livada, I.; Asimakopoulos, D. Thermal and air flow characteristics in a deep pedestrian canyon under hot weather conditions. Atmos. Environ. 1999, 33, 4503–4521. [Google Scholar] [CrossRef]
- European Environment Agency. Air Pollution; European Environment Agency: Copenhagen, Denmark, 2017. Available online: https://www.eea.europa.eu/themes/air/intro (accessed on 17 July 2022).
- Yuan, C.; Ng, E.; Norford, L.K. Improving air quality in high-density cities by understanding the relationship between air pollutant dispersion and urban morphologies. Build. Environ. 2014, 71, 245–258. [Google Scholar] [CrossRef] [PubMed]
- Climate and Clean Air Coalition (CCAC); United Nations Environment Programme (UNEP); Asia Pacific Clean Air Partnership. Air Pollution in Asia and the Pacific: Science-Based Solutions; United Nations Environment Programme: Nairobi, Kenya, 2019. [Google Scholar]
- Zhou, B.; Zhao, B.; Guo, X.; Chen, R.; Kan, H. Investigating the geographical heterogeneity in PM10-mortality associations in the China Air Pollution and Health Effects Study (CAPES): A potential role of indoor exposure to PM10 of outdoor origin. Atmos. Environ. 2013, 75, 217–223. [Google Scholar] [CrossRef]
- Harrad, S.; Ren, J.; Hazrati, S.; Robson, M. Chiral signatures of PCB#s 95 and 149 in indoor air, grass, duplicate diets and human faeces. Chemosphere 2006, 63, 1368–1376. [Google Scholar] [CrossRef][Green Version]
- Jamshidi, A.; Hazrati, S.; Harrad, S. Implications of Chiral Signatures of PCBs in Soil, Outdoor and Indoor Air in the West Midlands Conurbation, UK. In Proceedings of the International Symposium on Halogenated Persistent Organic Pollutants EMV-Contaminant Contam Issues, Toronto, ON, Canada, 21–26 August 2005. [Google Scholar]
- WHO. Dampness and Mould WHO Guidelines for Indoor Air Quality; WHO: Geneva, Switzerland, 2009. [Google Scholar]
- Lebret, E.; van de Wiel, H.J.; Bos, H.P.; Noij, D.; Boleij, J.S.M. Volatile organic compounds in dutch homes. Environ. Int. 1986, 12, 323–332. [Google Scholar] [CrossRef]
- U.S. Environmental Protection Agency. Particulate Matter (PM) Basics; United States Environmental Protection Agency: Washington, DC, USA, 2020.
- Kim, J.L.; Elfman, L.; Wieslander, G.; Ferm, M.; Torén, K.; Norbäck, D. Respiratory health among Korean pupils in relation to home, school and outdoor environment. J. Korean Med. Sci. 2011, 26, 166–173. [Google Scholar] [CrossRef]
- De, E.; Fernandes, O.; Sacco, L.; Mclaughlin, J.P. Strategies to Determine and Control the Contributions of Indoor Air Pollution to Total Inhalation Exposure (STRATEX). 2006. Available online: http://europa.eu (accessed on 29 September 2020).
- Chang, W.R.; Cheng, C.L. Carbon monoxide transport in an enclosed room with sources from a water heater in the adjacent balcony. Build. Environ. 2008, 43, 861–870. [Google Scholar] [CrossRef]
- Park, J.S.; Jee, N.-Y.; Jeong, J.-W. Effects of types of ventilation system on indoor particle concentrations in residential buildings. Indoor Air 2014, 24, 629–638. [Google Scholar] [CrossRef]
- Lv, Y.; Wang, H.; Wei, S.; Zhang, L.; Zhao, Q. The Correlation between Indoor and Outdoor Particulate Matter of Different Building Types in Daqing, China. Procedia Eng. 2017, 205, 360–367. [Google Scholar] [CrossRef]
- Irga, P.J.; Torpy, F.R. Indoor air pollutants in occupational buildings in a sub-tropical climate: Comparison among ventilation types. Build. Environ. 2016, 98, 190–199. [Google Scholar] [CrossRef]
- Atkinson, J. Natural Ventilation for Infection Control in Health-Care Settings; World Health Organization: Geneva, Switzerland, 2009. Available online: https://www.ncbi.nlm.nih.gov/books/NBK143277/ (accessed on 29 September 2020).
- Seppänen, O.; Fisk, W.J. Association of ventilation system type with SBS symptoms in office workers. Indoor Air 2002, 12, 98–112. [Google Scholar] [CrossRef] [PubMed]
- Wanek, C.; Smith, M.; Kennedy, J.F. The Art of Natural Building; Gabriola Island New Society Publishers: Gabriola, BC, Canada, 2015. [Google Scholar]
- Stabile, L.; Dell’Isola, M.; Russi, A.; Massimo, A.; Buonanno, G. The effect of natural ventilation strategy on indoor air quality in schools. Sci. Total Environ. 2017, 595, 894–902. [Google Scholar] [CrossRef]
- Chen, A.; Gall, E.T.; Chang, V.W.C. Indoor and outdoor particulate matter in primary school classrooms with fan-assisted natural ventilation in Singapore. Environ. Sci. Pollut. Res. 2016, 23, 17613–17624. [Google Scholar] [CrossRef]
- Hassanvand, M.S.; Naddafi, K.; Faridi, S.; Arhami, M.; Nabizadeh, R.; Sowlat, M.H.; Pourpak, Z.; Rastkari, N.; Momeniha, F.; Kashani, H.; et al. Indoor/outdoor relationships of PM10, PM2.5, and PM1 mass concentrations and their water-soluble ions in a retirement home and a school dormitory. Atmos. Environ. 2014, 82, 375–382. [Google Scholar] [CrossRef]
- Harbizadeh, A.; Mirzaee, S.A.; Khosravi, A.D.; Shoushtari, F.S.; Goodarzi, H.; Alavi, N.; Ankali, K.A.; Rad, H.D.; Maleki, H.; Goudarzi, G. Indoor and outdoor airborne bacterial air quality in day-care centers (DCCs) in greater Ahvaz, Iran. Atmos. Environ. 2019, 216, 116927. [Google Scholar] [CrossRef]
- Zhao, J.; Wolfram, B.; Birgit, W.; Anja, D.; Kay, W.; Lina, W.; Maik, M.; Simonas, K.; Thomas, T.; Ulrich, F.; et al. Particle Mass Concentrations and Number Size Distributions in 40 Homes in Germany: Indoor-to-Outdoor Relationships, Diurnal and Seasonal Variation. Aerosol Air Qual. Res. 2020, 20, 576–589. [Google Scholar] [CrossRef]
- Wang, F.; Meng, D.; Li, X.; Tan, J. Indoor-outdoor relationships of PM2.5 in four residential dwellings in winter in the Yangtze River Delta, China. Environ. Pollut. 2016, 215, 280–289. [Google Scholar] [CrossRef]
- Rim, D.; Gall, E.T.; Kim, J.B.; Bae, G.N. Particulate matter in urban nursery schools: A case study of Seoul, Korea during winter months. Build. Environ. 2017, 119, 1–10. [Google Scholar] [CrossRef]
- Yang, Z.; Shen, J.; Gao, Z. Ventilation and Air Quality in Student Dormitories in China: A Case Study during Summer in Nanjing. Int. J. Environ. Res. Public Health 2018, 15, 1328. [Google Scholar] [CrossRef] [PubMed]
- Wallace, L.A.; Emmerich, S.J.; Howard-Reed, C. Continuous measurements of air change rates in an occupied house for 1 year: The effect of temperature, wind, fans, and windows. J. Expo. Anal. Environ. Epidemiol. 2002, 12, 296–306. [Google Scholar] [CrossRef] [PubMed]
- Howard-Reed, C.; Wallace, L.A.; Ott, W.R. The effect of opening windows on air change rates in two homes. J. Air Waste Manag. Assoc. 2002, 52, 147–159. [Google Scholar] [CrossRef]
- Liu, C.; Yang, J.; Ji, S.; Lu, Y.; Wu, P.; Chen, C. Influence of natural ventilation rate on indoor PM2.5 deposition. Build. Environ. 2018, 144, 357–364. [Google Scholar] [CrossRef]
- Massey, D.; Kulshrestha, A.; Masih, J.; Taneja, A. Seasonal trends of PM10, PM5.0, PM2.5 & PM1.0 in indoor and outdoor environments of residential homes located in North-Central India. Build. Environ. 2012, 47, 223–231. [Google Scholar] [CrossRef]
- Chithra, V.S.; Nagendra, S.M.S. Impact of outdoor meteorology on indoor PM10, PM2.5 and PM1 concentrations in a naturally ventilated classroom. Urban Clim. 2014, 10, 77–91. [Google Scholar] [CrossRef]
- Pallarés, S.; Gómez, E.T.; Martínez, A.; Jordán, M.M. The relationship between indoor and outdoor levels of PM10 and its chemical composition at schools in a coastal region in Spain. Heliyon 2019, 5, e02270. [Google Scholar] [CrossRef]
- Rohra, H.; Tiwari, R.; Khare, P.; Taneja, A. Indoor-outdoor association of particulate matter and bounded elemental composition within coarse, quasi-accumulation and quasi-ultrafine ranges in residential areas of northern India. Sci. Total Environ. 2018, 631, 1383–1397. [Google Scholar] [CrossRef]
- Stasiulaitiene, I.; Krugly, E.; Prasauskas, T.; Ciuzas, D.; Kliucininkas, L.; Kauneliene, V.; Martuzevicius, D. Infiltration of outdoor combustion-generated pollutants to indoors due to various ventilation regimes: A case of a single-family energy efficient building. Build. Environ. 2019, 157, 235–241. [Google Scholar] [CrossRef]
- Koponen, I.K.; Asmi, A.; Keronen, P.; Puhto, K.; Kulmala, M. Indoor air measurement campaign in Helsinki, Finland 1999-The effect of outdoor air pollution on indoor air. Atmos. Environ. 2001, 35, 1465–1477. [Google Scholar] [CrossRef]
- Chen, A.; Cao, Q.; Zhou, J.; Yang, B.; Chang, V.W.C.; Nazaroff, W.W. Indoor and outdoor particles in an air-conditioned building during and after the 2013 haze in Singapore. Build. Environ. 2016, 99, 73–81. [Google Scholar] [CrossRef]
- Quang, T.N.; He, C.; Morawska, L.; Knibbs, L.D. Influence of ventilation and filtration on indoor particle concentrations in urban office buildings. Atmos. Environ. 2013, 79, 41–52. [Google Scholar] [CrossRef]
- Yu, B.F.; Hu, Z.B.; Liu, M.; Yang, H.L.; Kong, Q.X.; Liu, Y.H. Review of research on air-conditioning systems and indoor air quality control for human health. Int. J. Refrig. 2009, 32, 3–20. [Google Scholar] [CrossRef]
- Zhou, B.; Feng, L.; Shiue, A.; Hu, S.C.; Wang, Y.; Li, F.; Lin, T.; Liu, H.-F.; Peng, W.; Xu, Y. Study on influencing mechanism of outdoor plant-related particles on indoor environment and its control measures during transitional period in Nanjing. Aerosol Air Qual. Res. 2019, 19, 571–586. [Google Scholar] [CrossRef]
- Johnson, A.M.; Waring, M.S.; DeCarlo, P.F. Real-time transformation of outdoor aerosol components upon transport indoors measured with aerosol mass spectrometry. Indoor Air 2017, 27, 230–240. [Google Scholar] [CrossRef] [PubMed]
- el Orch, Z.; Stephens, B.; Waring, M.S. Predictions and determinants of size-resolved particle infiltration factors in single-family homes in the U.S. Build. Environ. 2014, 74, 106–118. [Google Scholar] [CrossRef]
- Liu, D.-L.; Nazaroff, W.W. Modeling pollutant penetration across building envelopes. Atmos. Environ. 2001, 35, 4451–4462. [Google Scholar] [CrossRef]
- Liu, D.-L.; Nazaroff, W.W. Particle Penetration Through Building Cracks. Aerosol Sci. Technol. 2003, 37, 565–573. [Google Scholar] [CrossRef]
- de Blas, M.; Navazo, M.; Alonso, L.; Durana, N.; Gomez, M.C.; Iza, J. Simultaneous indoor and outdoor on-line hourly monitoring of atmospheric volatile organic compounds in an urban building. The role of inside and outside sources. Sci. Total Environ. 2012, 426, 327–335. [Google Scholar] [CrossRef]
- Younes, C.; Shdid, C.A.; Bitsuamlak, G. Air infiltration through building envelopes: A review. J. Build. Phys. 2012, 35, 267–302. [Google Scholar] [CrossRef]
- Choi, D.H.; Kang, D.H. Indoor/Outdoor Relationships of Airborne Particles under Controlled Pressure Difference across the Building Envelope in Korean Multifamily Apartments. Sustainability 2018, 10, 4074. [Google Scholar] [CrossRef]
- Thomas, N.M.; Calderón, L.; Senick, J.; Sorensen-Allacci, M.; Plotnik, D.; Guo, M.; Yu, Y.; Gong, J.; Andrews, C.J.; Mainelis, G. Investigation of indoor air quality determinants in a field study using three different data streams. Build. Environ. 2019, 154, 281–295. [Google Scholar] [CrossRef]
- Wang, Z.; Liu, C.; Hua, Q.; Zheng, X.; Ji, W.; Zhang, X. Effect of particulate iron on tracking indoor PM 2.5 of outdoor origin: A case study in Nanjing, China. Indoor Built Environ. 2020, 30, 711–723. [Google Scholar] [CrossRef]
- Chan, A.T. Indoor-outdoor relationships of particulate matter and nitrogen oxides under different outdoor meteorological conditions. Atmos. Environ. 2002, 36, 1543–1551. [Google Scholar] [CrossRef]
- Mao, J.; Gao, N. The airborne transmission of infection between flats in high-rise residential buildings: A review. Build. Environ. 2015, 94, 516–531. [Google Scholar] [CrossRef]
- Niu, J.; Tung, T.C.W. On-site quantification of re-entry ratio of ventilation exhausts in multi-family residential buildings and implications. Indoor Air 2007, 18, 12–26. [Google Scholar] [CrossRef]
- Mu, D.; Gao, N.; Zhu, T. CFD investigation on the effects of wind and thermal wall-flow on pollutant transmission in a high-rise building. Build. Environ. 2018, 137, 185–197. [Google Scholar] [CrossRef]
- Tippayawong, N.; Khuntong, P.; Nitatwichit, C.; Khunatorn, Y.; Tantakitti, C. Indoor/outdoor relationships of size-resolved particle concentrations in naturally ventilated school environments. Build. Environ. 2009, 44, 188–197. [Google Scholar] [CrossRef]
- Deng, T.; Shen, X.; Cheng, X.; Liu, J. Investigation of window-opening behaviour and indoor air quality in dwellings situated in the temperate zone in China. Indoor Built Environ. 2020, 30, 938–956. [Google Scholar] [CrossRef]
- Bekö, G.; Gustavsen, S.; Frederiksen, M.; Bergsøe, N.C.; Kolarik, B.; Gunnarsen, L.; Toftum, J.; Clausen, G. Diurnal and seasonal variation in air exchange rates and interzonal airflows measured by active and passive tracer gas in homes. Build. Environ. 2016, 104, 178–187. [Google Scholar] [CrossRef]
- Park, J.; Choi, C. Modeling occupant behavior of the manual control of windows in residential buildings. Indoor Air 2019, 29, 242–251. [Google Scholar] [CrossRef] [PubMed]
- Fromme, H.; Twardella, D.; Dietrich, S.; Heitmann, D.; Schierl, R.; Liebl, B.; Rüden, H. Particulate matter in the indoor air of classrooms-exploratory results from Munich and surrounding area. Atmos. Environ. 2007, 41, 854–866. [Google Scholar] [CrossRef]
- Rosati, J.A.; Thornburg, J.; Rodes, C. Resuspension of Particulate Matter from Carpet Due to Human Activity. Aerosol Sci. Technol. 2008, 42, 472–482. [Google Scholar] [CrossRef]
- Chithra, V.S.; Nagendra, S.M.S. Chemical and morphological characteristics of indoor and outdoor particulate matter in an urban environment. Atmos. Environ. 2013, 77, 579–587. [Google Scholar] [CrossRef]
- Orza, J.A.G.; Cabello, M.; Lidón, V.; Martínez, J. Contribution of resuspension to particulate matter inmission levels in SE Spain. J. Arid Environ. 2011, 75, 545–554. [Google Scholar] [CrossRef]
- Lang, F.L.; Yan, W.Q.; Zhang, Q.; Cao, J. Size distribution of atmospheric particle number in Beijing and association with meteorological conditions. Zhongguo Huanjing Kexue/China Environ. Sci. 2013, 33, 1153–1159. [Google Scholar]
- Yue, D.; Hu, M.; Wu, Z.; Wang, Z.; Guo, S.; Wehner, B.; Nowak, A.; Achtert, P.; Wiedensohler, A.; Jung, J.; et al. Characteristics of aerosol size distributions and new particle formation in the summer in Beijing. J. Geophys. Res. Atmos. 2009, 114, 1–12. [Google Scholar] [CrossRef]
- He, L.; Hang, J.; Wang, X.; Lin, B.; Li, X.; Lan, G. Numerical investigations of flow and passive pollutant exposure in high-rise deep street canyons with various street aspect ratios and viaduct settings. Sci. Total Environ. 2017, 584, 189–206. [Google Scholar] [CrossRef]
- Tominaga, Y.; Stathopoulos, T. Ten questions concerning modeling of near-field pollutant dispersion in the built environment. Build. Environ. 2016, 105, 390–402. [Google Scholar] [CrossRef]
- Buccolieri, R.; Salim, S.M.; Leo, L.S.; Di Sabatino, S.; Chan, A.; Ielpo, P.; de Gennaro, G.; Gromke, C. Analysis of local scale tree-atmosphere interaction on pollutant concentration in idealised street canyons and application to a real urban junction. Atmos. Environ. 2011, 45, 1702–1713. [Google Scholar] [CrossRef]
- Challoner, A.; Gill, L. Indoor/outdoor air pollution relationships in ten commercial buildings: PM2.5 and NO2. Build. Environ. 2014, 80, 159–173. [Google Scholar] [CrossRef]
- Väkevä, M.; Hämeri, K.; Kulmala, M.; Lahdes, R.; Ruuskanen, J.; Laitinen, T. Street level versus rooftop concentrations of submicron aerosol particles and gaseous pollutants in an urban street canyon. Atmos. Environ. 1999, 33, 1385–1397. [Google Scholar] [CrossRef]
- Chavez, M.; Hajra, B.; Stathopoulos, T.; Bahloul, A. Near-field pollutant dispersion in the built environment by CFD and wind tunnel simulations. J. Wind Eng. Ind. Aerodyn. 2011, 99, 330–339. [Google Scholar] [CrossRef]
- Salim, S.M. Computational Study of Wind Flow and Pollutant Dispersion Near Tree Canopies. Ph.D. Thesis, University of Nottingham, Nottingham, UK, 2011. [Google Scholar]
- Hong, B.; Qin, H.; Lin, B. Prediction of wind environment and indoor/outdoor relationships for PM2.5 in different building-tree grouping patterns. Atmosphere 2018, 9, 39. [Google Scholar] [CrossRef]
- Buccolieri, R.; Gromke, C.; di Sabatino, S.; Ruck, B. Aerodynamic effects of trees on pollutant concentration in street canyons. Sci. Total Environ. 2009, 407, 5247–5256. [Google Scholar] [CrossRef]
- Li, X.B.; Lu, Q.C.; Lu, S.J.; He, H.D.; Peng, Z.R.; Gao, Y.; Wang, Z.Y. The impacts of roadside vegetation barriers on the dispersion of gaseous traffic pollution in urban street canyons. Urban For. Urban Green. 2016, 17, 80–91. [Google Scholar] [CrossRef]
- Nowak, D.J.; Hirabayashi, S.; Bodine, A.; Hoehn, R. Modeled PM2.5 removal by trees in ten U.S. cities and associated health effects. Environ. Pollut. 2013, 178, 395–402. [Google Scholar] [CrossRef]
- Rai, P.K.; Panda, L.L.S. Dust capturing potential and air pollution tolerance index (APTI) of some road side tree vegetation in Aizawl, Mizoram, India: An Indo-Burma hot spot region. Air Qual. Atmos. Heal. 2014, 7, 93–101. [Google Scholar] [CrossRef]
- Abhijith, K.V.; Kumar, P.; Gallagher, J.; McNabola, A.; Baldauf, R.; Pilla, F.; Broderick, B.; Sabatino, B.D.; Pulvirenti, B. Air pollution abatement performances of green infrastructure in open road and built-up street canyon environments–A review. Atmos. Environ. 2017, 162, 71–86. [Google Scholar] [CrossRef]
- Morakinyo, T.E.; Lam, Y.F. Study of traffic-related pollutant removal from street canyon with trees: Dispersion and deposition perspective. Environ. Sci. Pollut. Res. 2016, 23, 21652–21668. [Google Scholar] [CrossRef]
- Janhäll, S. Review on urban vegetation and particle air pollution-Deposition and dispersion. Atmos. Environ. 2015, 105, 130–137. [Google Scholar] [CrossRef]
- Peng, Y.; Ma, X.; Zhao, F.; Liu, C.; Mei, S. Wind driven natural ventilation and pollutant dispersion in the dense street canyons: Wind Opening Percentage and its effects. Procedia Eng. Jpn. 2017, 205, 415–422. [Google Scholar] [CrossRef]
- Yang, F.; Kang, Y.; Gao, Y.; Zhong, K. Numerical simulations of the effect of outdoor pollutants on indoor air quality of buildings next to a street canyon. Build. Environ. 2015, 87, 10–22. [Google Scholar] [CrossRef]
- Zöllner, I.; Gabrio, T.; Link, B. Concentrations of particulate matter in schools in southwest Germany. Inhal. Toxicol. 2007, 19 (Suppl. 1), 245–249. [Google Scholar] [CrossRef]
- Lazaridis, M.; Eleftheriadis, K.; Vladia, Z.; Schwarz, J.; Wagner, Z.; Ondra, J.; Drossinos, Y.; Glytsos, T.; Vratolis, S.; Torseth, K.; et al. Number Concentrations and Modal Structure of Indoor/Outdoor Fine Particles in Four European Cities. Aerosol Air Qual. Res. 2017, 17, 131–146. [Google Scholar] [CrossRef]
- Heo, S.K.; Nam, K.J.; Loy-Benitez, J.; Li, Q.; Lee, S.C.; Yoo, C.K. A deep reinforcement learning-based autonomous ventilation control system for smart indoor air quality management in a subway station. Energy Build. 2019, 202, 109440. [Google Scholar] [CrossRef]
- Ji, W.; Zhao, B. Contribution of outdoor-originating particles, indoor-emitted particles and indoor secondary organic aerosol (SOA) to residential indoor PM2.5 concentration: A model-based estimation. Build. Environ. 2015, 90, 196–205. [Google Scholar] [CrossRef]
- MacNeill, M.; Wallace, L.; Kearney, J.; Allen, R.W.; Van Ryswyk, K.; Judek, S.; Xu, X.; Wheeler, A. Factors influencing variability in the infiltration of PM2.5 mass and its components. Atmos. Environ. 2012, 61, 518–532. [Google Scholar] [CrossRef]
- Lebret, E.; McCarthy, J.; Spengler, J.; Chang, B.H. Elemental composition of indoor fine particles. Indoor Air 1987, 1, 569–573. [Google Scholar]
- Hussein, T.; Glytsos, T.; Ondráček, J.; Dohányosová, P.; Ždímal, V.; Hämeri, K.; Lazaridis, M.; Smolík, J.; Kulmala, M. Particle size characterisation and emission rates during indoor activities in a house. Atmos. Environ. 2006, 40, 4285–4307. [Google Scholar] [CrossRef]
- He, C.; Morawska, L.; Hitchins, J.; Gilbert, D. Contribution from indoor sources to particle number and mass concentrations in residential houses. Atmos. Environ. 2004, 38, 3405–3415. [Google Scholar] [CrossRef]
- Shinohara, N.; Yoshida-Ohuchi, H. Resuspension and deposition of PM2.5 and PM10 containing radiocesium during and after indoor cleaning of uninhabited houses in Fukushima, Japan. Chemosphere 2021, 272, 129934. [Google Scholar] [CrossRef] [PubMed]
- Nazaroff, W.W. Indoor bioaerosol dynamics. Indoor Air 2016, 26, 61–78. [Google Scholar] [CrossRef] [PubMed]
- Lai, A.C.K. Particle deposition indoors: A review. Indoor Air 2002, 12, 211–214. [Google Scholar] [CrossRef]
- Nazaroff, W.W. Indoor particle dynamics. Indoor Air 2004, 14 (Suppl. 7), 175–183. [Google Scholar] [CrossRef]
- Feng, L.; Zhou, B.; Xu, Y.; Xue, K.; Li, Y.; Zhang, R.; Wei, P.; Huang, R. Theoretical investigation and experimental validation on transient variation of particle concentration in a simulated consulting room in hospital. Build. Environ. 2017, 117, 1–10. [Google Scholar] [CrossRef]
- Riley, W.J.; McKone, T.E.; Lai, A.C.K.; Nazaroff, W.W. Indoor particulate matter of outdoor origin: Importance of size-dependent removal mechanisms. Environ. Sci. Technol. 2002, 36, 200–207. [Google Scholar] [CrossRef]
- Diapouli, E.; Chaloulakou, A.; Koutrakis, P.; Chaloulakou, A. Estimating the concentration of indoor particles of outdoor origin: A review Estimating the concentration of indoor particles of outdoor origin: A review. J. Air Waste Manag. Assoc. 2013, 63, 1113–1129. [Google Scholar] [CrossRef]
- Stephens, B.; Siegel, J.A. Penetration of ambient submicron particles into single-family residences and associations with building characteristics. Indoor Air 2012, 22, 501–513. [Google Scholar] [CrossRef]
- Chao, C.Y.H.; Wan, M.P.; Cheng, E.C.K. Penetration coefficient and deposition rate as a function of particle size in non-smoking naturally ventilated residences. Atmos Environ. 2003, 37, 4233–4241. [Google Scholar] [CrossRef]
- Diapouli, E.; Chaloulakou, A.; Spyrellis, N. Indoor and outdoor PM concentrations at a residential environment, in the Athens area. Glob. NEST J. 2008, 10, 201–208. [Google Scholar]
- Matson, U. Comparison of the modelling and the experimental results on concentrations of ultra-fine particles indoors. Build. Environ. 2005, 40, 996–1002. [Google Scholar] [CrossRef]
- Williams, R.; Suggs, J.; Rea, A.; Sheldon, L.; Rodes, C.; Thornburg, J. The Research Triangle Park particulate matter panel study: Modeling ambient source contribution to personal and residential PM mass concentrations. Atmos. Environ. 2003, 37, 5365–5378. [Google Scholar] [CrossRef]
- Allen, R.; Larson, T.; Sheppard, L.; Wallace, L.; Liu, L.J.S. Use of real-time light scattering data to estimate the contribution of infiltrated and indoor-generated particles to indoor air. Environ. Sci. Technol. 2003, 37, 3484–3492. [Google Scholar] [CrossRef]
- Long, C.M.; Suh, H.H.; Catalano, P.J.; Koutrakis, P. Using time- and size-resolved particulate data to ouantify indoor penetration and deposition behavior. Environ. Sci. Technol. 2001, 35, 2089–2099. [Google Scholar] [CrossRef]
- Özkaynak, H.; Xue, J.; Spengler, J.; Wallace, L.; Pellizzari, E.; Jenkins, P. Personal exposure to airborne particles and metals: Results from the particle team study in Riverside, California. J. Expo. Anal. Environ. Epidemiol. 1996, 6, 57–78. [Google Scholar]
- Tung, T.C.; Chao, C.Y.; Burnett, J. A methodology to investigate the particulate penetration coefficient through building shell. Atmos. Environ. 1999, 33, 881–893. [Google Scholar] [CrossRef]
- Tong, Z.; Chen, Y.; Malkawi, A.; Adamkiewicz, G.; Spengler, J.D. Quantifying the impact of traffic-related air pollution on the indoor air quality of a naturally ventilated building. Environ. Int. 2016, 89, 138–146. [Google Scholar] [CrossRef]
- Chang, T.J.; Huang, M.Y.; Wu, Y.T.; Liao, C.M. Quantitative prediction of traffic pollutant transmission into buildings. J. Environ. Sci. Heal.-Part A Toxic/Hazard. Subst. Environ. Eng. 2003, 38, 1025–1040. [Google Scholar] [CrossRef]


Publisher’s Note: MDPI stays neutral with regard to jurisdictional claims in published maps and institutional affiliations. |
© 2022 by the authors. Licensee MDPI, Basel, Switzerland. This article is an open access article distributed under the terms and conditions of the Creative Commons Attribution (CC BY) license (https://creativecommons.org/licenses/by/4.0/).