Article

Fatigue Properties and Damage Characteristics of Polyurethane Mixtures under a Stress Control Mode

1
School of Transportation Engineering, Shandong Jianzhu University, Jinan 250101, China
2
School of Civil Engineering and Architecture, University of Jinan, Jinan 250022, China
*
Author to whom correspondence should be addressed.
Sustainability 2022, 14(17), 10966; https://doi.org/10.3390/su141710966
Submission received: 11 August 2022 / Revised: 30 August 2022 / Accepted: 31 August 2022 / Published: 2 September 2022
(This article belongs to the Special Issue Advances in New Green Road Materials and Applied Technologies)

Abstract

:
A polyurethane mixture (PUM) is an energy-saving and emission-reducing pavement material with excellent temperature stability; however, the fatigue properties and fatigue damage models of PUM still require further research. Therefore, four-point bending static load tests, fatigue tests, and digital speckle correlation method (DSCM) tests with different load levels of PUM and styrene butadiene styrene (SBS)-modified asphalt mixture (SMA) were carried out. The fatigue life, stiffness, midspan deflection, and maximum tensile strain were obtained and compared. The fatigue damage factor calculation method of PUM based on stiffness degradation was proposed, and the fatigue damage function of PUM at different load levels was fitted. The results show that the fatigue life of PUM was much larger than that of SMA, and the static loading failure and fatigue failure modes of PUM were both brittle. The fatigue damage of PUM exhibits an obvious three-stage damage law: the rapid development stage (accounting for about 10–20% of the fatigue life), the deformation stability expansion stage (accounting for about 70–80% of the fatigue life), and the instability development stage (accounting for about 10–20% of the fatigue life). The fatigue damage factors (DB) were calculated based on stiffness, according to D B = E I 0 E I n r E I 0 E I N r , and the fatigue damage functions of PUM were fitted based on the stiffness degradation, according to f n N = 1 1 ( n / N ) a ( 1 n / N ) b . The fatigue damage fitting curves have good correlation with the calculation results of the damage factor based on test data, which can predict the stiffness degradation of PUM at different load levels. The results can help further the understanding of the fatigue characteristics and damage mechanism of PUM, which will provide theoretical support for the application of PUM in pavement structures.

1. Introduction

Polyurethane is the general name for polymers containing repeated carbamate groups (-NHCOO-) in the main chain [1]. It is a “designable” polymer elastomer material with intermediate properties of plastic and rubber [2]. A polyurethane (PU) binder can solidify with hydroxyl groups in air and on the aggregate surface to form urea and a bonded network structure, which increases the strength of PUM continuously [3]. Thus, the temperature stability, mechanical properties, and fatigue properties of polyurethane mixtures essentially differ from those of asphalt mixtures. Due to its temperature stability, high elasticity, and wear resistance, many researchers have proposed the use of polyurethane (PU) instead of asphalt as a pavement binder [4,5]. Polyurethane is an environmentally friendly pavement binder; the production, transportation, and compaction of PU mixtures (PUMs) can be carried out at room temperature, which can greatly aid in global environmental conservation and ecologically sustainable development [6]. Since 2017, researchers have begun to use polyurethane binders to prepare polyurethane mixture to replace the mixture of open-graded friction course (OGFC), so as to solve the problems of the easy dispersion, poor fatigue stability, and poor permeability retention of OGFC mixture [4,5,6]. Then, more and more research on the application of polyurethane mixture in functional pavement was carried out [7,8,9,10,11,12,13,14]. In addition, in recent years, with the increasing demand for long-life pavement, some scholars adopted PU instead of asphalt as a binder to improve the service life and stability of pavement [11]. The PU mixture with an interlocking structure shows excellent temperature stability, fatigue stability, and mechanical properties [9]. Otherwise, polyurethane concrete for steel bridge deck pavement is developed according to the mechanical characteristics of steel bridge decks and the performance requirements of steel deck pavement material [15]. At present, PU mixture is mainly studied in three aspects: functional pavement, pavement structural layer, and bridge deck pavement. The composition design, curing reaction mechanism, performance evaluation, and construction technology of PUM are being studied by an increasing number of researchers worldwide [16,17,18].
The fatigue damage of pavement structures is most often caused by fatigue damage to its constituent materials [19]. To ensure the service life and safe performance of pavement structures, the fatigue characteristics of pavement materials must be tested and evaluated accurately [20]. Therefore, a variety of different fatigue tests have been carried out by many researchers to analyze the anti-fatigue properties of asphalt mixture and cement concrete [21]. Maalej et al. studied the behavior of hybrid-fiber engineered cementitious composites when subjected to dynamic tensile loading and impact loading [22]. The fatigue properties of engineered cementitious composites with the characteristic of low drying shrinkage have been investigated by Zhang et al. [23]. The plateau valve of the stiffness modulus degradation ratio curve was calculated to detect the fatigue damage characteristics of asphalt mixture by Guo et al. [24]. Shen et al. used the characteristic value of the damage curve as the evaluation index for rubber asphalt mixture fatigue performance, and established a prediction model for the BP neural network full-cycle fatigue life [25]. Huang et al. found that the fatigue self-healing efficiency is proportional to the asphalt and self-healing time, and inversely proportional to the extent of the void ratio, damage, and strain [26]. Menozzi et al. studied the fatigue damage and self-healing mechanism of different asphalt mixtures [27]. The aforementioned studies reveal the fatigue properties of asphalt mixtures and establish different fatigue models to calculate their properties under different fatigue loading modes. However, the research on the fatigue damage of PUM is relatively limited. Thus, the fatigue properties of PUM are still not understood adequately, along with the failure mode and damage mechanism, which is an obstacle to the popularization and application of PUM in pavement engineering.
Therefore, the fatigue properties and fatigue damage models of PUM need to be investigated in detail to improve engineering applications. The four-point bending static load tests, fatigue tests, and digital speckle correlation method (DSCM) tests at different control load levels of PUM and SMA were carried out in this paper. The failure strength, midspan deflection, fatigue life, and development law of the stiffness modulus, midspan deflection, and maximum tensile strain were detected and evaluated. The calculation method of the fatigue damage factor was established based on the stiffness modulus, and the fatigue damage factor development law of PUM was analyzed. Based on the composite material fatigue damage model, the fatigue damage prediction models of PUM based on stiffness degradation were established. The results provide a comprehensive understanding of the PUM fatigue characteristics and promote its application in pavement engineering.

2. Materials and Methods

2.1. Materials

The materials used mainly include a one-component wet curing PU binder, styrene butadiene styrene (SBS)-modified asphalt, and aggregates. The SBS-modified asphalt is often used at present, thus the performance of SBS-modified asphalt mixture was chosen for comparative analysis. The technical indexes of SBS-modified asphalt meet the requirements of I-D in JTG F40-2004 and can be observed in Table 1. The PU binder is a modified isocyanate containing a certain amount of terminal NCO groups (i.e., isocyanate group), which is prepared by Wanhua Chemical Co., Ltd. (Yantai, China). The indexes of the PU binder are shown in Table 2.

2.2. Mixture Composition Design

The aggregates of 0–3 mm, 5–10 mm, and 10–15 mm, along with mineral powder, both the PU mixtures (PUMs), and the stone mastic asphalt mixture (SMA) formed a skeleton dense structure; however, the PUM was designed according to the requirements of asphalt macadam concrete and the SMA was designed according to the requirements of stone mastic asphalt mixtures. The optimum dosage of PU and asphalt binder was determined by the Marshall mix design method. The composition design results of PUM with different aggregate nominal maximum sizes are shown in Table 3. The nominal maximum particle sizes of 13.2 mm and 9.5 mm are written as 13 and 10, respectively. The basic performance indexes of the three mixtures are shown in Table 4.

3. Methodology

3.1. Experimental Scheme

3.1.1. Preparation of the Test Specimens and Preservation

The preparation of test specimens was conducted as follows:
(1)
The PUM-10 and PUM-13 were prepared at room temperature, and the SMA-10 was mixed in accordance with the “Standard Test Methods of Bitumen and Bituminous Mixtures for Highway Engineering”.
(2)
The evenly mixed mixture was loaded into a 500 mm × 500 mm × 70 mm test mold, and the test specimens were formed using the wheel grinding method.
(3)
After curing at 15 °C for 4 days, the mold was removed, and the core was cut from the specimen. The size of the specimens was 380 mm × 65 mm × 50 mm, which were maintained at room temperature for 1 day.
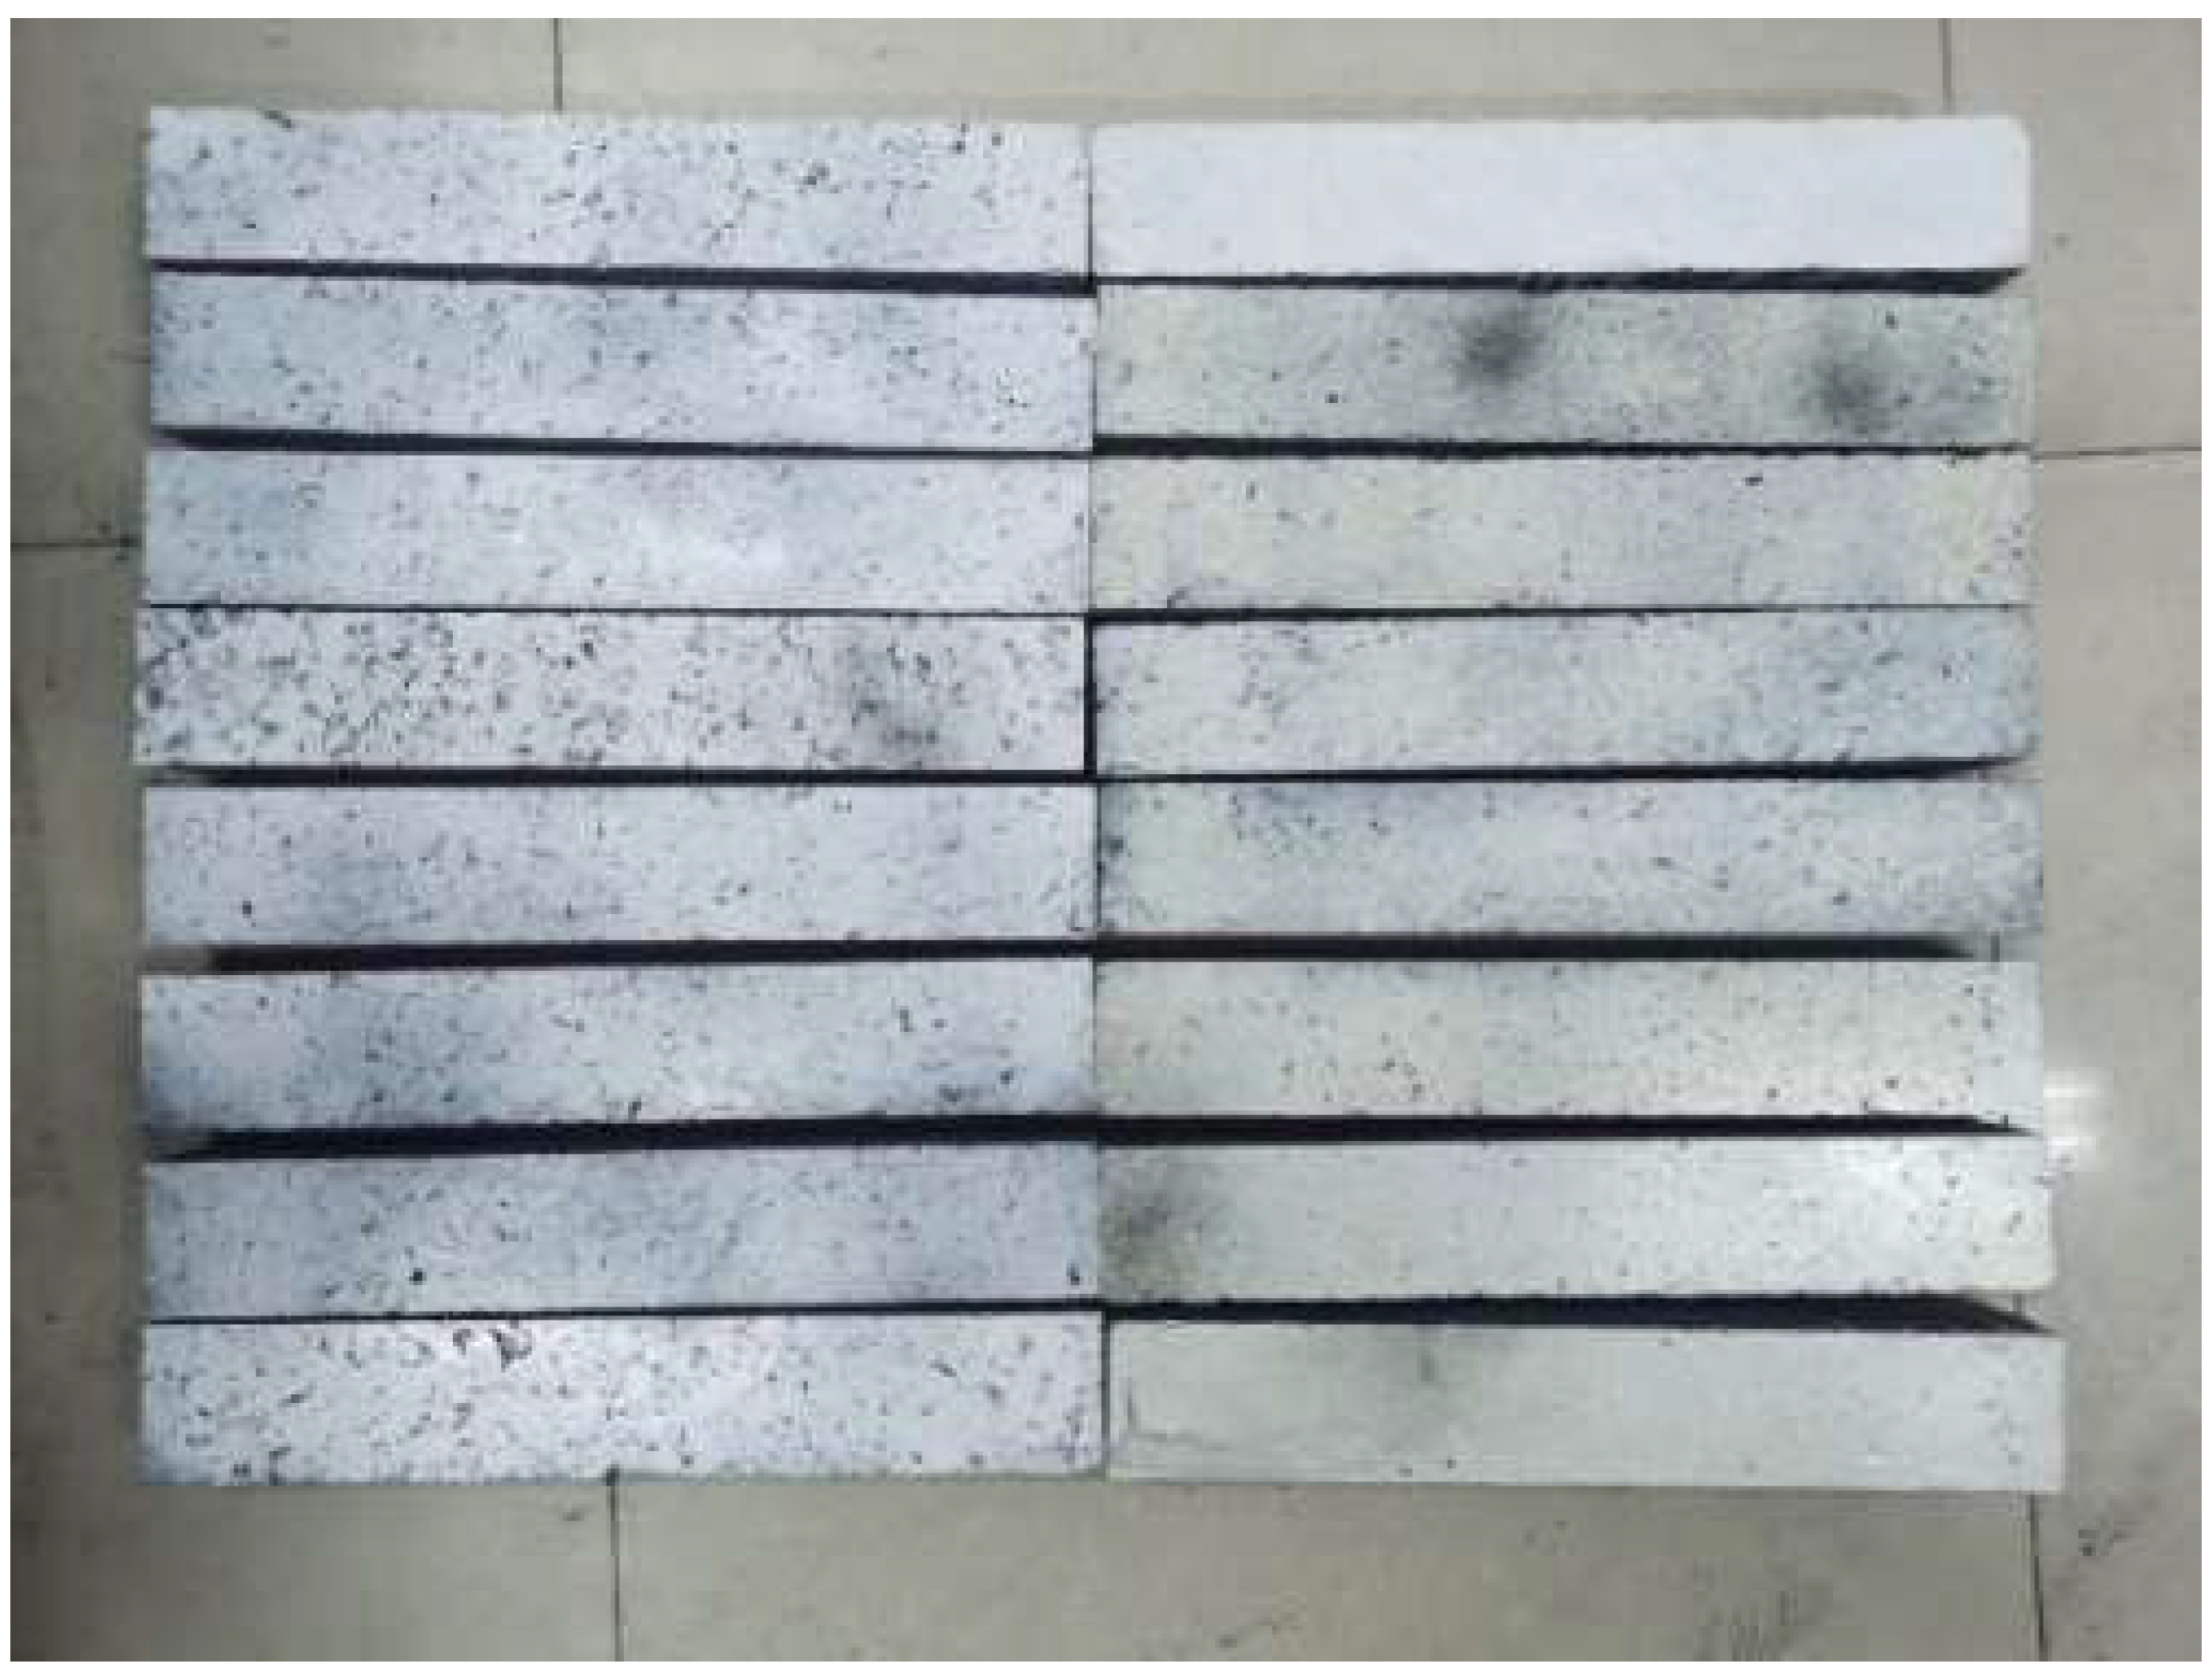
(4)
White matte primer was sprayed on the surface of the test specimens, followed by a matte black speckle; the finished specimens are shown in Figure 1.

3.1.2. Ultimate Bending Static Test

The Instron 8801 electro-hydraulic servo loading system was used for four-point bending loading in the ultimate bending static test. The net span of the test beam was 300 mm, and the length of the mid-span pure bend was 100 mm. The four-point bending loading layout is shown in Figure 2 and Figure 3. The displacement control mode was used for loading, and the loading rate was 0.01 mm/s. During the loading process, the time, displacement, force, and bending stress were recorded.

3.1.3. Four-Point Bending Fatigue Test

In the stress control mode fatigue test, the obvious fatigue fracture of the specimens was taken as the failure state standard [23]. The stress control mode can describe a situation where the pavement stiffness is large, the surface strain increases rapidly, and the final pavement fatigue cracks precisely [24]. Therefore, in this paper, the four-point bending fatigue tests of mixtures under different control load levels were carried out to evaluate the fatigue characteristics.
The four-point bending loading method was adopted to obtain an approximate one-dimensional force in the middle portion (i.e., the pure bending section). The fatigue loading and DSCM collection site are shown in Figure 3. One end of the test support rolls and the other end slides; the spacing is 300 mm, the loading spacing is 100 mm, and the supports are arranged on the left and right 1/3rd of the span.
(1)
Load waveform
Many studies have shown that the effect of the dynamic loading mode imposed on a road surface by a car driving on the road is similar to that of a sine wave [10]. When the frequency of the loading waveform is 10 Hz, it corresponds to the axle load effect of a vehicle traveling at 60–65 km/h [11]. Therefore, in this study, uninterrupted asymmetric equal-amplitude sine wave loading was used with a loading frequency of 10 Hz.
(2)
Load level
The load level is the stress level ratio; many previous studies have shown that, in comparison to SMA, PUM is suitable for structural layers with higher load levels [5,6]. Therefore, the load levels of SMA-10 were determined to be 0.3, 0.4, and 0.5, and the load levels of PUM-10 and PUM-13 were determined to be 0.5, 0.6, and 0.7.
(3)
Fatigue load cycle eigenvalues
The fatigue load cycle eigenvalue reflects the magnitude of the force change on the section [9]. The fatigue tests on relevant materials have shown that the fatigue loading cycle eigenvalue (ρ) is an important factor affecting fatigue failure [10]. The fatigue cycle eigenvalues of most pavement materials lie between 0.1 and 0.3, and the ρ value of the four-point bending fatigue is taken as 0.1. The specific load parameters of the four-point bending fatigue test are summarized in Table 5.
(4)
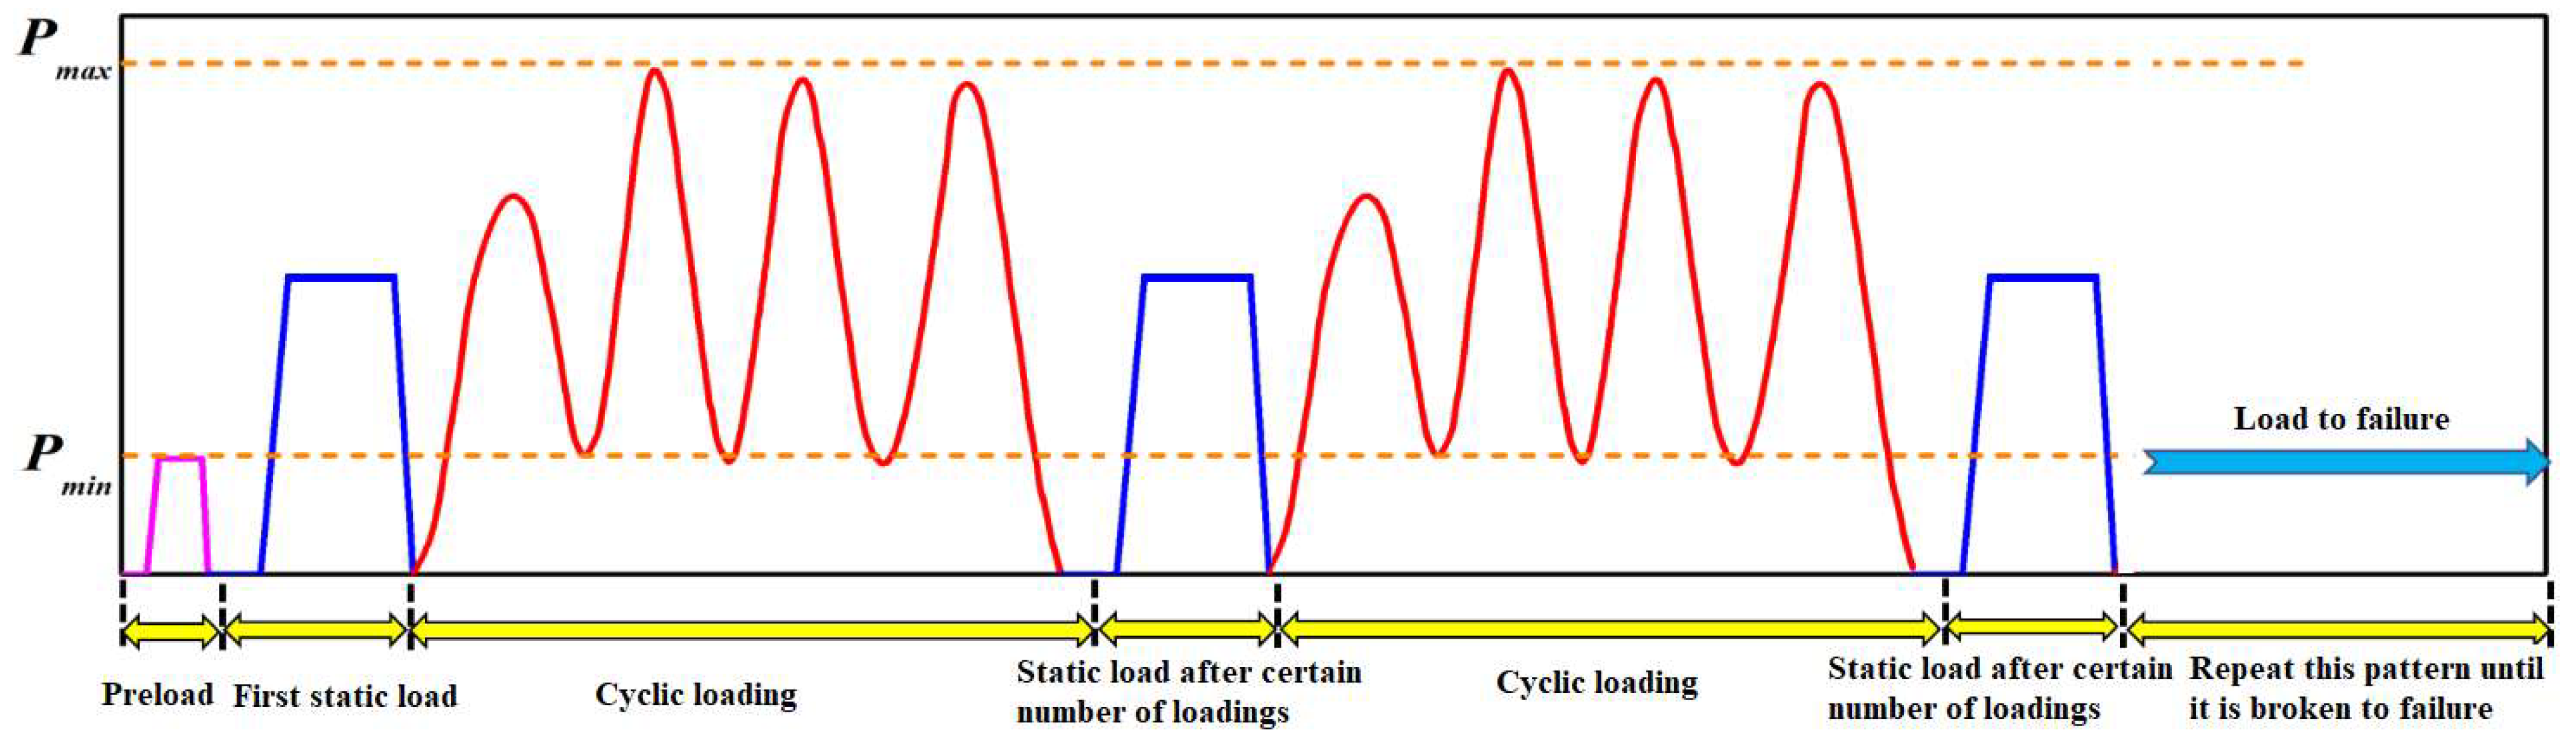
Loading process and method
First, preload the sample to the minimum load (0.1 kN) to ensure that the indenter is in close contact with the specimen and will not be emptied; further, observe the working status of each piece of equipment [24]. Second, apply the initial static load. Before the formal fatigue test, load the sample gradually to the median value of the fatigue limit. The static load takes 20 s to complete initial DSCM data acquisition. Then, start the sine wave fatigue loading, and perform static load tests after a certain number of loadings [25]. The static load value is the median value of the fatigue limit, which lasts for 20 s. During this process, complete the DSCM data collection. Repeat fatigue loading and dynamic loading until the specimen fails. The specific loading procedure is shown in Figure 4.

3.1.4. The DSCM Test

The DSCM equipment is a Xi’an Xintuo three-dimensional full-field strain measurement system. The equipment comprises an image acquisition and analysis system, two high-precision TAWOV cameras, a plane calibration board, a control box, a high-performance workstation, and a blue light source. The control box links the signals of the software and hardware. The TAWOV camera has a length of about 80 mm, a lens focal length of 25 mm, a resolution of 2448 × 2048, and 5 million pixels; the fixed included angle between the two cameras is 25°.

3.2. Calculation Method

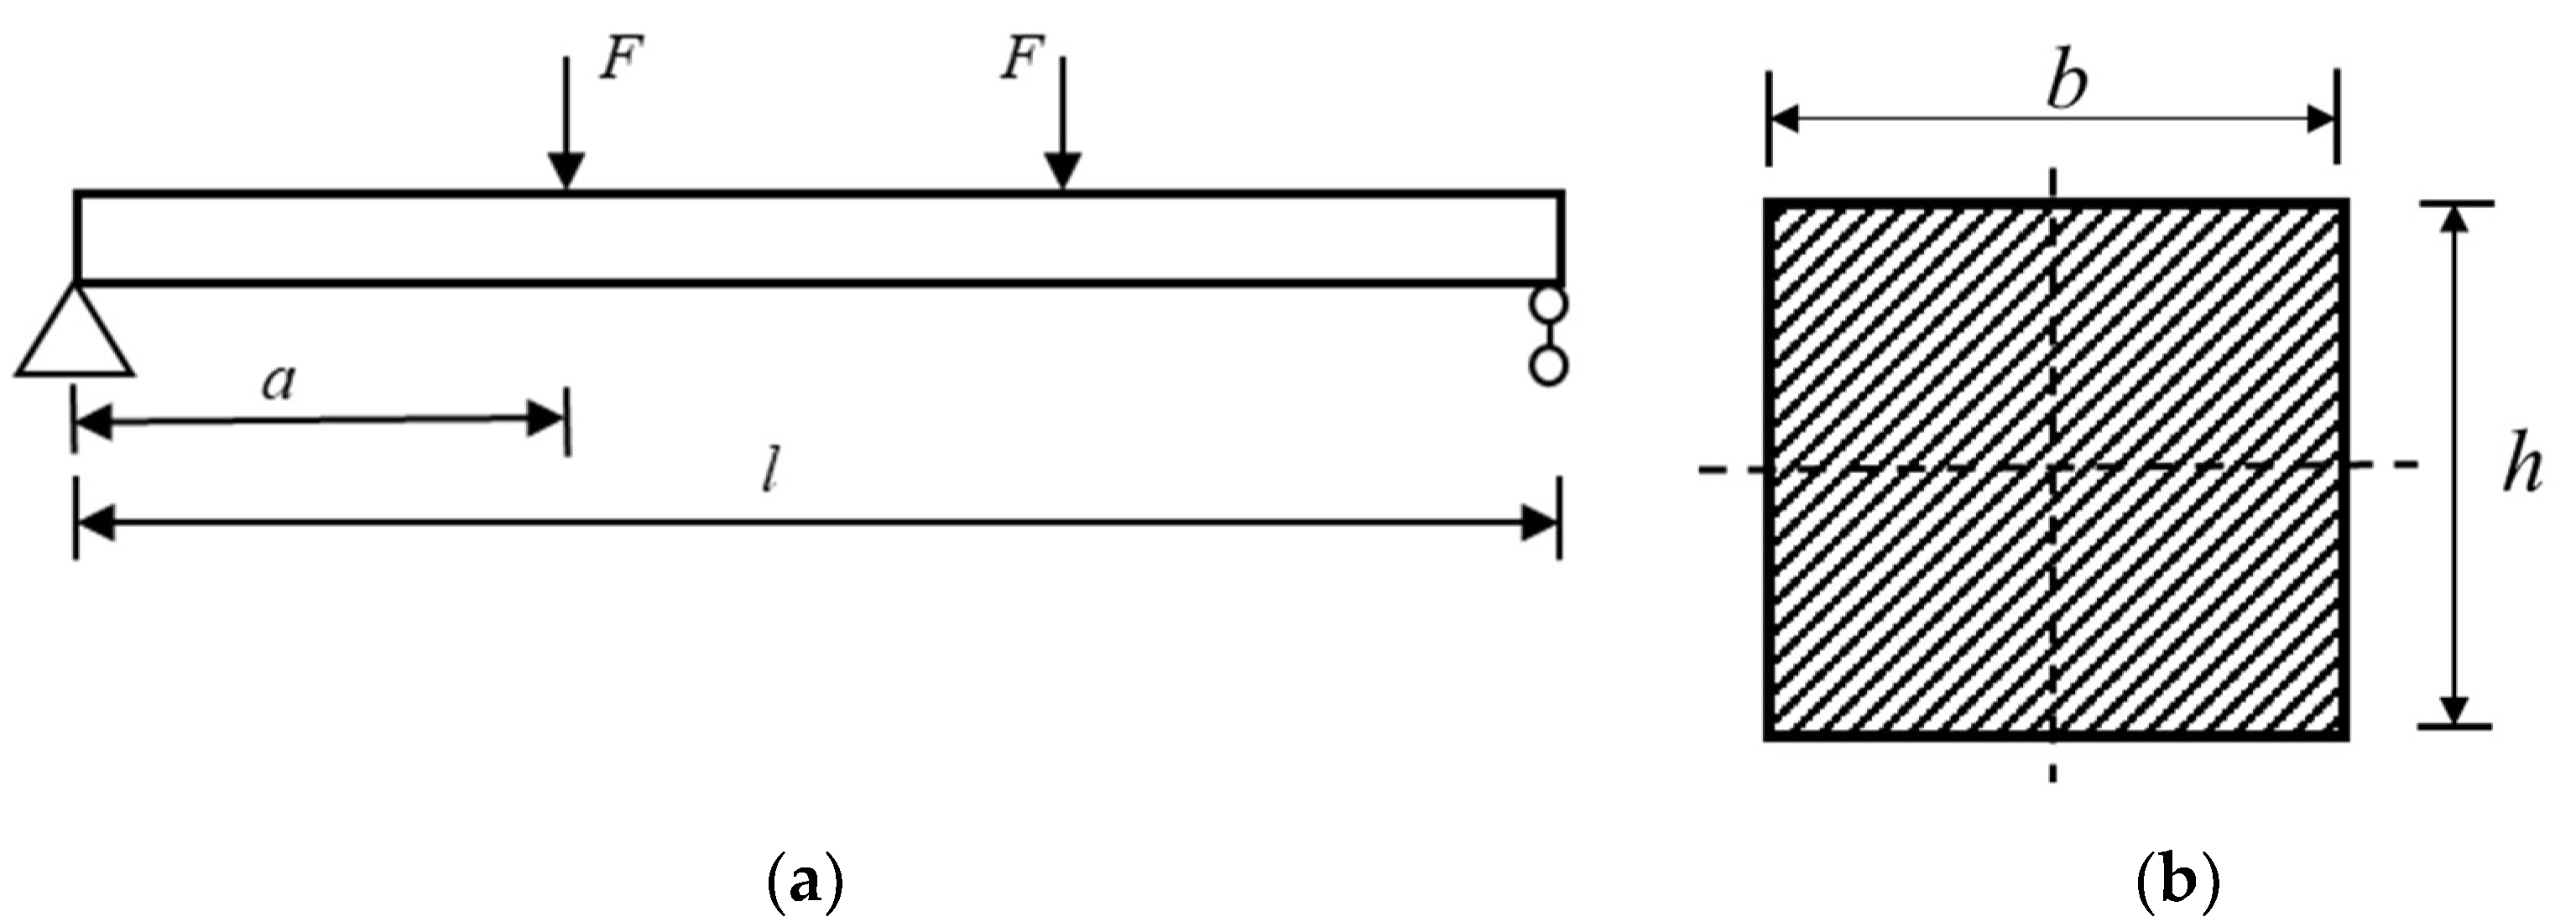
3.2.1. Calculation Method of a Simply Supported Beam with Equal Moments

According to the force analysis of a simply supported beam with equal bending moments, the parameters—such as the loading, stiffness, and deflection—can be calculated. The destructive characteristics of PUM are similar to those of cement concrete, so the stiffness is used to evaluate the bearing capacity of PUM specimens [24,26]. The loading method of the test beam and its cross-sectional size are shown in Figure 5. It can be observed that this is a typical case of a simply supported beam with a constant bending moment, so the equations for the moment of inertia and deflection can be obtained, as shown in Equations (1) and (2), respectively.
I = 1 12 b h 3
ω m a x = F a 24 E I 3 l 2 4 a 2
where b is the width of the rectangular section, mm; h is the section height, mm; l is the simply supported beam span, mm; F is the load, N; a is the distance from the loading point to the fulcrum, mm; E is the elastic modulus, MPa; I is the moment of inertia to the main shaft, mm4; ω max is the deflection, mm; and a = l/3. The calculation formula for stiffness (EI) can then be obtained, as shown in Equation (3).
E I = F a 3 l 2 4 a 2 24 ω m a x

3.2.2. Fatigue Damage Definition Based on Stiffness

Under repeated loading, the fatigue resistance of the beam decreases with increases in the number of loading cycles; therefore, the fatigue life of the beam continuously reduces, and the fatigue damage value is introduced to describe the damage status after different numbers of cycles [27]. The fatigue damage based on stiffness is defined in Equation (4).
D B = E I 0 E I n r E I 0 E I N r
where D B is the fatigue damage factor based on the residual stiffness, and its value range is [0, 1); E I 0 is the initial bending stiffness of the specimen; E I n r is the bending stiffness of the specimen under the nth fatigue loading cycle; and E I N r is the bending stiffness of the specimen under the Nth fatigue loading cycle (that is, when the beam experiences fatigue failure). A functional relationship between the fatigue damage factor (DB) and the fatigue life ratio n/N is established, as shown in Equation (5).
D B = E I 0 E I n r E I 0 E I N r = f n N

4. Results and Discussion

4.1. Static Load Failure Characteristics

The relationship of the span deflection with the bending force between the three mixing materials is shown in Figure 6. The bending strength test results of the three materials under static loading are shown in Table 6.
According to the deformation curves of the three mixtures, the bending failure processes of PUM and SMA differ under static loading. The bending failure of SMA-13 experiences an elastic stage, strain hardening stage, and stress relaxation stage, while the curves of PUM-10 and PUM-13 only experience an elastic stage and stress relaxation stage; the characteristics of the elastic stage are obvious, and the bending stress increases with increases in the mid-span deflection in this stage, which has an approximately linear trend.
The deformation ability of the PUM test specimens is very weak. The mid-span deflections of PUM-10 and PUM-13 are less than 2 mm, while the mid-span deflection of SMA-10 reaches 20 mm. However, the bending failure strength of PUM is significantly higher than that of SMA, and the bending failure strengths of PUM-10 and PUM-13 are about four times that of SMA-10. The bending load time of PUM-10 and PUM-13 is about 2 s, while that of SMA-10 is about 44 s. This indicates that the failure mode of PUM under bending static loads is brittle failure, which is similar to that of cement concrete [22,23]. The reason is analyzed that the urea bond is formed by the reaction of isocyanate groups (NCO) in the PU binder and water, then the urea bond and metal oxide chelate to form the urea metal oxide complex due to the hydrogen bond, so that the PUMs have high strength and strong load resistance. However, when the failure load of the PUMs is reached, the interface between the PU binder and aggregates, or the aggregate in the mixture, is suddenly damaged, resulting in brittle failure. Therefore, the stiffness and fatigue damage factor based on stiffness degradation are used to evaluate the fatigue characteristics and fatigue damage of PUM, respectively [24].

4.2. Fatigue Characteristics of PUM

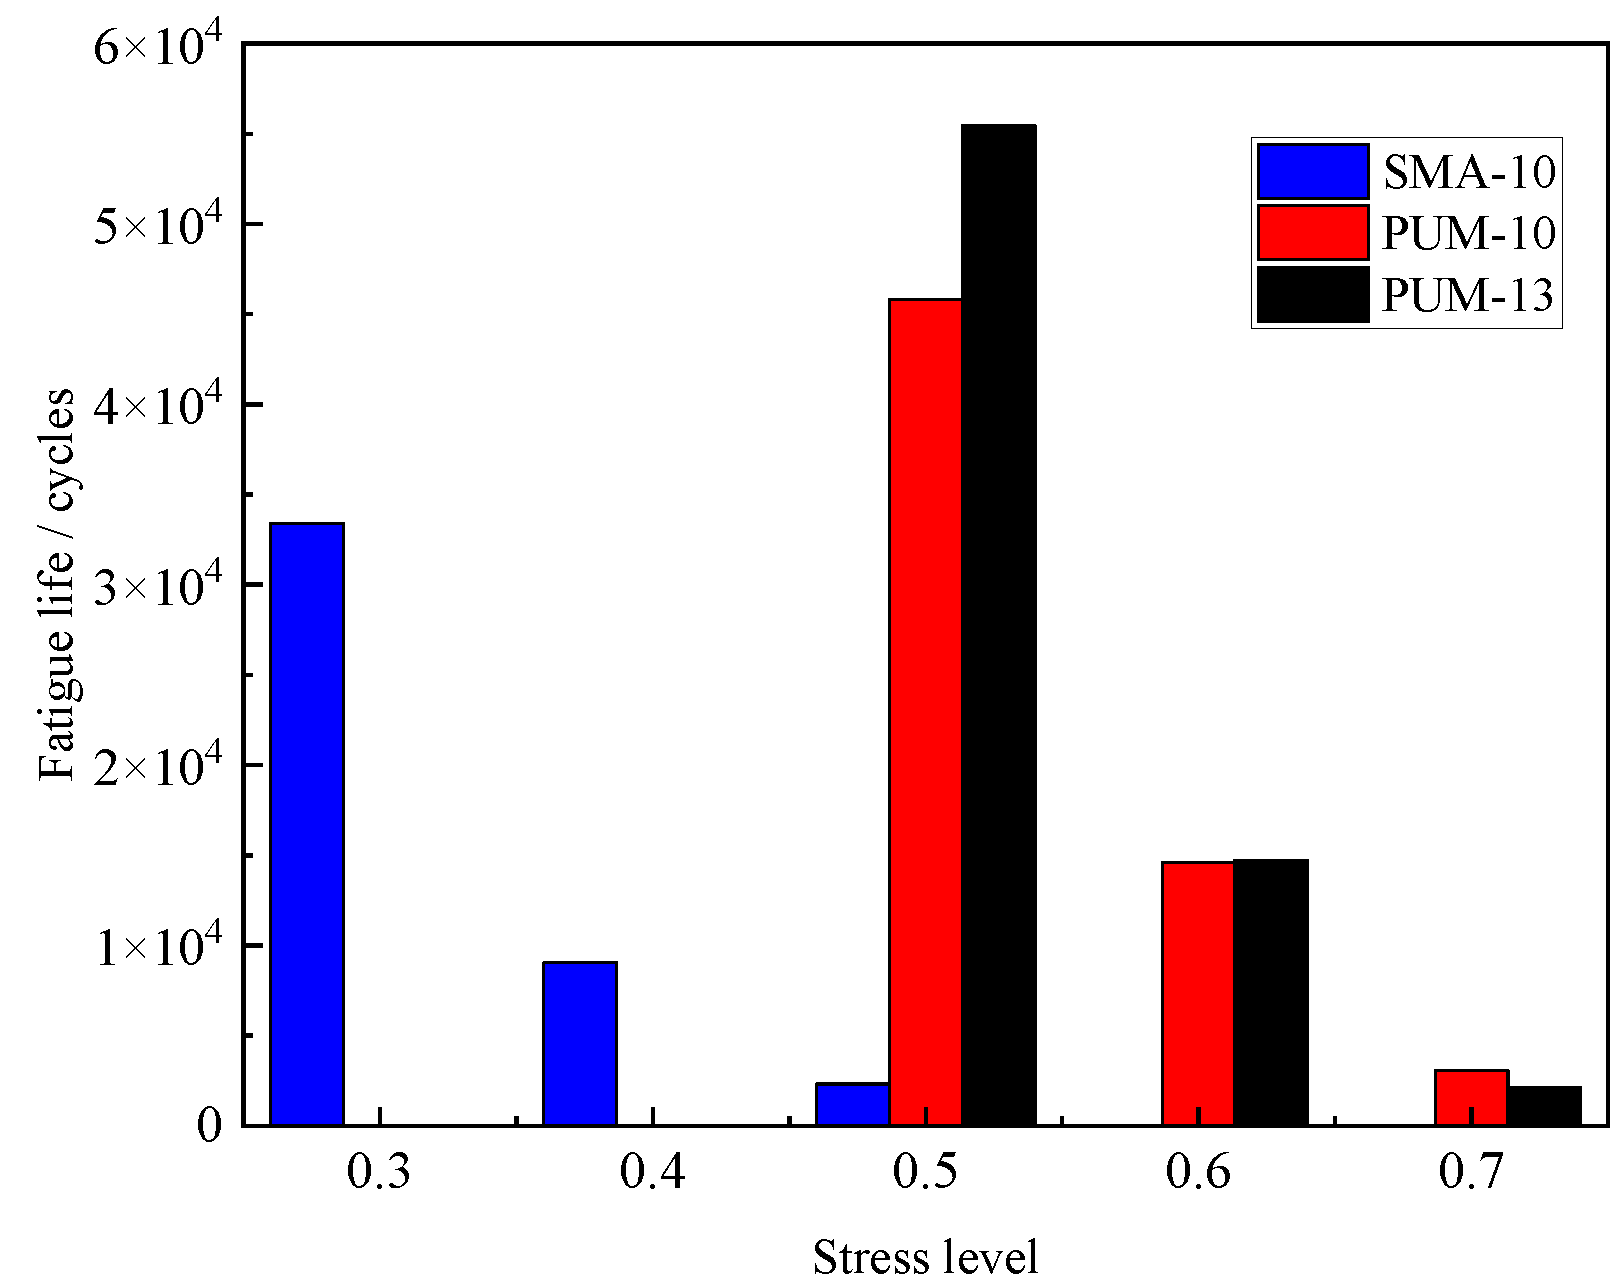
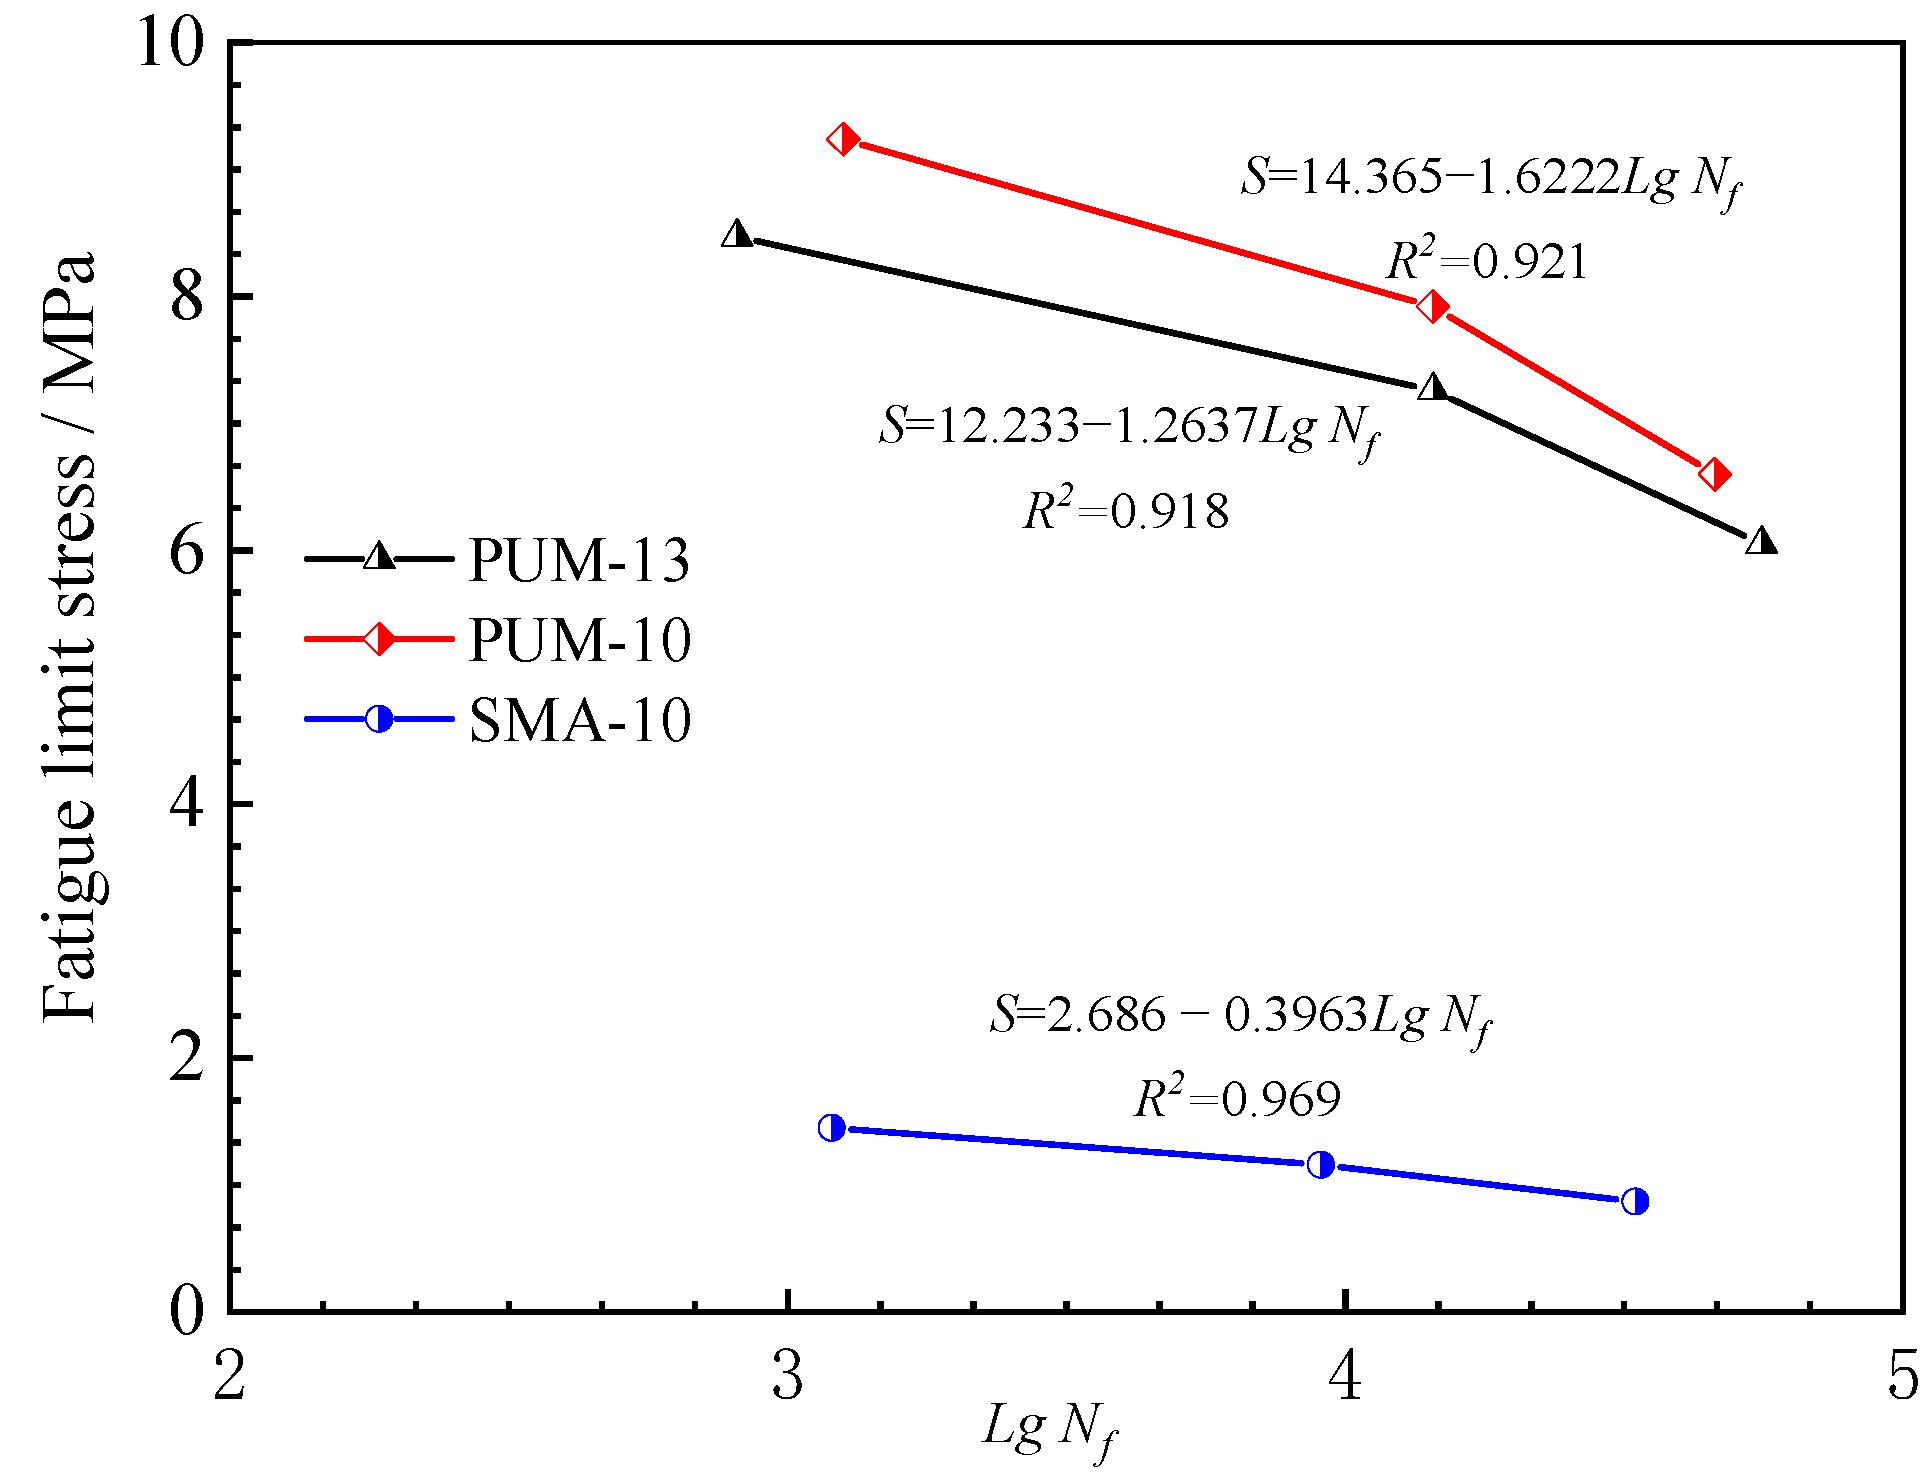
4.2.1. Fatigue Life Analysis of PUM

The four-point bending fatigue life test results of the three mixtures under different loading levels are summarized in Figure 7, and the relationship between the fatigue life and fatigue limit stress is shown in Figure 8.
By analyzing the data in Figure 7 and Figure 8, it can be observed that the fatigue lives of PUM-13 and PUM-10 are 47 times and 38 times that of SMA-10 at a 0.5 load level, respectively. The fatigue life and fatigue limit stress curves show that the fatigue lives of PUM-10 and PUM-13 are much larger than that of SMA-10 under the same bending stress, indicating that the fatigue resistance of PUMs is better than that of SBS-modified asphalt mixtures.
A logarithmic relationship exists between the fatigue life (Nf) and bending control stress of the three mixtures. In the field of fatigue, Nf < 104 is generally defined as low-cycle fatigue, and Nf > 104 is defined as high-cycle fatigue [24,25]. It can be observed from the curves that the slope and intercept of PUM-10 and PUM-13 are larger than those of SMA-10, indicating that PUM can significantly improve the low-cycle fatigue load; that is, at high bending stress levels, PUM exhibits obvious improvements in terms of the bending fatigue life than at low-stress levels.

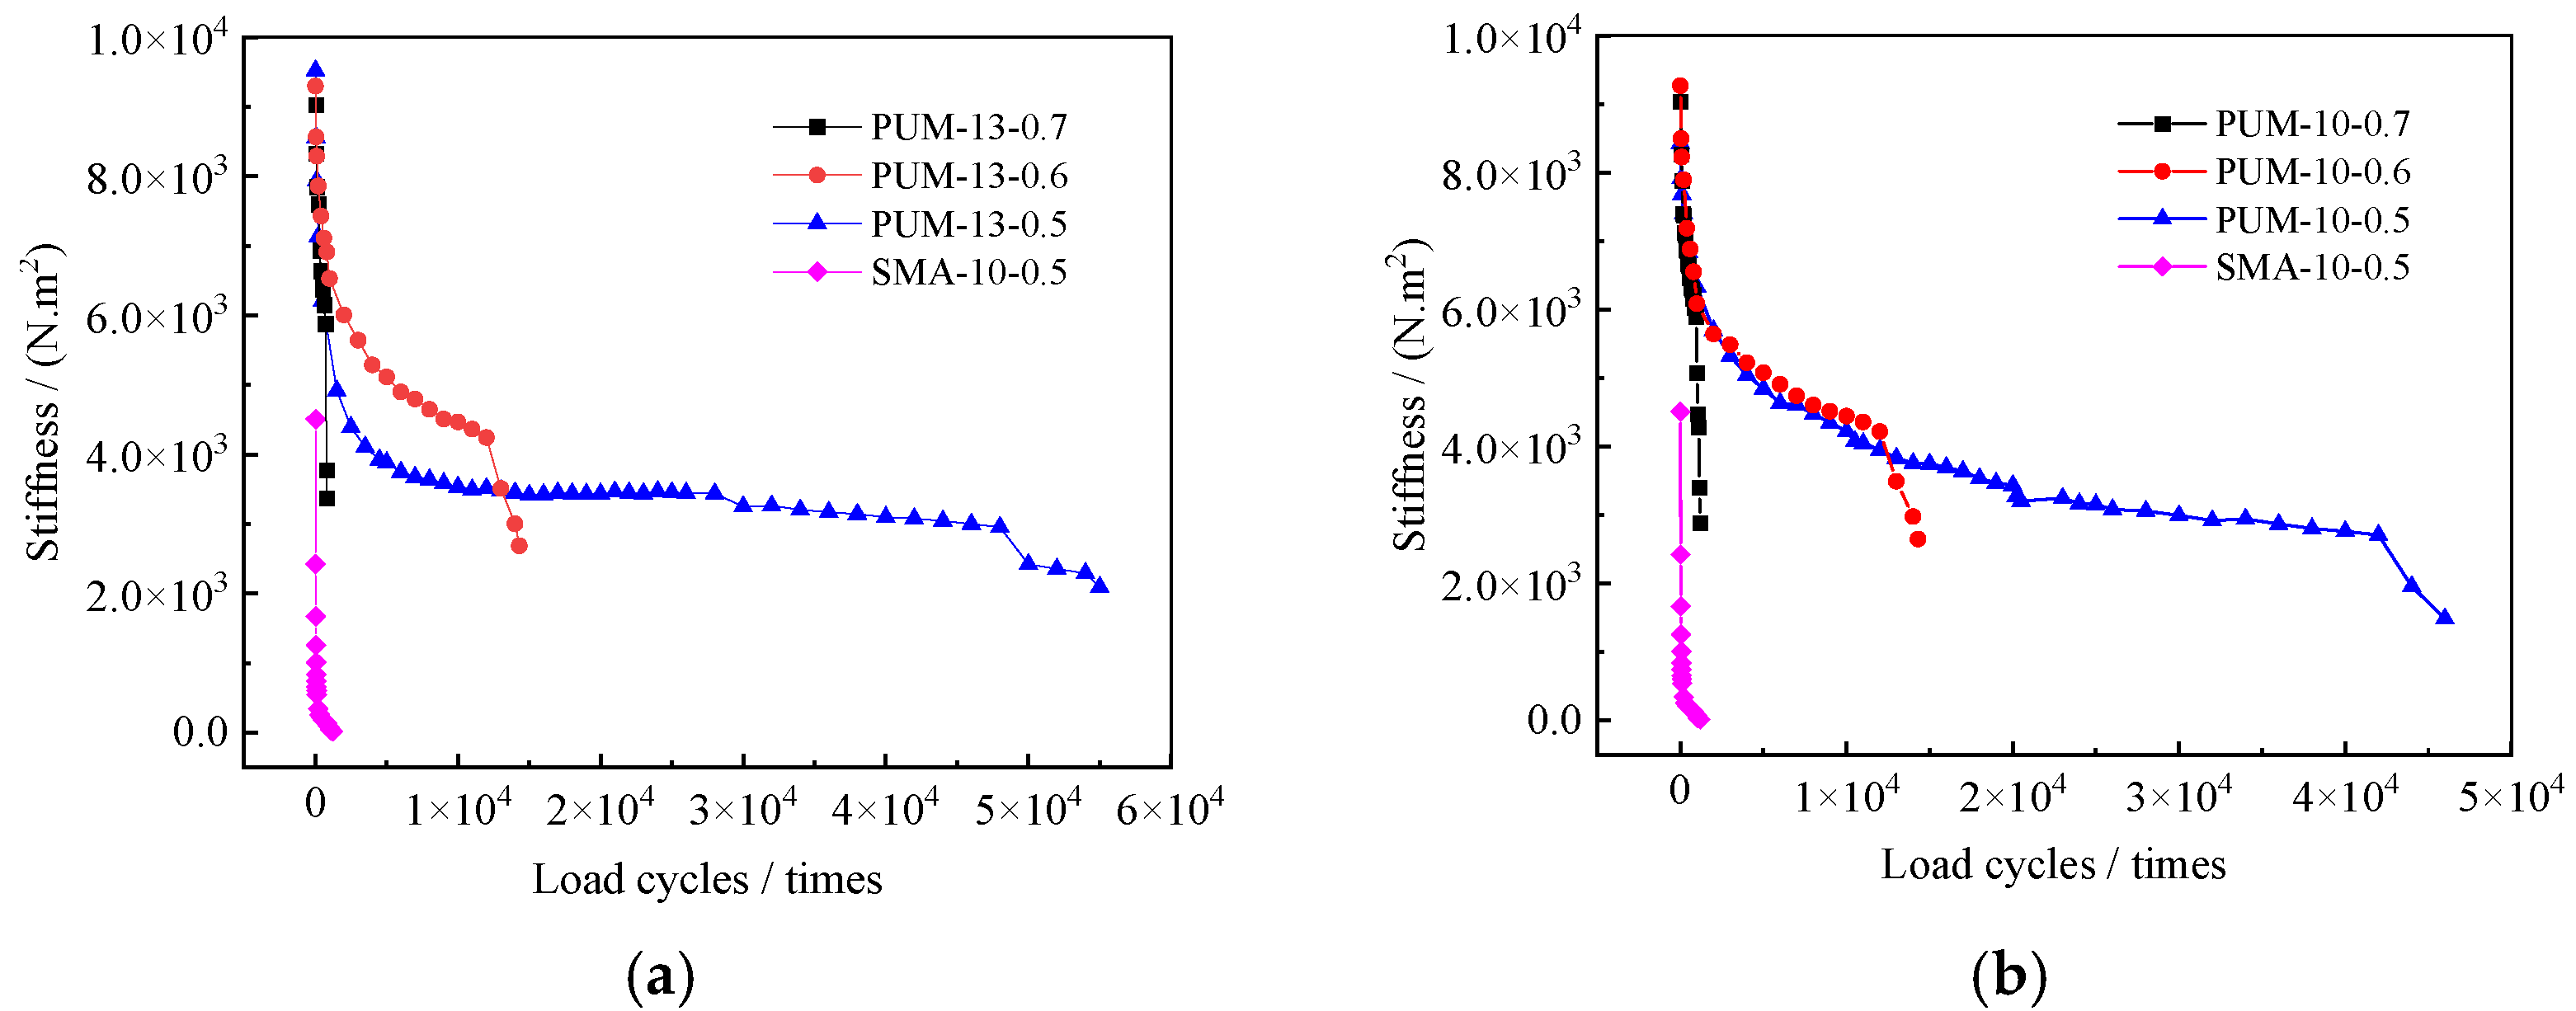
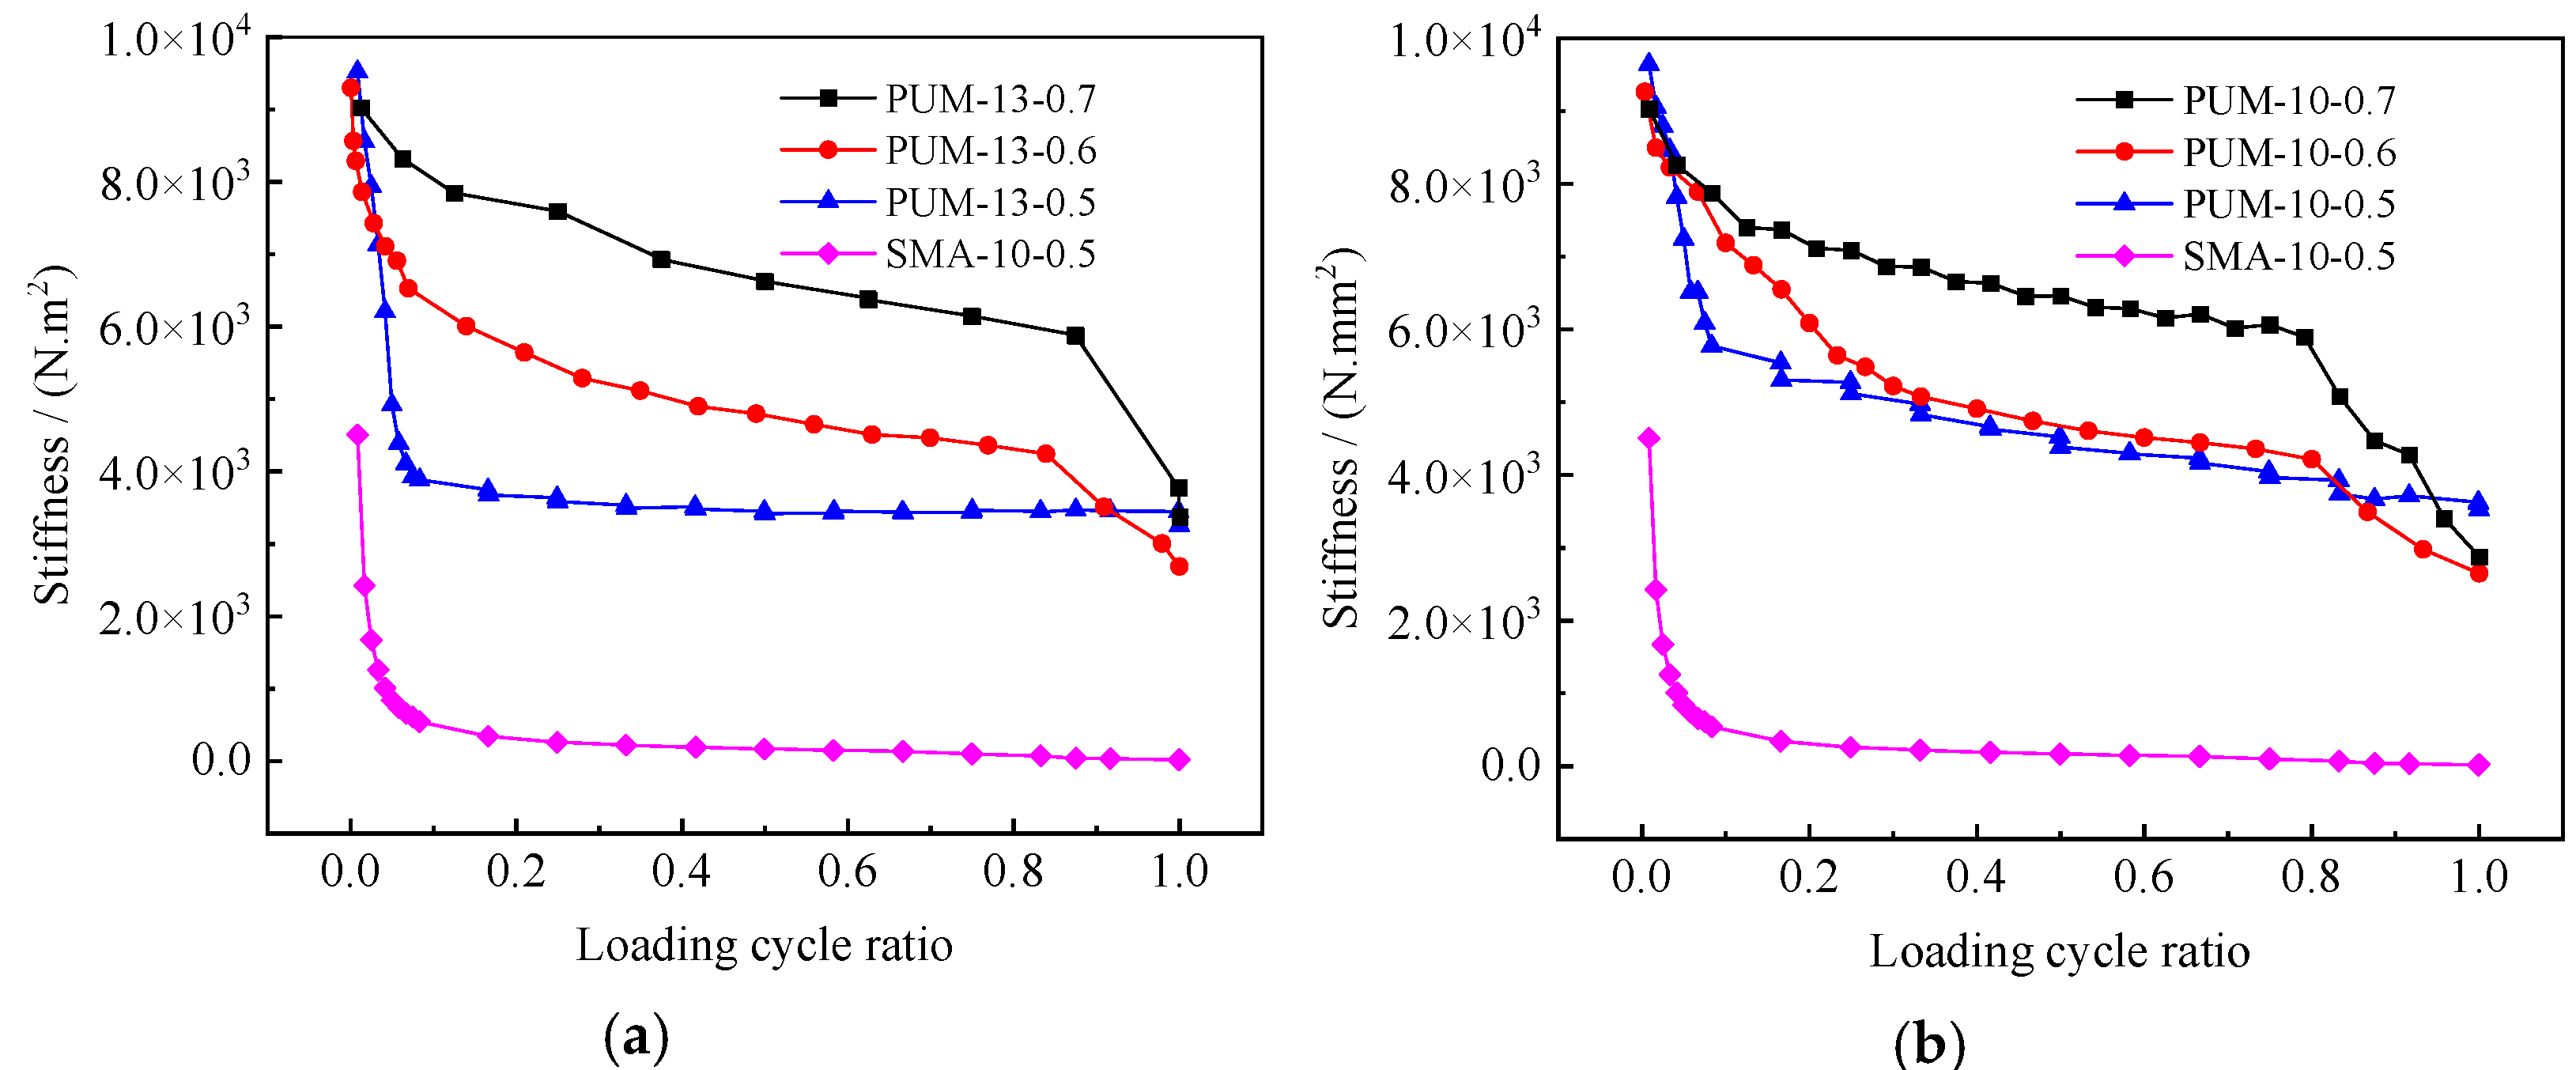
4.2.2. Variation Trends of Stiffness

The stiffness of PUM-13, PUM-10, and SMA-10 at different loading levels of the four-point bending fatigue test are summarized in Figure 9.
As shown in Figure 9, the higher the loading level, the greater the reduction rate of stiffness for the same particle size of a given PUM. This leads to a lower fatigue life of PUM at higher loading levels. The change laws of the stiffness and fatigue life of PUM-13 and PUM-10 at the same load level are similar. These results indicate that the gradation type has little effect on the fatigue properties of PUM.
The initial stiffnesses of PUM-10 and PUM-13 are about twice that of the SMA-10 at a load level of 0.5, and the stiffness at failure of PUM-10 and PUM-13 is significantly higher than that of SMA-10. This implies that the fatigue resistance of PUM is higher than that of SMA [27].
The stiffness of PUM-10 and PUM-13 typically experiences three stages. First, there is a rapid decrease in the stiffness at the initial stage of fatigue, which is caused by the initial damage to the material and the formation of matrix cracks; second, the stiffness enters the stage of slowing down, basically exhibiting the characteristics of linear decline; third, in the final stages of fatigue life, the stiffness decreases rapidly, which corresponds to the rapid accumulation and concentrated evolution of damage. To describe these three stages more clearly, the change curves of stiffness with different load cycle ratios are plotted in Figure 10.
As shown in Figure 10, the fatigue failure law of PUM presents an obvious S-shaped three-stage development curve. The first stage is the development stage, where the stiffness is greatly reduced within the first 10–20% of the fatigue life; the second stage is the stable stage, which accounts for about 70–80% of the entire fatigue life, where the stiffness of the beam body maintains a relatively gentle attenuation; the third stage experiences the sudden changes in failure and accounts for about 10–20% of the entire fatigue process, where the structure is characterized by brittle fatigue fracture [26].
The load level has a significant effect on the three-stage history of the fatigue failure of PUM. At higher load levels, the development stage of the fatigue curve has a longer duration, the rate of reduction in stiffness is faster in the stable stage, and the reduction in stiffness in the brittle fatigue fracture stage is larger [27]. It is intuitively known that the slopes of the stable stage and brittle fatigue fracture stage of the stiffness curve at higher load levels are larger; that is, the slope of the stiffness curve at a 0.7 load level > 0.6 load level > 0.5 load level.
The stable stage of SMA takes a long time to complete, and the distinction between the failure stage and the stable stage is not obvious. This is because the fatigue failure form of SMA is viscoelastic damage at the tested temperature [11].

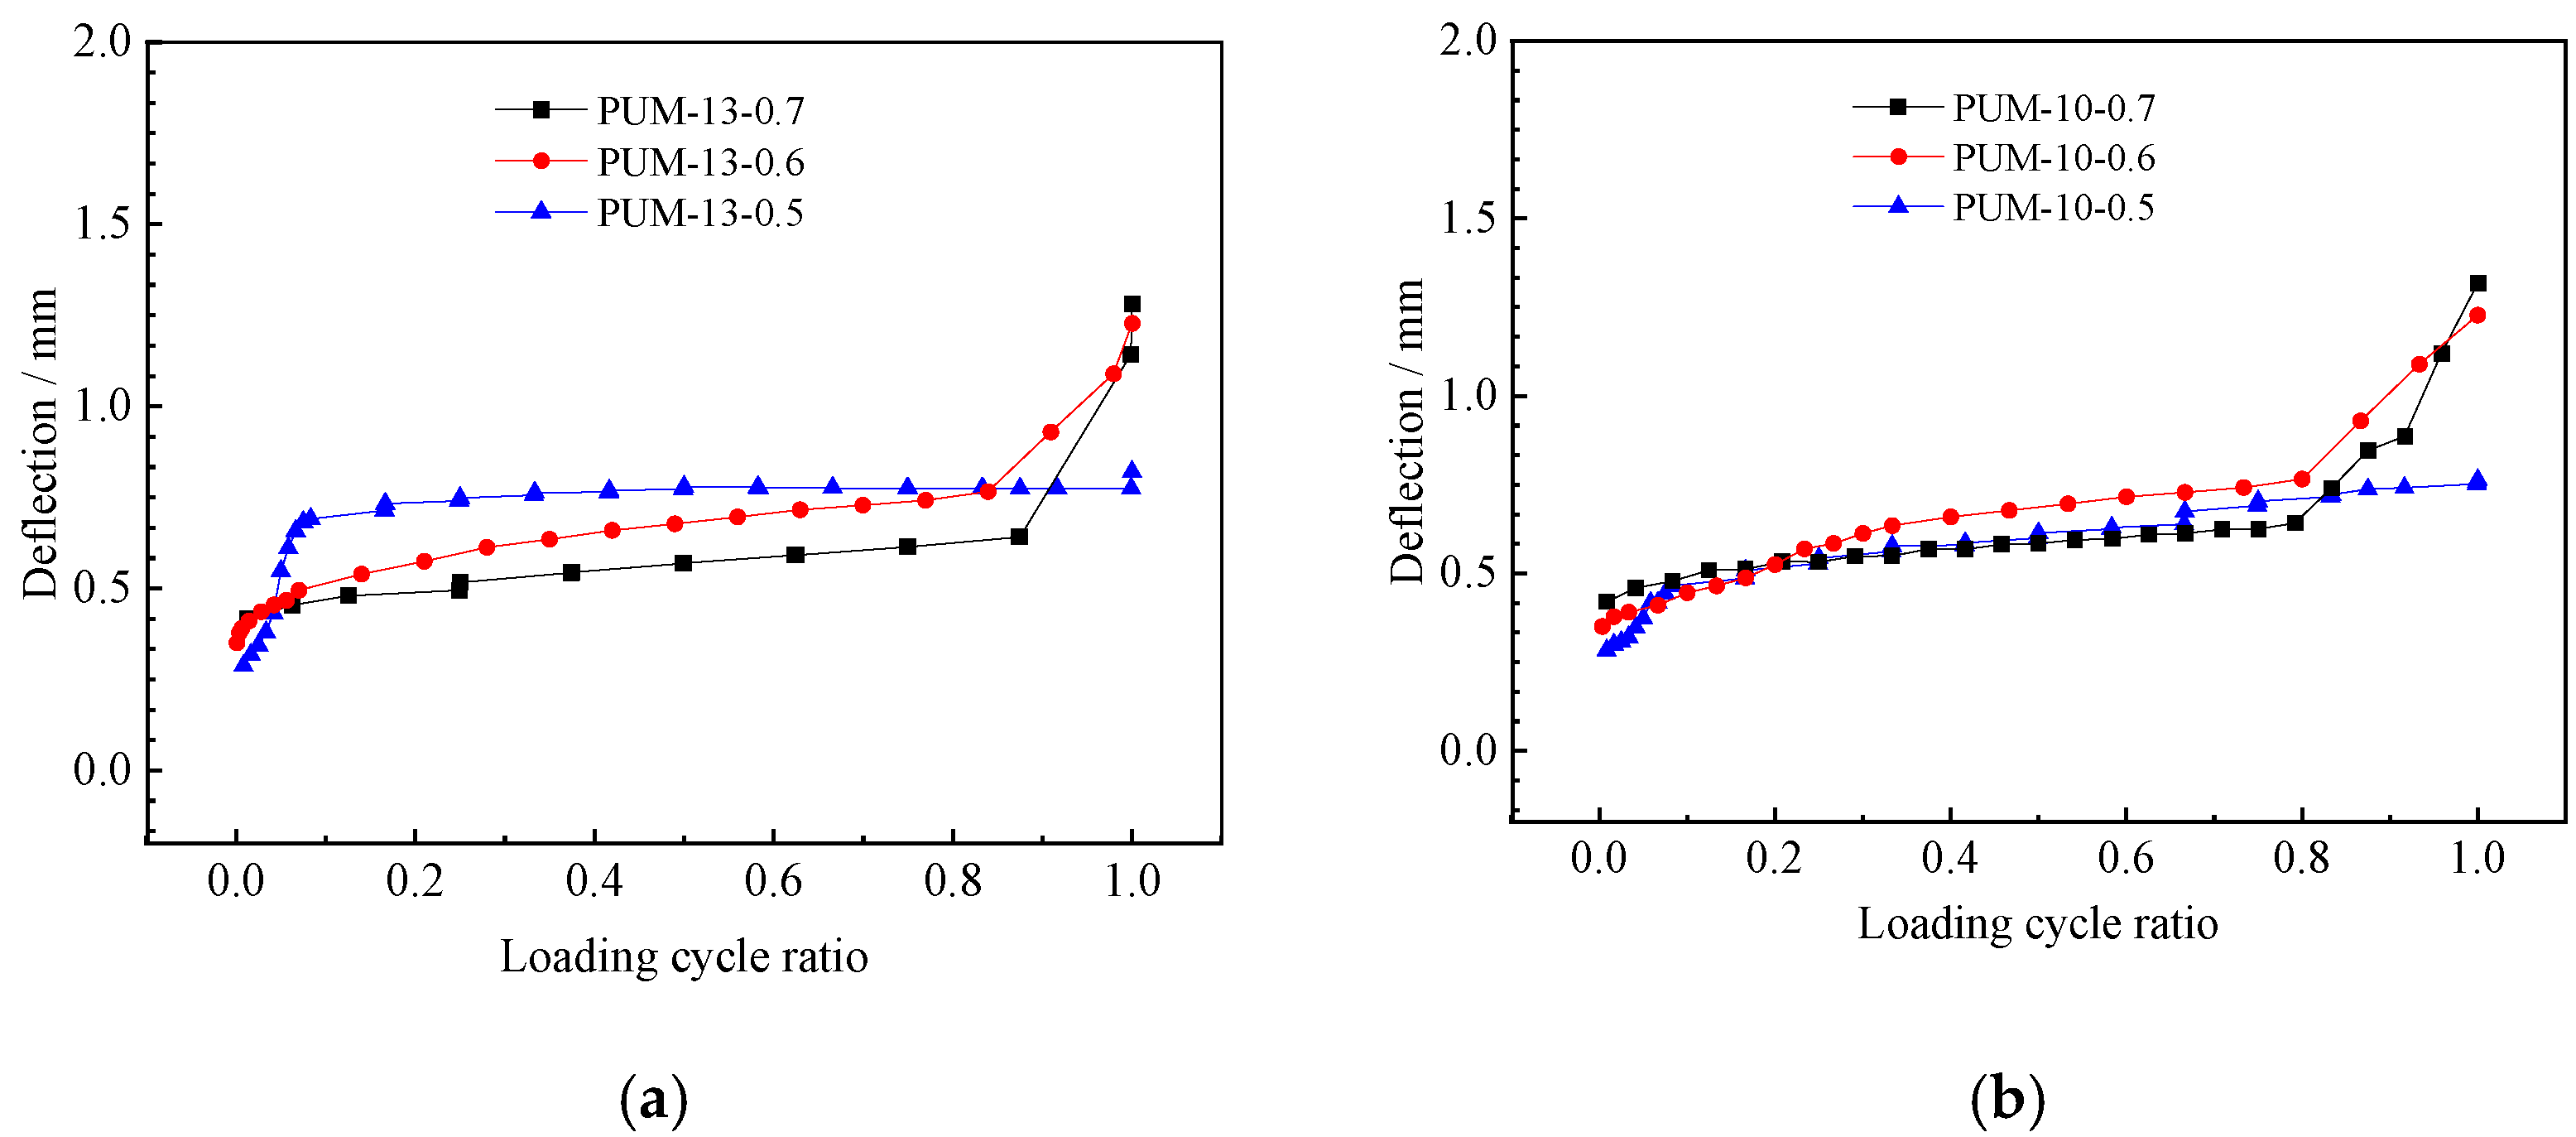
4.2.3. Development Law of the Mid-Span Deflection

The deflection change reflects the overall fatigue performance of the structure. Figure 11 shows the curve between the loading cycle ratio and deflection of PUM-10 and PUM-13. It can be observed from the figure that the deflection curve exhibits the following three stages: the rapid development stage, the deformation stability expansion stage, and the instability development stage; that is, the mid-span deflection develops obviously in the first 10% of cyclic loading, the mid-span deflection increases slowly during 20–80% of cyclic loading, and within 90–100% of cyclic loading, the fatigue failure stage is completed; the deflection subsequently enters the rapid development stage once again [12,13]. At lower load levels, as shown in the deflection curve of the 0.5 load level, the deflection of the test beam changes greatly at the initial stages of fatigue loading and at the time of fatigue fracture; that is, the front and rear sections of the curve are relatively short and the middle section is long. However, at a higher load level, as shown in the deflection curve of the 0.7 load level, the rapid fatigue development stage and fatigue failure stage last a relatively long time.

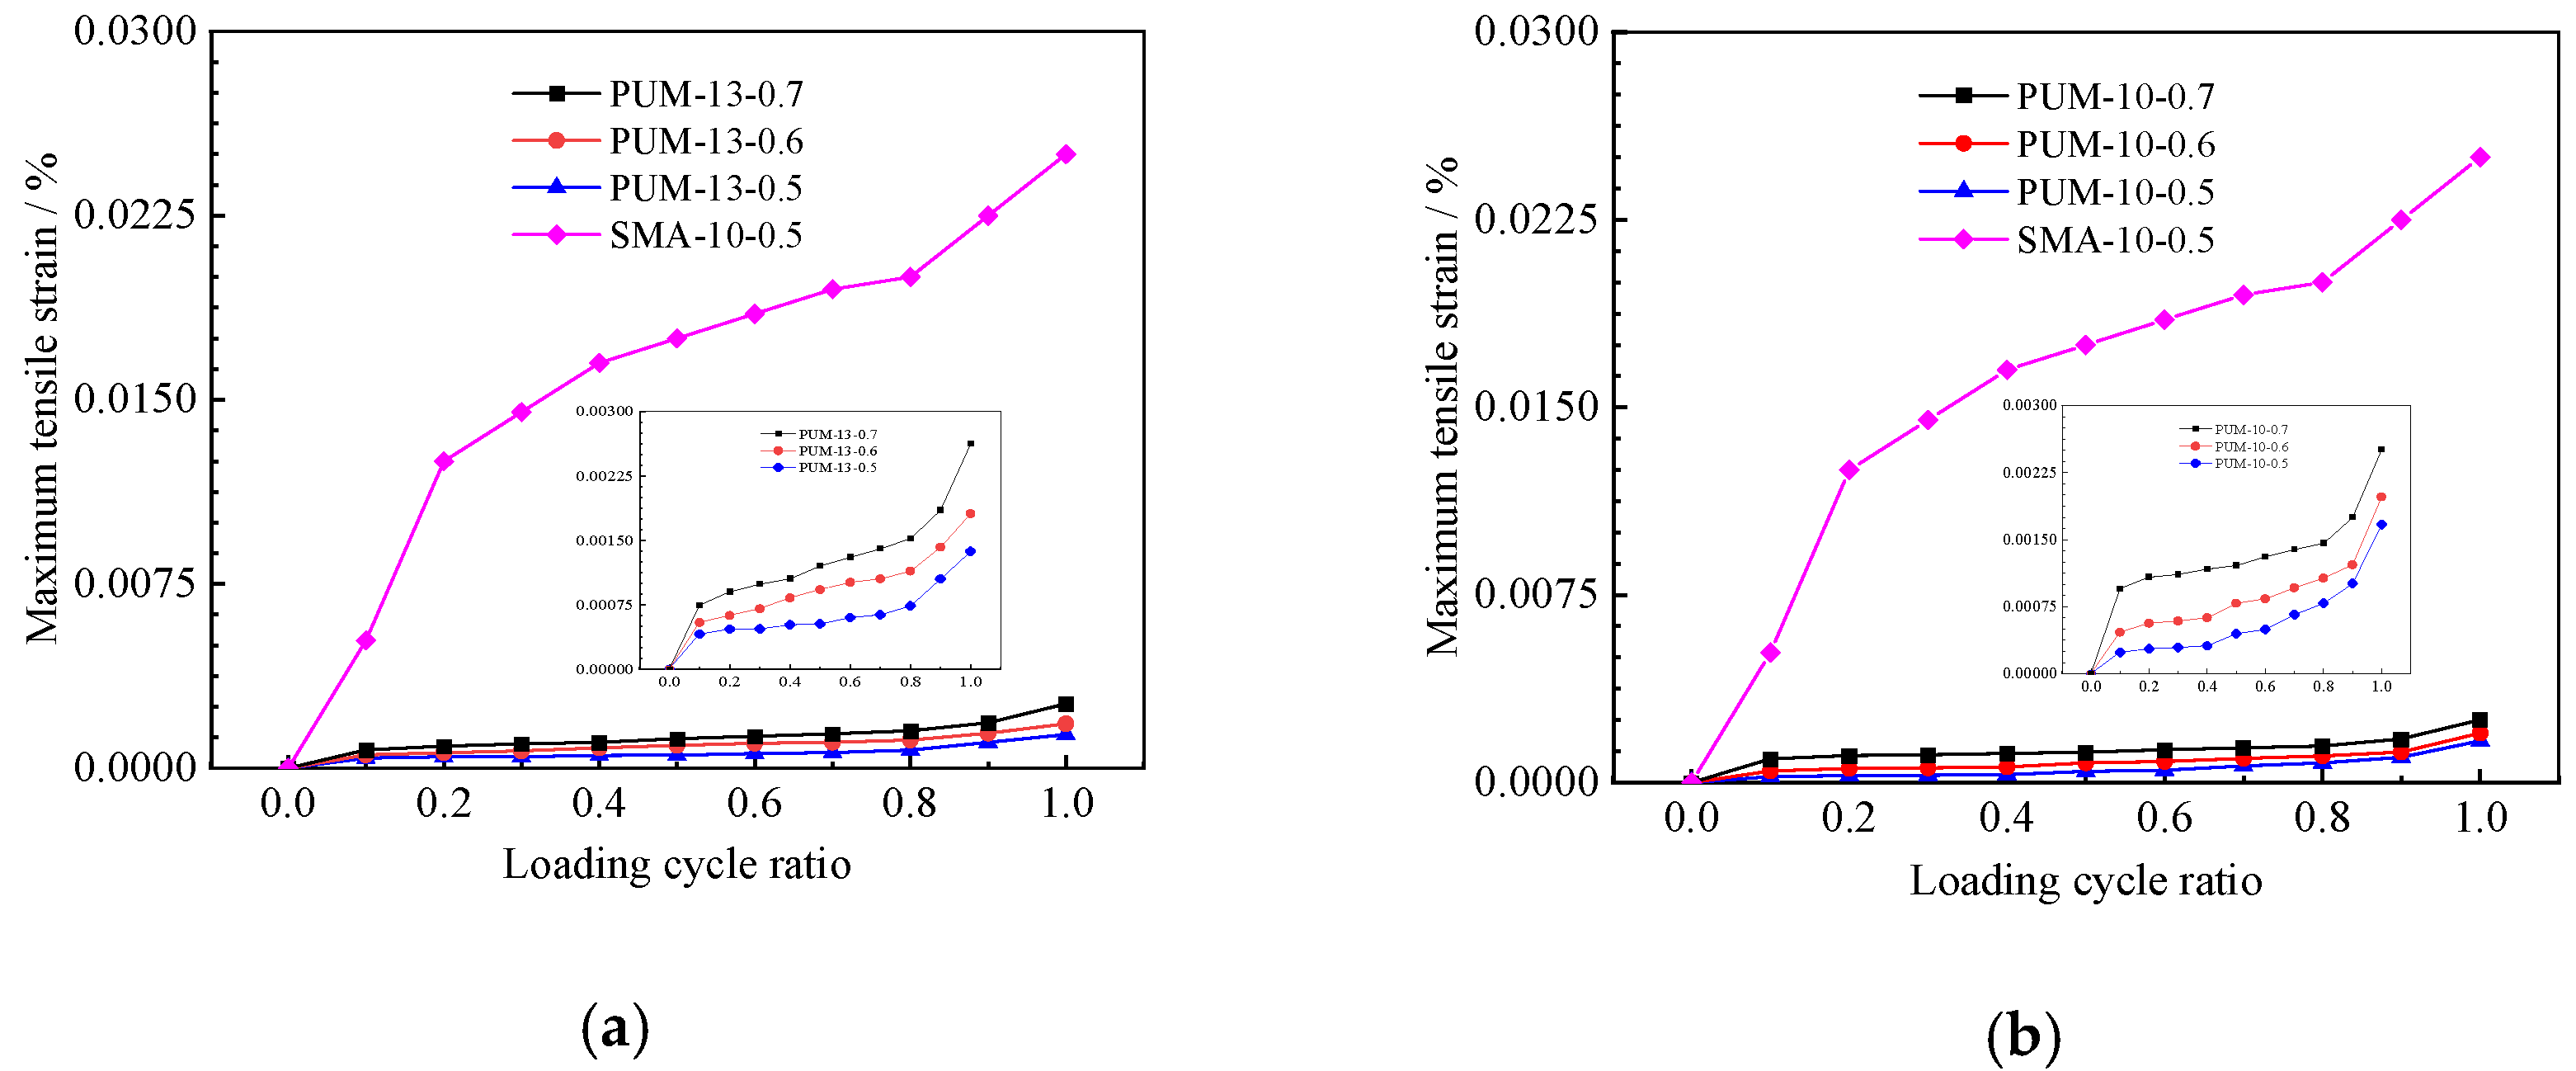
4.3. Analysis of the Maximum Tensile Strain Based on DSCM Data Acquisition

Strain is also an evaluation index for the deformation capacity of asphalt materials. A series of strain analyses were performed on the asphalt mixture by using DSCM equipment. Figure 12 shows the curve between the maximum tensile strain at the bottom and the loading cycle ratio.
It can be observed from Figure 12 that the maximum tensile strain and development speed of SMA-10 are much higher than those of PUM-10 and PUM-13. The development of the maximum tensile strain of PUM and SMA exhibited a development trend of “three stages”: the rapid development stage, the deformation stability expansion stage, and the instability development stage. It can be observed that the PUM specimens undergo rapid bending deformation under loading, cracks and expansion begin to occur at the internal defect positions, and the rate of change subsequently slows down. This is because the PU binder acts as a bridge to bear part of the load and prevents the specimen from continuing to crack [7]. However, when reaching the third stage, the tensile strain increases sharply from approximately horizontal development to failure, and the fracture mode is similar to brittle fracture. The failure modes of PUM at different loading levels are similar. This type of failure mode has a great impact on the structural safety, and it is necessary to carry out research on the relevant damage mechanism to accurately predict the fatigue characteristics.

4.4. Fatigue Damage Characteristics of PUM

4.4.1. Development Law of Fatigue Damage Based on Stiffness

The fatigue damage factor of PUM under different loading levels was calculated according to Equation (5). Figure 13 shows the fatigue damage factor curves under different loading cycle ratios.
It can be observed from Figure 13 that the damage curves of PUM and SMA are different. At the loading level of 0.5, SMA-10 exhibited two-stage damage characteristics, and the 0.9 damage factor was completed at a loading cycle ratio of about 20%; the stage of slow development of fatigue damage until failure was then entered. The reason for this phenomenon is that the load level of 0.5 is a high stress level for SMA, which leads to a large amount of damage in the early stages of loading [6,28].
The fatigue damage factor curves with the three loading levels of PUM-10 and PUM-13 exhibit the same pattern; that is, there is a rapid increase in the initial stages of life, which is caused by the initial damage to the material and the formation of matrix cracks at the beginning of the fatigue life. When the matrix cracks reach a certain density, the characteristic damage state appears, the matrix cracks increase no more, and the damage factor growth becomes moderate, basically exhibiting a linear increase. In the final stages of life, damage accumulates rapidly and evolves intensely. Furthermore, the higher the load level of PUM, the faster the development of the concentrated evolution stage of the damage factor curve.
It may be that SBS-modified asphalt is a kind of viscoelastic binder, so SMA-10 has strong deformation capacity under load. When the fatigue damage factor reaches 0.9, it can still bear the load. The PU binder bonds the aggregate through the curing reaction, thus the PUM has high strength and relatively low deformation resistance. The fatigue damage factor develops relatively slowly under cyclic load, however, when the failure load of the PUMs is reached, the interface between the PU binder and aggregates, or the aggregate in the mixture, enters the final stage of life, and damage accumulates rapidly and evolves intensely.

4.4.2. Fatigue Damage Function Construction Based on Stiffness Degradation

Determining the fatigue damage function f n N based on stiffness degradation is the key to analyzing the fatigue damage of mixtures; the fatigue test on PUM in this study also exhibited a typical three-stage stiffness degradation law [29,30], as shown in Figure 9 and Figure 10. Therefore, the function must be able to clearly describe the three stages of the fatigue failure process; that is, the stiffness in the early stages of fatigue loading exhibits a relatively large decrease and then enters a linear stage of stable development. Subsequently, the stiffness exhibits a relatively large decrease before and until structural failure [30]. Many studies have shown that the functional form of Equation (6) has achieved good results in terms of fitting the fatigue damage of composite materials; therefore, this study used this model to fit the fatigue damage function of PUM [29].
f n N = 1 1 ( n / N ) a ( 1 n / N ) b
where a and b are the parameters to be fitted.
From the analysis of the stiffness degradation results, it is clear that the fatigue damage factors of PUM-10 and PUM-13 are similar at the same load levels, indicating that the maximum engineering particle size has little effect on the damage factors of PUM [30,31]. Therefore, the fatigue damage of the two graded PUM under the same loading level is described by the same function, and the damage factor under the same loading cycle is the average value of PUM-10 and PUM-13.
The fatigue damage of PUM under different load levels in the cyclic loading process is fitted according to Equation (6), and the fitting parameters are shown in Table 6. Further, the residual stiffness ratios at fatigue failure under different loading levels are summarized in Table 7; the fatigue damage function after fitting and the test results are plotted in Figure 14.
The fitting curves are in good agreement with the experimental data, indicating that the fitting formulas can be used to predict the PUM fatigue damage at different loading levels [32]. The ratio of the residual stiffness at fatigue failure at different loading levels shows that the higher the load level, the greater the residual stiffness at fatigue failure [33].

5. Conclusions

(1)
The bending failure processes of PUM and SMA differ under static loading, and the curves of PUM only go through an elastic stage and stress relaxation stage. The static failure mode and fatigue damage of PUM is brittle failure.
(2)
The fatigue life of PUM is much larger than that of SMA under the same bending stress. The fatigue damage of PUM exhibits an obvious three-stage damage law and the fatigue damage leads to brittle failure.
(3)
The deflection development and maximum strain development increment of PUM increase significantly at the beginning of the fatigue cycle. With increases in the fatigue load cycles, the growth rate slows down and enters a relatively stable development stage, and increases greatly near failure.
(4)
The calculation method of the fatigue damage factor based on stiffness degradation is constructed, and the fatigue damage functions of PUM at different load levels are fitted, which can help to predict the stiffness degradation of PUM.
(5)
In this paper, four-point bending tests with three load levels are carried out. It is necessary to carry out four-point bending fatigue tests with more load levels, so as to fit the S-N curve of PUM according to the fatigue life and applied stress amplitude. This can help predict the fatigue life of PUM.

Author Contributions

Conceptualization, M.S. and G.Q.; methodology, S.J.; software, L.G.; validation, D.H. and S.J.; formal analysis, G.Q.; investigation, S.J.; resources, D.H.; data curation, L.G.; writing—original draft preparation, M.S.; writing—review and editing, G.Q.; visualization, L.G.; supervision, M.S.; project administration, M.S.; funding acquisition, M.S. All authors have read and agreed to the published version of the manuscript.

Funding

This work was supported by Key Scientific Research Projects in the Transportation Industry of the Ministry of Transport (2019MS2028), Shandong Expressway Group Project (HSB 2021-72), Open Project of Shandong Key Laboratory of Highway Technology and Safety Assessment (SH202107), Key Program of Natural Science Foundation of Shandong Province (ZR2020KE007), and Shandong Provincial Young Scholars Innovative Research Team Development Program in Colleges and Universities (2019KJG004).

Conflicts of Interest

The authors declare no conflict of interest.

References

  1. Chem, Y.C.; Tseng, S.M.; Hsieh, K.H. Damping properties of interpenetrating polymer networks of polyurethane-modified epoxy and polyurethanes. J. Appl. Polym. Sci. 2015, 74, 328–335. [Google Scholar]
  2. Wang, Q.; Chen, S.; Wang, T.; Zhang, X. Damping, thermal, and mechanical properties of polyurethane based on poly (tetramethylene glycol)/epoxy interpenetrating polymer networks: Effects of composition and isocyanate index. Appl. Phys. A 2011, 104, 375–382. [Google Scholar] [CrossRef]
  3. Wang, J.; Yuan, J.; Xiao, F.; Li, Z.; Wang, J.; Xu, Z. Performance investigation and sustainability evaluation of multiple-polymer asphalt mixtures in airfield pavement. J. Clean. Prod. 2018, 189, 67–77. [Google Scholar]
  4. Chen, J.; Yin, X.; Wang, H.; Ding, Y. Evaluation of durability functional performance of porous polyurethane mixture in porous pavement. J. Clean. Prod. 2018, 188, 12–19. [Google Scholar]
  5. Chen, J.; Ma, X.; Wang, H.; Xie, P.; Huang, W. Experimental study on anti-icing and deicing performance of polyurethane concrete as road surface layer. Constr. Build. Mater. 2018, 161, 598–605. [Google Scholar] [CrossRef]
  6. Chen, J.; Yao, C.; Wang, H.; Huang, W.; Ma, X.; Qian, J. Interface Shear Performance between Porous Polyurethane Mixture and Asphalt Sublayer. Appl. Sci. 2018, 8, 623. [Google Scholar] [CrossRef]
  7. Wang, D.; Schacht, A.; Leng, Z.; Leng, C.; Kollmann, J.; Oeser, M. Effects of Materials Composition on Mechanical and Acoustic Performance of Poroelastic Road Surface (PERS). Constr. Build. Mater. 2017, 135, 352–360. [Google Scholar] [CrossRef]
  8. Wang, D.; Liu, P.; Leng, Z.; Leng, C.; Lu, G.; Buch, M.; Oeser, M. Suitability of Poroelatic Road Surface (PERS) for Urban Roads in Cold Regions: Mechanical Functional Performance Assessment. J. Clean. Prod. 2017, 165, 1340–1350. [Google Scholar] [CrossRef]
  9. Sun, M.; Bi, Y.; Zheng, M.; Wang, J.; Wang, L. Performance of polyurethane mixtures with skeleton-interlocking structure. J. Mater. Civ. Eng. 2020, 32, 04019358. [Google Scholar] [CrossRef]
  10. Lu, G.; Renken, L.; Li, T.; Wang, D.; Li, H.; Oeser, M. Experimental study on the polyurethane-bound pervious mixtures in the application of permeable pavement. Constr. Build. Mater. 2019, 202, 838–850. [Google Scholar] [CrossRef]
  11. Li, T.; Lu, G.; Wang, D.; Hong, B.; Tan, Y.; Oeser, M. Key Properties of High-performance Polyurethane Bounded Pervious Mixture. China J. Highw. Transp. 2019, 32, 158–169. (In Chinese) [Google Scholar]
  12. Lu, G.; Liu, P.; Wang, Y.; Faßbender, S.; Wang, D.; Oeser, M. Development of a sustainable pervious pavement material using recycled ceramic aggregate bio-based polyurethane binder. J. Clean. Prod. 2019, 220, 1052–1060. [Google Scholar] [CrossRef]
  13. Törzs, T.; Lu, G.; Monteiro, A.O.; Wang, D.; Grabe, J.; Oeser, M. Hydraulic properties of polyurethane-bound permeable pavement materials considering unsaturated flow. Constr. Build. Mater. 2019, 212, 422–430. [Google Scholar] [CrossRef]
  14. Lu, G.; Liu, P.; Törzs, T.; Wang, D.; Oeser, M.; Grabe, J. Numerical analysis for the influence of saturation on the base course of permeable pavement with a novel polyurethane binder. Constr. Build. Mater. 2020, 240, 1–9. [Google Scholar] [CrossRef]
  15. Xu, S.; Zhang, Y.; Guo, Y.; Ma, C.; Gao, D.; Peng, G. Determination of polyurethane concrete compaction timing based on penetration resistance test system. China J. Highw. Transp. 2021, 34, 226–235. (In Chinese) [Google Scholar]
  16. Sun, M.; Bi, Y.; Zhuang, W.; Chen, S.; Zhao, P.; Pang, D.; Zhang, W. Mechanism of polyurethane binder curing reaction and evaluation of polyurethane mixture properties. Coatings 2021, 11, 1454. [Google Scholar] [CrossRef]
  17. Cong, L.; Wang, T.; Tan, L.; Yuan, J.; Shi, J. Laboratory evaluation on performance of porous polyurethane mixtures and OGFC. Constr. Build. Mater. 2018, 169, 436–442. [Google Scholar] [CrossRef]
  18. Izaks, R.; Rathore, M.; Haritonovs, V.; Zaumanis, M. Performance properties of high modulus asphalt concrete containing high reclaimed asphalt content and polymer modified binder. Int. J. Pavement Eng. 2022, 23, 2255–2264. [Google Scholar] [CrossRef]
  19. Yoshida, N. Fatigue failure criterion for hydraulic graded iron and steel slag base-course and ITS implementation into the Japanese asphalt pavement design method. Struct. Eng. 2014, 2, 62–68. [Google Scholar] [CrossRef]
  20. Lv, S.; Luo, Z.; Xie, J. Fatigue performance of aging asphalt mixtures. Polimery 2015, 60, 126–131. [Google Scholar] [CrossRef]
  21. Lv, S.; Liu, C.; Yao, H.; Zheng, J. Comparisons of synchronous measurement methods on various moduli of asphalt mixtures. Constr. Build. Mater. 2018, 158, 1035–1045. [Google Scholar] [CrossRef]
  22. Maalej, M.; Quek, S.T.; Zhang, J. Behavior of Hybrid-Fiber Engineered Cementitious Composites Subjected to Dynamic Tensile Loading and Project Impact. J. Mater. Civ. Eng. ASCE 2005, 17, 143–152. [Google Scholar] [CrossRef]
  23. Zhang, J.; Gong, C.; Guo, Z.; Zhang, M. Engineered Cementitious Composites with Characteristic of Low Drying Shrinkage. Cem. Concr. Res. 2009, 39, 303–312. [Google Scholar] [CrossRef]
  24. Guo, Z.; Wang, L.; Feng, L.; Guo, Y. Research on fatigue performance of composite crumb rubber modified asphalt mixture under freeze thaw cycles. Constr. Build. Mater. 2022, 323, 126603. [Google Scholar]
  25. Shen, A.; Yu, M.; Zhou, X.; Lv, Z.; Song, P. Fatigue Damage and Full-cycle life estimation of rubber asphalt mixture. J. Build. Mater. Struct. 2018, 21, 620–625. [Google Scholar] [CrossRef]
  26. Huang, W.; Peng, L.; Mao, Z.; Sun, Z. Analysis of foacors influencing fatigue self-healing performance of SBS modified asphalt mixture. J. Build. Mater. 2016, 19, 950–956. [Google Scholar] [CrossRef]
  27. Menozzi, A.; Garcia, A.; Partl, M.N.; Tebaldi, G.; Schuetz, P. Induction healing of fatigue damage in asphalt test samples. Constr. Build. Mater. 2015, 74, 162–168. [Google Scholar] [CrossRef]
  28. Zhu, H.; Yang, W. A survey on stiffness reduction models of fiber reinforced plastics under cyclic loading. Adv. Mech. 2002, 32, 69–80. (In Chinese) [Google Scholar]
  29. Feng, P.; Du, S.; Wang, D. Fatigue residual stiffness degradation model for composite laminates. Acta Mech. Solida Sin. 2003, 24, 446–452. (In Chinese) [Google Scholar]
  30. Zhu, H.; Yu, Z.; Sun, J. Experimental research on fatigue behavior of reinforced concrete T-beam. J. Highw. Transp. Res. Dev. 2013, 30, 53–58. (In Chinese) [Google Scholar]
  31. Zhu, H.; Yao, Z.; Xiu, L.; Yu, Z. Reinforced Concrete Beam’s stiffness degeneration regulation and its calculation formula under the action of fatigue load. J. Civ. Archit. Environ. Eng. 2014, 36, 1–5. [Google Scholar]
  32. Cheng, L. Flexural fatigue analysis of a CFRP form reinforced concrete bridge deck. Compos. Struct. 2011, 93, 2895–2902. (In Chinese) [Google Scholar] [CrossRef]
  33. Nie, J.; Wang, Y.; Cai, C. Experimental research on fatigue behavior of RC beams strengthened with steel plate-concrete composite technique. J. Struct. Eng. 2011, 137, 772–781. (In Chinese) [Google Scholar] [CrossRef]
Figure 1. Test specimens.
Sustainability 14 10966 g001
Figure 2. Four-point bending loading layout.
Sustainability 14 10966 g002
Figure 3. Fatigue loading and DSCM acquisition site.
Sustainability 14 10966 g003
Figure 4. Fatigue test loading procedure. In the figure: The blue line indicates the static load applied, and the red line indicates the sinusoidal fluctuating load applied.
Sustainability 14 10966 g004
Figure 5. Loading and cross-section schematics. (a) Loading diagram. (b) Loaded beam section.
Sustainability 14 10966 g005
Figure 6. Midspan deflection and bending stress curves.
Sustainability 14 10966 g006
Figure 7. Fatigue life of the three mixtures.
Sustainability 14 10966 g007
Figure 8. Fatigue limit stress of the three mixtures.
Sustainability 14 10966 g008
Figure 9. Stiffness curve under different numbers of loading cycles. (a) Stiffness curve of PUM-13. (b) Stiffness curve of PUM-10.
Sustainability 14 10966 g009
Figure 10. Stiffness curve at different loading cycle ratios. (a) Stiffness curve of PUM-13. (b) Stiffness curve of PUM-10.
Sustainability 14 10966 g010
Figure 11. Deflection curve at different loading cycle ratios. (a) Deflection curve of PUM-13. (b) Deflection curve of PUM-10.
Sustainability 14 10966 g011
Figure 12. Maximum tensile strain curve with loading cycle ratios. (a) Maximum tensile strain curve of PUM-13. (b) Maximum tensile strain curve of PUM-10.
Sustainability 14 10966 g012
Figure 13. Fatigue damage factor curves under different loading cycle ratios. (a) Loading level of 0.5. (b) Loading level of 0.6. (c) Loading level of 0.7.
Sustainability 14 10966 g013
Figure 14. Fatigue damage factor curves at different loading cycle rates. (a) Loading level of 0.5. (b) Loading level of 0.6. (c) Loading level of 0.7.
Sustainability 14 10966 g014
Table 1. The indexes of SBS-modified asphalt.
Technical IndicatorsTest Method UnitTypical Value
PenetrationT 06040.1 mm53
Penetration IndexT 0604/−0.5
5 °C DuctilityT 0605cm48
Softening PointT 0606°C86.5
Dynamic Viscosity of 135 °CT 0625Pa.s2.16
Table 2. The indexes of PU binder.
Technical IndicatorsTest Method UnitTechnical RequirementTypical Value
AppearanceGB/T 13658/Brownish yellow liquid/
Viscosity/25 °CGB/T 12009.3mPa.s1200–22001600
Density/25 °CGB/T 4472g/cm31.05~1.111.08
Acidity valueGB/T 12009.5/≤0.030.01
Surface dry time/25 °C, 50% HumidityGB/T 13477.5h5–106
Tensile strength/25 °CGB/T 16777MPa≥1026
Elongation at break/25 °CGB/T 16777%≥100200
Table 3. Material composition design results.
Sieve Size (mm)Cumulative Passing Percentage of Each Sieve (mm)/%Binder
Content/%
16.013.29.54.752.361.180.60.30.150.075
SMA-10100.0100.098.743.925.221.818.616.314.012.17.0
PUM-10100.0100.098.743.925.221.818.616.314.012.16.5
PUM-13100.095.666.831.221.516.711.58.66.32.56.3
Table 4. The basic performance indexes of various mixtures.
Technical
Indicators
UnitSMA-10PUM-10PUM-13
Void ratio (VV)%5.34.54.8
Voids in the Mineral Aggregate (VMA)%17.414.514.8
Marshall Stability (MS)KN56.854.755.4
Dynamic
stability/60 °C
Times/mm−191468254086327
Low temperature bending
strain/−10 °C
µε312057345628
Splitting strengthMPa1.383.053.21
Table 5. Specific load parameters.
Test Beam Number Fatigue Loading DataStatic Load Maximum Force/KNLoading
Frequency/
Hz
Loading LevelFatigue Lower Limit P min / kN Fatigue Ceiling
P max / kN
SMA-100.30.06 0.60210
0.40.080.80210
0.50.101.00210
PUM-100.50.414.058.110
0.60.494.868.110
0.70.575.678.110
PUM-130.50.454.458.910
0.60.535.348.910
0.70.626.238.910
Table 6. Static load test results of three mixtures.
Type of MixtureStatic Load
Failure Time/s
Maximum
Deflection/mm
Bending Failure
Stress/MPa
SMA-1044.320.02.9
PUM-102.361.7013.2
PUM-131.81.3612.1
Table 7. Degradation function and parameters fitted of PUM stiffness.
Loading LevelabFatigue Damage FunctionCorrelation Coefficient E I N r / E I 0  
0.50.190.79 f n N = 1 1 ( n / N ) 0.19 ( 1 n / N ) 0.79 0.99670.198
0.60.310.67 f n N = 1 1 ( n / N ) 0.31 ( 1 n / N ) 0.67 0.98320.287
0.70.590.76 f n N = 1 1 ( n / N ) 0.59 ( 1 n / N ) 0.76 0.98780.403
Publisher’s Note: MDPI stays neutral with regard to jurisdictional claims in published maps and institutional affiliations.

