2. Literature Review
Resilience in the field of ecology is defined as the ability of a system to maintain the functioning of its core functions and its stability in the face of external shocks [
1]. Turner constructed a relatively robust evaluation system in order to further study the resilient system of the ecosystem subject to vulnerability [
2]. In 2007, Liu, Jianguo, and Dietz, Thomas conducted a coupled study of the complexity of human and natural systems and found important effects of resilience [
3]. Oliver and Heard analyzed three important functions of resilient ecosystems: diversity, heterogeneity, and hierarchy [
4].
Since then, academic research on the application of resilience began to expand into sociology and urban planning, and one of the hallmarks is the spatial character that resilience has been given. Schluter applied the concept of resilience to more complex human social systems and analyzes the resilience of social-ecological systems in the context of dynamics [
5]. Barthelemy related spatial networks to resilience and discussed the resilience of network topologies under spatial constraints [
6].
The proliferation of empirical studies on “regional resilience” and “urban resilience” has led to the development of a new theory of urban network structure [
7,
8] and regional resilience [
9,
10]. Peng and Yuan reviewed the derived concepts of resilience and the application of resilience in disaster prevention and control, and regional urban planning in recent years [
11]. Forbes added key cultural factors to the social-ecological system to study regional resilience [
12]. Ahern examined the rationale for introducing resilience into urban planning and design and concluded with a theoretical system for building and strengthening urban resilience [
13].
Meerow and Newell extended the concept of regional resilience to urban resilience and summarize six basic concepts of urban resilience [
14]. Leichenko analyzed the important impact of a comprehensive and rational resilience strategy on climate change from the perspective of urban resilience [
15]. Crucitti added hierarchical clustering analysis of complex networks to the study of urban resilience, further expanding the scope of urban resilience theory research [
16]. Boschma argued that regional resilience should be viewed as dynamic development and further enriches the theory of resilient development at the institutional and industrial levels [
17].
The theory of resilient development has given rise to research on the correlation between urban network structure and regional resilience and the exploration of the measurement of urban network structure [
18]. Suire examined its core-periphery and decentralized structure in a knowledge network to measure urban resilience in a given economic context [
19]. Recently, some scholars enriched and explored the connection between “resilience” and “regional resilience” and proposed that “urban network resilience” characterizes the spatial structure of cities [
20].
Alizadeh and Ngah combined a neural network approach to examine the topology and spatial structure of urban networks in their study of sustainable urban development [
21]. Cariolet and Colombert focused on the impact of air pollution on urban resilience in relation to the transport sector and verify the importance of “fast scanning” for urban resilience in Paris [
22]. Many scholars have assessed urban network resilience [
23].
Rus and Kilar assessed the impact of earthquakes on urban resilience from the perspective of complex networks, clarifying the importance of considering open spaces, in the recovery process of cities suffering from earthquakes [
24]. Pan and Dang constructed an urban network for the transportation industry, focusing on the resilience of the transportation process, and applying a grid-capacity-based metric to propose two major strategies for improving the ranking and resource allocation of resilience [
25].
The first step to assessing the resilience of urban networks is to construct an urban network system. Currently, new forms of urban spatial connections and social organization, represented by “flow spaces,” have emerged [
26]. Castells and Manuel elaborated on the primary connotation of “flow space” from the perspective of geography [
27]. Christopherson et al. combined the resilience between urban networks and regions and argue that different urban network structures affect urban network resilience [
28]. Palekiene et al. built on this by identifying the direct impact of urban network structure and function on urban network resilience [
29]. Therefore, the urban network structure of the flow space consisting of multiple urban networks is one of the important ways to assess the resilience of urban networks.
Although the resilience of city cluster networks has been studied with enthusiasm, most scholars have focused on a single type of network, while less research has been conducted on multiple city networks. What is the correlation between different types of urban networks? What are the patterns of the spatial and temporal evolution of multiple network resilience in urban clusters over the study period? All of them need to be further explored. Therefore, this paper selects 48 cities in the Yellow River Basin as research objects and constructs a multi-city network-resilience evolution model based on resilience. Theory and social network theory are used to compare and analyze the evolution level of resilience of urban networks in the Yellow River Basin in 2014 and 2021.
3. Study Area, Data, and Methods
3.1. Study Area
Long before the Outline was officially approved by the State Council in 2021, the concept of the Yellow River Basin Urban Agglomeration began to emerge in academic circles [
30,
31]. The Plan and the Outline were released one after the other. The introduction of the Plan and the Outline has stimulated the academic community to study the urban agglomerations in the Yellow River Basin [
32,
33,
34]. In this paper, the study of the Yellow River Basin Urban Agglomeration is based on the geographical location of the study area, the urgency of coping with external shocks, and the development achievements of the Yellow River Basin Urban Agglomeration in recent years.
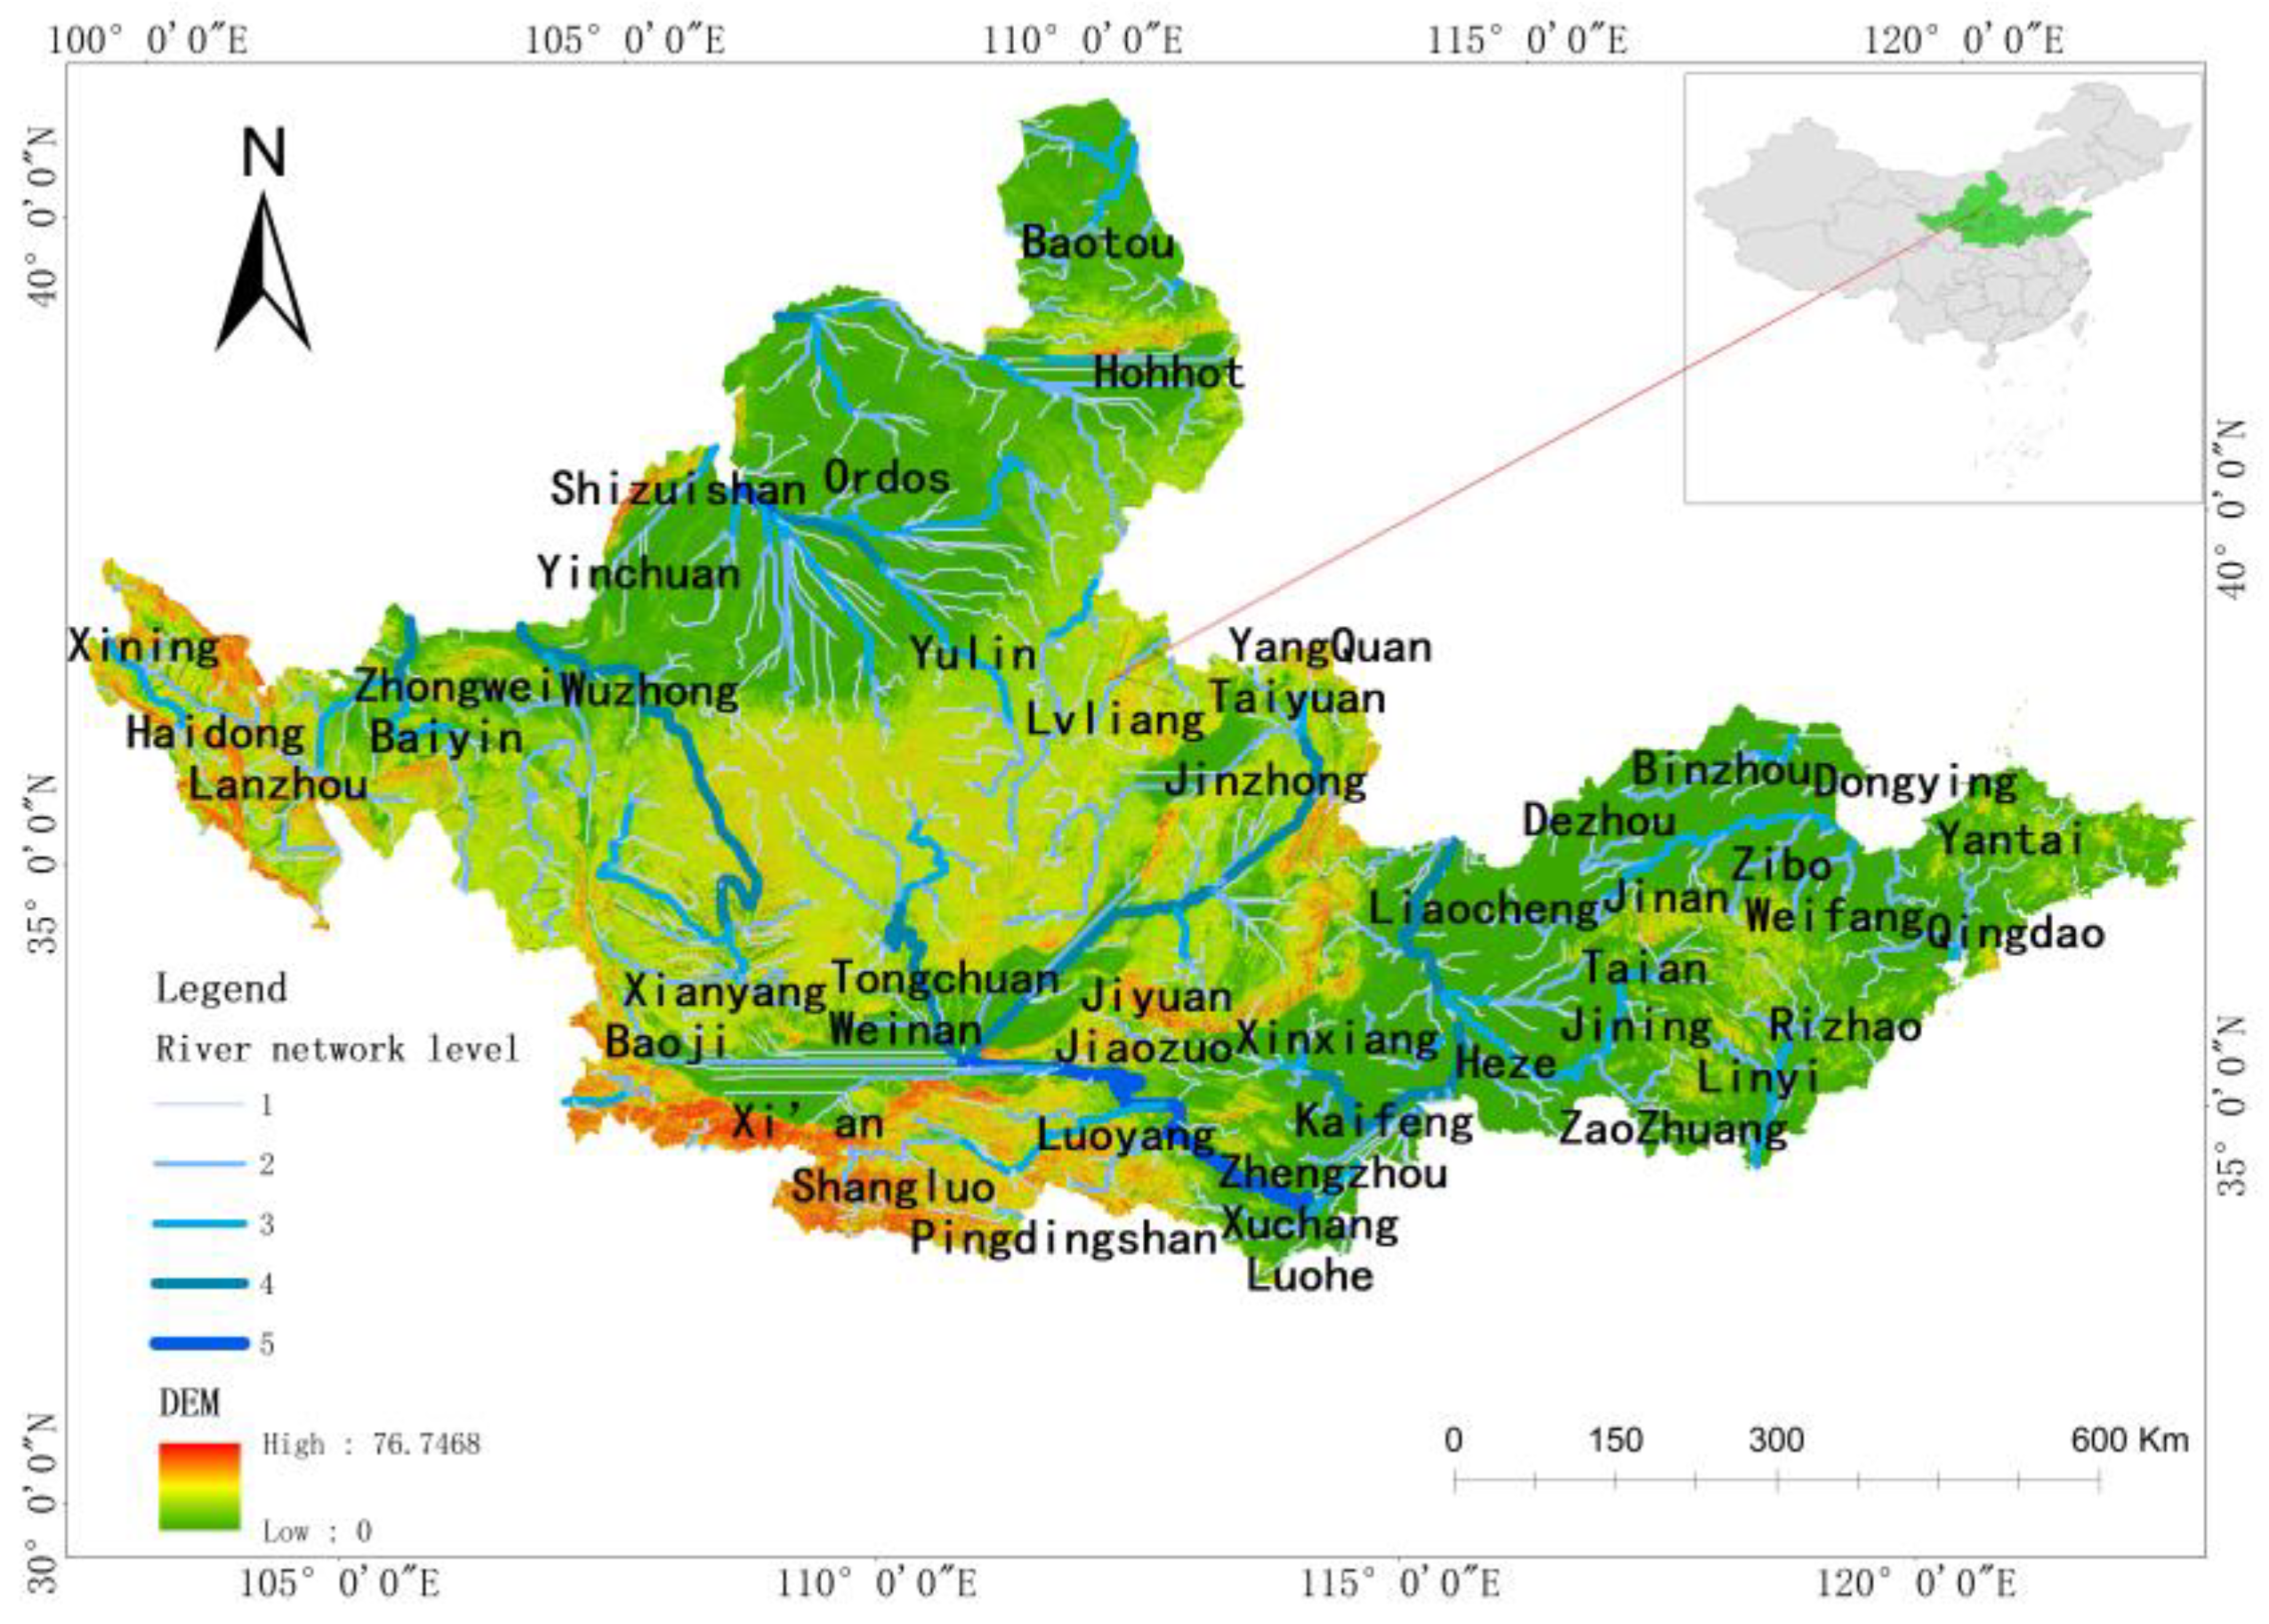
From the geographical location of the study area, the Yellow River Basin Urban Agglomeration is located in northern China, passing through the provinces of Shandong, Henan, Shaanxi, Shanxi, Inner Mongolia, Qinghai, and Gansu along the Yellow River. The total area of the hilly zone is 632,081 square kilometers, accounting for 6.58% of the total area of China, with a total of 48 prefecture-level cities (
Figure 1). From
Figure 1, it can be seen that the hilly areas are distributed in the southwestern and western regions of the urban agglomeration of the Yellow River Basin. The 48 cities in the Yellow River Basin Urban Agglomeration are geographically adjacent to each other, and there are close economic, transportation, financial, and ecological links between the cities within the agglomeration.
In terms of coping with external shocks, the gross domestic product of the Yellow River Basin urban agglomeration still reaches 26,795.04 thousand billion yuan in 2020, accounting for 26.44% of China’s gross domestic product, despite the public health emergency of the New Crown epidemic. The Yellow River Basin urban agglomeration will have a total population of 226,032,900 people by the end of 2020, accounting for 16.01% of the country’s total population.
In the post-epidemic era and the unstable global trade situation, promoting technological innovation and the development of the real economy, especially in manufacturing and new energy, is an important challenge for the Yellow River Basin urban agglomerations. The urban agglomerations consisting of 48 cities are the central part of the five growth poles of high-quality development in the Yellow River Basin. Their development results can be examined in four aspects.
(i) The synergistic development of the urban agglomerations in the Yellow River Basin has opened a high-speed development mode, and the economic growth rate of the urban agglomerations in the Yellow River Basin hit 8.61% in 2014. the Fifth Plenary Session of the 19th CPC Central Committee in 2020 emphasized the importance of shifting China’s economy from the high-speed development stage to the high-quality development stage, and the impact of the epidemic, the economic growth rate of the urban agglomerations in the Yellow River Basin dropped to 3.5%.
(ii) The rate of energy consumption slowed down. The average electricity consumption of the Yellow River Basin urban agglomeration rose from 22.835 billion kWh in 2014 to 34.428 billion kWh in 2020, and the growth rate of energy consumption decreased from 6.7% in 2014 to 4.7% in 2020, slowing down the growth rate.
(iii) The ecological environment is improving. The average total afforestation area of the Yellow River Basin urban agglomeration rose from 6598.82 hectares in 2014 to 12,264.50 hectares in 2020. The average afforestation area of the Yellow River Basin urban agglomeration has doubled in seven years.
(iv) Resident life tends to be healthier. Shandong Province, Shaanxi Province, and Shanxi Province are ranked in the top ten in the China Resident Health Consumption Index (2021) released by the Population Culture Development Center of the National Health and Welfare Commission.
In this context, the Yellow River Basin urban agglomeration is selected as the study area of this paper to provide a theoretical basis for improving the ability of the Yellow River Basin urban agglomeration to cope with external shocks and to provide a reference for other urban agglomerations to improve their urban agglomeration resilience.
3.2. Data Source and Processing
The multi-city network can be constructed by considering four aspects: ecological, economic, social, and engineering [
35]. However, the urban agglomerations in the Yellow River Basin are geographically close to each other, and the influence of the ecological domain each other, and therefore the network is not constructed for the ecological domains. The regional innovation capacity formed by companies with more patents granted promotes the urban resilience of urban clusters [
36]. Therefore, this paper constructs a transportation network, financial linkage network, information exchange network, and innovation cooperation network to characterize the four fields of engineering, economic, social, and innovation of urban agglomerations, respectively. The specific methodology is as follows.
Transportation network. Railroad transportation has achieved ample area coverage in the Yellow River Basin urban agglomeration region, and the transportation network based on time distance shows spatial and temporal compression and convergence effects [
37]. In addition, there are regional differences within the Yellow River Basin urban agglomeration that are suitable for medium- and long-distance transportation and travel [
38]. Therefore, the transportation network can be constructed by using the minimum time distance matrix of railroads.
First, a point-to-point time query was conducted for 48 city nodes in the Yellow River Basin urban agglomeration. The query time was from 1 June 2021 to 30 June 2021, and the shortest time between the 48 cities was filtered without considering the influence of trains and excluding the transfer data, and the railroad shortest time distance matrix was constructed. Then, query the National Railway Passenger Train Schedule from 1 June 2014 to 30 June 2014 was used to construct the railroad time–distance matrix for 2014.
Financial linkage network. First, the top 10 lists three types of financial. Enterprises with solid representation and significant market shares published on the official websites of the China Insurance Association, China Securities Association, and China Banking Association in 2014 and 2021, respectively, were selected, among which the top 10 life insurance enterprises in the insurance industry were selected.
Then, the geographical location, approval time, and institutional rank of each financial institution were collected with the help of the official website of the China Banking Regulatory Commission. Finally, the data of the institutions are assigned a value of 5 for the city where the corporate headquarters is located, 3 for the city where the regional headquarters is located, 1 for the city where the branch offices are located, and 0 for the city where no personnel of any business facilities is located, to measure the financial linkage of the Yellow River Basin city cluster.
Information exchange network. The Baidu index measures network search behavior on a scale based on the search volume of keywords, which can characterize the flow of information [
39]. The Baidu Index can be used to measure the flow of information. Thus, through the Baidu index web interface (
http://index.baidu.com/v2/index.html#/ (accessed on 23 April 2022)), we select the option of “search index profile by region,” and select 48 cities in the Yellow River Basin Urban Group for keywords and obtain the information flow from 1 January 2014 to 31 December 2014, and 1 January 2021 to 31 December 2021. The daily average search indexes were obtained from 1 January 2014 to 31 December 2014, and from 1 January 2021 to 31 December 2021, to obtain the attention of web users in specific regions of the Yellow River Basin urban agglomeration and to measure the information related network by the amount of inter-city information search.
Innovation cooperation network. There are many enterprises, universities, and research units in the Yellow River Basin city cluster, and there are complex innovation cooperation relationships among them [
40]. The Classification of Strategic Emerging Industries (2018) (from now on referred to as “Classification”) adds many technology-based industries on the original basis, which describes the innovation capability more precisely [
41,
42].
Therefore, the data of the innovation cooperation network uses the Smart Bud patent database, constructs a search formula based on the corresponding IPC classification number in the Classification, and searches the strategic emerging industries in the Yellow River Basin urban agglomeration on 1 January 2014 to 31 December 2014, and 1 January 2021 to 31 December 2021 and then cleans and sorts them to measure the innovation cooperation network of the Yellow River Basin city cluster.
3.3. Research Methodology and Model Design
3.3.1. Network Correlation Test Method
Maximum Inter-Class Difference Method
Determining the original data matrix threshold to form a binarization matrix is a prerequisite for multiple city network correlation testing; thus, the determination of the relevant threshold value is critical. The academic approaches to the selection of thresholds focus on the Granger causality index, of the entire sample [
43,
44], or multiple experiments to determine the optimal threshold value [
45], and so on. However, all three methods of determining the threshold have certain shortcomings, and the threshold determination is more subjective, which can lead to less objectivity.
Associations between nodes. The maximum interclass difference method is to link the pixel matrix with the data matrix to construct a linkage network. The maximum interclass difference method can avoid subjectivity to the greatest extent possible. Specifically, the global adaptive maximum interclass difference method is less capable of handling the presence of noise (i.e., extreme values); therefore, the maximum interclass difference method is used after the initial sorting of the study data to remove the extreme values.
The specific steps are, first, to determine the number of original matrices M × N, secondly, to determine the matrix threshold as t0, and to binarize the whole matrix according to the threshold. The numbers of background and target are𝑁
0 and 𝑁
1, and the proportion of the number of matrices are 𝜔
0 and 𝜔
1. The average grayscale is 𝜇
0, and 𝜇
1. The average grayscale of the total matrix is 𝜇, the threshold t0, t1, where the maximum interclass difference can be expressed by determining the g maximum interclass difference as follows.
Quadratic Assignment Procedure (QAP)
QAP is one of the standard methods of social network analysis that tests the correlation and regressivity of the elements of different matrices based on data permutation. QAP is superior to the general statistical method in that it uses a random test to study values in the matrix that are not independent of each other. QAP analysis focuses on both correlation and regression. The correlation uses a random test to replace the matrix to obtain the relevant parameters and then conducts a nonparametric correlation test; the regression focuses on the regression relationship between a pair of multiple matrices and conducts a significance test, which does not require the independence of the variables and, therefore, can reduce the error caused by multicollinearity accordingly.
3.3.2. Network Toughness Evolutionary Evaluation Model
Network Performance Measurement Index
There are various approaches and numerous metrics for measuring network resilience. Academics use certain key attributes of social networks to portray network resilience (For example, node degree [
46], network connectivity [
47], characteristic path length [
48], network aggregation [
49], and network heterogeneity and diversity [
50]). Crespo et al. argued that network hierarchy and matching can be measured in terms of node-degree distribution and degree association, respectively, while the cluster execution capability is measured with the help of these two important metrics, and three typical network topologies were measured [
51]. Some scholars also focus on network density, centrality, and cohesive subgroups to explore the network resilience of the Yangtze River Delta urban cluster [
52]. Therefore, this paper selects the hierarchical, matching, transmission, and agglomeration indicators that characterize and respond to urban network resilience to construct the network resilience evolution model.
Network hierarchically. To examine the hierarchical nature of the network, first, the node degree distribution should be determined, and secondly, the hierarchical level should be determined according to the slope side of the node degree distribution. Based on the rank order–scale rule, the node degrees of network cities are arranged in the order from largest to most minor and fitted to draw the power-law curve; then, the degree distribution formula of the Yellow River Basin urban cluster network is shown as follows.
where 𝐶 is a constant and 𝑘
∗ is the node 𝑖, the ranking of the nodes, and 𝑎 is the slope of the curve and is a negative number. Taking logarithms of both sides of Equation (2) simultaneously yields Equation (3), which means that the logarithm of the network node degree is linearly correlated with the logarithm of the city order.
Network match ability. Network match ability is a social network property that is divided into homogeneity (nodes with high and low node degrees tend to connect nodes with high and low node degrees) and heterogeneity (nodes with low and high node degrees tend to connect nodes with high and low node degrees) to study the correlation between nodes. The formula for calculating match ability for unweighted networks is as follows.
where
denotes the average of the degrees of all nodes directly connected to node 𝑖 the average of the degrees of all nodes directly connected to the node, and
represents 𝑖 adjacent nodes 𝑗 of the node, and 𝑉 then denotes 𝑖 the set of all neighboring nodes. Then it is possible to derive
and
of the linear correlation, expressed by the following equation.
where 𝐷 is a constant term and 𝑏 is the correlation coefficient when 𝑏 > 0 represents homogeneity; while 𝑏 < 0 represents heteroscedasticity.
Network Transportability. Network transmissibility assesses urban network resilience through the average path length index, and many scholars have given accurate proof and theoretical basis [
48,
53]. The greater the proximity centrality, the more central the node is in the network and the less it is controlled by other nodes. Therefore, this paper adopts the proximity centrality correlation to study the network transportability of the Yellow River Basin urban cluster, which can be expressed by Equations (6) and (7).
where 𝐸 is a constant term. 𝑐 is the proximity correlation coefficient. When 𝑐 > 0, this indicates that nodes with high proximity centrality tend to connect nodes with high proximity centrality, and 𝑐 < 0 indicates that nodes with high proximity centrality tend to connect nodes with low proximity centrality.
denotes the average of the degrees of all nodes directly connected to node 𝑖 the average of the degrees of all nodes directly connected to the node,
denotes the average of the degrees of all nodes directly connected to the node, and 𝑖 adjacent nodes 𝑗, and 𝑉 then represent the 𝑖 set of all neighboring nodes.
Network aggregation. Network aggregation is measured by the local clustering coefficient and average clustering coefficient of urban network toughness, and the degree of aggregation of the whole network is measured by the average local clustering coefficients of all nodes. Their formulas are, respectively,
where
denotes the 𝑖 the degree of
, which denotes the 𝑖 actual number of edges generated, and 𝐶 denotes the average clustering coefficient.
Network Toughness Evolution Evaluation Method
Crespo [
51] and Boschma [
17] et al., on network toughness, combined three metrics of network hierarchy, matching, and transmission. Resilient networks can be described as high hierarchical (|𝑎| > 0), high associative heterogeneity (𝑏 < 0) or low associative homogeneity (𝑏 > 0) and high proximity associative heterogeneity (𝑐 < 0) or low proximity associative homogeneity (𝑐 > 0).
The aggregation of the network portrays the probability that the neighbors of the nodes in the network are connected, which is similar to the meaning expressed by the degree association; therefore, the aggregation of the network is not used as the coordinate axis of the evolutionary coordinate system of toughness. According to the network hierarchy, matching, and transmission, the evolution coordinate system of network toughness is constructed as shown in
Figure 2.
Let Q be the point (Δ|𝑎|, Δ𝑏, Δ𝑐) and the straight lineΔ|𝑎| + Δ𝑏 + Δ𝑐 = 0 the perpendicular distance; P is the perpendicular distance from the point to the line −Δ|𝑎| + Δ𝑏 + Δ𝑐 = 0 the perpendicular distance; L is the distance from the point to the origin of the coordinates, and the more significant L indicates the more significant change in network toughness. The larger , the higher the development quality of network toughness is represented, and R is used to represent the network toughness, then where the positive and negative signs represent whether the network toughness is improved or reduced.
4. Multiple Network Toughness Characteristics Analysis
First, the transportation network, financial linkage network, information exchange network, and innovation cooperation network obtained in the previous section are binarized using the maximum inter-class difference method to select the optimal threshold for the eight networks between the years 2014 and 2021; then, the multiple urban networks are graded using the natural breakpoint method using ArcGIS10.7 to express the visualization of the spatial network structure of the urban agglomeration in the Yellow River basin. as shown in
Figure 3.
Secondly, QAP correlation analysis of the multiple city networks (
Table 1) revealed that the correlation coefficients among transportation network, financial linkage network, information exchange network, and innovation cooperation network were all around 0.5 (
p < 0.01), indicating a strong correlation among the multiple networks of the Yellow River Basin urban agglomeration.
The results show that the lowest correlation coefficient among multiple networks is between the information exchange network and innovation cooperation network in 2021 (0.212), and the highest is between the innovation cooperation network and financial linkage network in 2014 (0.545). This indicates that, both in 2014 and 2021, the multiple city networks of the Yellow River Basin urban agglomeration have some similarities, and at the same time, the differences are apparent. Therefore, it is necessary to analyze the four indicators of network resilience for the measurement study.
4.1. Hierarchy
As shown in
Figure 4, the slopes of the fitted degree distribution of the multi-city network in 2014 and 2021 are significantly different, and the slope of the fitted degree distribution of the multi-city network in 2021, except for the transportation network, decreases compared with that in 2014, which means that the hierarchical structures of the multi-city network in the Yellow River Basin urban agglomeration are significantly different, i.e., the multi-city network has evolved differently. The hierarchical order of the four networks in 2014 is innovation > information > finance > transportation.
The slope of the innovation cooperation network is 1.5626, which indicates that the hierarchy of the innovation cooperation network is the highest, and the core cities (cities with greater degrees) are relatively prominent; the hierarchy of the transportation network is the lowest at 0.7363, and the role of the core cities is weakened; in 2021, the hierarchy of the multi-city network of the Yellow River Basin Urban Agglomeration changes significantly: Innovation> transportation > information > finance.
The absolute value of the slope of the transportation network changes more from 0.7363 in 2014 to 1.2712 in 2021, which indicates that the core city’s position in the transportation network is strengthened; the hierarchical nature of both the information exchange network and the financial linkage network decreases by one place in 2021, and the absolute value of the slope of the financial linkage network decreases from 1.1853 in 2014 to 0.8631 in 2021.
At the same time, the data show that the innovation cooperation network has been the first in terms of hierarchy in both 2021 and 2014, which indicates that the core cities in the innovation cooperation network have been playing an irreplaceable role. Overall, the hierarchical ranking of transportation network, financial linkage network, information exchange network, and innovation cooperation network were all between 0.7 and 1.5 in 2014, while the hierarchical ranking was generally between 0.8 and 1.3 in 2021, and the hierarchical ranking has a decreasing trend; however, the change is not apparent.
The city network degree distribution in 2014 and 2021 is visualized using ArcGIS 10.7, as shown in
Figure 5. In the transportation network, the degree values of Rizhao, Lanzhou, Weinan, Weihai, and Yantai cities increase more significantly, while the degree values of the rest of the cities increase steadily. In the financial linkage network, the degree values of Yantai, Hohhot, and Lanzhou increase significantly, while the degree values of the rest of the cities remain unchanged or increase steadily; the degree values of the information exchange network show an increase.
The degree values of the information exchange network show an increase, while the degree values of Hohhot, Taiyuan, Baiyin, and Dongying show different degrees of decrease; the degree values of Dongying, Yantai, Jinan, Liaocheng, and Weifang of innovation cooperation network increase most notably. Among them, Jinan, Qingdao, and Xi’an are always at the core of the multi-city network, while the core positions of Lanzhou, Taiyuan, Zhengzhou, Hohhot, Weifang, and Luoyang vary more among different networks. Specifically, Lanzhou-Zhongwei-Yinchuan, Taiyuan-Yangquan, Baoji-Xi’an-Wuinan, Zhengzhou-Luoyang-Luohe, and Jinan-Qingdao-Dezhou-Zibo are at the core of the transportation network, and the degree values of Weihai, Rizhao, Yantai, Weinan, Ordos, Wuzhong, and Xining increase more in 2021.
Zhengzhou-Taiyuan-Xi’an-Lanzhou and the core position of the provincial capital cities will remain unshaken in 2021, while the degree values of Hohhot and Xining rise to become the second gradient of degree values, and the overall degree values of Yellow River cities remain unchanged or rise slightly. The degree values of cities in the innovation cooperation network fluctuate, and the degree values of Yantai, Dongying, Liaocheng, and Weifang increase more, and the core cities developed, from Jinan- Qingdao-Xi’an to Jinan, Qingdao, Yantai, Dongying, and Xi’an.
4.2. Matching
The degree correlation coefficients of the multi-city network are calculated according to Equations (4) and (5), as shown in
Figure 6. The characteristics of homogeneity and heterogeneity of the network structure vary with time and network type. The characteristics of homogeneity show information > transportation > innovation in 2014, while it shows transportation > innovation in 2021, and heterogeneity shows finance > information in 2021.
The positive b-value of the transportation network is 5.4719 in 2021 compared with 2.5628 in 2014, which shows a small increase in the homogeneity of the network, which is not conducive to the evolutionary development of network resilience; however, its homogeneity value is not large, showing a certain homogeneous hugging phenomenon but not significant. The B-values of negative financial linkage network and information exchange network in 2021 are degree negative association, and the absolute value of b in 2021 The absolute value of b decreases to −37.0253 and −1.965, respectively, and the heterogeneity of the financial linkage network is weakened to a greater extent, which is not conducive to improving network resilience.
The information exchange network changes from a homogeneous network of 5.7427 in 2014 to a heterogeneous network of −1.965 in 2021, which is beneficial to improving network resilience; the innovation cooperation network shows a positive degree association during the study period, and The absolute value of b of the innovation cooperation network showed an increasing phenomenon, and the homogeneity of the network increased, which is not beneficial to improve the network resilience.
4.3. Transportability
The average path lengths and average clustering coefficients of the multi-city network in 2021 and 2014 are shown in
Table 2. Overall, the average path length in 2021 is smaller than that in 2014 except for the information exchange network, which indicates that the regional accessibility and diffusion between cities strengthened during the study period. The average path lengths of the four types of networks ranged from 1 to 2 during the study period, which indicates the high efficiency of path transmission in the Yellow River Basin urban agglomeration. Specifically, the average shortest path in 2014 is Innovation> transportation > information > finance; among them, the average path length of the innovation cooperation network is 2.57.
This is the longest network path among the three, indicating that the interaction, connection, and communication between various nodes of cities are not as good as financial connection network and information exchange network; the average shortest path in 2021 is information > innovation > transportation > finance; the average path length of the financial linkage network is always the shortest during the study period, and the improvement of network transmission efficiency is conducive to resource diffusion, people mobility, technology development, and information transfer. The average shortest path of the information exchange network becomes the largest among the four types of networks, and its diffusion cost is relatively high.
The proximity correlation coefficients of the multiple city networks are drawn according to Equations (6) and (7), as shown in
Figure 7. Overall, all four city networks in the study period are proximity centrality correlation heterogeneity networks, and their absolute value magnitudes are ranked as Transportation > Finance > Information > Innovation in 2014, while they show Innovation> Finance > Information >Transportation in 2021.
Specifically, the proximity correlation coefficients of the transportation network and the financial linkage network decrease during the study period, which is not conducive to the development of network resilience, with the proximity correlation coefficients of the transportation network decreasing the most. The number of proximity ties between the information exchange network and the innovation cooperation network increased during the study period, and the most significant increase was in the innovation cooperation network, which indicates that the innovation cooperation network has the potential to develop into a resilient network development.
The intermediary centrality of each node during the study period is calculated and ranked in order of magnitude. The intermediary centrality is used to measure the degree to which a node is located “in the middle” of other nodes in the network; the more significant the intermediary centrality, the more vital the intermediary role. In general, although the rankings of the four types of network centrality did not change much during the study period, their values in 2021 generally increased compared to 2014; two provincial capitals, Xi’an and Jinan, were always at the top, and Baoji, Dezhou, Hohhot, Lanzhou, Luoyang, Qingdao, Taiyuan, Weifang, Xining, Yantai, Zhengzhou, and Zibo were at the top at different times and network types. The core status (cities with greater intermediary centrality) is significant, and these core cities can both easily and quickly generate links with and serve as bridges to other cities.
The core city status of Qingdao, Jinan, Xi’an, Yantai, Zibo, and Lanzhou in the Innovation Cooperation Network remains unchanged over the study period, while the core city status of Zhengzhou, Taiyuan, and Baiyin changes to Weifang, Liaocheng, and Dongying in 2021. The financial core city status of Baoji and Luoyang in the linkage network weakens, and Xining and Zibo gradually rise to the same level as Jinan, Zhengzhou, Qingdao, Xi’an, Taiyuan, Lanzhou, and Hohhot.
The core cities of the transportation network are mainly composed of provincial capitals, such as Jinan, Xi’an, Taiyuan, Zhengzhou, and Lanzhou in 2014, and the status of the three core cities of Weinan, Baoji, and Zibo gradually come to the fore in 2021; this indicates that the network begins to develop in three dimensions; in the information exchange network, apart from the unshakable core city status of the provincial capital cities, the flow of information elements between Qingdao and Yantai and other cities in the Yellow River basin is apparent.
4.4. Aggregation
Except for the information exchange network, the average clustering coefficients of the other three types of networks are above 0.8, which indicates that most nodes in the network tend to form small groups that trust each other and co-exist cooperatively, and there are fewer isolated nodes in the network, as shown in the table. This indicates that the Yellow River Basin urban agglomeration has a noticeable clustering effect on financial linkage, information exchange, and innovation cooperation. The occurrence of linkages between nodes has a specific territorial effect and tends to be cooperative and win–win, which is essential for resource integration and efficiency improvement. At the same time, it is important to be wary of the rigidity of the network structure caused by the aggregation effect and regional locking.
Specifically, except for the information exchange network, the average clustering coefficients in 2021 are higher than those in 2014, and the phenomenon of group cooperation is more significant. Examining the four types of networks from the node clustering coefficients, the core cities of Jinan, Qingdao, Zhengzhou, Xi’an and Taiyuan (with relatively high degree values), their local clustering coefficients in the transportation network in 2014 shows that the node clustering coefficients of the core cities, mainly provincial capitals, vary between 0.44 and 0.69, which indicates that the connection between the five core cities and their neighboring cities is not very close, and the network.
The radiative and dispersal capacity of the core cities is more significant than the driving capacity, and it shows more one-way links from the peripheral cities to the core cities, while the interactive links between the peripheral cities are less; the node clustering coefficients of the five core cities of the transportation network gradually develop from 0.54–0.75 in 2021, which indicates that, after seven years of development, the core cities of the transportation network have gradually strengthened the links with the peripheral cities.
In the financial linkage network in the study period gradually formed Hohhot, Lanzhou, Xi’an, Jinan, Qingdao, Taiyuan, and Zhengzhou most of the provincial capital core cities, Luoyang and Zibo core status rose relatively large, the development potential is the largest; in the information exchange network, the node clustering coefficients of several major cities with relatively high degree values have decreased and increased and did not form a stable core city.
In the innovation cooperation network, the node clustering coefficients of all 48 cities in the Yellow River Basin are rising, which indicates that the flow of innovation factors in the Yellow River Basin has emerged as an embracing phenomenon during the study period, and the network structure of the Yellow River Basin urban agglomerations has diversified and developed into a three-dimensional manner, among which the node clustering coefficient of Dongying has risen the most and reached the same status as the provincial capital city.
5. Evolutionary Assessment of Network Resilience
5.1. Network Type Determination
The coefficients of the degree distribution, the number of degree correlations, and the number of proximity correlations from the fitting of this paper are summarized in
Table 3. 𝑎 < 0. The hierarchical nature of the transportation network increases with a more significant increase during the study period, and thus the transportation network has the potential for resilient network development. The financial linkage network 𝑎 < 0, although slightly decreasing during the study period, the 𝑏 < 0, and 𝑐 < 0, and the absolute value is the largest, and thus the financial network can be regarded as a resilient network.
The hierarchy of the information network decreases the least, the number of its degree correlation links changes from positive to negative, and its absolute value becomes more extensive so that it can be regarded as a resilient network. 𝑐 < 0 The hierarchy of the innovation network decreases, and the degree of correlation is homogeneous and increases during the study period; however, the proximity of the innovation cooperation in the network increases the most and has the conditions for the development of a resilient network.
The core-edge analysis is conducted using UCNET to calculate the core degrees of 48 cities in four types of urban networks in the Yellow River Basin, and the core degrees above the average are taken as the core cities, and it is found that the overall structure of the network of urban clusters in the Yellow River Basin is stable, showing the characteristics of core-edge networks. The transportation network has the most significant number of core cities both in 2014 and 2021, which reflects the outstanding achievements of China’s transportation infrastructure construction since the new era.
Specifically, the cities with a core degree of the transportation network above 0.15 in 2014 are Jinan, Xi’an, Taiyuan, Zhengzhou, Dezhou, Luoyang, Xinxiang, Luohe, Xuchang, Yangquan, Zibo, Baoji, Kaifeng, Heze, Qingdao, Weifang, Zaozhuang, Lvliang, and Lanzhou, among which the core degree of the eastern and central provincial capitals is generally higher, and in 2021, on this basis, Weinan, Rizhao, Yantai, Xianyang, and Yinchuan are five cities, showing a trend of transformation from semi-fringe cities to core cities; the core areas of all four types of city networks have a tendency to expand, and the radiation capacity of core city clusters to fringe cities needs to be improved.
In the financial linkage network, Jinan, Qingdao, Zhengzhou, Taiyuan, and Lanzhou have a solid core city status, and Hohhot, Zibo, Xining, and Luoyang have great potential, and in 2021, Jinan, Qingdao, Zhengzhou, Taiyuan, Lanzhou and Hohhot as a six-core city cluster with frequent and stable interconnection, playing a familiar radiating role; in the information exchange network in 2021, the core city function of Taiyuan is weakened, Weifang and Luoyang become a six-core balanced network structure alongside Jinan, Qingdao, Xi’an, and Zhengzhou in one go, and Yantai, Linyi and Yinchuan and the edge cities in 2014 did not have.
In 2014, Yantai, Linyi, and Yinchuan were not closely connected with the peripheral cities; however, in 2021, the core position of these three cities will rise more; in 2014, the core cities of the innovation cooperation network were Jinan, Qingdao, Xi’an, and Zhengzhou, and the peripheral cities of the network were scattered. Among them, Yantai has the most significant development potential, and Dongying has the most apparent rise in core status, while Zhengzhou, the provincial capital city in the core city status in 2014 has a slow development of innovation cooperation factor flow.
5.2. Toughness Evolution Level
The average path length of all four types of networks in the Yellow River Basin urban agglomeration decreases, and the symbolized network transmissibility generally improve during 2014–2021. The average clustering coefficients are all above 0.75 close to 1, which represents the enhanced aggregation of the four types of networks during the study period. The degree distribution coefficients, degree correlation coefficients, and proximity correlation coefficients obtained from the tenacity evolution model and regression are shown in
Table 4.
From the overall perspective, the lowest level of resilience evolution of transportation network is 2.7750; the highest R-value of financial linkage network is 13.3848, and the most significant network resilience evolution; the level of resilience evolution is ranked as finance > information >innovation > transportation.
Specifically, (i) the transportation network has the largest hierarchical change during the study period, and its hierarchical evolution direction is favorable to the development of the resilient network. The financial linkage network has the largest hierarchical decrease, which is one of the reasons to prevent the further improvement of the resilient evolution of the financial linkage network; the innovation network has a smaller hierarchical decrease, which is manifested in the innovation cooperation network, where Dongying, Weifang, and Yantai are the cities with the highest level of resilience. The cities of Dongying, Weifang, and Yantai become the core cities of the same echelon as the provincial capital cities.
(ii) The transport network has a clear degree of homogeneity (𝑏 > 0), and its absolute value increases during the study period, which is not conducive to the improvement of network resilience, while the innovation cooperation network is also a degree homogeneous network; however, its absolute value increases more than twice during the study period, which means its network resilience weakens. However, the degree of heterogeneity of the financial linkage network is weakened during the study period, while the information exchange network is transformed from the degree heterogeneity network in 2014, which is another strong evidence of the increase in the evolution level of the information exchange network resilience.
(iii) Transportation networks and innovation cooperation networks are both proximity heterogeneity networks, representing the tendency of nodes with low proximity to connect with nodes with high proximity, which is favorable for resilience evolution; however, transportation networks are different from innovation cooperation networks in that transportation networks have the potential to develop into resilient networks; however, innovation cooperation networks have a more favorable trend of resilience evolution over the study period; financial linkage. The financial linkage network and the information exchange network are both proximity-related heterogeneous; however, the coefficient of the financial linkage network has a tendency to decrease, which becomes a disadvantage for the resilience evolution of the financial linkage network.
(iv) In terms of the magnitude of the resilience evolution, the financial linkage network (𝑙 = 13.0119) is both the highest level of resilience evolution and the Highest magnitude of resilience evolution; in terms of the quality of resilience evolution, the information exchange network has the highest potential.
6. Multi-City Network Resilience Optimization Path
In this paper, hierarchy, machinability, transportability, and agglomeration are considered as the key indicators affecting the level of resilience evolution of urban networks, and a resilience evolution coordinate system is constructed using hierarchy, machinability, and transportability to assess the level of resilience evolution of multiple urban networks. Improving network hierarchy, enhancing network heterogeneity, or reducing homogeneity leads to improved network resilience [
38].
The reduction of average path length and increase of network efficiency increase the network transmission efficiency, which increases the urban network toughness; the increase of average clustering coefficient portrays the increase of denseness of multiple networks. Therefore, the network toughness of the Yellow River Basin urban agglomeration can be explored in three aspects: consolidation of core city status, optimization of multiple city network structure, and optimization of factor flow.
6.1. Consolidate Core City Status
In terms of core cities, the core cities in 2014 are clearly shown as the four core cities of Jinan, Qingdao, Xi’an, and Zhengzhou, and in 2021 the core position of other cities starts to be highlighted with the different performance of different cities networks. Specifically, in addition to the four core cities of Jinan, Qingdao, Xi’an and Zhengzhou, in the transportation network in 2014, Haidong and Xining are associated with the performance of Taiyuan-Yangquan-Luliang, Jinan-Qingdao-Weifang-Zibo- Zaozhuang-Dezhou-Heze, Lanzhou-Baogui, Xi’an-Zhengzhou-Kaifeng-Xinxiang- Xuchang-Luoyang-Luohe, and in 2021 on top of that, Hohhot-Taiyuan Jinzhong, Liaocheng-Heze, Zhongwei-Yinchuan, Yantai-Rizhao, and Weinan-Xi’an-Xianyang in different degrees of core cities.
The financial linkage network in the study period is stable as Jinan-Qingdao-Xi’an-Zhengzhou-Taiyuan; and the core cities in the information exchange network did not change much, and the core cities in 2014 are clearly Jinan-Qingdao-Xi’an-Zhengzhou-Taiyuan, and in 2021, Weifang performed the best in the information exchange network 2014, and the core position of Taiyuan decreased, which is Jinan-Qingdao-Xi’an-Zhengzhou-Weifang.
The innovation cooperation network in 2014 is Jinan-Qingdao-Xi’an-Zhengzhou, which has a noticeable provincial capital effect, while the flow of innovation factors in Zhengzhou is sluggish in 2021, and the cities in the Shandong Peninsula, such as Weifang, Dongying, Liaocheng, Zibo, and Yantai, the innovation capacity rises rapidly, and they become core cities at the same level as the provincial capitals, and cities in the lower reaches of the Yellow River Basin has rapid innovation factor flows and good conditions to develop into resilient networks.
Although Baoji, Dezhou, Hohhot, Lanzhou, Luoyang, Taiyuan, Weifang, Xining, and Yantai will become core cities in different city networks in 2021, there are more core cities in each city network, and the core position is not apparent or not well connected. These are the reasons for the decrease in multi-city network hierarchy in 2021, and the network hierarchy will lead to a decrease in the level of resilience evolution of city networks.
Jinan, Qingdao, Zhengzhou, and Xi’an, as the four core cities of the Yellow River Basin urban agglomeration reflect the absolute importance in the multi-city network and play a radiating role in the whole Yellow River Basin urban agglomeration, and their status is irreplaceable. Therefore, focusing on the status of core cities and establishing and maintaining the connections between these core cities and other cities are of great importance to improve the resilience of the network of the Yellow River Basin Urban Agglomeration.
6.2. Optimize the Structure of the Multi-City Network
In terms of edge cities, although the edge cities have enhanced connections in 2021 in addition to the information exchange network, their hierarchical connections are more complex. For example, Zibo, Yantai, Linyi, Xinxiang, Xianyang, and Dezhou in the transportation network; Linyi, Xinxiang, Xianyang, Hohhot, Yulin, Yangquan, and Shizuishan in the financial linkage network; and Haidong, Xining, Shizuishan, Tai’an, and Dezhou in the innovation cooperation network. The hierarchy of city networks in the Yellow River Basin, except for the transportation network, generally shows a slight decrease in the study period.
The small decline in network hierarchy hinders the development of resilient networks in the Yellow River Basin urban agglomerations to some extent. The rise in information exchange network heterogeneity reflects the tendency of more functional cities to link up with less functional cities, driving the synergistic regional development of the Yellow River Basin urban agglomeration, which is conducive to improving urban resilience. There are different edge city nodes in different city networks in the Yellow River Basin urban agglomeration, which are less connected with other nodes in the network and are relatively weak in their strength.
These edge city nodes will affect the urban network resilience to a certain extent; although the role of edge cities on the overall urban cluster network construction is small, according to the theory of diminishing marginal effect, they actively promote the close connection between edge cities and core cities, drive the collaborative development of edge cities to improve the overall urban network resilience more effectively. Therefore, it is imperative to give full play to the radiation-driven role of core cities to promote the sustainable development of edge cities.
6.3. Optimize Factor Flow
The nodal cities become the most minor units to promote factor flow to achieve network resilience improvement. Specifically, (i) transportation network, based on Taiyuan-Yangquan-Luliang, Jinan-Qingdao-Weifang-Zibo-Zaozhuang- Dezhou-Heze, Lanzhou-Baoji, Xi’an-Zhengzhou-Kaifeng-Xinxiang-Xuchang-Luoyang-Luohe, as a primary transportation route, need to enhance the transportation links between cities, such as Baotou, Erdos, Linxia, Shangluo, and Shizuishan and core cities, focusing on upgrading the transportation infrastructure of peripheral cities to enhance the transmission efficiency.
(ii) The financial linkage network has the highest level of resilience evolution; however, it is necessary to break the negative impact financial barrier generated by the high aggregation of Jinan, Qingdao, Zhengzhou, and Xi’an, so that a market environment with free flow of capital factors and diverse and clear division of urban functions can be formed in the whole area of the Yellow River basin city cluster, thus enhancing the resilience of financial linkage network.
(iii) The Information linkage network should strengthen the core city status of Jinan, Qingdao, Zhengzhou Xi’an, and Taiyuan to further develop the network resilience.
(iv) The innovation cooperation network ranks third in terms of the evolution level of resilience, with low strength of its fourth and fifth level network linkages and more first and second level linkages.
There are apparent core cities of Jinan, Qingdao, Dongying, Weifang, Liaocheng, Zibo, and Yantai; however, the middle and upper reaches of the Yellow River Basin city clusters perform poorly. Therefore, better promotion of innovation factors flowing throughout the region becomes the focus of the development of innovation cooperation networks in the Yellow River Basin city clusters. The focus should be on improving the regional innovation organizations led by enterprises, universities and research institutes, and governments and laying the foundation for the formation of an innovation cooperation system that is both competitive and cooperative with enterprises, universities and research institutes, governments, and third-party institutions as the executive bodies, which in turn promotes the quality and level of Innovation in the Yellow River Basin.
7. Conclusions
The model in this study used network hierarchy, matching, transmission, and agglomeration to measure the resilience of multiple urban networks in the Yellow River Basin urban agglomeration and finally established a three-dimensional coordinate system of hierarchy, matching, and transmission to explore the evolution level of resilience in Yellow River Basin urban agglomeration.
First, except for the transportation network, the hierarchy of multi-city networks decreased slightly, and the core cities of all four types of networks included Jinan, Qingdao, Zhengzhou, Xi’an, and Taiyuan. Second, in terms of network structure evolution, the financial linkage network and the innovation cooperation network were both “resilient networks”, and the innovation cooperation network and the transportation network have the potential to develop into resilient networks.
The transportation network was dense in the west, dense in the east, and sparse in the center, while the information exchange network and the innovation cooperation network showed a stable triangular structure, and the financial linkage network formed the network structure of the four first core cities and the second core cities of Xining, Zibo, Luoyang, Yantai, Yinchuan, Baoji, Linyi, and Baotou.
The network resilience level of the multi-city network has improved to a certain extent, among which the network resilience of the financial linkage network has improved the most significantly. Finally, we explored the ways to improve the resilience of multi-city networks from three aspects: consolidating the core city status, optimizing the multi-city network structure, and optimizing the factor flow.
This study provides a theoretical basis for promoting the development of policies for high-quality urban resilience and to make up for the lack of research on the resilience of urban clusters in the Yellow River basin network. At the same time, this paper can provide a comparative object for studying the resilience of major urban agglomerations.
However, this paper still has the problems of small research scope and small time scale. The scope of future research can be expanded or refined to county-level cities, and more years can be added in time to comprehensively understand the evolutionary development of the resilience of multiple city networks in the Yellow River urban agglomeration.


