Abstract
Silver carp (Hypophthalmichthys molitrix) is a world-wide species and its ecosystem level influence is controversial. Therefore, understanding the feeding behaviour of silver carp is important for assessing ecosystem functioning in many freshwater habitats. In this study, we used 18S rRNA sequencing to identify the spatiotemporal taxonomic composition of water and fish gut samples. Significant seasonal and spatial variations were observed in the taxonomic compositions of water and fish gut samples (p < 0.05). Five selected environmental factors (temperature, total phosphorus, chlorophyll a, ammonia, and distance from the first dam downstream) significantly affected the taxonomic composition of water (p < 0.05). Additionally, the temperature was the most important factor affecting seasonal (winter and summer) variations in the prey community composition of water, whereas the distance from the dam was the key factor contributing to spatial differences in the community. Significant differences were observed in the taxonomic composition between the water and fish gut samples (p < 0.05). Feeding selectivity analysis revealed that the selection ratios of the top 20 prey taxa underwent slight spatial and temporal changes, but silver carp always preferred to feed on Peridiniales, unidentified Streptophyta, unidentified Trebouxiophyceae, and unidentified Chlorophyceae. These results indicate that changes in the prey community in the environment affect the taxonomic composition of the fish gut but do not affect feeding preferences.
1. Introduction
The diet of fish plays an important role in growth, gonad development, reproduction and overall health status, which are determined by genes and influenced by ontogenesis, prey availability, and water physicochemical characteristics [1,2,3]. Numerous studies have observed plasticity in the diet and foraging strategies of fish that help to track variable food resources, which promote fish colonization in a new habitat [4,5]. Spatiotemporal diet shifts in fish are primarily driven by changes in prey composition and availability in the environment [6]. An ontogenetic diet shift is closely related to the accessibility of food to the predator and the requirement for high-quality food at a specific developmental stage [7,8]. The dietary composition of fish can be complex, and dietary shifts are common. Optimal foraging theory indicates that the variability of instantaneous food preference is related to the availability of food resource [9].
Determining the taxonomic composition of fish gut content is challenging because undigested food remnants are difficult to identify morphologically, especially in planktivorous fish. DNA-based techniques are widely used to identify the gastrointestinal taxonomic composition because they provide high resolution and organism detection capacity [10,11,12]. More specifically, DNA barcoding cytochrome c oxidase I (COI) is commonly used for the identification of animals [13]. Further, nuclear ribosomal internal transcribed spacer (ITS), 16S ribosomal RNA (rRNA), and 18S rRNA aid in the identification of fungi, bacterial community, and eukaryotic components, respectively [14,15,16].
The 18S rRNA sequencing is an accurate and efficient technique for the identification of planktonic communities [16,17] and protists [18]. Two hypervariable regions, V9 and V4, were identified as the most applicable genetic markers for barcoding on the 18S rRNA [19,20]. The sequencing results from the V4 region were more similar to those obtained from full-length 18S rRNA genes [21]. Moreover, the V4 dataset is more appropriate for describing the diversity of phytoplankton at lower taxonomic levels and is widely used for the identification of plankton composition in water and fish gut samples [22,23,24].
Silver carp, Hypophthalmichthys molitrix, is a commercially important planktivorous fish species in China that accounts for approximately 13.6% of the total catch in the middle and lower reaches of the Pearl River [25]. Silver carp are popular for controlling phytoplankton assemblages; however, the reasons for the difference in their feeding responses remain controversial [26,27,28]. In biomanipulation studies, silver carp can either directly reduce and reshape algal biomass by feeding on phytoplankton [29,30] or, in contrary, support production of small-sized algae by grazing on zooplankton [31,32]. In general, the relationship between the diet of this fish and the plankton community structure seems to be complex. Moreover, the effect of changes in the plankton community on the feeding selectivity of silver carp is not yet understood.
The Pearl River, the largest river in southern China, has a total length of 2214 km and an annual discharge of 3.3 × 10¹¹ m3. Over 26,000 dams have been built in the Pearl River Basin, of which 11 are located in the mainstream of the river [33]. Certainly, plankton communities and the biological characteristics of fish are affected by dam construction [34,35]. It has been reported that the spatial and temporal distribution of silver carp in the Pearl River is significantly affected by environmental factors, such as water discharge and river depth [25,36]. However, we lack a clear understanding of the effects of variations in plankton assemblages on the diet of planktivorous silver carp in dammed river stretches.
We used 18S rRNA sequencing to reveal the variation in plankton communities and feeding selectivity of silver carp at different distances from a dam in the Pearl River and discussed the underlying drivers. We focused on answering the following questions: (i) How do plankton communities vary along the downstream longitudinal profile of the dam and what are the key environmental factors? (ii) How do the silver carp’s dietary and feeding selectivity vary? (iii) Does the prey community affect the feeding preferences of silver carp?
2. Materials and Methods
2.1. Sampling Procedures
Four sampling sites (ZQ, DQ, FK, and WZ) were selected in the mainstream of the Pearl River based on the distance from the Changzhou Dam (closest dam to the estuary, Figure 1). The water depths at ZQ, DQ, FK, and WZ during the flood season are 16.4, 15.5, 12.6, and 12.2 m, respectively. The distances to the Changzhou dam from WZ, FK, DQ, and ZQ are 8, 30, 85, and 175 km, respectively. The closer the area to the estuary, the higher the economic development and the more nutrients enter the river. Surface water samples (0.5 m depth) were collected during winter (December 2019 and January 2020) and summer (July and August 2020) from the four sites. Triplicate water samples were collected from each site using a 5 L HQM-1 sampler, placed in a polyethylene bottle, and immediately transferred to the laboratory while on ice. A 500 mL water subsample from each bottle was filtered with a 20 μm nylon net filter (Millipore, Ireland). The filtrate was then filtered through a 0.2 μm mixed cellulose membrane filter (Pall, Michigan). Finally, the filters were immediately stored in liquid nitrogen for two days, and then transferred to −80 °C until further analysis. The 20 μm and 0.2 μm membranes of the same water sample were combined for DNA extraction.
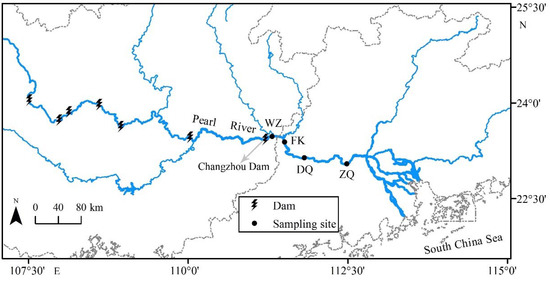
Figure 1.
Locations of sampling sites and dams in the mainstream of the Pearl River, China.
Fish samples were collected during winter (December 2019 and January 2020) and summer (July and August 2020) from sites ZQ, DQ, FK, and WZ, by using circular cast nets and gill nets and then immediately euthanized and transferred to the laboratory on ice. Adult fish were selected across four sites to avoid ontogenetic dietary variations. Their standard length (SL, mm) and body mass (M, g) were measured. The body surface was swabbed with 70% alcohol, and the fish were dissected using sterile instruments. Approximately 0.3 g of the foregut contents was extracted and immediately stored in liquid nitrogen. Information regarding the silver carp and water samples is presented in Table 1.

Table 1.
Basic information of the silver carp (Hypophthalmichthys molitrix) and water samples.
2.2. Water Physiochemical Measurements
The water temperature (Temp), pH, salinity (Sal), dissolved oxygen (DO), oxidation–reduction potential (ORP), conductivity (Cond), and total dissolved solids (TDS) of the surface water, were measured in situ at each sampling site using a handheld multi-parameter water quality analyzer (YSI, USA). The water transparency was measured using a Secchi disk. The chemical oxygen demand (CODMn) and chlorophyll a were measured according to the methods of the State Environment Protection Administration [37]. The concentrations of total nitrogen (TN), nitrate (NO3−), nitrite (NO2−), ammonia (NH4+), total phosphorus (TP), phosphate (PO43−), and silicate (SiO32−) were detected using an automated wet chemistry analyzer (SKALAR, Netherlands) according to the manufacturer’s protocols.
2.3. DNA Extraction, PCR Amplification and Sequencing
Total DNA was isolated from the filter and gut content samples using the (cetyl trimethylammonium bromide-DNA)-DNA precipitation method [38]. The V4 hypervariable region of the eukaryotic 18S rRNA gene was amplified using universal primers, 528F/706R (528F: GCGGTAATTCCAGCTCCAA; 706R: AATCCRAGAATTTCACCTCT) [39]. Each sample was amplified with 15 µL of Phusion® High-Fidelity PCR Master Mix (New England Biolabs), 2 µM of forward and reverse primers, and approximately 10 ng of template DNA. PCR cycling was performed as follows: initial denaturation at 98 °C for 1 min, followed by 30 cycles of denaturation at 98 °C for 10 s, 50 °C for 30 s, and 72 °C for 30 s, and a final extension at 72 °C for 5 min. The PCR products were mixed and purified using a Qiagen Gel Extraction Kit (Qiagen, Hilden, Germany). The concentration of the purified PCR products was measured using a NanoDrop ND-2000 spectrophotometer (Thermo Scientific, Waltham, MA, USA). Sequencing library construction was performed using the TruSeq® DNA PCR-Free Sample Preparation Kit (Illumina, San Diego, CA, USA), following the manufacturer’s recommendations. The library quality was assessed on a Qubit@ 2.0 Fluorometer (Thermo Scientific) and an Agilent Bioanalyzer 2100 system. 18S rRNA sequencing was performed on an Illumina NovaSeq platform at Novogene Bioinformatics Technology Co., Ltd. (Beijing, China), and 250 bp paired-end reads were generated.
Operational taxonomic unit (OTU) classification was performed using Uparse (version 7.0.1001, http://www.drive5.com/uparse/ (accessed on 14 July 2021)) with 97% sequence identity [40]. Representative OTUs were assigned with taxonomic information using the RDP Classifier (Version 2.2, http://sourceforge.net/projects/rdp-classifier/ (accessed on 14 July 2021)) [41] and Silva132 database (http://www.arb-silva.de/ (accessed on 14 July 2021)) [42]. This study focused on the prey items of silver carp; therefore, we removed OTUs annotated with intestinal parasites and pathogens by referring to Bergey’s Manual of Systematic Bacteriology, for further analysis, to avoid any deviation caused by the contamination of intestinal microbiomes. Moreover, the OTUs that were not annotated or annotated only to the kingdom were removed.
2.4. Data Analysis
2.4.1. Environmental Parameters
The assumptions of normality of distribution and homogeneity of variance of environmental parameters were checked by Shapiro–Wilks and Bartlett’s tests, respectively. If the data were normal and the variance was equal, the t-test was used to analyze the differences in environmental factors between winter and summer; otherwise, the Wilcoxon test was used. All statistical analyses were performed using the stats package for R 3.6.2 [43].
2.4.2. Alpha-Diversity Analysis
Alpha diversity was expressed by the Chao1 index, which was calculated from normalized OTU relative abundances and subsequently checked for assumptions of normality and homogeneity by Shapiro–Wilks and Bartlett’s tests. Non-parametric Kruskal–Wallis tests were used to compare the Chao1 index among the four sites in water and fish samples. In contrast, Wilcoxon tests were used to examine the differences between seasons (winter vs. summer) and samples (water vs. fish samples). A boxplot of the Chao1 index of community alpha diversity with significance levels in water and fish samples at four sites in two seasons was plotted using ggpubr package for R.
2.4.3. Beta-Diversity Analysis
Beta diversity was calculated for the taxonomic compositions of the water and fish samples based on the normalized OTU abundances. Nonmetric multidimensional scaling (NMDS) based on the Bray–Curtis’ dissimilarity was used to visualize the variations in taxonomic composition between groups. Analysis of similarities (ANOSIM) was used to examine the differences between the water and fish samples. A non-parametric multi-response permutation procedure (MRPP) and permutational multivariate analysis of variance (PERMANOVA) were conducted to examine whether there were significant community differences between the water and fish samples across the four sites. All of the above statistical analyses were performed with the square-root-transformed data using the vegan package for R.
2.4.4. Relationship between Water Taxonomic Composition and Environmental Factors
The taxonomic compositions data (based on OTUs) were log (x + 1) transformed, and then Hellinger-transformed to center the data. Pearson correlation analysis and variance inflation factors (VIFs) were used to check the collinearity of the environmental factors. First, a correlation analysis was used to remove significantly correlated factors. Second, the VIFs were calculated, and factors with a VIF lower than 10 were selected for further analysis. Distance-based redundancy analysis (db-RDA) plots were generated using selected environmental factors based on the Bray–Curtis dissimilarity matrix. Monte Carlo permutation tests (999 permutations) were performed to identify the significance of the db-RDA model and the environmental factors. All of the above statistical analyses were conducted using the psych, vegan, and ggplot2 packages for R.
2.4.5. Feeding Selectivity
Manly selectivity ratio (MSR) was used to analyze the feeding selection of silver carp, which was calculated by the selection ratio = order use/order availability [44]. Order use is the normalized abundance of order i in the fish gut, and order availability is the abundance of order i in water. We calculated the MSR for each order that was found to have been fed silver carp at least once. An MSR value larger than one indicates positive selection for that order, indicating that the fish are targeting that order compared to its availability in the environment [45]. However, a value lower than one indicates a negative selection towards that food item, indicating avoidance of that food item in the environment. The MSR was calculated and plotted using the adehabitatHS package in R [44].
3. Results
3.1. Temporal Variations in Environmental Factors
Data for the 17 environmental factors at the four sampling sites in winter and summer are shown in Table S1. Ten environmental factors differed significantly between winter and summer (p < 0.05) during the sampling period (Table S2). Temperature, pH, oxidation–reduction potential, and silicate were significantly higher in the summer than in the winter. However, salinity, dissolved oxygen, conductivity, total dissolved solids, water transparency, and nitrate were significantly higher in the winter than in the summer (p < 0.05). The other seven factors (chemical oxygen demand, total nitrogen, nitrite, ammonia, total phosphorus, phosphate, and chlorophyll a) were not significantly different between the winter and summer (p > 0.05).
3.2. Spatio-Temporal Variations in the Diversity and Taxonomic Composition of Water and Fish Gut Samples
We obtained 9,021,735 reads and 5741 OTUs from 101 filter and foregut content samples collected from the four sites in the middle and lower reaches of the Pearl River. These OTUs were identified as 30 phyla, 206 orders, and 764 species. Overall, the taxonomic composition of the water was dominated by six phyla (Diatomea, Arthropoda, unidentified Eukaryota, Cryptophyceae, Ciliophora, and Chlorophyta), which contributed to 92.6% of the total communities (Figure 2A). The gut contents of fish were dominated by four phyla (Streptophyta, unidentified Eukaryota, Chlorophyta, and Diatomea), which contributed to 82.1% of the total communities (Figure 2A). At the order level, the dominant orders were Calanoida (20.6%) and unidentified Mediophyceae (17.9%) in the water samples, and unidentified Streptophyta (34.9%), Peridiniales (10.8%), and unidentified Chlorophyceae (9.8%) in the fish gut samples (Figure 2B).
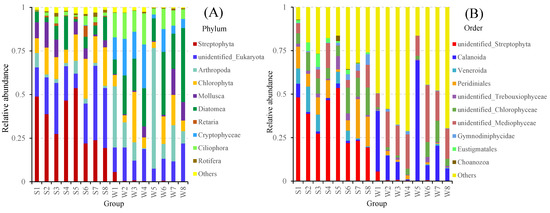
Figure 2.
Relative abundance of the top 10 taxa in the water and fish gut samples from the Pearl River at the phylum level (A), and the order level (B).
The Chao1 values of the communities were significantly different between the water and fish samples across the two seasons; however, there was no significant difference between the winter and summer in both the water and fish samples (Figure 3A). There were no significant differences in the Chao1 indices among the four sites in water or fish samples (Figure 3B). However, significant differences in Chao1 indices were observed between the water and fish samples at each site (p < 0.01).
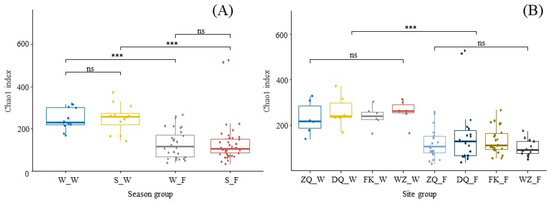
Figure 3.
Chao1 richness estimates of community alpha diversity of water and fish gut samples across two seasons (A), and four sites (B). Boxplots visualize the median value (centre line) and the boxes show the interquartile range. Whiskers extend to the lowest and highest values within 1.5 times the interquartile range. Kruskal–Wallis tests followed by Wilcoxon multiple comparisons tests were used to generate p values and are displayed as an asterisk above the boxplot (*** p < 0.001). Abbreviation: W_W winter water, S_W summer water, W_F winter fish, S_F summer fish, ZQ_W water from ZQ, DQ_W water from DQ, FK_W water from FK, WZ_W water from WZ, ZQ_F fish from ZQ, DQ_F fish from DQ, FK_F fish from FK, WZ_F fish from WZ, ns no significance.
The taxonomic composition showed a clear separation between water and fish gut samples across the four sites and two seasons (p < 0.01, ANOSIM, Figure 4A). Significant seasonal variations in the taxonomic compositions of water and fish samples were observed between the winter and summer based on the MRPP and PERMANOVA analyses of the Bray–Curtis and Jaccard dissimilarity matrix, except for the fish samples from DQ (Table 2). Significant differences in taxonomic composition between the water and fish samples were observed at each site according to both MRPP and PERMANOVA analyses (Table 2). Moreover, the taxonomic communities from the water and fish samples were significantly different among the four sampling sites (Table 2).
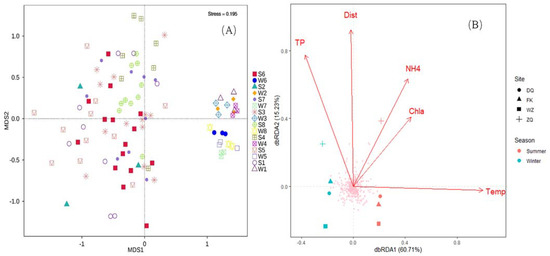
Figure 4.
Taxonomic compositions of water and fish gut samples vary with season and site in the Pearl River. (A) Spatio-temporal variations in taxonomic composition based on non-metric multidimensional scaling (NMDS) ordination of Bray–Curtis dissimilarities. (B) Four environmental variables (temperature, total phosphorus, chlorophyll a, and ammonia) significantly (p < 0.01, permutation test) contribute to the spatial and temporal variation in taxonomy composition in water samples via dbRDA. Abbreviations: Temp temperature, TP total phosphorus, Chla chlorophyll a, NH4+ ammonia, Dist distance from the dam.
Table 2.
Results of different multivariate tests for the variations in the taxonomic composition between different types of samples, seasons, and sites.
MetaStat analysis revealed that the top 10 phyla and orders were significantly different among the groups. The relative abundances of phyla Arthropoda and Ciliophora in water were evidently higher than those in the fish gut samples, whereas the relative abundance of Streptophyta in water was lower than that in fish (Figure 5). The relative abundances of the phyla Arthropoda and Diatomea in group W5 (summer water samples from ZQ) were significantly higher than those in group S5 (summer fish samples from ZQ), whereas the opposite was observed for the phylum Stretophyta. The phyla Chlorophyta, Ciliophora, and Diatomea were significantly more abundant in W3 (winter water samples from FK) than in S3 (winter fish samples from FK), whereas the opposite was observed for the phylum Stretophyta. The phyla Ciliophora and Diatomea were significantly more abundant in W6 (summer water samples from DQ) than in S6 (summer fish samples from DQ), as opposed to Stretophyta. The relative abundance of the phylum Ciliophora in W4 (winter water samples from WZ) was significantly higher than that in S4 (winter fish samples from WZ), and the relative abundance of Diatomea in W8 (summer water samples from WZ) was significantly higher than that in S8 (summer fish samples from WZ). The phylum Diatomea in W7 (summer water samples from FK) was significantly more abundant than that in S7 (summer fish samples from FK), as opposed to unidentified Eukaryota.
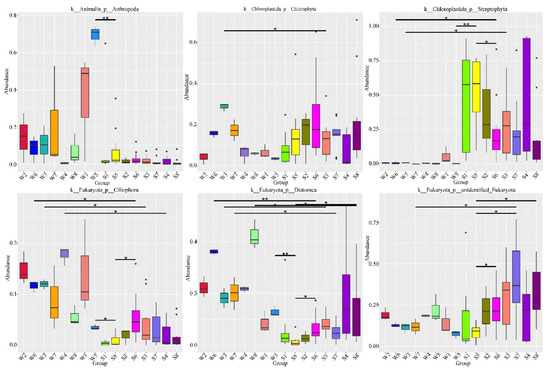
Figure 5.
Boxplot of the relative abundances of 6 taxa out of the top 10 phyla with significant differences between different groups revealed by MetaStat analysis. Boxplots visualize the median value (center line) and boxes show the interquartile range. Whiskers extend to the lowest and highest values within 1.5 times the interquartile range. One (*) and two (**) asterisks denote p < 0.05 and p < 0.01, respectively.
3.3. Environmental Factors Influencing the Taxonomic Composition of Water
Five environmental factors (temperature, total phosphorus, ammonia, chlorophyll a, and distance from the first dam downstream) were selected after removing the factors with significant correlation (p < 0.05) using Pearson correlation analysis (Table S3). Moreover, the variance inflation factor (VIF) for each selected environmental parameter was less than 10. The db-RDA analysis revealed that the five factors, as significant determinants, contributed to 51.2% of the variance in the taxonomic composition of water at the four sites across the two seasons (p < 0.05). The first two axes explained 60.7% and 15.2% of all the environmental variables, respectively (Figure 4B). All selected environmental variables had a significant effect (p < 0.05) on water community composition based on the Monte Carlo permutation test (Table 3). The winter and summer samples were separated by the first axis (dbRDA1), suggesting that temperature was probably the most important factor affecting variations in the prey community composition of water in these two seasons. The water samples from ZQ were separated from other samples by axis 2 (dbRDA2), indicating that the distance from the dam may be primarily significant, and total phosphorus and ammonia may be secondarily significantly, contributing to the spatial differences in taxonomic composition between ZQ and the others.
Table 3.
Results of the permutation test for the distance-based redundancy analysis (dbRDA, n = 999 permutations) used to test the relationship between the environmental variables and taxonomic composition in water. Significant p-values are in bold.
3.4. Dietary Selectivity of Fish
In general, the silver carp preferred 4 (Peridiniales, unidentified Streptophyta, unidentified Trebouxiophyceae, and unidentified Chlorophyceae) and avoided 16 out of top 20 orders they consumed (Figure 6). The selectivity ratios of the top 20 orders at the four sites in the two seasons are shown in Figure 7, excluding unidentified Ulvophyceae and Peniculia, which were partially absent in the water at some sites (such as summer ZQ, winter FK, and summer WZ). Although the selection ratios changed, there was no large spatial or temporal variation in the feeding preferences of silver carp in the Pearl River. Silver carp from different sites and seasons mainly preferred to consume similar orders, such as unidentified Streptophyta (MSR 7.1–329), Peridiniales (MSR 5.2–197.7), unidentified Chlorophyceae (1.3–8.4), and unidentified Trebouxiophyceae (MSR 1.2–3.5). Spatiotemporal differences in the diet of silver carp were evident in the preference for the orders Bicosoecida and unidentified Diatomea. More specifically, silver carp preferred Bicosoecida in winter and summer at ZQ, DQ, and FK, but avoided it at WZ in the summer. The fish avoided unidentified Diatomea, but preferred it at DQ in the winter. Likewise, the fish avoided Calanoida, but slightly preferred it at WZ in the winter (MSR 1.2).
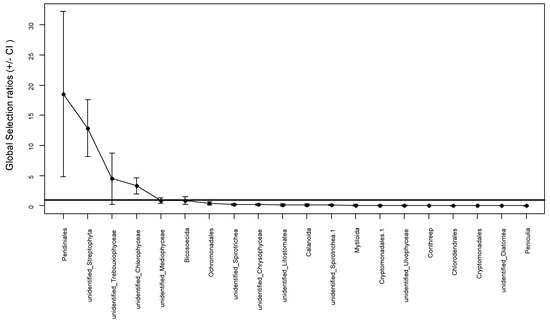
Figure 6.
Manly’s selectivity ratios (MSR) of the top 20 orders in the silver carp. Error bars denote the 95% confidence intervals. The horizontal line located at MSR equals 1.
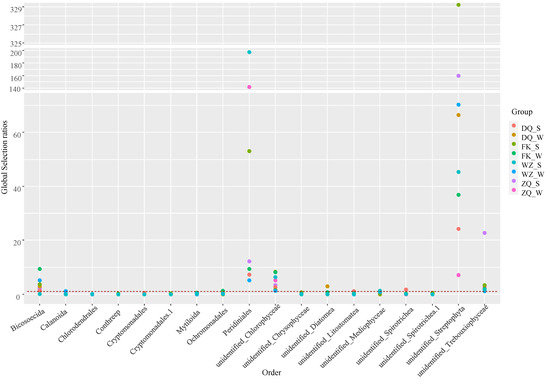
Figure 7.
Spatiotemporal variations of Manly’s selectivity ratios (MSR) of silver carp at four sampling sites in two seasons. Abbreviations: ZQ_W, fish collected from ZQ in the winter; ZQ_S, fish from summer ZQ; DQ_W, fish from winter DQ; DQ_S, fish from summer DQ; FK_W, fish from winter FK; FK_S, fish from summer FK; WZ_W, fish from winter WZ; WZ_S, fish from summer WZ.
4. Discussion
Seasonal variations (winter and summer) in the prey community composition of the environment were mainly affected by temperature, whereas the spatial differences in the community were mainly attributed to the distance from the dam in this study. Previous studies have shown that the plankton community structure in the middle and lower Pearl River is influenced by water temperature, river discharge, and nutrient levels [46]. Generally, high temperatures associated with intense sunlight and low velocities are recognized as beneficial for plankton growth [47]. In the present study, there was no great variations in chemical environmental factors between the sampling sites; however, the distance from the dam that was related to water flow was quite different. Overall, the changes in the structure of the plankton communities in the study area are in line with the findings of previous studies.
Silver carp is a typical planktivorous filter-feeding fish with a variation in diet composition derived from different sources. Generally, it is challenging to identify indigested remains within the foregut of this species using microscopic morphological visualization. Moreover, the large volume of suspended sediment in the gut of silver carp carried when filtering food could have underestimated the contribution of plankton using morphological visualization. Therefore, the present study used the Illumina paired-end sequencing technology to identify food items. 18S rRNA sequencing has proven to be robust in the determination of plankton communities in water samples [48,49] and the identification of the gut contents of filter-feeding and omnivorous species [7,24]. This study identified 5741 OTUs attributed to 30 phyla and 206 orders from all samples. The OTUs from the fish gut samples varied from 22 to 237, and the ranges of the identified phyla and orders were 4–16 and 8–67, respectively. These results indicate that the food sources of silver carp were abundant, suggesting a high variability in feeding preference.
The effect of silver carp on the structure of the phytoplankton and zooplankton communities is controversial. Previous studies have reported that silver carp prefer to consume more phytoplankton than zooplankton [50,51]. However, the stocking of silver carp in some reservoirs or ponds causes a decrease in the total zooplankton biomass, with a significant increase in the biomass of phytoplankton [27,28,52]. The grazing intensity of zooplankton on phytoplankton is stronger than that of silver carp on phytoplankton [27]. Our results indicate that silver carp feed on both phytoplankton and zooplankton but consume more phytoplankton (Chlorophyta, Diatomea, and Cryptophyceae) than zooplankton (Rotifera). Moreover, the food composition of silver carp varies spatiotemporally in response to changes in prey resources in the environment along the Pearl River.
Planktivorous fish may accidentally intake some occasional species during filter feeding; therefore, using Manly’s selectivity ratio to calculate diet selectivity likely inflates the contribution of occasional species to the fish diet. To reduce the inflated contribution of occasional taxa to fish, we chose the top 20 orders based on the normalized abundance of taxonomic composition in water samples. The silver carp exhibited strong selectivity for Streptophyta, which probably resulted from the intake of a large volume of suspended debris in the gut during food filtering. Enclosure experiments have revealed that silver carp tend to graze on phytoplankton species larger than 30 μm [28,53,54]. However, some studies have shown that this fish can only filter phytoplankton smaller than 20 μm [55,56]. These studies indicate that the dietary preferences of silver carp are complex and probably vary with food resources in the environment. Notably, the results of our study suggest that the prey composition of silver carp differs significantly from that of water. This may be attributed to the feeding selectivity of fish.
The present study demonstrated that the dietary preferences of silver carp are relatively stable, presenting, with no significant spatiotemporal differences in the preferences of major food items. The prey composition in the environment showed significant spatiotemporal changes, but this did not seem to affect the feeding preferences of silver carp. Fish diet shifts are primarily attributed to ontogenetic development [7,57], intra- and interspecific competition [5], and habitat heterogeneity [58]. In the Yangtze River, silver carp larvae in reaches far from the dam demonstrated higher feeding intensity and faster growth than those closer to the dam, but there is a lack of studies on how the dam changes the diet composition [59]. In this study, although there were spatiotemporal changes in fish size, we chose adult fish across four sites in two seasons to avoid ontogenetic dietary variations. In addition, the Changzhou Dam is a low-head dam with a hydraulic height (head water to tail water) of 9.5 m, and is a daily discharge regulation power station in non-flood season (October–February) and a run-off river station in flood season (March–August). Therefore, the impoundment of the dam would not dramatically influence the downstream flow patterns [60]. There were also no great seasonal or spatial differences in the fish community structure between different reaches below the dam [25]. All of these could be reasons for the lack of significant changes in the feeding preferences of the silver carp. In summary, changes in the structure of the plankton community in the environment did not notably affect the feeding preferences of the silver carp.
5. Conclusions
This study provides data on the winter and summer water quality, prey communities in the environment, and silver carp diets at four sites downstream of the Changzhou Dam in the Pearl River. We observed significant spatiotemporal variations in the prey community structure in the water and the diet composition of the fish. Five environmental factors (temperature, total phosphorus, chlorophyll a, ammonia, and distance from the dam) significantly affected the taxonomic composition of water. More specifically, temperature was the most important factor affecting seasonal variations (winter and summer) in the prey community composition of water. In contrast, the distance from the dam was the key factor affecting the spatial variation of the community. In addition, the taxonomic composition of the fish gut was significantly different from that of water. However, the feeding preference of silver carp seemed to remain stable, preferring to feed on Peridiniales, unidentified Streptophyta, unidentified Trebouxiophyceae, and unidentified Chlorophyceae, with changes in plankton communities in the water. Based on these results, we conclude that changes in the prey community in the environment affect the taxonomic composition of the fish gut but not the feeding preferences.
Supplementary Materials
The following supporting information can be downloaded at: www.mdpi.com/article/10.3390/su141811175/s1, Table S1: Environmental characteristics at four sampling sites in winter and summer along the middle and lower reaches of the Pearl River; Table S2: Comparison of environmental parameters between winter and summer seasons; Table S3: Pearson’s r correlations between different environmental factors.
Author Contributions
Y.X.: Conceptualization, methodology, investigation, formal analysis, writing, visualization, funding acquisition; Q.L., S.Z. and Y.L.: methodology, investigation; X.L.: conceptualization, supervision, project administration; J.L.: supervision, project administration, funding acquisition. All authors have read and agreed to the published version of the manuscript.
Funding
This work was supported by the Science and Technology Project of Guangzhou (202102020270), the National Key R&D Program of China (2018YFD0900902), and the Pearl River Fishery Resources Survey and Evaluation Innovation Team Project (2020TD10, 2020ZJTD-04).
Institutional Review Board Statement
All experiments were performed under the approval of the Ethics Committee of Pearl River Fisheries Research Institute, Chinese Academy of Fishery Sciences.
Informed Consent Statement
Not applicable.
Data Availability Statement
The raw sequence data are available in the National Center for Biotechnology Information (NCBI, USA) Sequence Read Archive (SRA) database under the accessing number SRR187498-44, 45, 46, 77, 78, 81, 93, 94, 95; SRR 187499-43, 45, 79; SRR 187654-13, 44; SRR 187658-17, 18, 30; SRR 187660-48, 49, 50, 51, 52, 53, 78, 79; SRR 187661-38, 42, 53, 77, 78; SRR 18766253; SRR 18766342; SRR 18766835; 187671-10, 26, 27, 29, 30, 31, 43, 44, 45, 68, 69; SRR 18767556; SRR 187775-52, 63; SRR 18778030; SRR 187880-03, 04, 05, 06; SRR 187882-04, 05, 06, 07, 08, 09, 10, 98; SRR 187883-00, 01, 34, 36, 46, 47, 54, 56, 75, 76, 80, 81, 94, 95, 97; SRR 187885-64, 65, 66, 67, 68, 69, 84, 86, 90; SRR 187886-18, 21, 25; SRR 187887-83, 84, 87.
Acknowledgments
The authors are grateful to Shanghao Li and Kuanglin Shi for their assistance with fieldwork and fish collection.
Conflicts of Interest
The authors declare that they have no known any commercial or financial relationships that could be appeared as a potential conflict of interest.
References
- Li, X.; Yang, J.; Zhu, S.; Li, Y.; Chen, W.; Hu, Z. Insight into the combinatorial transcriptional regulation on α-amylase gene in animal groups with different dietary nutrient content. Genomics 2020, 112, 520–527. [Google Scholar] [CrossRef] [PubMed]
- Kreiling, A.-K.; O’Gorman, E.J.; Pálsson, S.; Benhaïm, D.; Leblanc, C.A.; Ólafsson, J.S.; Kristjánsson, B.K. Seasonal variation in the invertebrate community and diet of a top fish predator in a thermally stable spring. Hydrobiologia 2021, 848, 531–545. [Google Scholar]
- Behrens, M.D.; Lafferty, K.D. Temperature and diet effects on omnivorous fish performance: Implications for the latitudinal diversity gradient in herbivorous fishes. Can. J. Fish. Aquat. Sci. 2007, 64, 867–873. [Google Scholar] [CrossRef]
- Reebs, S.G. Plasticity of diel and circadian activity rhythms in fishes. Rev. Fish Biol. Fish. 2002, 12, 349–371. [Google Scholar] [CrossRef]
- Xia, Y.; Li, Y.; Zhu, S.; Li, J.; Li, S.; Li, X. Individual dietary specialization reduces intraspecific competition, rather than feeding activity, in black amur bream (Megalobrama terminalis). Sci. Rep. 2020, 10, 17961. [Google Scholar] [CrossRef] [PubMed]
- Wang, S.; Tang, J.-P.; Su, L.-H.; Fan, J.-J.; Chang, H.-Y.; Wang, T.-T.; Wang, L.; Lin, H.-J.; Yang, Y. Fish feeding groups, food selectivity, and diet shifts associated with environmental factors and prey availability along a large subtropical river, China. Aquat. Sci. 2019, 81, 31. [Google Scholar] [CrossRef]
- Xia, Y.; Li, J.; Li, Y.; Zhu, S.; Huang, Y.; Wu, Z.; Liu, Q.; Li, X. Small-subunit ribosomal DNA sequencing analysis of dietary shifts during gonad maturation in wild black Amur bream (Megalobrama terminalis) in the lower reaches of the Pearl River. Fish. Sci. 2017, 83, 955–965. [Google Scholar]
- Barros, A.; Hobbs, J.A.; Willmes, M.; Parker, C.M.; Bisson, M.; Fangue, N.A.; Rypel, A.L.; Lewis, L.S. Spatial heterogeneity in prey availability, feeding success, and dietary selectivity for the threatened longfin smelt. Estuaries. Coast. 2022, 45, 1766–1779. [Google Scholar]
- MacArthur, R.H.; Pianka, E.R. On optimal use of a patchy environment. Am. Nat. 1966, 100, 603–609. [Google Scholar] [CrossRef]
- Deagle, B.E.; Thomas, A.C.; Shaffer, A.K.; Trites, A.W.; Jarman, S.N. Quantifying sequence proportions in a DNA-based diet study using Ion Torrent amplicon sequencing: Which counts count? Mol. Ecol. Resour. 2013, 13, 620–633. [Google Scholar] [CrossRef] [PubMed]
- Ghanbari, M.; Kneifel, W.; Domig, K.J. A new view of the fish gut microbiome: Advances from next-generation sequencing. Aquaculture 2015, 448, 464–475. [Google Scholar] [CrossRef]
- Alberdi, A.; Aizpurua, O.; Bohmann, K.; Gopalakrishnan, S.; Lynggaard, C.; Nielsen, M.; Gilbert, M.T.P. Promises and pitfalls of using high-throughput sequencing for diet analysis. Mol. Ecol. Resour. 2019, 19, 327–348. [Google Scholar] [CrossRef] [PubMed]
- Hebert, P.D.; Cywinska, A.; Ball, S.L.; DeWaard, J.R. Biological identifications through DNA barcodes. P. Roy Soc. B-Biol. Sci. 2003, 270, 313–321. [Google Scholar] [CrossRef] [PubMed]
- Schoch, C.L.; Seifert, K.A.; Huhndorf, S.; Robert, V.; Spouge, J.L.; Levesque, C.A.; Chen, W.; Consortium, F.B.; List, F.B.C.A.; Bolchacova, E. Nuclear ribosomal internal transcribed spacer (ITS) region as a universal DNA barcode marker for Fungi. Procl. Nat. Acad. Sci. USA 2012, 109, 6241–6246. [Google Scholar] [CrossRef]
- Větrovský, T.; Baldrian, P. The variability of the 16S rRNA gene in bacterial genomes and its consequences for bacterial community analyses. PLoS ONE 2013, 8, e57923. [Google Scholar] [CrossRef] [PubMed]
- Moon-van der Staay, S.Y.; De Wachter, R.; Vaulot, D. Oceanic 18S rDNA sequences from picoplankton reveal unsuspected eukaryotic diversity. Nature 2001, 409, 607–610. [Google Scholar] [CrossRef]
- Tanabe, A.S.; Nagai, S.; Hida, K.; Yasuike, M.; Fujiwara, A.; Nakamura, Y.; Takano, Y.; Katakura, S. Comparative study of the validity of three regions of the 18S-rRNA gene for massively parallel sequencing-based monitoring of the planktonic eukaryote community. Mol. Ecol. Resour. 2016, 16, 402–414. [Google Scholar] [CrossRef] [PubMed]
- Decelle, J.; Romac, S.; Sasaki, E.; Not, F.; Mahe, F. Intracellular diversity of the V4 and V9 regions of the 18S rRNA in marine protists (radiolarians) assessed by high-throughput sequencing. PLoS ONE 2014, 9, e104297. [Google Scholar]
- Choi, J.; Park, J.S. Comparative analyses of the V4 and V9 regions of 18S rDNA for the extant eukaryotic community using the Illumina platform. Sci. Rep. 2020, 10, 6519. [Google Scholar] [CrossRef] [PubMed]
- Stoeck, T.; Bass, D.; Nebel, M.; Christen, R.; Jones, M.D.M.; Breiner, H.-W.; Richards, T.A. Multiple marker parallel tag environmental DNA sequencing reveals a highly complex eukaryotic community in marine anoxic water. Mol. Ecol. 2010, 19, 21–31. [Google Scholar] [CrossRef]
- Hu, S.K.; Liu, Z.; Lie, A.A.Y.; Countway, P.D.; Kim, D.Y.; Jones, A.C.; Gast, R.J.; Cary, S.C.; Sherr, E.B.; Sherr, B.F.; et al. Estimating protistan diversity using high-throughput sequencing. J. Eukaryot. Microbiol. 2015, 62, 688–693. [Google Scholar] [CrossRef]
- Luddington, I.A.; Kaczmarska, I.; Lovejoy, C. Distance and character-based evaluation of the V4 region of the 18S rRNA gene for the identification of diatoms (Bacillariophyceae). PLoS ONE 2012, 7, e45664. [Google Scholar] [CrossRef]
- Kuo, J.; Chen, C.-Y.; Han, C.-C.; Ju, Y.-M.; Tew, K.S. Analyses of diet preference of larval orange-spotted grouper (Epinephelus coioides) grown under inorganic fertilization method using next-generation sequencing. Aquaculture 2021, 531, 735916. [Google Scholar] [CrossRef]
- Zhang, H.; Xu, Q.; Zhao, Y.; Yang, H. Sea cucumber (Apostichopus japonicus) eukaryotic food source composition determined by 18s rDNA barcoding. Mar. Biol. 2016, 163, 153. [Google Scholar] [CrossRef]
- Zhang, Y.; Huang, D.; Li, X.; Liu, Q.; Li, J.; Li, Y.; Yang, J.; Zhu, S. Fish community structure and environmental effects of West River. South China Fish. Sci. 2020, 16, 42–52. [Google Scholar]
- Xie, P.; Liu, J. Practical success of biomanipulation using filter-feeding fish to control cyanobacteria clooms: A synthesis of decades of research and application in a subtropical hypereutrophic Lake. Sci. World J. 2001, 1, 337–356. [Google Scholar] [CrossRef]
- Shen, R.; Gu, X.; Chen, H.; Mao, Z.; Zeng, Q.; Jeppesen, E. Silver carp (Hypophthalmichthys molitrix) stocking promotes phytoplankton growth by suppression of zooplankton rather than through nutrient recycling: An outdoor mesocosm study. Freshw. Biol. 2021, 66, 1074–1088. [Google Scholar] [CrossRef]
- Radke, R.J.; Kahl, U. Effects of a filter-feeding fish [silver carp, Hypophthalmichthys molitrix (Val.)] on phyto- and zooplankton in a mesotrophic reservoir: Results from an enclosure experiment. Freshw. Biol. 2002, 47, 2337–2344. [Google Scholar] [CrossRef]
- Liu, Z.; Hu, J.; Zhong, P.; Zhang, X.; Ning, J.; Larsen, S.E.; Chen, D.; Gao, Y.; He, H.; Jeppesen, E. Successful restoration of a tropical shallow eutrophic lake: Strong bottom-up but weak top-down effects recorded. Water Res. 2018, 146, 88–97. [Google Scholar] [CrossRef] [PubMed]
- DeBoer, J.A.; Anderson, A.M.; Casper, A.F. Multi-trophic response to invasive silver carp (Hypophthalmichthys molitrix) in a large floodplain river. Freshw. Biol. 2018, 63, 597–611. [Google Scholar] [CrossRef]
- Domaizon, I.; Dévaux, J. Impact of moderate silver carp biomass gradient on zooplankton communities in a eutrophic reservoir. Consequences for the use of silver carp in biomanipulation. C. R. Acad. Sci. Ser.-III–Sci. Vie 1999, 322, 621–628. [Google Scholar] [CrossRef]
- Peng, G.; Zhou, X.; Xie, B.; Huang, C.; Uddin, M.M.; Chen, X.; Huang, L. Ecosystem stability and water quality improvement in a eutrophic shallow lake via long-term integrated biomanipulation in Southeast China. Ecol. Eng. 2021, 159, 106119. [Google Scholar] [CrossRef]
- Editorial Committee of Encyclopedia of Rivers and Lakes in China. Section of Zhujiang River basin. In Encyclopedia of Rivers and Lakes in China; China Water & Power Press: Beijing, China, 2013; pp. 1–6. [Google Scholar]
- Cheng, F.; Li, W.; Castello, L.; Murphy, B.R.; Xie, S. Potential effects of dam cascade on fish: Lessons from the Yangtze River. Rev. Fish Biol. Fish. 2015, 25, 569–585. [Google Scholar] [CrossRef]
- Liu, Q.; Lai, Z.; Wang, C.; Ni, J.; Gao, Y. Seasonal variation significantly affected bacterioplankton and eukaryoplankton community composition in Xijiang River, China. Environ. Monit. Assess. 2022, 194, 55. [Google Scholar] [CrossRef] [PubMed]
- Shuai, F.; Li, X.; Huang, Y.; Liu, Y. Resource status and spatial distribution characteristics of four major Chinese carps in the Pearl River. Acta Hydrobiol. Sin. 2017, 41, 1–9. [Google Scholar]
- The State Environment Protection Administration. Water and Wastewater Monitoring and Analysis Method, 4th ed.; China Environmental Science Press: Beijing, China, 2002. [Google Scholar]
- Barbour, A.B.; Montgomery, M.L.; Adamson, A.A.; Díaz-Ferguson, E.; Silliman, B.R. Mangrove use by the invasive lionfish Pterois volitans. Mar. Ecol. Prog. Ser. 2010, 401, 291–294. [Google Scholar] [CrossRef]
- Cheung, M.K.; Au, C.H.; Chu, K.H.; Kwan, H.S.; Wong, C.K. Composition and genetic diversity of picoeukaryotes in subtropical coastal waters as revealed by 454 pyrosequencing. ISME J. 2010, 4, 1053–1059. [Google Scholar] [CrossRef] [PubMed]
- Edgar, R.C. UPARSE: Highly accurate OTU sequences from microbial amplicon reads. Nat. Methods 2013, 10, 996–998. [Google Scholar] [CrossRef] [PubMed]
- Wang, Q.; Garrity, G.M.; Tiedje, J.M.; Cole, J.R. Naive Bayesian classifier for rapid assignment of rRNA sequences into the new bacterial taxonomy. Appl. Environ. Microbiol. 2007, 73, 5261–5267. [Google Scholar] [CrossRef]
- Quast, C.; Pruesse, E.; Yilmaz, P.; Gerken, J.; Schweer, T.; Yarza, P.; Peplies, J.; Glöckner, F.O. The SILVA ribosomal RNA gene database project: Improved data processing and web-based tools. Nucleic Acids Res. 2012, 41, D590–D596. [Google Scholar] [CrossRef] [PubMed]
- R Core Team. R: A Language and Environment for Statistical Computing. 2013. Available online: https://mirrors.tuna.tsinghua.edu.cn/CRAN/ (accessed on 1 July 2021).
- Calenge, C. The package “adehabitat” for the R software: A tool for the analysis of space and habitat use by animals. Ecol. Modell. 2006, 197, 516–519. [Google Scholar] [CrossRef]
- Duncan, E.M.; Arrowsmith, J.A.; Bain, C.E.; Bowdery, H.; Broderick, A.C.; Chalmers, T.; Fuller, W.J.; Galloway, T.S.; Lee, J.H.; Lindeque, P.K.; et al. Diet-related selectivity of macroplastic ingestion in green turtles (Chelonia mydas) in the eastern Mediterranean. Sci. Rep. 2019, 9, 11581. [Google Scholar] [CrossRef]
- Wang, C.; Lai, Z.; Li, X.; Gao, Y.; Li, Y.; Yu, Y. Annual variation pattern of phytoplankton community at the downstream of Xijiang River. Acta Ecol. Sin. 2013, 33, 4398–4408. [Google Scholar] [CrossRef][Green Version]
- Bahnwart, M.; HÜbener, T.; Schubert, H. Downstream changes in phytoplankton composition and biomass in a lowland river-lake system (Warnow River, Germany). Hydrobiologia 1999, 391, 99–111. [Google Scholar] [CrossRef]
- Tragin, M.; Zingone, A.; Vaulot, D. Comparison of coastal phytoplankton composition estimated from the V4 and V9 regions of the 18S rRNA gene with a focus on photosynthetic groups and especially Chlorophyta. Environ. Microbiol. 2018, 20, 506–520. [Google Scholar] [CrossRef] [PubMed]
- Banerji, A.; Bagley, M.; Elk, M.; Pilgrim, E.; Martinson, J.; Santo Domingo, J. Spatial and temporal dynamics of a freshwater eukaryotic plankton community revealed via 18S rRNA gene metabarcoding. Hydrobiologia 2018, 818, 71–86. [Google Scholar] [CrossRef] [PubMed]
- Tumolo, B.B.; Flinn, M.B. Diet of invasive silver carp (Hypophthalmichthys molitrix) in a mainstem reservoir ecosystem. J. Ky. Acad. Sci. 2019, 79, 3–11. [Google Scholar]
- Ochs, C.A.; Pongruktham, O.; Killgore, K.J.; Hoover, J.J. Phytoplankton prey selection by Hypophthalmichthys molitrix val. (silver carp) in a lower Mississippi river backwater lake. Southeast. Nat. 2019, 18, 113–129. [Google Scholar] [CrossRef]
- Zhao, S.; Sun, Y.; Lin, Q.; Han, B. Effects of silver carp (Hypophthalmichthys molitrix) and nutrients on the plankton community of a deep, tropical reservoir: An enclosure experiment. Freshw. Biol. 2013, 58, 100–113. [Google Scholar] [CrossRef]
- Wang, L.; Liu, P.; Sun, J.; Zhang, Y.; Zhou, Q.; Wu, Z.; He, F. Comparison and combination of selective grazing on natural seston by benthic bivalves (Hyriopsis cumingii) and pelagic fish (Hypophthalmichthys molitrix). Environ. Sci. Pollut. Res. 2018, 25, 33423–33431. [Google Scholar] [CrossRef] [PubMed]
- Zhang, X.; Xie, P.; Huang, X. A review of nontraditional biomanipulation. Sci. World J. 2008, 8, 362037. [Google Scholar] [CrossRef]
- Ma, H.; Cui, F.; Liu, Z.; Fan, Z.; He, W.; Yin, P. Effect of filter-feeding fish silver carp on phytoplankton species and size distribution in surface water: A field study in water works. J. Environ. Sci. 2010, 22, 161–167. [Google Scholar] [CrossRef]
- Vörös, L.; Oldal, I.; Présing, M.; V-Balogh, K. Size-selective filtration and taxon-specific digestion of plankton algae by silver carp (Hypophthalmichthys molitrix Val.). In Shallow Lakes’ 95; Springer: Dordrecht, The Netherlands, 1997; pp. 223–228. [Google Scholar]
- Gning, N.; Vidy, G.; Thiaw, O.T. Feeding ecology and ontogenic diet shifts of juvenile fish species in an inverse estuary: The Sine-Saloum, Senegal. Estuar. Coast. Shelf Sci. 2008, 76, 395–403. [Google Scholar] [CrossRef]
- Latli, A.; Michel, L.N.; Lepoint, G.; Kestemont, P. River habitat homogenisation enhances trophic competition and promotes individual specialisation among young of the year fish. Freshw. Biol. 2019, 64, 520–531. [Google Scholar] [CrossRef]
- Song, Y.; Cheng, F.; Murphy, B.R.; Xie, S. Downstream effects of the Three Gorges Dam on larval dispersal, spatial distribution, and growth of the four major Chinese carps call for reprioritizing conservation measures. Can. J. Fish. Aquat. Sci. 2018, 75, 141–151. [Google Scholar] [CrossRef]
- Huang, K.; Qin, J. Research on designed lowest navigable water level at downstream of the third and fourth ship locks of Changzhou hydro-complex. HongShui River 2012, 31, 31–35. [Google Scholar]


Publisher’s Note: MDPI stays neutral with regard to jurisdictional claims in published maps and institutional affiliations. |
© 2022 by the authors. Licensee MDPI, Basel, Switzerland. This article is an open access article distributed under the terms and conditions of the Creative Commons Attribution (CC BY) license (https://creativecommons.org/licenses/by/4.0/).