


Adopting Electric Motorcycles for Ride-Hailing Services: Influential Factors from Driver’s Perspective


Abstract
1. Introduction
2. Literature Review
3. Methods
3.1. D-Efficiency
3.2. Ordered Logit Model
4. Survey Design and Data Collection
4.1. Questionnaire Design
4.2. Data Collection
5. Results and Discussion
5.1. Data Sample
5.2. Model Results
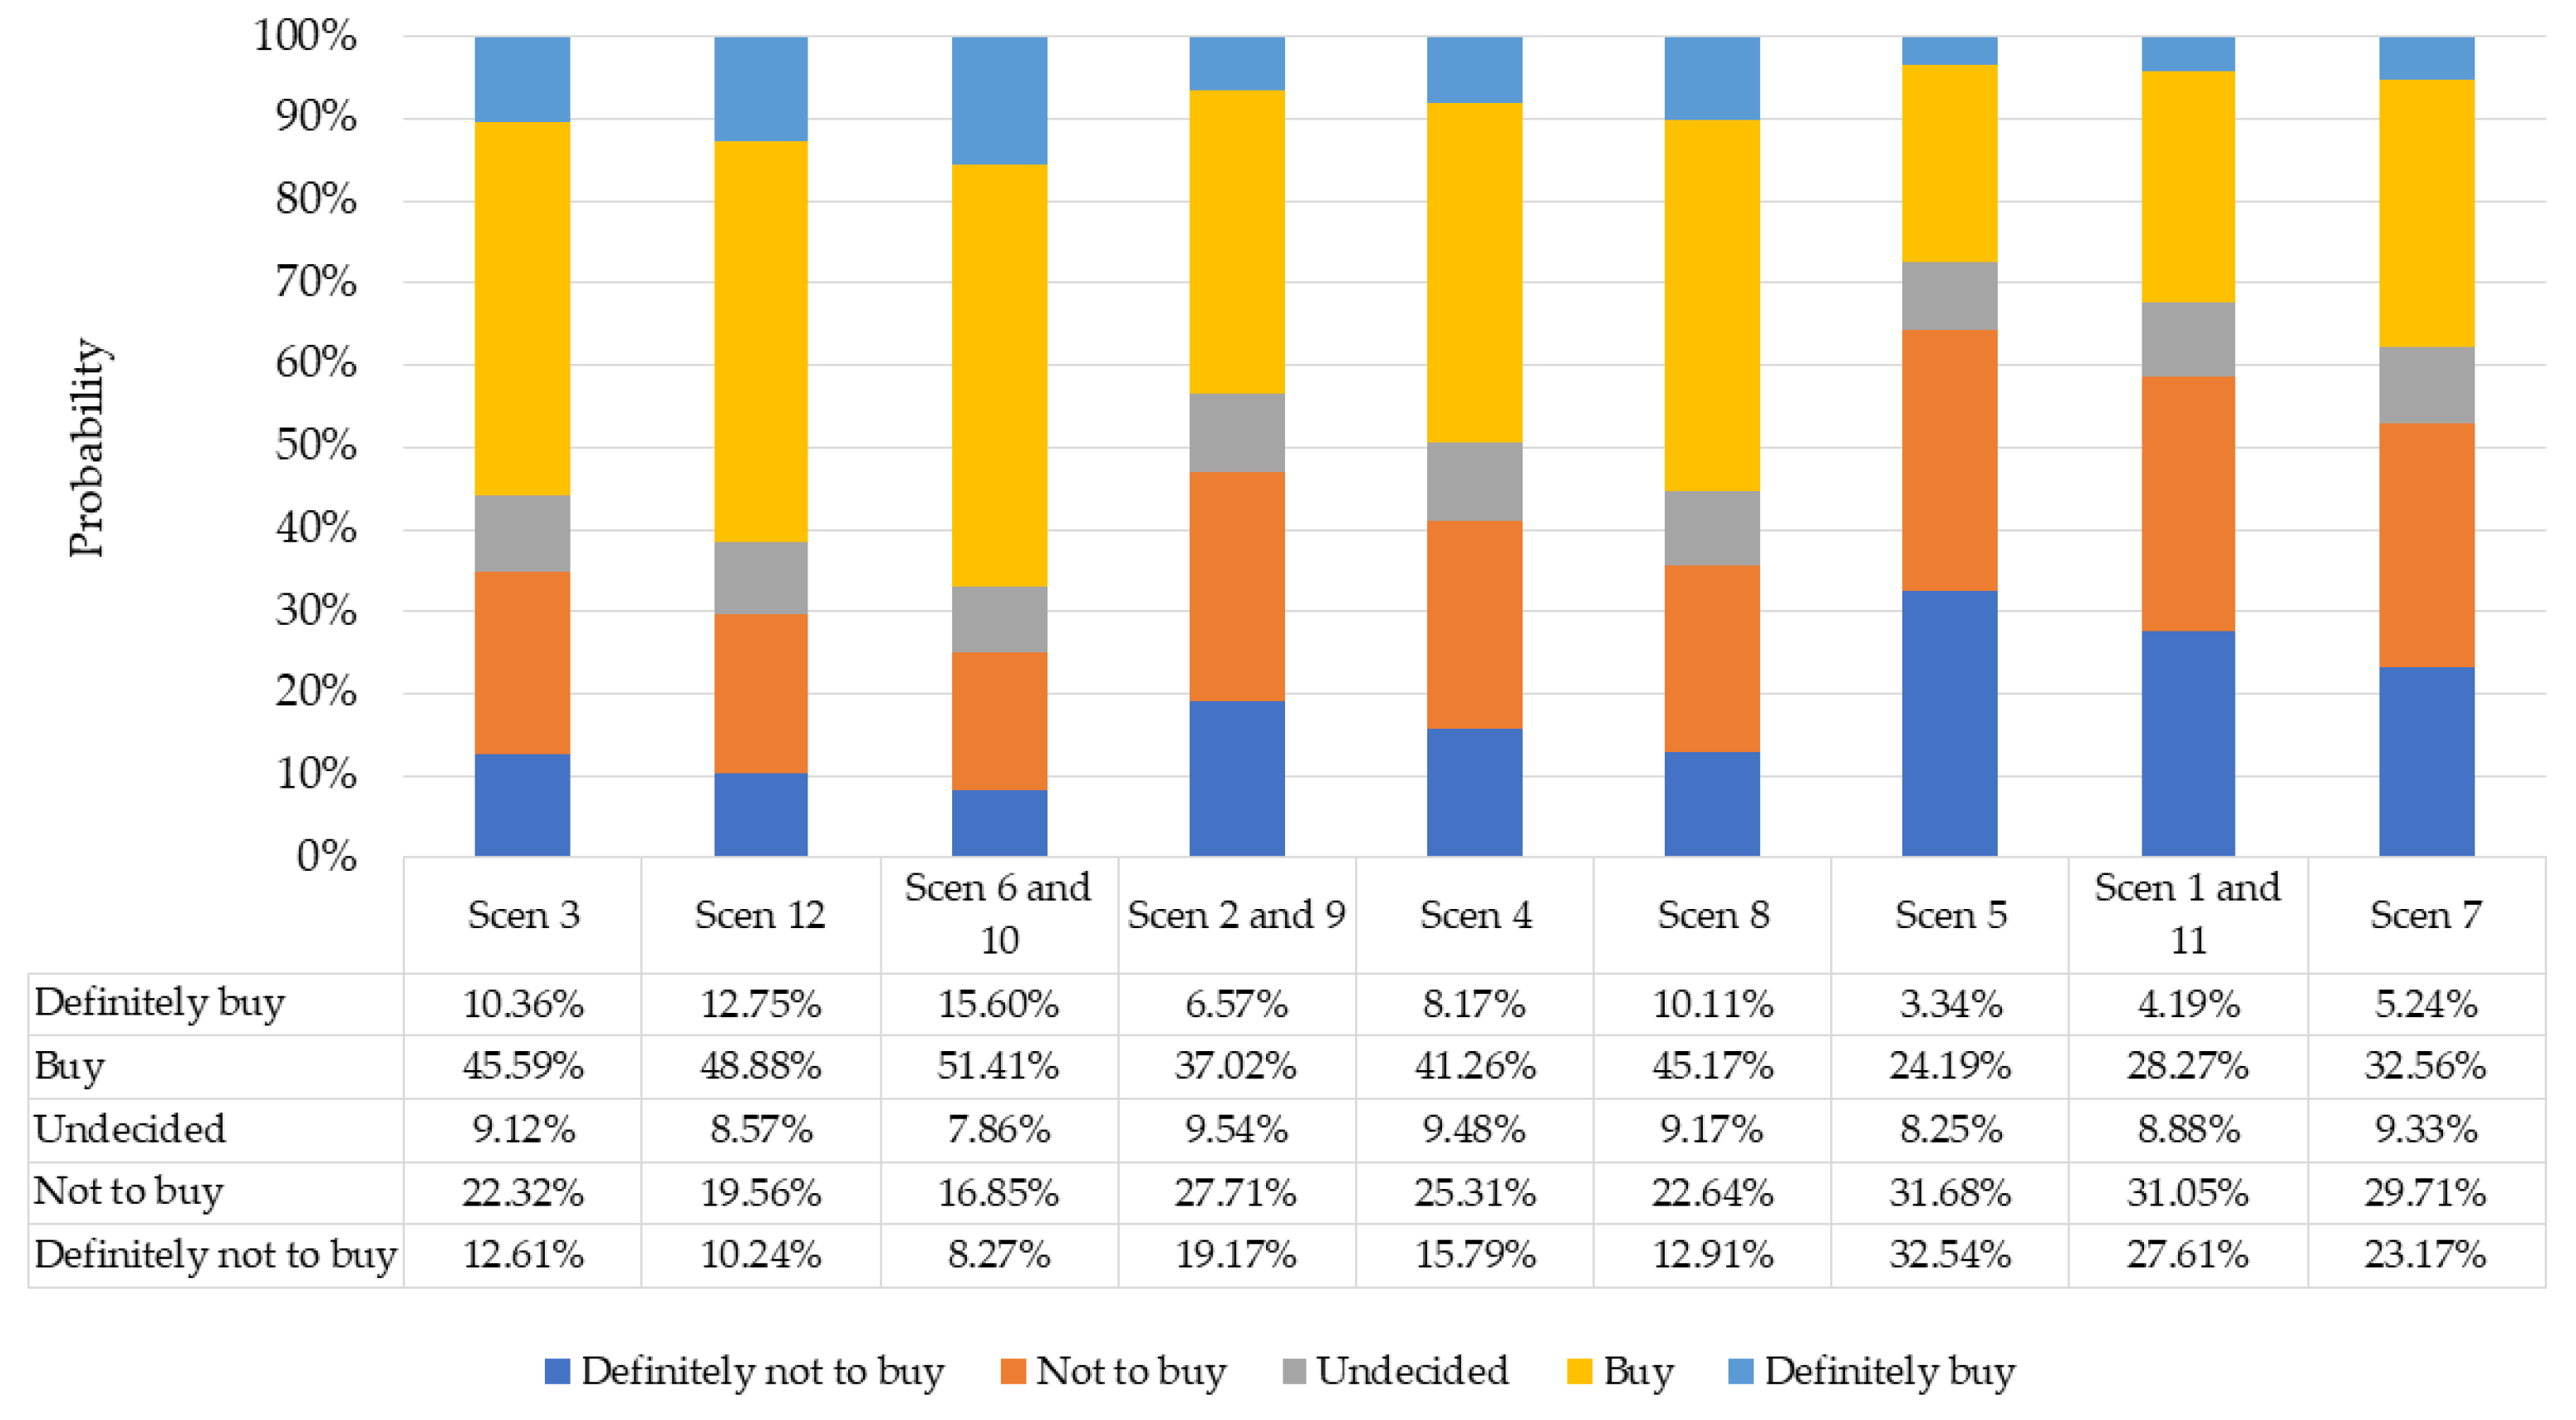
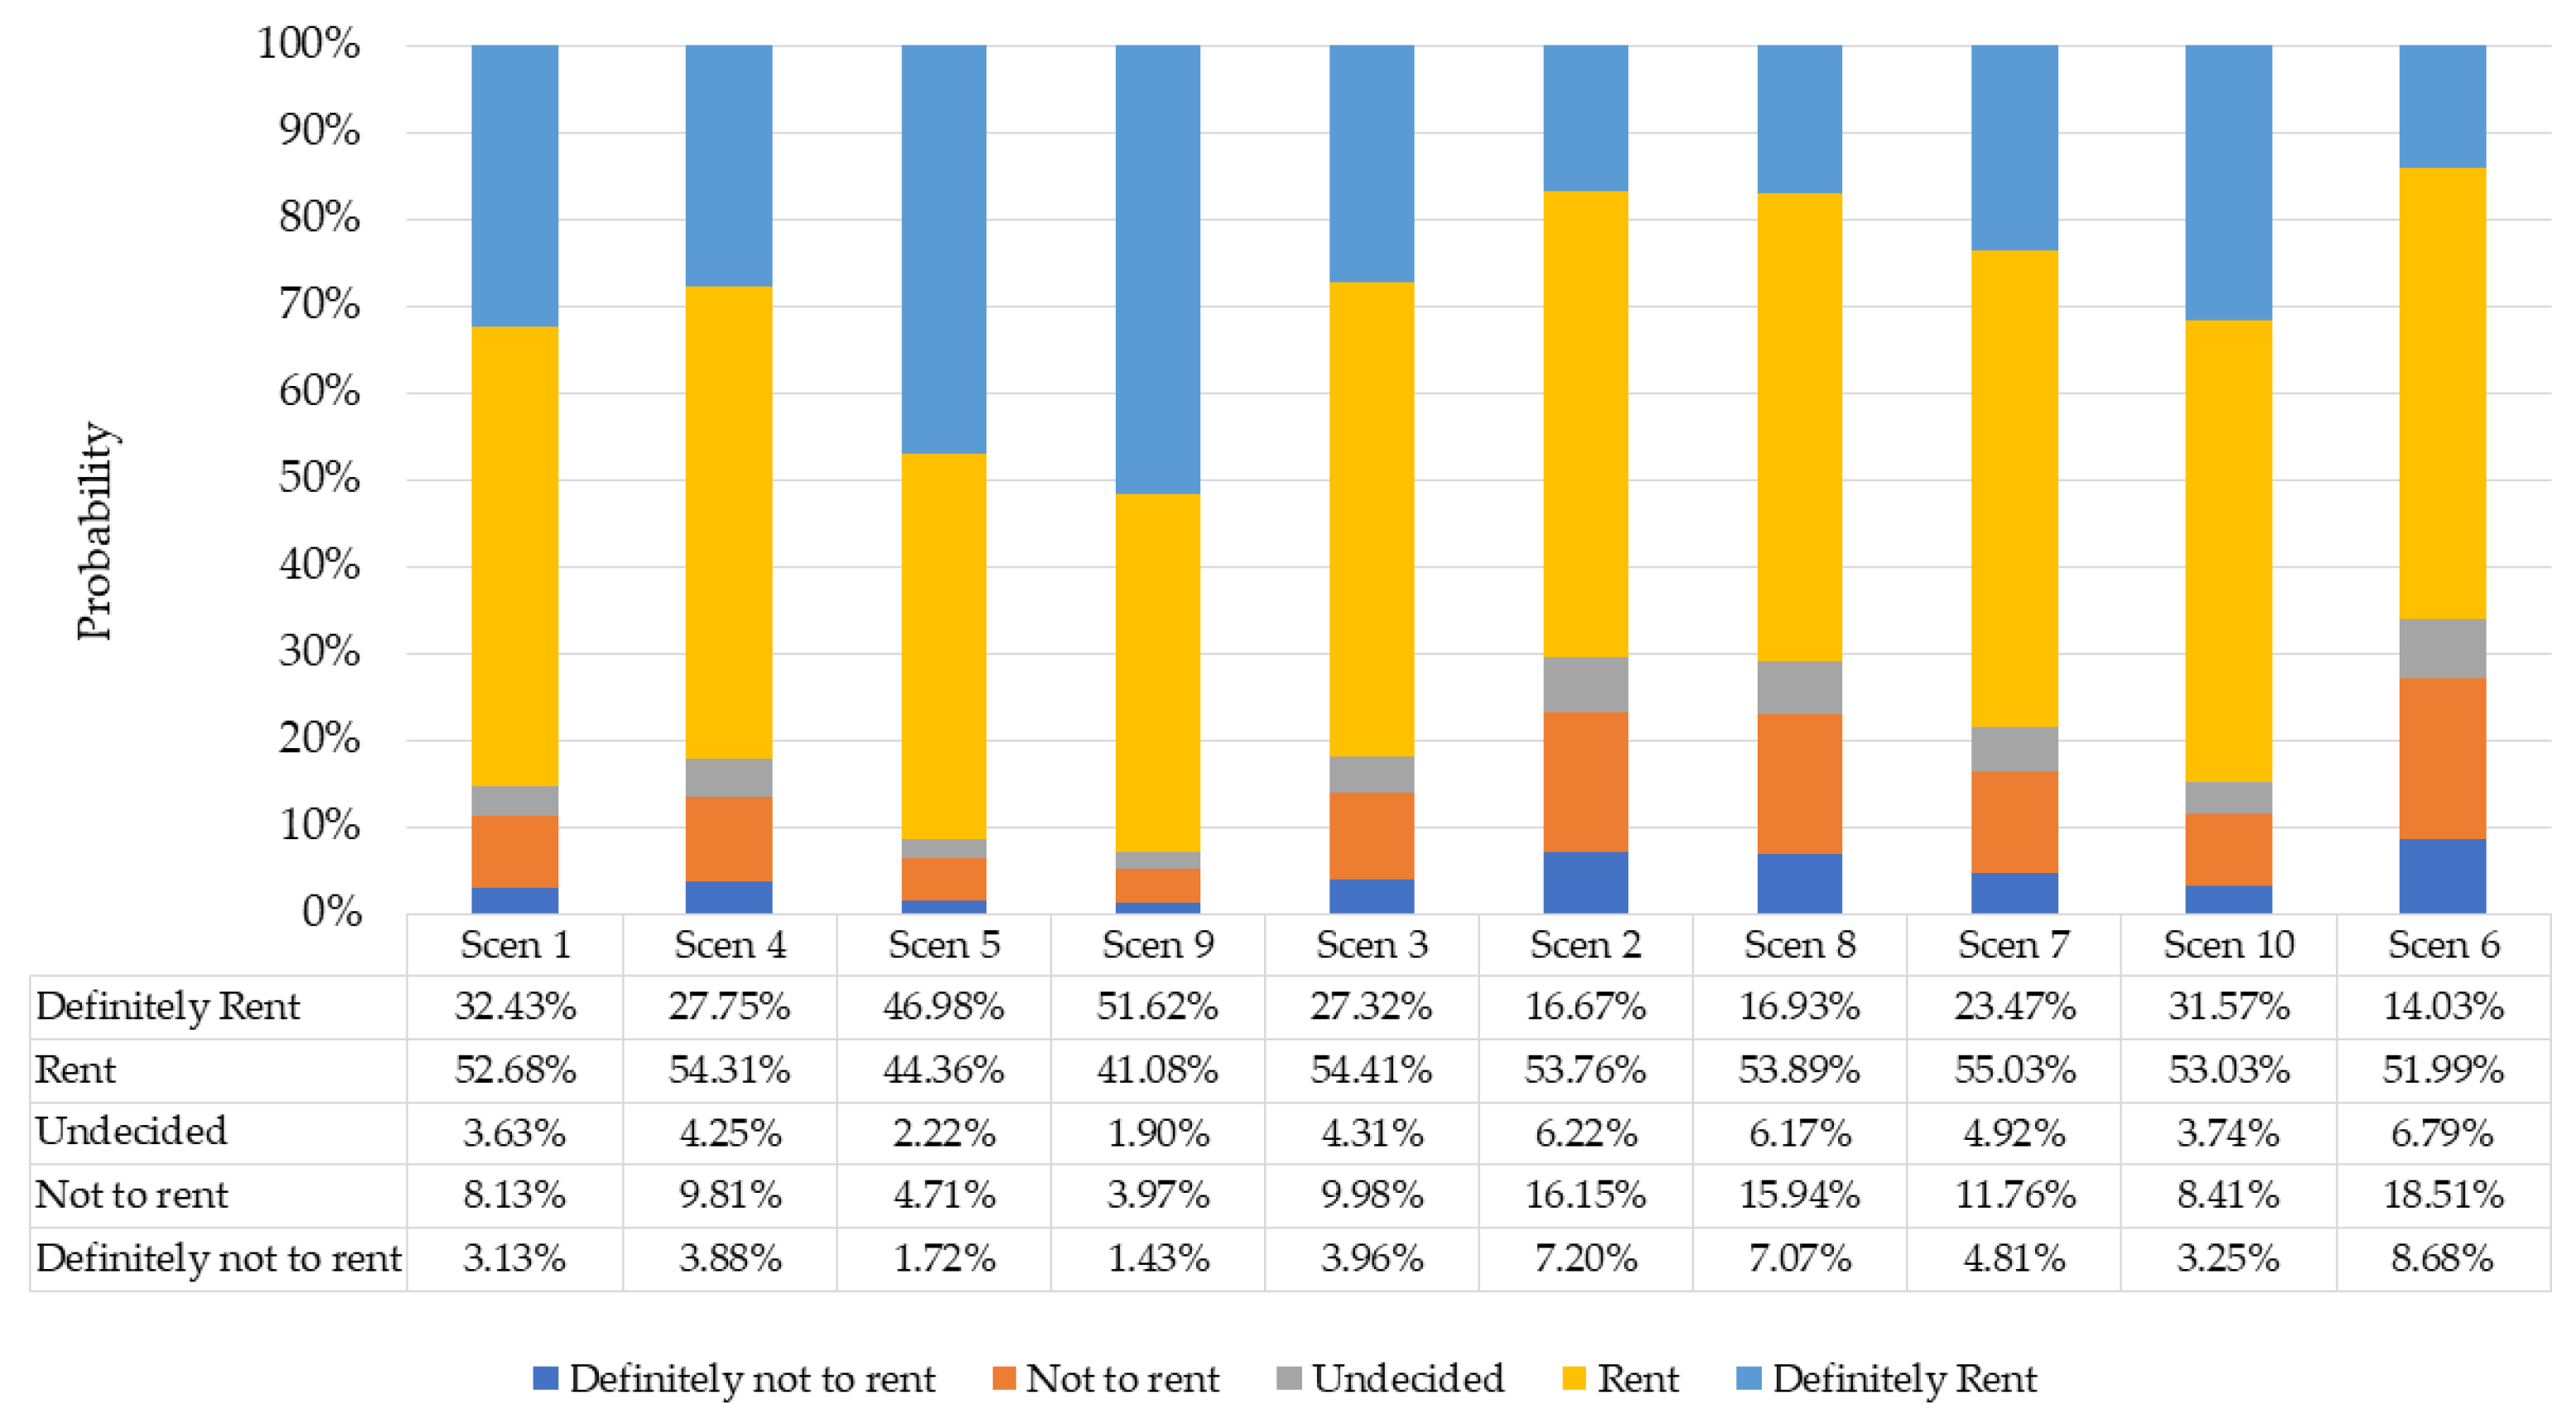
5.3. Probability of Electric Motorcycle Adoption
6. Conclusions and Recommendations
Author Contributions
Funding
Institutional Review Board Statement
Informed Consent Statement
Data Availability Statement
Conflicts of Interest
References
- Tamakloe, R.; Das, S.; Nimako Aidoo, E.; Park, D. Factors affecting motorcycle crash casualty severity at signalized and non-signalized intersections in Ghana: Insights from a data mining and binary logit regression approach. Accid. Anal. Prev. 2022, 165, 106517. [Google Scholar] [CrossRef] [PubMed]
- Woratanarat, P.; Ingsathit, A.; Chatchaipan, P.; Suriyawongpaisal, P. Safety riding program and motorcycle-related injuries in Thailand. Accid. Anal. Prev. 2013, 58, 115–121. [Google Scholar] [CrossRef] [PubMed]
- Wu, C.Y.H.; Loo, B.P.Y. Motorcycle safety among motorcycle taxi drivers and nonoccupational motorcyclists in developing countries: A case study of Maoming, South China. Traffic Inj. Prev. 2016, 17, 170–175. [Google Scholar] [CrossRef] [PubMed]
- Fan, H.S.L. Passenger car equivalents for vehicles on Singapore expressways. Transp. Res. Part A 1990, 24, 391–396. [Google Scholar] [CrossRef]
- Yeung, J.S.; Wong, Y.D.; Secadiningrat, J.R. Lane-harmonised passenger car equivalents for heterogeneous expressway traffic. Transp. Res. Part A 2015, 78, 361–370. [Google Scholar] [CrossRef]
- Adnan, M. Passenger Car Equivalent Factors in Heterogenous Traffic Environment-are We Using the Right Numbers? Procedia Eng. 2014, 77, 106–113. [Google Scholar] [CrossRef]
- Ramlan, R.; Irawan, M.Z.; Munawar, A. Behavioral factors of motorcyclists in right-turn movements at unsignalized intersections: An insight from Yogyakarta, Indonesia. IATSS Res. 2021, 45, 116–122. [Google Scholar] [CrossRef]
- Guerra, E. Electric vehicles, air pollution, and the motorcycle city: A stated preference survey of consumers’ willingness to adopt electric motorcycles in Solo, Indonesia. Transp. Res. Part D 2019, 68, 52–64. [Google Scholar] [CrossRef]
- Irawan, M.Z. A joint choice decision model of intra-household interaction-based motorcycle mode and departure time in Yogyakarta, Indonesia. IOP Conf. Ser. Mater. Sci. Eng. 2019, 650, 012042. [Google Scholar] [CrossRef]
- Law, T.H.; Hamid, H.; Goh, C.N. The motorcycle to passenger car ownership ratio and economic growth: A cross-country analysis. J. Transp. Geogr. J. 2015, 46, 122–128. [Google Scholar] [CrossRef]
- Irawan, M.Z.; Bastarianto, F.F.; Dewanti; Sugiarto, S.; Amrozi, M.R.F. Measuring the perceived need for motorcycle-based ride-hailing services on trip characteristics among university students in Yogyakarta, Indonesia. Travel Behav. Soc. 2021, 24, 303–312. [Google Scholar] [CrossRef]
- Irawan, M.Z.; Belgiawan, P.F. Ride-hailing app use for same-day delivery services of foods and groceries during the implementation of social activity restrictions in Indonesia. Int. J. Transp. Sci. Technol. 2022; In Press. [Google Scholar]
- Rizki, M.; Syahputri, J.; Belgiawan, P.F.; Irawan, M.Z. Electrifying Tourist Mobility in Bali, Indonesia: Setting the Target and Estimating the CO2 Reduction Based on Stated Choice Experiment. Sustainability 2021, 13, 11656. [Google Scholar] [CrossRef]
- Hijauku Kendaraan Listrik Indonesia: Potensi Besar, Pasar Kurang. Available online: https://hijauku.com/2021/02/05/kendaraan-listrik-indonesia-potensi-besar-pasar-kurang/ (accessed on 15 August 2022).
- Irawan, M.Z.; Rizki, M.; Chalermpong, S.; Kato, H. Mapping the motorcycle-based ride-hailing users in Yogyakarta: An analysis of socio-economic factors and preferences. Asian Transp. Stud. 2022, 8, 100073. [Google Scholar] [CrossRef]
- Grab Indonesia Ayo Bergabung Menjadi Mitra Grab Electric Sebagai Pekerjaan Sampingan Mahasiswa. Available online: https://www.grab.com/id/en/blog/driver/grab-indonesia-ayo-bergabung-menjadi-mitra-grab-electric-sebagai-pekerjaan-sampingan-mahasiswa/ (accessed on 15 August 2022).
- Wu, Y.-C.; Kontou, E. Designing electric vehicle incentives to meet emission reduction targets. Transp. Res. Part D Transp. Environ. 2022, 107, 103320. [Google Scholar] [CrossRef]
- Hoen, A.; Koetse, M.J. A choice experiment on alternative fuel vehicle preferences of private car owners in the Netherlands. Transp. Res. Part A Policy Pract. 2014, 61, 199–215. [Google Scholar] [CrossRef]
- Mersky, A.C.; Sprei, F.; Samaras, C.; Qian, Z.S. Effectiveness of incentives on electric vehicle adoption in Norway. Transp. Res. Part D Transp. Environ. 2016, 46, 56–68. [Google Scholar] [CrossRef]
- Pierre, M.; Jemelin, C.; Louvet, N. Driving an electric vehicle. A sociological analysis on pioneer users. Energy Effic. 2011, 4, 511–522. [Google Scholar] [CrossRef]
- Egbue, O.; Long, S. Barriers to widespread adoption of electric vehicles: An analysis of consumer attitudes and perceptions. Energy Policy 2012, 48, 717–729. [Google Scholar] [CrossRef]
- Bjerkan, K.Y.; Nørbech, T.E.; Nordtømme, M.E. Incentives for promoting Battery Electric Vehicle (BEV) adoption in Norway. Transp. Res. Part D Transp. Environ. 2016, 43, 169–180. [Google Scholar] [CrossRef]
- Wang, N.; Tang, L.; Pan, H. Effectiveness of policy incentives on electric vehicle acceptance in China: A discrete choice analysis. Transp. Res. Part A Policy Pract. 2017, 105, 210–218. [Google Scholar] [CrossRef]
- Li, W.; Long, R.; Chen, H. Consumers’ evaluation of national new energy vehicle policy in China: An analysis based on a four paradigm model. Energy Policy 2016, 99, 33–41. [Google Scholar] [CrossRef]
- Hensher, D.A.; Nelson, J.D.; Mulley, C. Electric car sharing as a service (ECSaaS)–Acknowledging the role of the car in the public mobility ecosystem and what it might mean for MaaS as eMaaS? Transp. Policy 2022, 116, 212–216. [Google Scholar] [CrossRef]
- Rizki, M.; Joewono, T.B.; Belgiawan, P.F.; Irawan, M.Z. The travel behaviour of ride-sourcing users, and their perception of the usefulness of ride-sourcing based on the users’ previous modes of transport: A case study in Bandung City, Indonesia. IATSS Res. 2021, 45, 267–276. [Google Scholar] [CrossRef]
- Chalermpong, S.; Kato, H.; Thaithatkul, P.; Ratanawaraha, A.; Fillone, A.; Hoang-Tung, N.; Jittrapirom, P. Ride-hailing applications in Southeast Asia: A literature review. Int. J. Sustain. Transp. 2022; In Press. [Google Scholar]
- Graehler, M.; Mucci, R.A.; Erhardt, G.D. Understanding the Recent Transit Ridership Decline in Major US Cities: Service Cuts or Emerging Modes? In Proceedings of the 98th Annual Meeting of the Transportation Research Board (TRB), Washington, DC, USA, 13–17 January 2019.
- Hall, J.D.; Palsson, C.; Price, J. Is Uber a substitute or complement for public transit? J. Urban Econ. 2018, 108, 36–50. [Google Scholar] [CrossRef]
- Tirachini, A. Ride-hailing, travel behaviour and sustainable mobility. Transportation 2019, 47, 2011–2047. [Google Scholar] [CrossRef]
- Du, M.; Cheng, L.; Li, X.; Yang, J. Acceptance of electric ride-hailing under the new policy in Shenzhen, China: Influence factors from the driver’s perspective. Sustain. Cities Soc. 2020, 61, 102307. [Google Scholar] [CrossRef]
- Bansal, P.; Sinha, A.; Dua, R.; Daziano, R.A. Eliciting preferences of TNC users and drivers: Evidence from the United States. Travel Behav. Soc. 2020, 20, 225–236. [Google Scholar] [CrossRef]
- Jenn, A.; Laberteaux, K.; Clewlow, R. New mobility service users’ perceptions on electric vehicle adoption. Int. J. Sustain. Transp. 2018, 12, 526–540. [Google Scholar] [CrossRef]
- Mendez-Manjon, I.; Plasencia-Lozano, P.; Pantiga-Facal, E. A GIS-Based evaluation of the motorcycle sharing systems in Spain. Transp. Res. Procedia 2021, 58, 487–494. [Google Scholar] [CrossRef]
- Amirnazmiafshar, E.; Diana, M. A review of the socio-demographic characteristics affecting the demand for different car-sharing operational schemes. Transp. Res. Interdiscip. Perspect. 2022, 14, 100616. [Google Scholar] [CrossRef]
- Habla, W.; Huwe, V.; Kesternich, M. Electric and conventional vehicle usage in private and car sharing fleets in Germany. Transp. Res. Part D Transp. Environ. 2021, 93, 102729. [Google Scholar] [CrossRef]
- Gebhardt, L.; Ehrenberger, S.; Wolf, C.; Cyganski, R. Can shared E-scooters reduce CO2 emissions by substituting car trips in Germany? Transp. Res. Part D Transp. Environ. 2022, 109, 103328. [Google Scholar] [CrossRef]
- Sheng, N.; Zhou, X.; Zhou, Y. Environmental impact of electric motorcycles: Evidence from traffic noise assessment by a building-based data mining technique. Sci. Total Environ. 2016, 554, 73–82. [Google Scholar] [CrossRef] [PubMed]
- Inci, E.; Tatar Taspinar, Z.; Ulengin, B. A choice experiment on preferences for electric and hybrid cars in Istanbul. Transp. Res. Part D Transp. Environ. 2022, 107, 103295. [Google Scholar] [CrossRef]
- Buranelli de Oliveira, M.; Moretti Ribeiro da Silva, H.; Jugend, D.; De Camargo Fiorini, P.; Paro, C.E. Factors influencing the intention to use electric cars in Brazil. Transp. Res. Part A Policy Pract. 2022, 155, 418–433. [Google Scholar] [CrossRef]
- Irawan, M.Z.; Belgiawan, P.F.; Widyaparaga, A.; Budiman, A.; Muthohar, I.; Sopha, B.M. Case Studies on Transport Policy A market share analysis for hybrid cars in Indonesia. Case Stud. Transp. Policy 2018, 6, 336–341. [Google Scholar] [CrossRef]
- Jones, L.R.; Cherry, C.R.; Vu, T.A.; Nguyen, Q.N. The effect of incentives and technology on the adoption of electric motorcycles: A stated choice experiment in Vietnam. Transp. Res. Part A 2013, 57, 1–11. [Google Scholar] [CrossRef]
- Zhu, L.; Song, Q.; Sheng, N.; Zhou, X. Exploring the determinants of consumers’ WTB and WTP for electric motorcycles using CVM method in Macau. Energy Policy 2019, 127, 64–72. [Google Scholar] [CrossRef]
- Wu, J.H.; Wu, C.W.; Lee, C.T.; Lee, H.J. Green purchase intentions: An exploratory study of the Taiwanese electric motorcycle market. J. Bus. Res. 2015, 68, 829–833. [Google Scholar] [CrossRef]
- Weinert, J.; Ogden, J.; Sperling, D.; Burke, A. The future of electric two-wheelers and electric vehicles in China. Energy Policy 2008, 36, 2544–2555. [Google Scholar] [CrossRef]
- Scorrano, M.; Danielis, R. The characteristics of the demand for electric scooters in Italy: An exploratory study. Res. Transp. Bus. Manag. 2021, 39, 100589. [Google Scholar] [CrossRef]
- Aguilera-García, Á.; Gomez, J.; Sobrino, N. Exploring the adoption of moped scooter-sharing systems in Spanish urban areas. Cities 2020, 96, 102424. [Google Scholar] [CrossRef]
- Latinopoulos, C.; Patrier, A.; Sivakumar, A. Planning for e-scooter use in metropolitan cities: A case study for Paris. Transp. Res. Part D Transp. Environ. 2021, 100, 103037. [Google Scholar] [CrossRef]
- Alam, M.R.; Guo, Z. Charging infrastructure planning for ride-sourcing electric vehicles considering drivers’ value of time. Transp. Lett. 2022; In Press. [Google Scholar]
- Ke, J.; Cen, X.; Yang, H.; Chen, X.; Ye, J. Modelling drivers’ working and recharging schedules in a ride-sourcing market with electric vehicles and gasoline vehicles. Transp. Res. Part E Logist. Transp. Rev. 2019, 125, 160–180. [Google Scholar] [CrossRef]
- Bliemer, M.C.J.; Rose, J.M. Experimental design influences on stated choice outputs: An empirical study in air travel choice. Transp. Res. Part A Policy Pract. 2011, 45, 63–79. [Google Scholar] [CrossRef]
- Nijs, V. Design of Experiments. Available online: https://radiant-rstats.github.io/docs/design/doe.html (accessed on 9 September 2022).
- Garrow, L.A. Discrete Choice Modelling and Air Travel Demand; Ashgate Publishing Limited: Farnham, UK, 2010. [Google Scholar]
- Chiu, Y.C.; Tzeng, G.H. The market acceptance of electric motorcycles in Taiwan experience through a stated preference analysis. Transp. Res. Part D 1999, 4, 127–146. [Google Scholar] [CrossRef]
- Isaac, S.; Michael, W. Handbook in Research and Evaluation: A Collection of Principles, Methods, and Strategies Useful in the Planning, Design, and Evaluation of Studies in Education and the Behavioral Sciences; EdITS Publishers: London, UK, 1995. [Google Scholar]
- Long, J.S.; Freese, J. Regression Models for Categorical Dependent Variables Using Stata; Stata Press: Lakeway Drive, DC, USA; College Station: Texas, TX, USA, 2006. [Google Scholar]
- Bunch, D.S.; Bradley, M.; Golob, T.F.; Kitamura, R.; Occhiuzzo, G.P. Demand for clean-fuel vehicles in California: A discrete-choice stated preference pilot project. Transp. Res. Part A Policy Pract. 1993, 27, 237–253. [Google Scholar] [CrossRef]
- Calfee, J.E. Estimating the demand for electric automobiles using fully disaggregated probabilistic choice analysis. Transp. Res. Part B Methodol. 1985, 19, 287–301. [Google Scholar] [CrossRef]
- Bansal, P.; Dua, R.; Krueger, R.; Graham, D.J. Fuel economy valuation and preferences of Indian two-wheeler buyers. J. Clean. Prod. 2021, 294, 126328. [Google Scholar] [CrossRef]
- Scorrano, M.; Rotaris, L. The role of environmental awareness and knowledge in the choice of a seated electric scooter. Transp. Res. Part A 2022, 160, 333–347. [Google Scholar] [CrossRef]


| Variable | No. of Level | Description | Purchase Model | Rental Model |
|---|---|---|---|---|
| Purchase price (in million IDR) * | 3 | 18, 25, 35 | √ | |
| Cost for motorcycle title transfer | 2 | Free, Fixed (10%) | √ | |
| Fuel price | 2 | Fixed, Increase 10% | √ | √ |
| Coverage distance (km) | 3 | 50, 100, 150 | √ | √ |
| Maximum speed (km/h) | 3 | 60, 80, 100 | √ | √ |
| Battery exchange station (km) | 2 | <10, ≥10 | √ | √ |
| Annual tax | 2 | No, Yes | √ | |
| Credit payment | 2 | No, Yes | √ | |
| Rental cost (thousand IDR) * | 2 | 40, 60 | √ |
| Scen. | Price (Million IDR) | Cost for Title Transfer | Fuel Price | Distance (km) | Battery Station Loc. (km) | Credit Payment | Speed | Tax |
|---|---|---|---|---|---|---|---|---|
| 1 | 35 | Free | Fixed | 100 | <10 | Yes | 100 | Yes |
| 2 | 25 | Fixed | Fixed | 50 | <10 | No | 100 | No |
| 3 | 18 | Free | Increase | 50 | <10 | No | 60 | Yes |
| 4 | 25 | Free | Fixed | 100 | ≥10 | No | 60 | No |
| 5 | 35 | Fixed | Fixed | 50 | ≥10 | Yes | 60 | No |
| 6 | 18 | Fixed | Fixed | 150 | ≥10 | No | 80 | Yes |
| 7 | 35 | Free | Increase | 150 | <10 | No | 80 | No |
| 8 | 25 | Fixed | Increase | 150 | <10 | Yes | 60 | Yes |
| 9 | 25 | Free | Increase | 50 | ≥10 | Yes | 80 | Yes |
| 10 | 18 | Free | Increase | 150 | ≥10 | Yes | 100 | No |
| 11 | 35 | Fixed | Increase | 100 | ≥10 | No | 100 | Yes |
| 12 | 18 | Fixed | Increase | 100 | <10 | Yes | 80 | No |
| Scen. | Rental Cost (Thousand IDR) | Fuel Price | Distance (km) | Battery Station Loc. (km) | Speed |
|---|---|---|---|---|---|
| 1 | 40 | Fixed | 50 | <10 | 60 |
| 2 | 60 | Fixed | 100 | ≥10 | 60 |
| 3 | 60 | Fixed | 150 | <10 | 100 |
| 4 | 40 | Fixed | 50 | ≥10 | 80 |
| 5 | 40 | Increase | 100 | <10 | 100 |
| 6 | 60 | Increase | 50 | ≥10 | 100 |
| 7 | 60 | Increase | 100 | <10 | 80 |
| 8 | 60 | Increase | 50 | <10 | 60 |
| 9 | 40 | Increase | 150 | ≥10 | 60 |
| 10 | 60 | Increase | 150 | <10 | 80 |
| Variable | n | % | Mean | SD |
|---|---|---|---|---|
| Age | 30.57 | 9.32 | ||
| Gender (male) | 404 | 97.12% | ||
| Education level (bachelor’s degree or higher) | 39 | 9.38% | ||
| Current university students | 82 | 19.71% | ||
| MBRH driver as the primary job | 272 | 65.38% | ||
| Monthly income | ||||
| Less than IDR 1,916,000 | 151 | 36.30% | ||
| Between IDR 1,916,000 and 385,000 | 213 | 51.20% | ||
| Between IDR 3,850,001 and 5,750,000 | 45 | 10.82% | ||
| More than IDR 5,750,000 | 7 | 1.68% |
| Scen. | Definitely Not to Adopt | Not to Adopt | Undecided | Adopt | Definitely to Adopt |
|---|---|---|---|---|---|
| Purchase model | |||||
| 1 | 33.65 | 23.08 | 10.10 | 28.85 | 4.33 |
| 2 | 19.71 | 40.87 | 10.58 | 26.44 | 2.40 |
| 3 | 10.58 | 28.37 | 9.13 | 44.71 | 7.21 |
| 4 | 15.38 | 34.62 | 10.10 | 34.62 | 5.29 |
| 5 | 37.98 | 30.77 | 6.73 | 21.15 | 3.37 |
| 6 | 12.50 | 19.71 | 6.73 | 39.90 | 21.15 |
| 7 | 26.44 | 25.00 | 12.98 | 32.69 | 2.88 |
| 8 | 22.12 | 24.52 | 9.13 | 42.31 | 1.92 |
| 9 | 24.52 | 28.37 | 11.06 | 33.65 | 2.40 |
| 10 | 11.54 | 22.12 | 7.21 | 45.67 | 13.46 |
| 11 | 30.29 | 30.29 | 6.73 | 29.33 | 3.37 |
| 12 | 13.46 | 19.71 | 7.69 | 45.19 | 13.94 |
| Rent model | |||||
| 1 | 20.19 | 22.12 | 7.69 | 43.27 | 6.73 |
| 2 | 25.48 | 38.94 | 7.21 | 25.96 | 2.40 |
| 3 | 16.83 | 27.40 | 7.21 | 41.83 | 6.73 |
| 4 | 17.31 | 33.65 | 5.77 | 39.42 | 3.85 |
| 5 | 10.58 | 18.75 | 5.29 | 38.46 | 26.92 |
| 6 | 34.13 | 27.88 | 12.50 | 24.52 | 0.96 |
| 7 | 24.04 | 24.52 | 10.10 | 40.38 | 0.96 |
| 8 | 29.81 | 33.17 | 6.25 | 29.33 | 1.44 |
| 9 | 9.62 | 17.31 | 5.77 | 49.04 | 18.27 |
| 10 | 18.27 | 29.33 | 5.29 | 38.94 | 8.17 |
| Purchase Model | Rent Model | |||||||
|---|---|---|---|---|---|---|---|---|
| Ordered | Binomial | Ordered | Binomial | |||||
| Coef. | SE | Coef. | SE | Coef. | SE | Coef. | SE | |
| Variable | ||||||||
| Purchase cost | −0.071 | 0.007 *** | −0.058 | 0.008 *** | - | - | ||
| Rental cost | - | - | −0.638 | 0.052 *** | −0.598 | 0.059 *** | ||
| Motorcycle title transfer cost | 0.045 | 0.074 | 0.046 | 0.085 | - | - | - | - |
| Fuel price | 0.012 | 0.084 | 0.064 | 0.096 | 0.279 | 0.087 *** | 0.206 | 0.099 ** |
| Coverage distance | 0.047 | 0.009 *** | 0.049 | 0.010 *** | 0.084 | 0.010 *** | 0.082 | 0.012 *** |
| Battery exchange station | 0.019 | 0.074 | −0.002 | 0.086 | −0.215 | 0.086 ** | −0.301 | 0.100 *** |
| Credit payments | −0.078 | 0.074 | 0.007 | 0.086 | - | - | - | - |
| Maximum speed | 0.015 | 0.022 | 0.006 | 0.026 | 0.023 | 0.025 | 0.005 | 0.029 |
| Annual tax | 0.020 | 0.075 | 0.083 | 0.085 | - | - | - | - |
| Sociodemographic | ||||||||
| Age | −0.003 | 0.004 | 0.003 | 0.005 | −0.022 | 0.005 *** | −0.019 | 0.006 *** |
| Gender (male) | −0.001 | 0.215 | 0.062 | 0.254 | −0.112 | 0.239 | −0.151 | 0.278 |
| Full-time drivers | 0.038 | 0.107 | 0.001 | 0.121 | 0.338 | 0.117 *** | 0.355 | 0.137 *** |
| Current university students | −0.012 | 0.143 | −0.044 | 0.165 | 0.536 | 0.158 *** | 0.438 | 0.182 ** |
| Education (bachelor’s degree) | −0.069 | 0.047 | −0.034 | 0.054 | −0.130 | 0.052 ** | −0.116 | 0.060 |
| Income/purchase price | −0.001 | 0.001 | 0.001 | 0.001 | - | - | - | - |
| Income/rental cost | - | - | - | - | −0.009 | 0.002 *** | −0.008 | 0.002 *** |
| Threshold | ||||||||
| τ1 | −2.979 | 0.431 | - | - | −5.368 | 0.519 | - | - |
| τ2 | −1.665 | 0.428 | - | - | −4.000 | 0.513 | - | - |
| τ3 | −1.282 | 0.428 | - | - | −3.679 | 0.512 | - | - |
| τ4 | 1.115 | 0.432 | - | - | −1.202 | 0.509 | - | - |
| Model statistic | ||||||||
| Final log-likelihood | −3526.64 | −1628.71 | −2884.79 | −1332.19 | ||||
| Pseudo R2 | 0.027 | 0.041 | 0.047 | 0.069 | ||||
Publisher’s Note: MDPI stays neutral with regard to jurisdictional claims in published maps and institutional affiliations. |
© 2022 by the authors. Licensee MDPI, Basel, Switzerland. This article is an open access article distributed under the terms and conditions of the Creative Commons Attribution (CC BY) license (https://creativecommons.org/licenses/by/4.0/).
Share and Cite
Waluyo, T.A.; Irawan, M.Z.; Dewanti. Adopting Electric Motorcycles for Ride-Hailing Services: Influential Factors from Driver’s Perspective. Sustainability 2022, 14, 11891. https://doi.org/10.3390/su141911891
Waluyo TA, Irawan MZ, Dewanti. Adopting Electric Motorcycles for Ride-Hailing Services: Influential Factors from Driver’s Perspective. Sustainability. 2022; 14(19):11891. https://doi.org/10.3390/su141911891
Chicago/Turabian StyleWaluyo, Tanto Adi, Muhammad Zudhy Irawan, and Dewanti. 2022. "Adopting Electric Motorcycles for Ride-Hailing Services: Influential Factors from Driver’s Perspective" Sustainability 14, no. 19: 11891. https://doi.org/10.3390/su141911891
APA StyleWaluyo, T. A., Irawan, M. Z., & Dewanti. (2022). Adopting Electric Motorcycles for Ride-Hailing Services: Influential Factors from Driver’s Perspective. Sustainability, 14(19), 11891. https://doi.org/10.3390/su141911891