Abstract
This paper presents a bibliometric analysis overview of climate literacy, focusing on 740 articles published between 2001 and 2021 from the SCOPUS database. The main aim of this study was to examine related climate literacy publications. A bibliometric analysis was conducted to identify the growth trend of climate literacy research over the last twenty years (2001 to 2021), in addition to collaborations between authors, institutions, and countries in related fields. Thematic and keyword analyses were carried out to identify recent and current research topics. Based on the findings, an increasing trend in the number of publications related to climate change, 740 articles in total, was found for the last twenty years (2001 to 2021). Meanwhile, Ford, J. D. was identified as the most productive author, and the United States, United Kingdom and Australia were found to be the most influential countries producing research on climate literacy. In addition, the University of Melbourne (Australia), University of Washington and Columbia University in the United States were among the top universities to have contributed to climate literacy publications. Furthermore, Weather, Climate and Society was found to be the most represented journal, ranking Q1 in SCOPUS, with the highest publications in climate literacy. Four major thematic focus areas were identified: climate change activity, climate literacy, climate event and demographic of research studies. Based on the bibliometric analysis, the authors suggest that future research on climate literacy should focus on climate literacy among young people and the relationships between climate literacy components.
1. Introduction
Climate change is defined as long-term change in global weather due to human and industrial activities, particularly over the last few decades. As these activities continue, climate change and surface temperature will gradually increase and the atmosphere layer will become thinner, seriously impacting the planet [1]. As the global surface temperature increases, it will lead to declining Arctic Sea ice, changing patterns in global and regional borders and extend the forest fire season [2]. Climate change is occurring rapidly and unpredictably on a global scale, affecting the lifestyle and lifespan of humans [3]. According to [4], humans and the environment are related to each other, which makes them interdependent. If one element of the environment is changing, it will impact human lifestyle. Therefore, with the development of new technologies, revolutionary methods to combat climate change and promote environmental sustainability are also being researched.
Due to the rapid increase in climate change, young people are starting to speak up about environmental sustainability [5]. Climate change negatively impacts young people in particular [6]. Extreme weather events due to climate change can alter school operations, disrupt students’ education and impact their long-term health; climatic events also see teachers taking on disaster first responder roles, changing the nature of the school environment [7]. As a result, school absenteeism has started to increase as students have lost interest in learning and grow tired with the limited available recreational opportunities [8]. In addition, the failure of crop and farm production caused by El Nino and La Nina has led to increased food prices and rising household expenses [9].
Climate change literacy has come to the forefront as a research topic, with a primary focus on stabilizing the earth’s climate by 2025 [10]. According to [5], climate literacy is defined as essential knowledge on the principles of climate science, in addition to fundamental concepts of climate change. Furthermore, climate literacy also includes an awareness of climate change and a readiness to deal with the related ideas, topics and issues [11]. In other words, a climate literate individual is an expert in the principles of climate science and can assess information and communicate about climate change clearly and take responsible action towards decreasing unsustainable practices that negatively affect the environment. According to [12], climate change is a cross-disciplinary study focused on sustainable development goals. Hence, the integration of climate topics into the educational system will prepare the well-educated to be aware and have the ability to solve these problems. In conclusion, climate literacy, when integrated into the education system, will help young people to better understand the effects of climate change and the impact it has on humanity [13].
In order to synthesize climate literacy publications from around the world, a bibliometric analysis was developed to analyze climate literacy research. A bibliometric analysis is a new technique to analyze the scientific literature in a specific research field and help researchers to understand the development of this field [14]. Furthermore, according to [3] the purpose of bibliometric analyses is to provide a constant up-to-date overview of the literature. Hence, this study determines the growth of citations and publications on the literacy of climate change. The objectives of this study are: (1) to identify the development trend in scientific publications of climate change literacy, (2) to identify the network connection between authors, organizations and institutions in this field, and (3) to understand the structure and thematic focus of climate change literacy.
In this research, the SCOPUS database will be used for bibliometric analysis as it includes a larger range of documents than other databases [15]. Then, some aspects of climate literacy will be revised in the literature section. Next, the methodology, which includes search techniques, the formation of the bibliometric database and the data analysis, will be described. After that, the results will be presented and discussed.
2. Materials and Methods
In this study, a bibliometric analysis is developed to review existing literature on climate change literacy. According to previous research, a bibliometric analysis is a scientific publication that specifically focuses on contributions, relationship patterns and trends and the development of publications and citations throughout a specific year [16,17]. According to [18], bibliometric analyses can be carried out through keywords by stating the specific structure of the topic and how it is related to each article, along with revealing information on trends by year. In other words, a bibliometric analysis is a suitable technique to explore the growth trend of publications on certain topics and networks between authors, institutions and countries.
In a bibliometric analysis, five workflow stages (Figure 1) are included: study design, data collection, data analysis, data visualization and discussion [19]. Next, the scientific network analysis is analyzed according to three steps: (1) the co-authorship analysis, (2) the citation analysis and (3) the thematic keyword analysis [20].
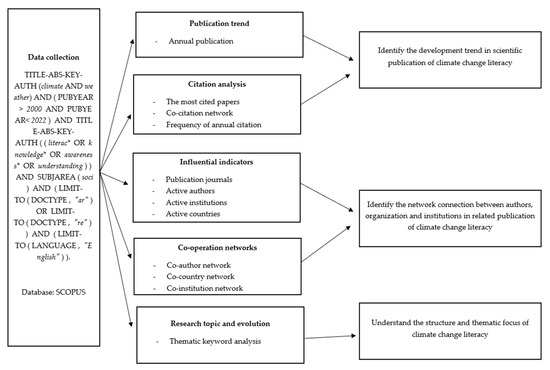
Figure 1.
Research framework in bibliometric analysis.
First, the analysis of co-authorship involves the links between the authors, countries and organizations (e.g., institutions) associated with climate change literacy. This analysis identifies the level of collaboration between the items of authors and countries regarding climate change literacy.
Next, the analysis of citation addresses the citation journal from scientific papers on climate change literacy. This analysis focuses on extensions of the discussed topic in different journals from various disciplines.
Lastly, the keywords analysis aims to explore the main topic, subtopic and the research issue in climate change literacy. In addition, the co-occurrence analysis is extended to specify the scope of the research topic and the involvement of other disciplines. Table 1 shows the applications of key bibliometric analyses in this study.

Table 1.
The applications of key bibliometric analyses.
In this study, SCOPUS was used to retrieve the related publication based on the keywords, as it covers the highest impact journals in various fields of research [15].
For the data collection, specific keywords and suitable operator method by syntax were used to find the related articles of climate change literacy. SCOPUS (http://www.scopus.com/) (accessed on 29 August 2022) was used to search the scientific literature and identify the related publication data for analysis. The searches were extended from 2001 to 2021 and conducted in the second week of April 2022.
Keyword searching for climate literacy was used to search previous research: climate or a combination of words such as “weather” with words “literac* OR knowledge OR awareness OR understanding”. The symbol “*” indicates any type of characters in the search syntax of SCOPUS. After that, the search is restricted to abstract, keyword and title of article. The selected documents were articles and reviews in the index of social sciences and written in the English language. The obtained result was 1017 documents. Thus, Table 2 below shows the search query that was used to extract a database from SCOPUS:
Table 2.
The query string and the total documents obtained from the advanced search.
The next step was involved in filtering the data. As the documents are obtained from SCOPUS, they are filtered through titles, abstracts and keywords that are not related to climate change literacy research. However, the manual filter method can cause bias in the collected data. Therefore, based on the filter, the remaining records accepted were 740 documents and these continued to the data analysis step.
For the data analysis, the obtained data were exported from SCOPUS into CSV format before being analyzed in VOSviewer software. Quantitative information such as the trends of growth of the number of publications by year can be retrieved from Microsoft Excel software. Meanwhile, network between source, author and countries and thematic analysis can be analyzed through VOSviewer software in the map form. VOSviewer software is a free software and can be used to visualize the network data in bibliometric maps. In the visualization, nodes represent the objects of interest such as authors, institutions, countries, journals and key terms and the linkage represents the strength between the nodes. Furthermore, the distance between the nodes indicates the connection of the items in the research topic [19]. The findings are discussed in the discussion section to interpret the co-authorship, co-citation and co-occurrence bibliographic maps.
3. Results and Discussions
3.1. The Development Trend in Scientific Publication of Climate Change Literacy
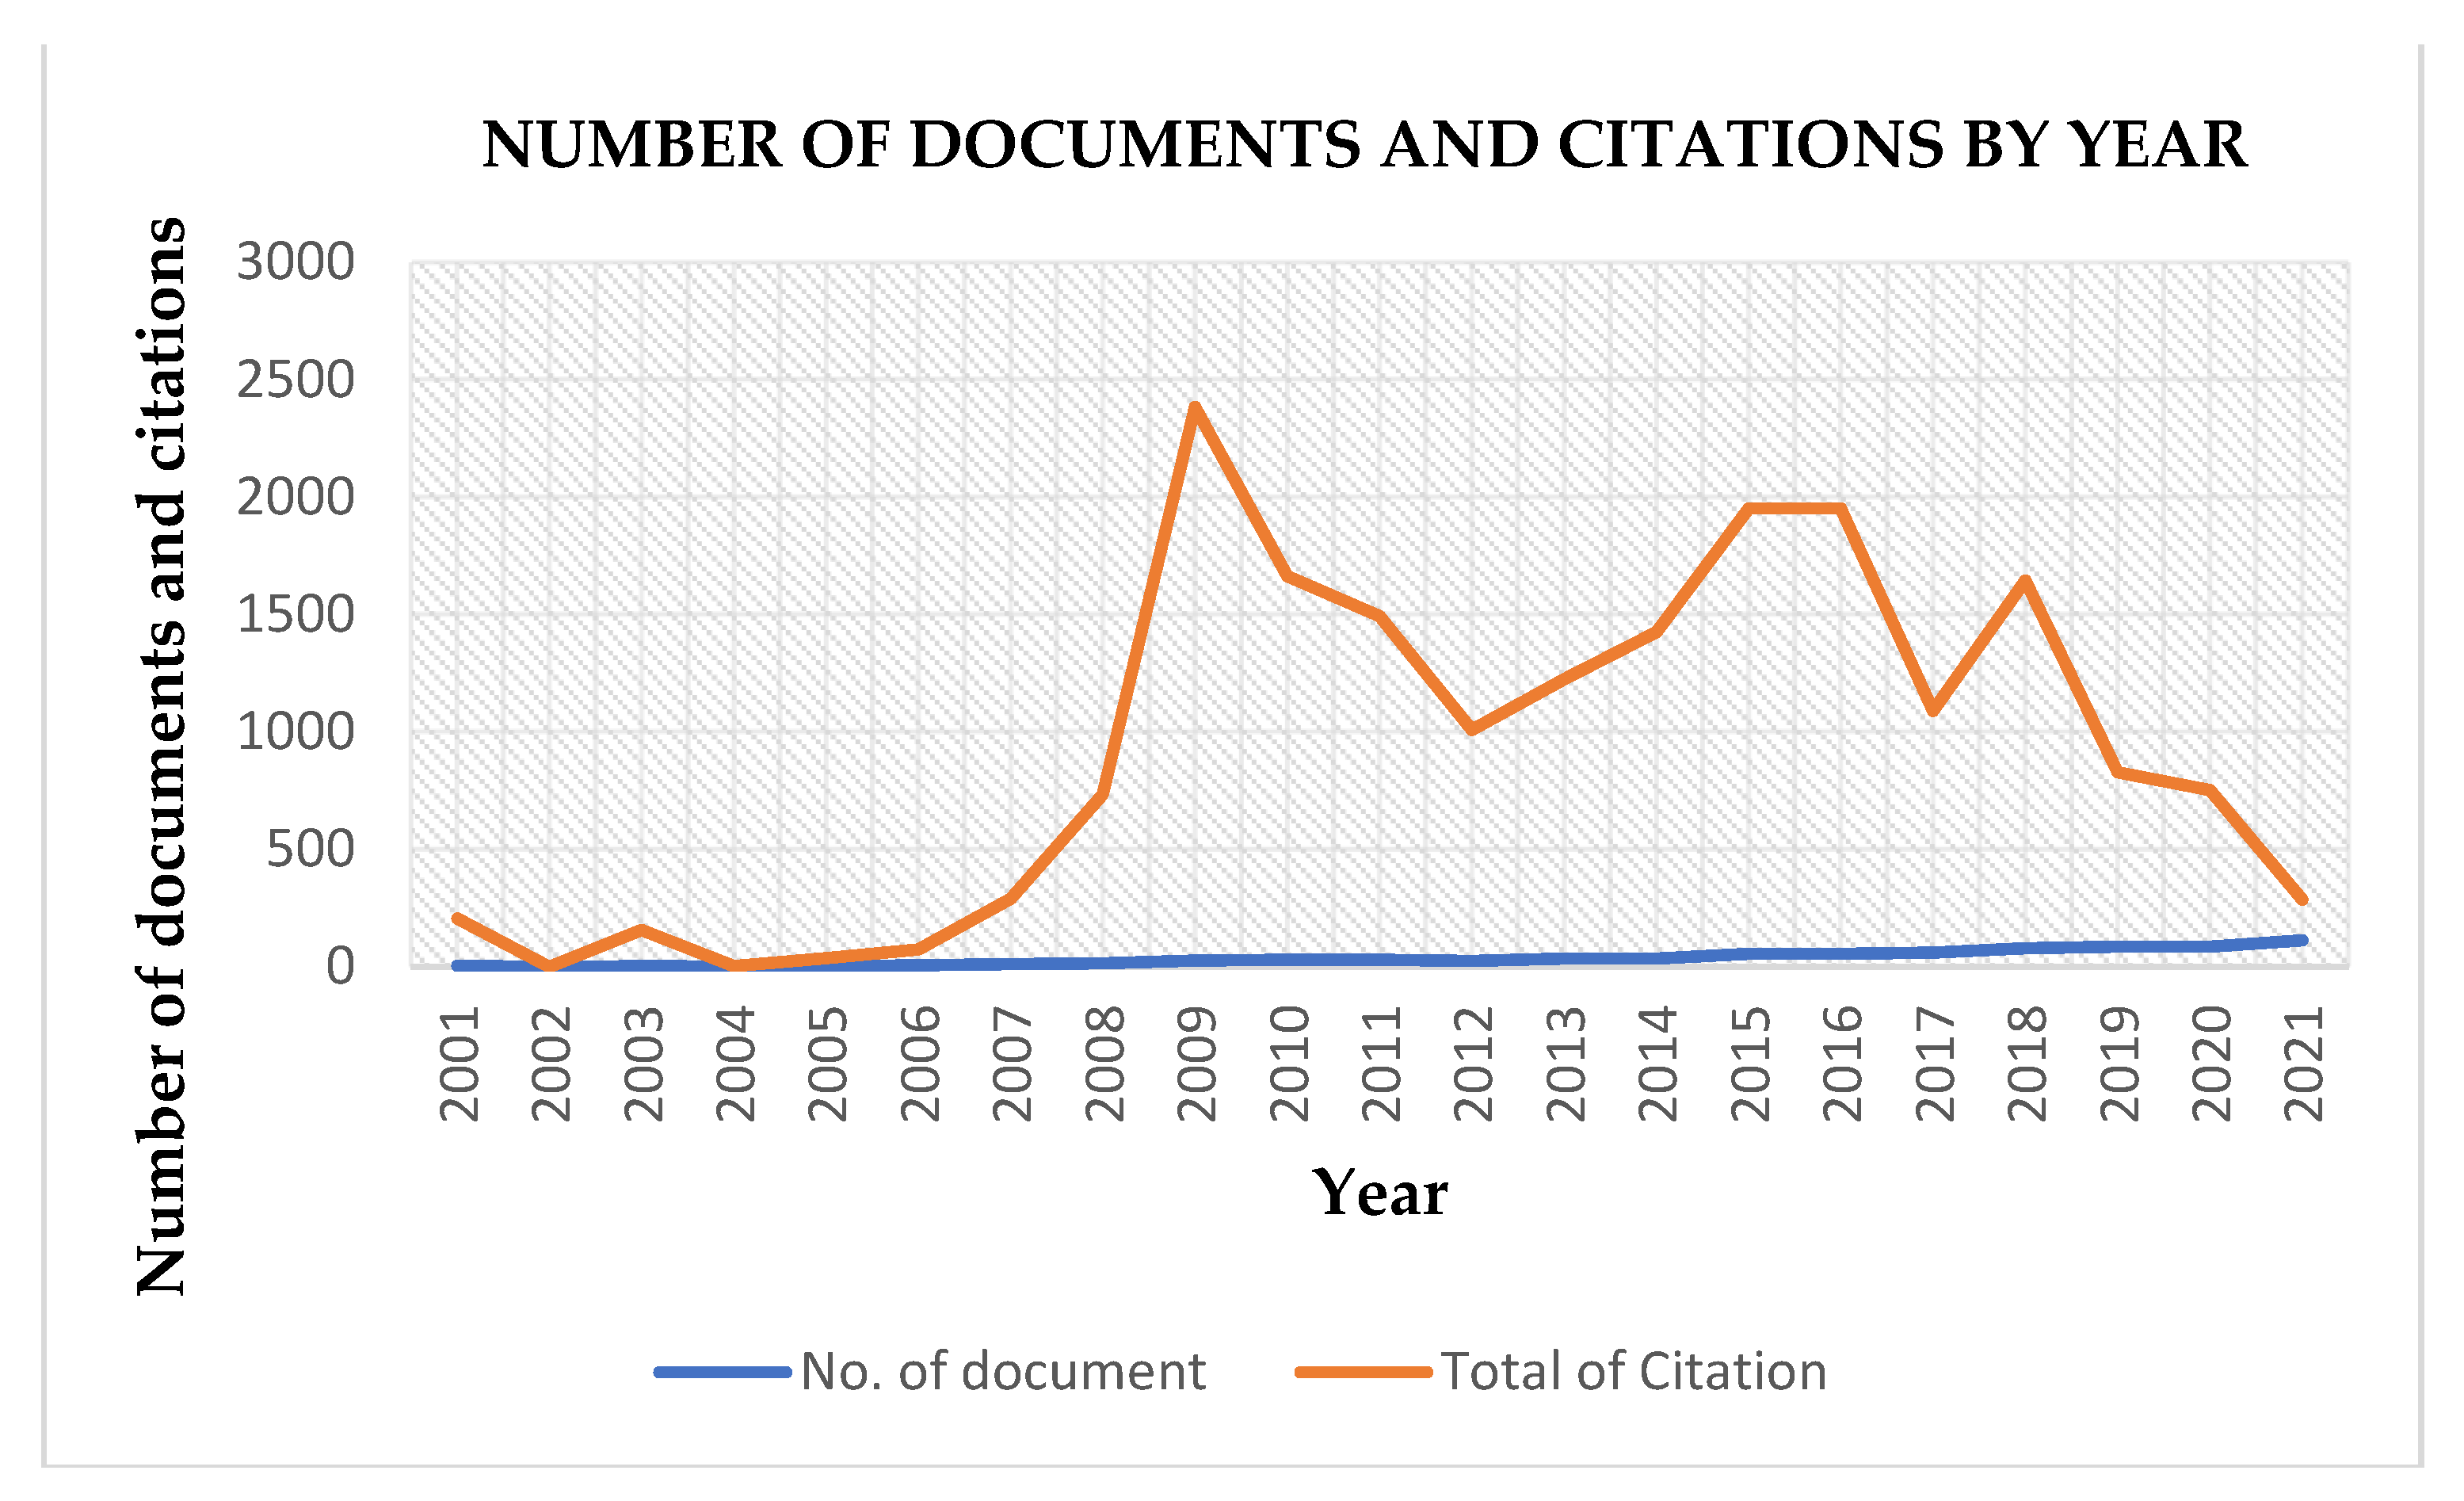
The aim of exploring publication and citation trends is to determine the developmental patterns of a specific topic research in certain years. Hence, Figure 1 shows the growth of publication and citation numbers in climate change literacy from 2001 to 2021.
In this study, 740 publications on climate literacy were selected between 2001 and 2021 by using the SCOPUS database for bibliometric analysis. Based on the analysis, the result shows a rapid increase in the past 20 years in the number of documents related to climate change literacy. The records started to considerably grow between 2013 to 2021, with a significant rise from 34 to 112 publications. Hence, this research proves that publications are increasing significantly on the subject of climate change literacy.
As can be seen, publications on climate change literacy are increasing yearly due to climate change events that continue to occur and challenge society’s normal life [21]. Climate scientists expect Earth’s temperature to increase and affect economic prosperity, human and environmental health and national security [22]. Thus, many researchers are studying climate change literacy to analyze people’s knowledge about climate change, along with developing policies that are related to climate change and its impacts [23]. Furthermore, Sustainable Development Goal 13 also emphasizes climate change literacy among people, specifically regarding their knowledge, awareness, mitigation and adaptation to climate change events [24].
The number of citations were found to be consistent (Figure 2). For instance, the total of citations from 2001 to 2006 show a decreasing trend, while they were found to rise rapidly between 2012 and 2016, reaching 1951 citations in the year 2016. Then, the result shows a decreasing pattern from 2017 to 2019, as the total citations decrease from 1089 to 286 (Table 3).
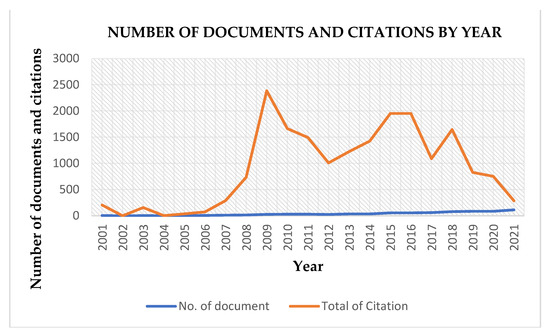
Figure 2.
Bar chart illustrates the growth trends of published documents by year.
Table 3.
Number of documents and citations from 2001 to 2021.
3.2. Citation Analysis of Journals
This analysis revealed 303 journals, of which only 30 journals eventuated in fundamental research with climate change literacy. Table 4 shows the most journals that contributed to climate change literacy research. In this section, the number of documents and citations, SCOPUS quartile (Q1 to Q4), CiteScore 2020 and Journal Impact Factor are analyzed for ranking purposes.
Table 4.
The top 10 most active journals publishing in climate change literacy.
Based on the analysis, Weather, Climate and Society is the most influential journal related to climate change literacy, with 45 published documents and 549 citations, followed by Sustainability, with 34 documents (245 citations), and Water, with 31 documents (661 citations). The remaining related journals (Table 4) contributed 13 to 28 documents per journal, with 159 to 2633 citations. Hence, it can be concluded that there is a high number of high-quality articles and citations from scholars in their related projects [25].
When analyzing the journals, most were found to be highly ranked: Q1 to Q4 in the journal rankings of SCOPUS. In addition, most of these journals (Table 4) were highly ranked in SCOPUS. From the analysis, five journals were ranked Q1, four journals were ranked Q2 and only one journal ranked Q3. For instance, the journal Weather, Climate and Society was found to be the most influential journal in publishing the interactions of weather and climate with society-related research. Therefore, it can be concluded that these journals are highly relevant in regard to the research topic and include high-quality research based on their impact (Journal Impact Factor) over the last two decades [26]. In terms of CiteScore rank, Global Environmental Change has the highest indicators, with a 3.26 rating, followed by Wiley Interdisciplinary Reviews—Climate Change (1.38 rating), and Weather and Climate Extremes (1.27 rating). It can be concluded that the highest rating CiteScore is ranked in the rank Q1.
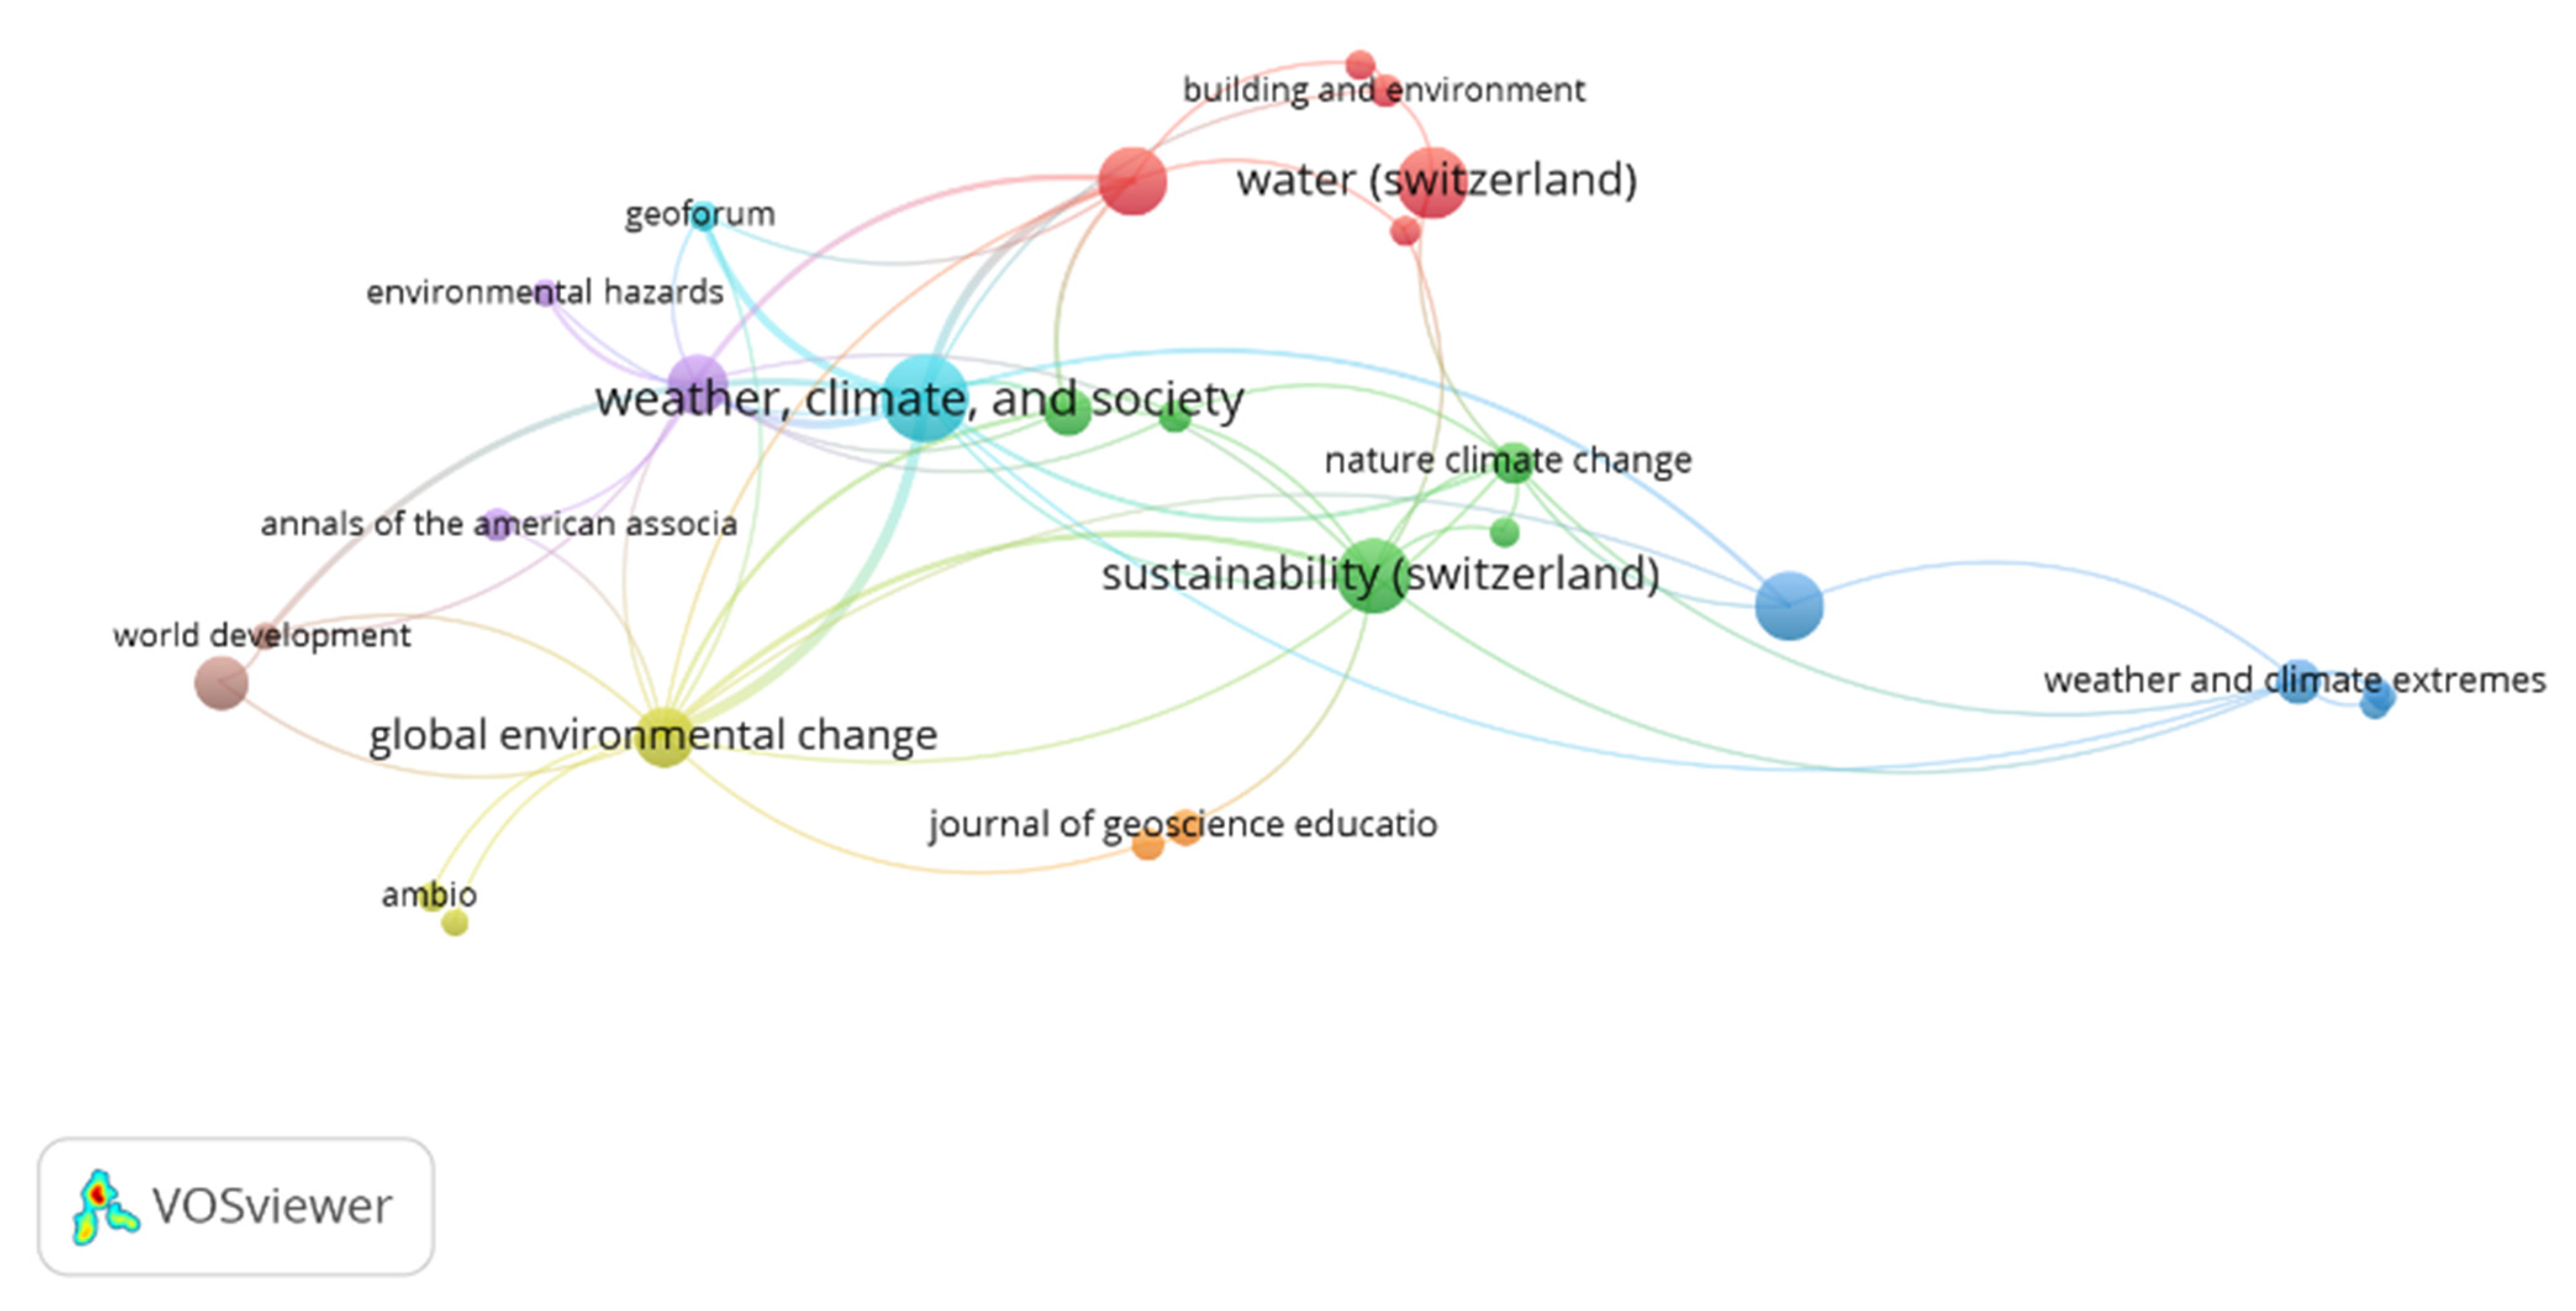
Figure 3 shows the analysis result of the network of journals with different disciplines for the research topic. As Figure 3 shows, the journal Weather, Climate and Society is the most productive journal, as it has a wide network with other journals in research topics. Furthermore, most of the journals in the visualization are related to climate research topics, as the research topic is related to climate change literacy.
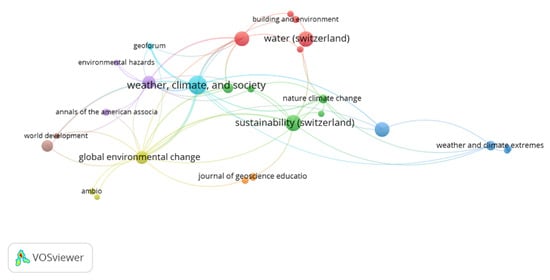
Figure 3.
The most influential journals in climate literacy. The visualization generated by VOSViewer software.
3.3. Contribution by Authors
Table 5 presents the information on the top 10 active authors along with the number of published documents, citations and H-indexes. Based on the analysis, authors from institutions of the UK are the top 3 most productive in research topics. Meanwhile, the number of articles from the authors are not different, with an average 3 to 5 articles. For the authors’ H-indexes, the results are quite similar, with only 3 to 5.
Table 5.
Top 10 most active authors in climate literacy based on total number of publications.
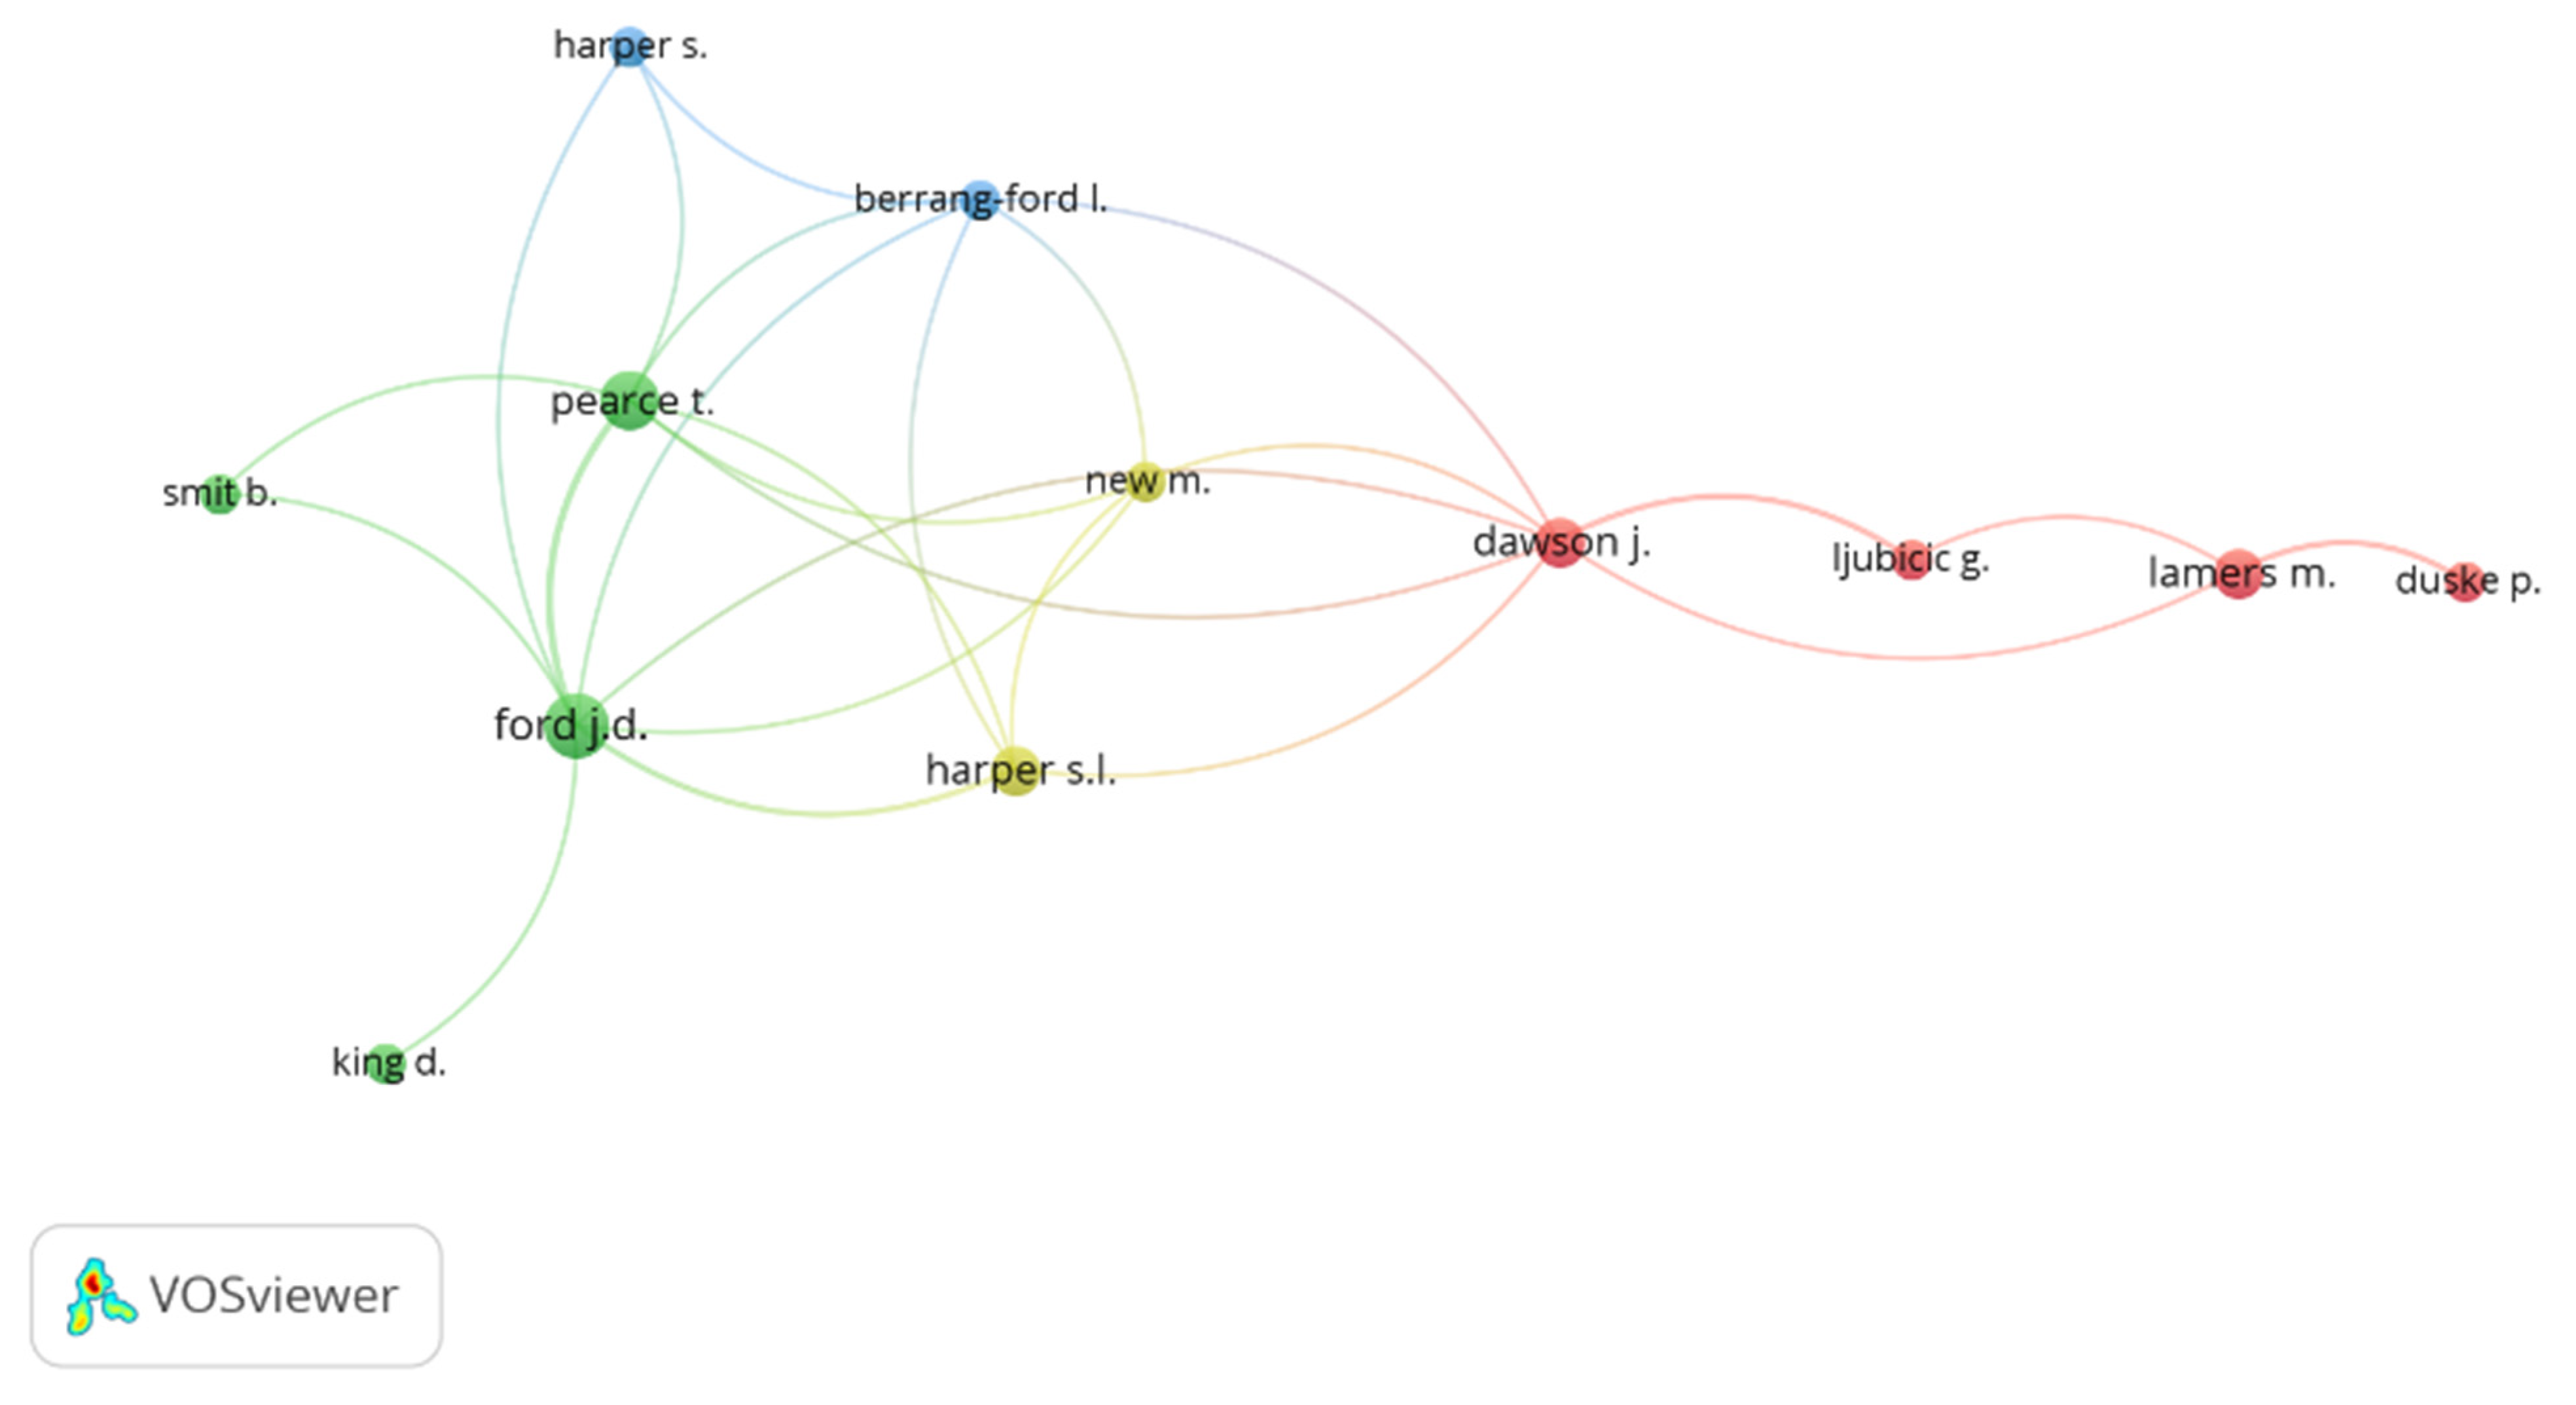
As the results state in Table 5, Ford, J. D. from the United Kingdom is the first ranked author, with 5 articles and 361 citations, followed by Dessai, S. (UK), with 5 articles and 282 citations, and Becken, S. (UK), with 5 articles and 134 citations. There are five authors with four papers: Ebi, K. L. (US, 129 citations), Otto, F. E. L. (UK, 278 citations), Pearce, T. (Canada, 135 citations), Ren, C. (Hong Kong, 120 citations) and Zander, K. K. (Australia, 94 citations). The remaining authors with three articles are Bremer, S. from Norway, with 61 citations, and Brown, M. E. from the US, with 68 citations. In addition, these authors are a lecturer and fellow researcher in the UK, focusing on climate and environmental issues. Hence, it can be concluded that they are experts in climate issues and systems.
Figure 4 shows collaborations between authors with at least five publications. Based on the analysis, four different groups were connected to each other, as the nodes are connected with others. Meanwhile, cooperation between scholars on climate literacy topics and their connection is quite strong.
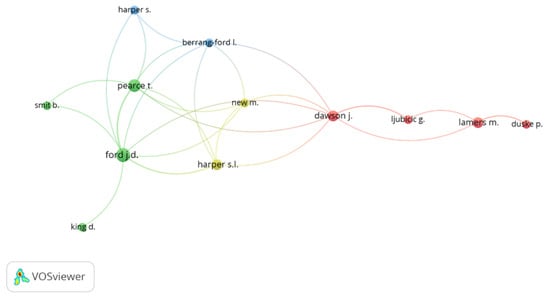
Figure 4.
Co-authorship network of 12 scholars with at least five publications. The visualization generated by VOSViewer software.
3.4. The Most Influential Papers
A list of the top 10 articles in the published collection of 740 documents is shown in Table 6, along with the number of citations over the last five years. Based on the results, the article “A conceptual framework for analyzing adaptive capacity and multi-level learning processes in resource governance regimes” authored by Pahl-Wostl et al. (2009) from Germany ranked first with 1229 citations. The research studied the role of institutions and governments in improving the level of climate literacy among German people. As the article discusses climate literacy, the number of citations is the highest. In addition, this article is in rank Q1, which shows the credibility of the article to be a reference for other related research.
Table 6.
Overview of the top 10 most cited papers in climate literacy research collection.
3.5. Contribution by Institutions
Table 7 shows the top 10 productive institutions based on the number of publications. Based on the analysis, it was found that 740 published articles were documents produced by a total of 1819 different organizations. Bases on the result, it could be seen that four institutions from the United States had the most affiliated research topics.
Table 7.
The top 10 productive institutions based on the number of publications.
As the results show, the University of Melbourne in Australia is ranked first, with 19 articles, followed by the University of Washington, US, with 17 articles, and Columbia University, US and the University of Leeds, UK with 13 articles equivalently. The remaining institutions have 5 to 11 papers that have been published. It is evident that the US is actively establishing and researching the field of interest [20] and is the dominant country in scientific research, as shown in Table 7 and Figure 4.
Based on the citation analysis, Columbia University, US has the highest number of citations with 687 citations, followed by the University of Oxford, UK, with 503 citations, and the University of Leeds, UK, with 475 citations.
3.6. Contribution by Countries
Table 8 shows an analysis of the contribution of the top 10 countries. Based on the analysis, most publications are contributed by authors from the United States, with 245 publications on climate change literacy (36.24%). The remaining contributing countries are the United Kingdom, with 107 publications (15.83%), Australia, with 77 publications, Canada, with 55 publications (8.14%), Germany, with 44 publications (6.51%), The Netherlands, with 35 publications (5.18%), India (33 publications, 4.88%), South Africa (30 publications, 4.44%), China (29 documents, 4.29%) and Sweden (21 publications, 3.11%).
Table 8.
The top 10 countries contributing to climate literacy publications.
Furthermore, the top 10 contributing countries are developed countries, which have been exposed to climate change issues in the last two decades. Climate change in these countries has encouraged new policies and management strategies related to reducing climate change events [27]. In addition, changes in climate affect many developed countries in terms of socioeconomic factors such as the production of agriculture (disrupting food production) [28], influence on human health [29] and tourism due to temperature changes [28]. From this description, it shows the strong interactions between the socioeconomic and climate systems [29].
In terms of total citations by country, the United States is the country with the highest number of citations, 6161 (26.62%), followed by the United Kingdom with 3647 citations (17.53%) and Germany with 2625 citations (12.62%). The remaining countries have a total number of citations between 465 and 2177. Hence, it can be concluded that the United Kingdom and other European countries are the top contributing countries in this field, as they are English-speaking countries [30].
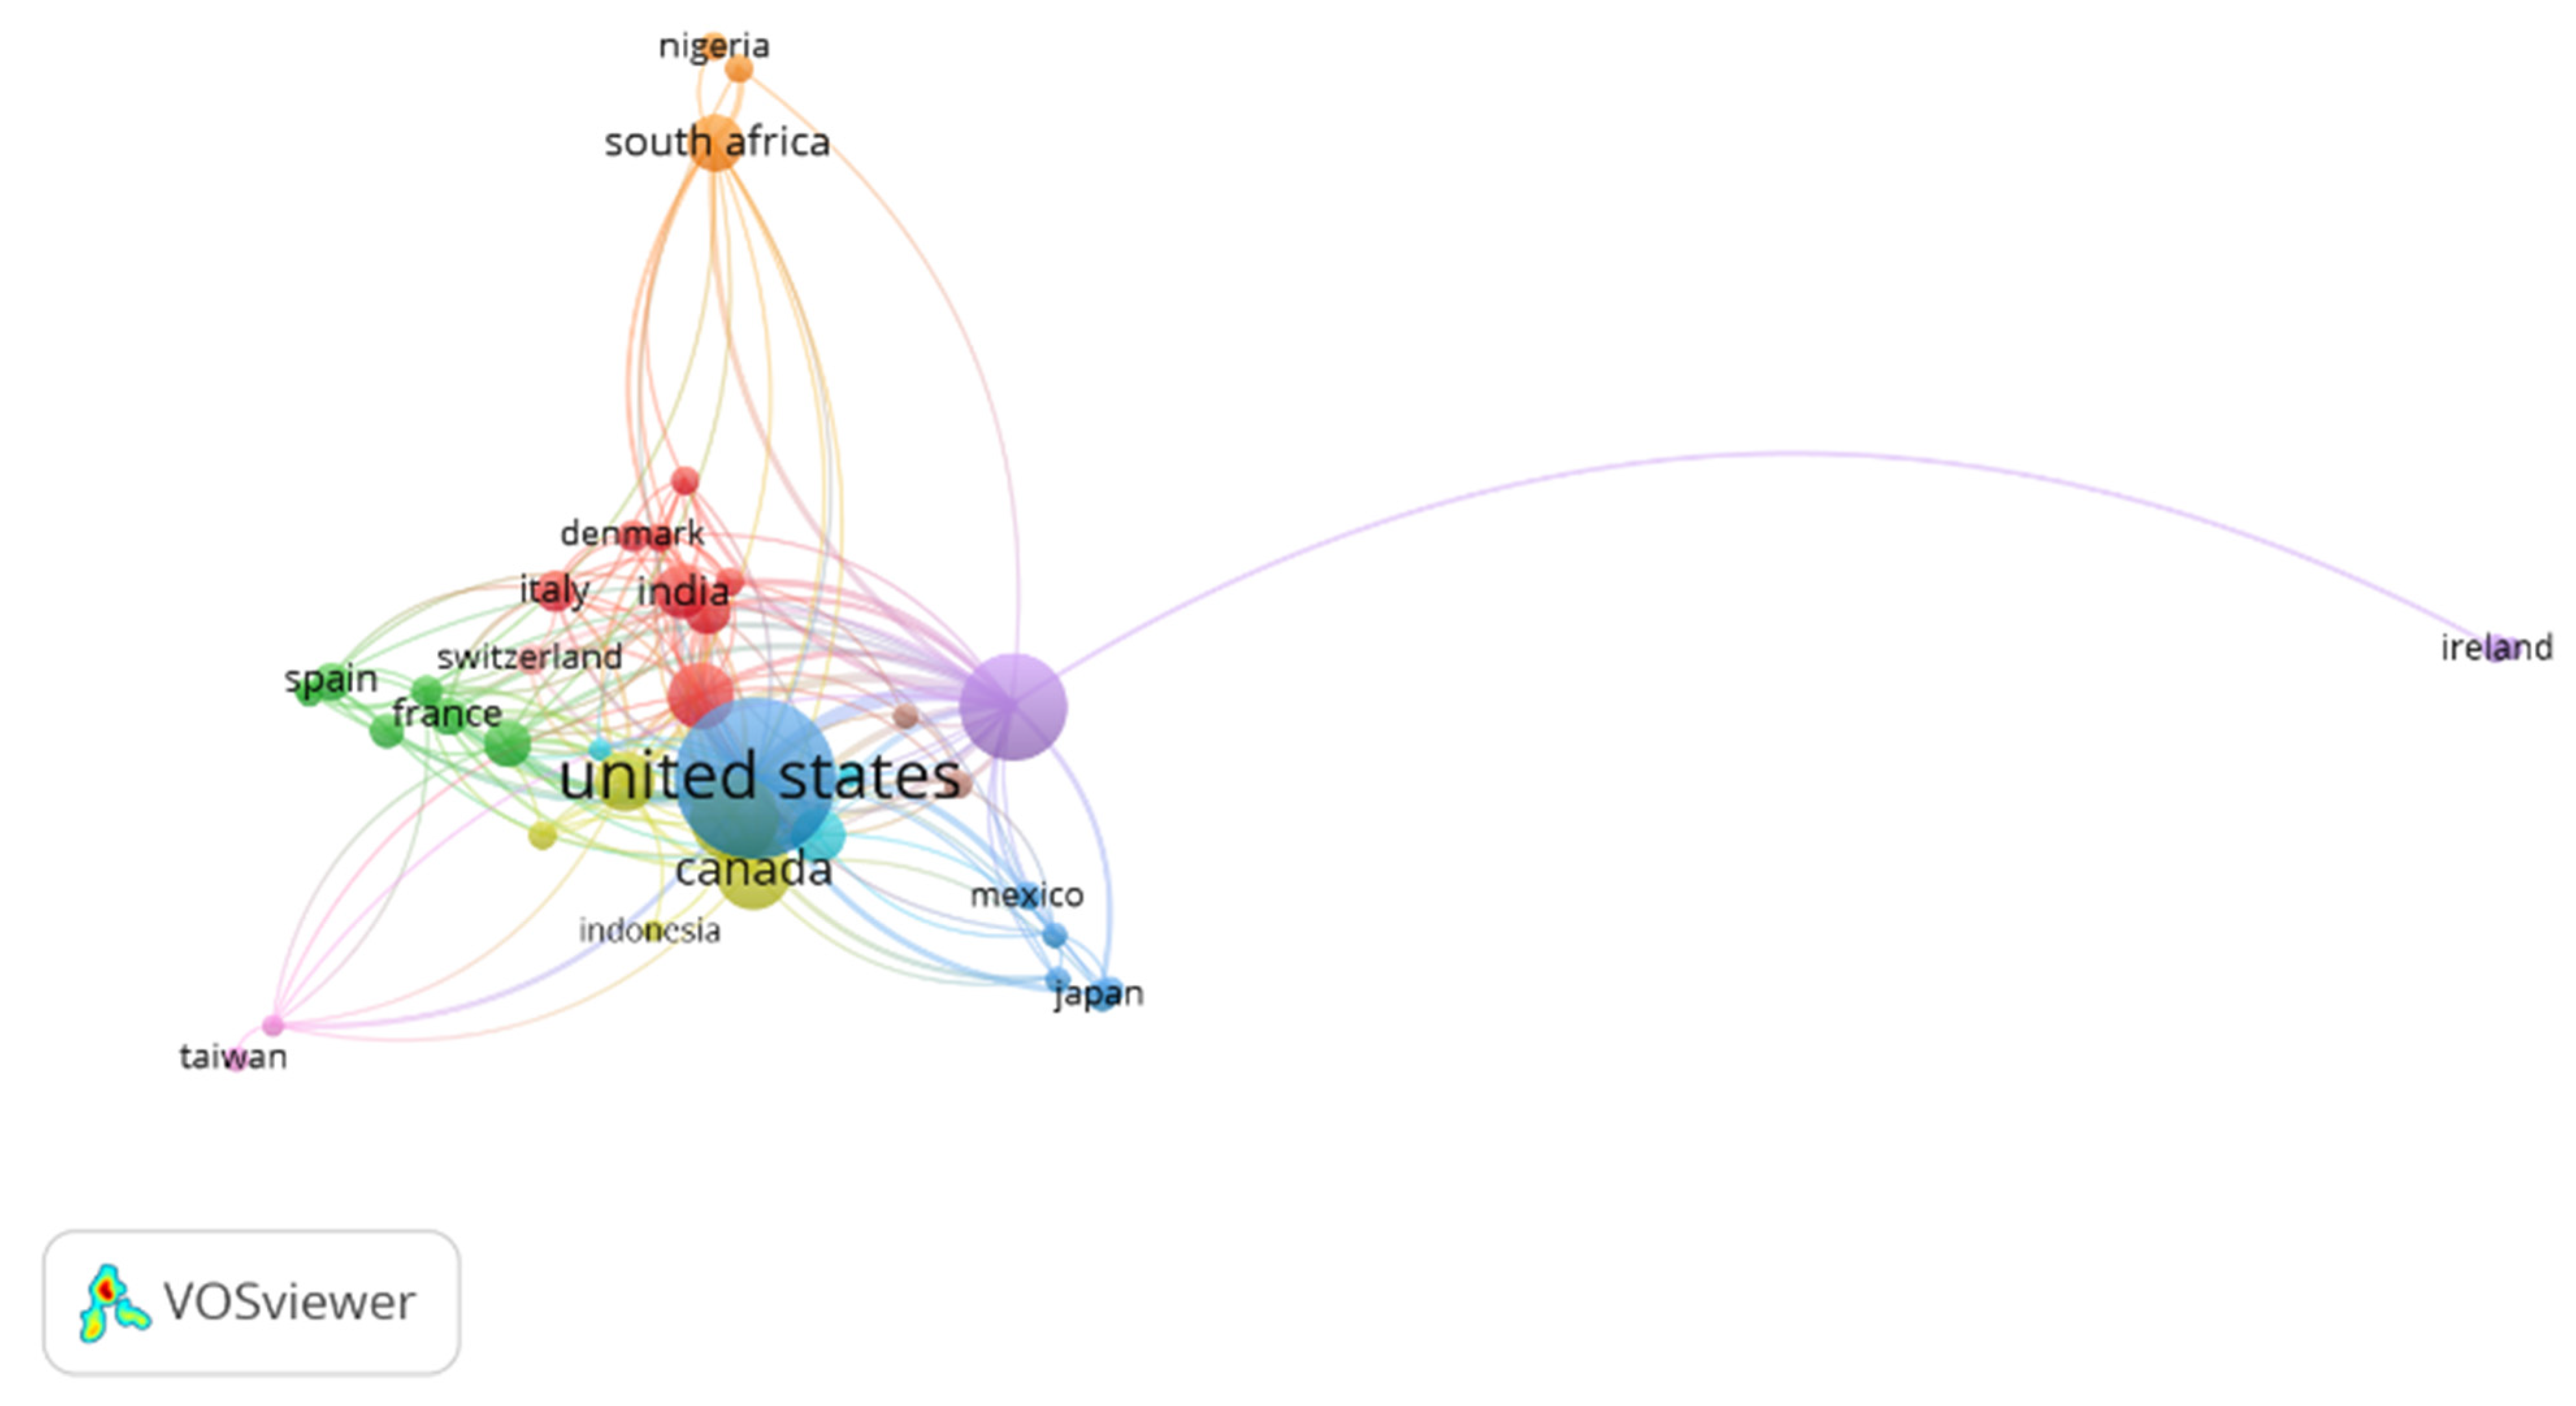
The co-authorship analysis was conducted to identify the cooperation of authors on a country basis in regard to climate change literacy with a minimum of 5 publications on the research topic. Figure 5 shows the countries and the involved authors that have collaborated on climate change literacy projects.
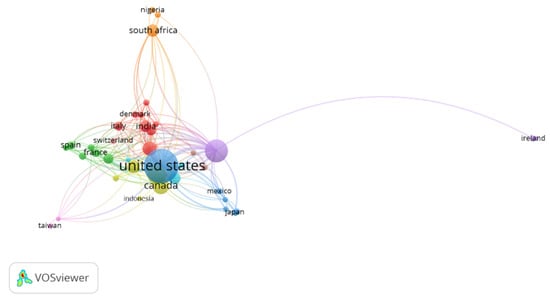
Figure 5.
The co-authorship network between countries. The visualization generated by VOSViewer software.
Based on the observation, only 15 countries are connected with each other, which shows that researchers are working together on climate change literacy research. Ireland, Taiwan, Nigeria and South Africa are the countries that have weak cooperation with other countries, as their linkage is less than other countries.
3.7. Thematic Keyword Analysis
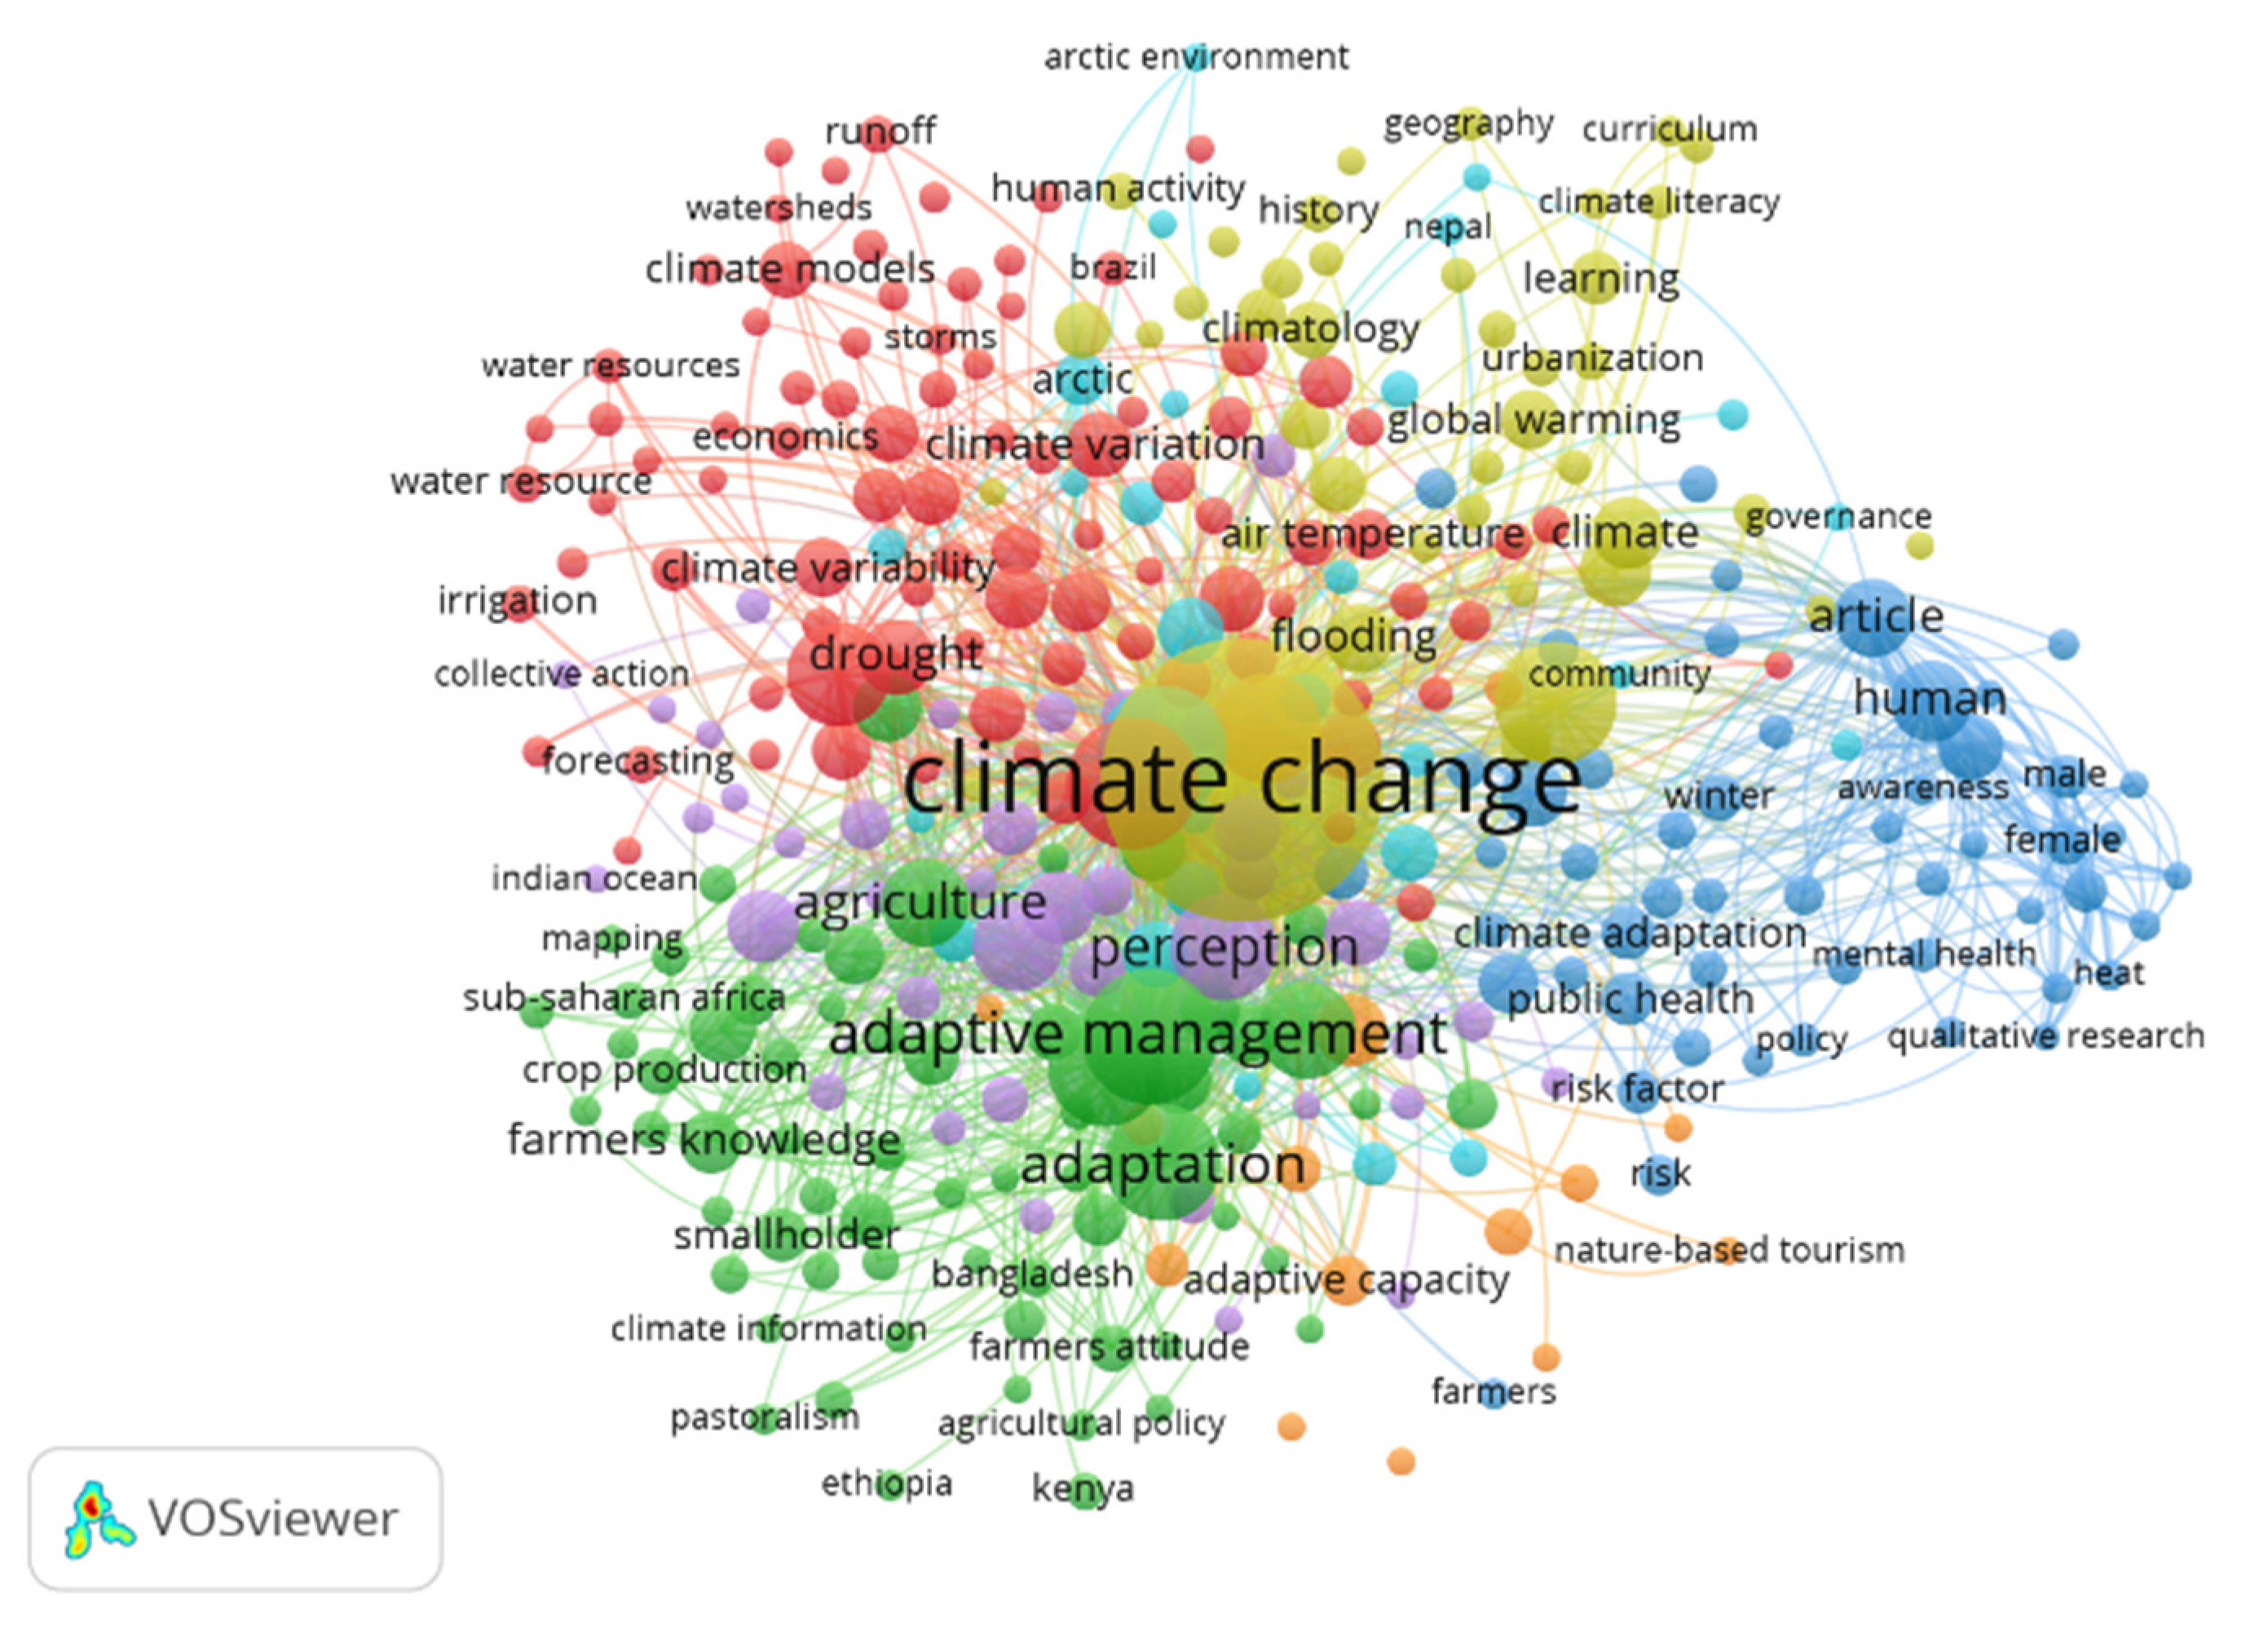
The thematic keyword analysis revealed the related research topic by keywords used in the documents [31]. A thematic keyword network of the 330 most common keywords, those that appeared at least 5 times, is shown in Figure 6. Each keyword is symbolized as a node and the thickness of lines between nodes represent the strength of the connection between them. The type of color between nodes were coded to determine the closeness of the relationship between the keywords.
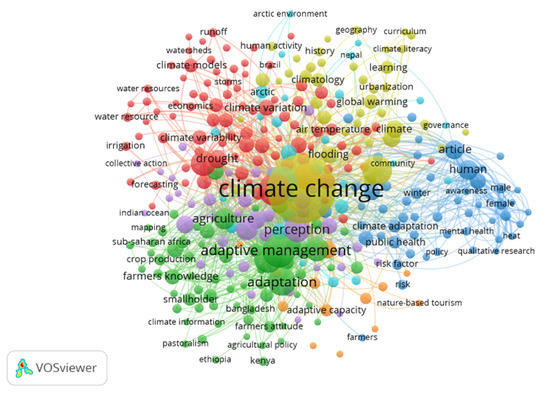
Figure 6.
Co-occurrence network of 330 most influential keywords. The visualization network generated by VOSViewer.
The findings showed four main groups that were related to each other, such as climate change and extreme weather events, climate literacy aspects (perception, knowledge, adaptation), gender and age group. Based on the visualization, it can be seen that climate literacy researchers focused more on farmers and the middle aged, demonstrating a gap in the field of research in regard to youth and children. In addition, the climate literacy aspects were also discussed separately and emphasized only on perception and knowledge among them. Hence, the second research gap is the connection between attitudes and behaviors; other aspects are still less clear, such as their attitudes or behavior toward the environment, which cannot be predicted [32,33].
4. Conclusions
As climate change and climate literacy have become topics of interest, a bibliometric analysis of the climate change literacy publications available in SCOPUS database was developed. The main purpose of this article was to analyze publications related to climate literacy over the last twenty years (2001 to 2021) and the relationship between author, institutions, countries and thematic keywords using VOSViewer software. Based on the findings, the number of publications has increased exponentially from 2005 to 2021, along with the worldwide increase in climate change events. However, the number of citations is not consistent throughout this period. The United States was found to be the main country publishing articles and the most productive institutions and authors were from the US. This is likely due to the language itself and their experiences of climate change events. Furthermore, the countries that were the most productive in publishing articles on climate change literacy demonstrated a strong connection with each other, except for Ireland, Taiwan and Nigeria, as many experts on the climate system are from these top countries. Regarding authors, an average amount of cooperation was found, as the linkage between nodes was weaker. Lastly, the keywords analysis indicated the diversity of the topic and analyzed research gaps. During the analysis, it was found that research on young people and their relationship with climate literacy represented a significant gap and studies in this area should be carried out in the future. Regarding the limitations, the SCOPUS database might not include all publications in the climate literacy field and needs to include other types of publications such as conference proceedings and books. The keyword “environment” should be used in the data search to extend the search scope. Lastly, filtering documents manually might not be perfect and errors can occur with the results.
Funding
This research was funded by National University of Malaysia (grant number GP-2020-K018066). Funding grant GG-2021-004.
Conflicts of Interest
The authors declare no conflict of interest.
References
- United Nations Framework Convention on Climate Change. Available online: https://unfccc.int/kyoto_protocol (accessed on 20 May 2022).
- Quarderer, N.A.; Fulmer, G.W.; Hand, B.; Neal, T.A. Unpacking the connections between 8th graders’ climate literacy and epistemic cognition. J. Res. Sci. Teach. 2021, 58, 1527–1556. [Google Scholar] [CrossRef]
- Fu, H.-Z.; Waltman, L. A large-scale bibliometric analysis of global climate change research between 2001 and 2018. Clim. Chang. 2022, 170, 36. [Google Scholar] [CrossRef]
- Hanifah, M.; Mohmadisa, H.; Yazid, S.; Nasir, N.; Samsudin, S.; Balkhis, N.S. Determination of physical geographical components in the construction of environmental sustainability awareness index of the Malaysian society. Asia-Pac. Soc. Sci. Rev. 2020, 20, 142–152. [Google Scholar]
- Limaye, V.S.; Grabow, M.L.; Stull, V.J.; Patz, J.A. Developing a definition of climate and health literacy. Health Aff. 2020, 39, 2182–2188. [Google Scholar] [CrossRef] [PubMed]
- Salas, R.N.; Knappenberger, P.; Hess, J.J. Lancet Countdown on Health and Climate Change Policy Brief for the U.S. Lancet Countdown. 2019. Available online: https://www.lancetcountdownus.org/2019-lancetcountdown-us-brief (accessed on 13 August 2022).
- Costa, R.; Cross, H.T.; Moore, M.; Many, M.; Osofsky, J.; Osofsky, H. Teachers and school personnel as first responders following disasters: Survivors and supporters. J. Trauma Stress Disor. Treat 2015, 4, 2. [Google Scholar] [CrossRef]
- Ramírez, A.; Sarmiento, O.L.; Duperly, J.; Wong, T.W.; Rojas, N.; Arango, C.M.; Maldonado, A.; Aristizabal, G.; Pérez, L.; Lobelo, F. Should they play outside? Cardiorespiratory fitness and air pollution among schoolchildren in Bogotá. Rev. Salud. Publica 2012, 14, 570–583. [Google Scholar]
- Mardiyati, S.; Natsir, M.; Naila. Literacy and adaptation strategy of rainfed lowland farmer on climate change risk in Takalar Regency. IOP Conf. Ser. Earth Environ. Sci. 2021, 681, 12080. [Google Scholar] [CrossRef]
- Otto, I.M.; Donges, J.F.; Cremades, R.; Bhowmik, A.; Hewitt, R.J.; Lucht, W.; Rockström, J.; Allerberger, F.; McCaffrey, M.; Doe, S.S.P.; et al. Social tipping dynamics for stabilizing Earth’s climate by 2050. Proc. Natl. Acad. Sci. USA 2020, 117, 2354–2365. [Google Scholar] [CrossRef] [PubMed]
- Daniš, P. New definition of environmental literacy and proposal for its international assessment in PISA 2015. Envigogika Charles Univ. E-J. Env. Educ. 2013, 8, 1–16. [Google Scholar] [CrossRef]
- Anderson, A. Climate change education for mitigation and adaptation. J. Educ. Sustain. Dev. 2012, 6, 191–206. [Google Scholar] [CrossRef]
- Kuthe AKörfgen, A.; Stötter, J.; Keller, L. Strengthening their climate change literacy: A case study addressing the weaknesses in young people’s climate change awareness. Appl. Environ. Educ. Commun. 2019, 19, 375–388. Available online: https://www.researchgate.net/deref/https%3A%2F%2Fdoi.org%2F10.1080%2F1533015X.2019.1597661 (accessed on 13 August 2022). [CrossRef]
- Santos, R.M.; Bakhshoodeh, R. Climate change/global warming/climate emergency versus general climate research: Comparative bibliometric trends of publications. Heliyon 2021, 7, e08219. [Google Scholar] [CrossRef] [PubMed]
- Mongeon, P.; Paul-Hus, A. The journal coverage of Web of Science and Scopus: A comparative analysis. Scientometrics 2016, 106, 213–228. [Google Scholar] [CrossRef]
- Pham, H.-H.; Dong, T.-K.-T.; Vuong, Q.-H.; Luong, D.-H.; Nguyen, T.-T.; Dinh, V.-H.; Ho, M.-T. A bibliometric review of research on international student mobilities in Asia with Scopus dataset between 1984 and 2019. Scientometrics 2021, 126, 5201–5224. [Google Scholar] [CrossRef]
- Cao, H.T.; Trinh, T.T.P.; Nguyen, T.T.; Le, H.T.T.; Van Ngo, D.; Tran, T. A bibliometric review of research on STEM education in ASEAN: Science mapping the literature in Scopus database, 2000 to 2019. Eurasia J. Math. Sci. Technol. Educ. 2020, 16, em1889. [Google Scholar]
- Zupic, I.; Čater, T. Bibliometric methods in management and organization. Organ. Res. Methods 2015, 18, 429–472. [Google Scholar] [CrossRef]
- Hernández-Torrano, D.; Ibrayeva, L. Creativity and education: A bibliometric mapping of the research literature (1975–2019). Think. Ski. Creat. 2020, 35, 100625. [Google Scholar] [CrossRef]
- Le Thi Thu, H.; Tran, T.; Phuong, T.; Tuyet, T.; Huy, H.; Thi, T. Two decades of STEM education research in middle school: A bibliometrics analysis in Scopus database (2000–2020). Educ. Sci. 2021, 11, 353. [Google Scholar] [CrossRef]
- Steffen, W.; Richardson, K.; Rockström, J.; Cornell, S.E.; Fetzer, I.; Bennett, E.M.; Biggs, R.; Carpenter, S.R.; De Vries, W.; De Wit, C.A.; et al. Planetary boundaries: Guiding human development on a changing planet. Science 2015, 347, 1259855. [Google Scholar] [CrossRef]
- Longworth, B. Climate Literacy: The Essential Principles of Climate Sciences 2008. Available online: https://aambpublicoceanservice.blob.core.windows.net/oceanserviceprod/education/literacy/climate_literacy.pdf (accessed on 13 August 2022).
- Johnston, J.D. Climate change literacy to combat climate change and its impacts. In Encyclopedia of the UN Sustainable Development Goals (Climate Action); Springer: Berlin/Heidelberg, Germany, 2018. [Google Scholar]
- UN. Sustainable Development Goal 13. Sustainable Development Goals Knowledge Platform. 2016. Available online: https://sustainabledevelopment.un.org/sdg13 (accessed on 30 June 2022).
- Djeki, E.; Degila, J.; Bondiombouy, C.; Alhassan, M.H. E-learning bibliometric analysis from 2015 to 2020. J. Comput. Educ. 2021. [Google Scholar] [CrossRef]
- Long, H.; Plucker, J.A.; Yu, Q.; Ding, Y.; Kaufman, J.C. Research productivity and performance of journals in the creativity sciences: A bibliometric analysis. Creat. Res. J. 2014, 26, 353–360. [Google Scholar] [CrossRef]
- Sawassi, A.; Khadra, R. Bibliometric network analysis of “Water Systems’ adaptation to climate change uncertainties”: Concepts, approaches, gaps, and opportunities. Sustainability 2021, 13, 6738. [Google Scholar] [CrossRef]
- Roson, R.; van der Mensbrugghe, D. Climate change and economic growth: Impacts and interactions. Int. J. Sustain. Econ. 2012, 4, 270–285. [Google Scholar] [CrossRef]
- Leal Filho, W.; Bönecke, J.; Spielmann, H.; Azeiteiro, U.M.; Alves, F.; Lopes de Carvalho, M.; Nagy, G.J. Climate change and health: An analysis of causal relations on the spread of vector-borne diseases in Brazil. J. Clean. Prod. 2018, 177, 589–596. [Google Scholar] [CrossRef]
- Matsumoto, K. Climate change impacts on socioeconomic activities through labor productivity changes considering interactions between socioeconomic and climate systems. J. Clean. Prod. 2018, 216, 528–541. [Google Scholar] [CrossRef]
- Goksu, I. Bibliometric mapping of mobile learning. Telemat. Inform. 2021, 56, 101491. [Google Scholar] [CrossRef]
- Faver, C.A.; Muñoz, J.D. Environmental Concern and Action: A View from the Border. J. Hum. Behav. Soc. Environ. 2013, 23, 345–355. [Google Scholar] [CrossRef]
- Miller, S.E.; Hayward, R.A. Social work education’s role in addressing people and a planet at risk. Soc. Work Educ. 2014, 33, 280–295. [Google Scholar] [CrossRef]

Publisher’s Note: MDPI stays neutral with regard to jurisdictional claims in published maps and institutional affiliations. |
© 2022 by the authors. Licensee MDPI, Basel, Switzerland. This article is an open access article distributed under the terms and conditions of the Creative Commons Attribution (CC BY) license (https://creativecommons.org/licenses/by/4.0/).