
An Experimental and Modeling Study on the Effect of Wall Opening Location on the Under-Ventilated Compartment Fire


Abstract
:1. Introduction
2. Method
2.1. Experiments
- (a)
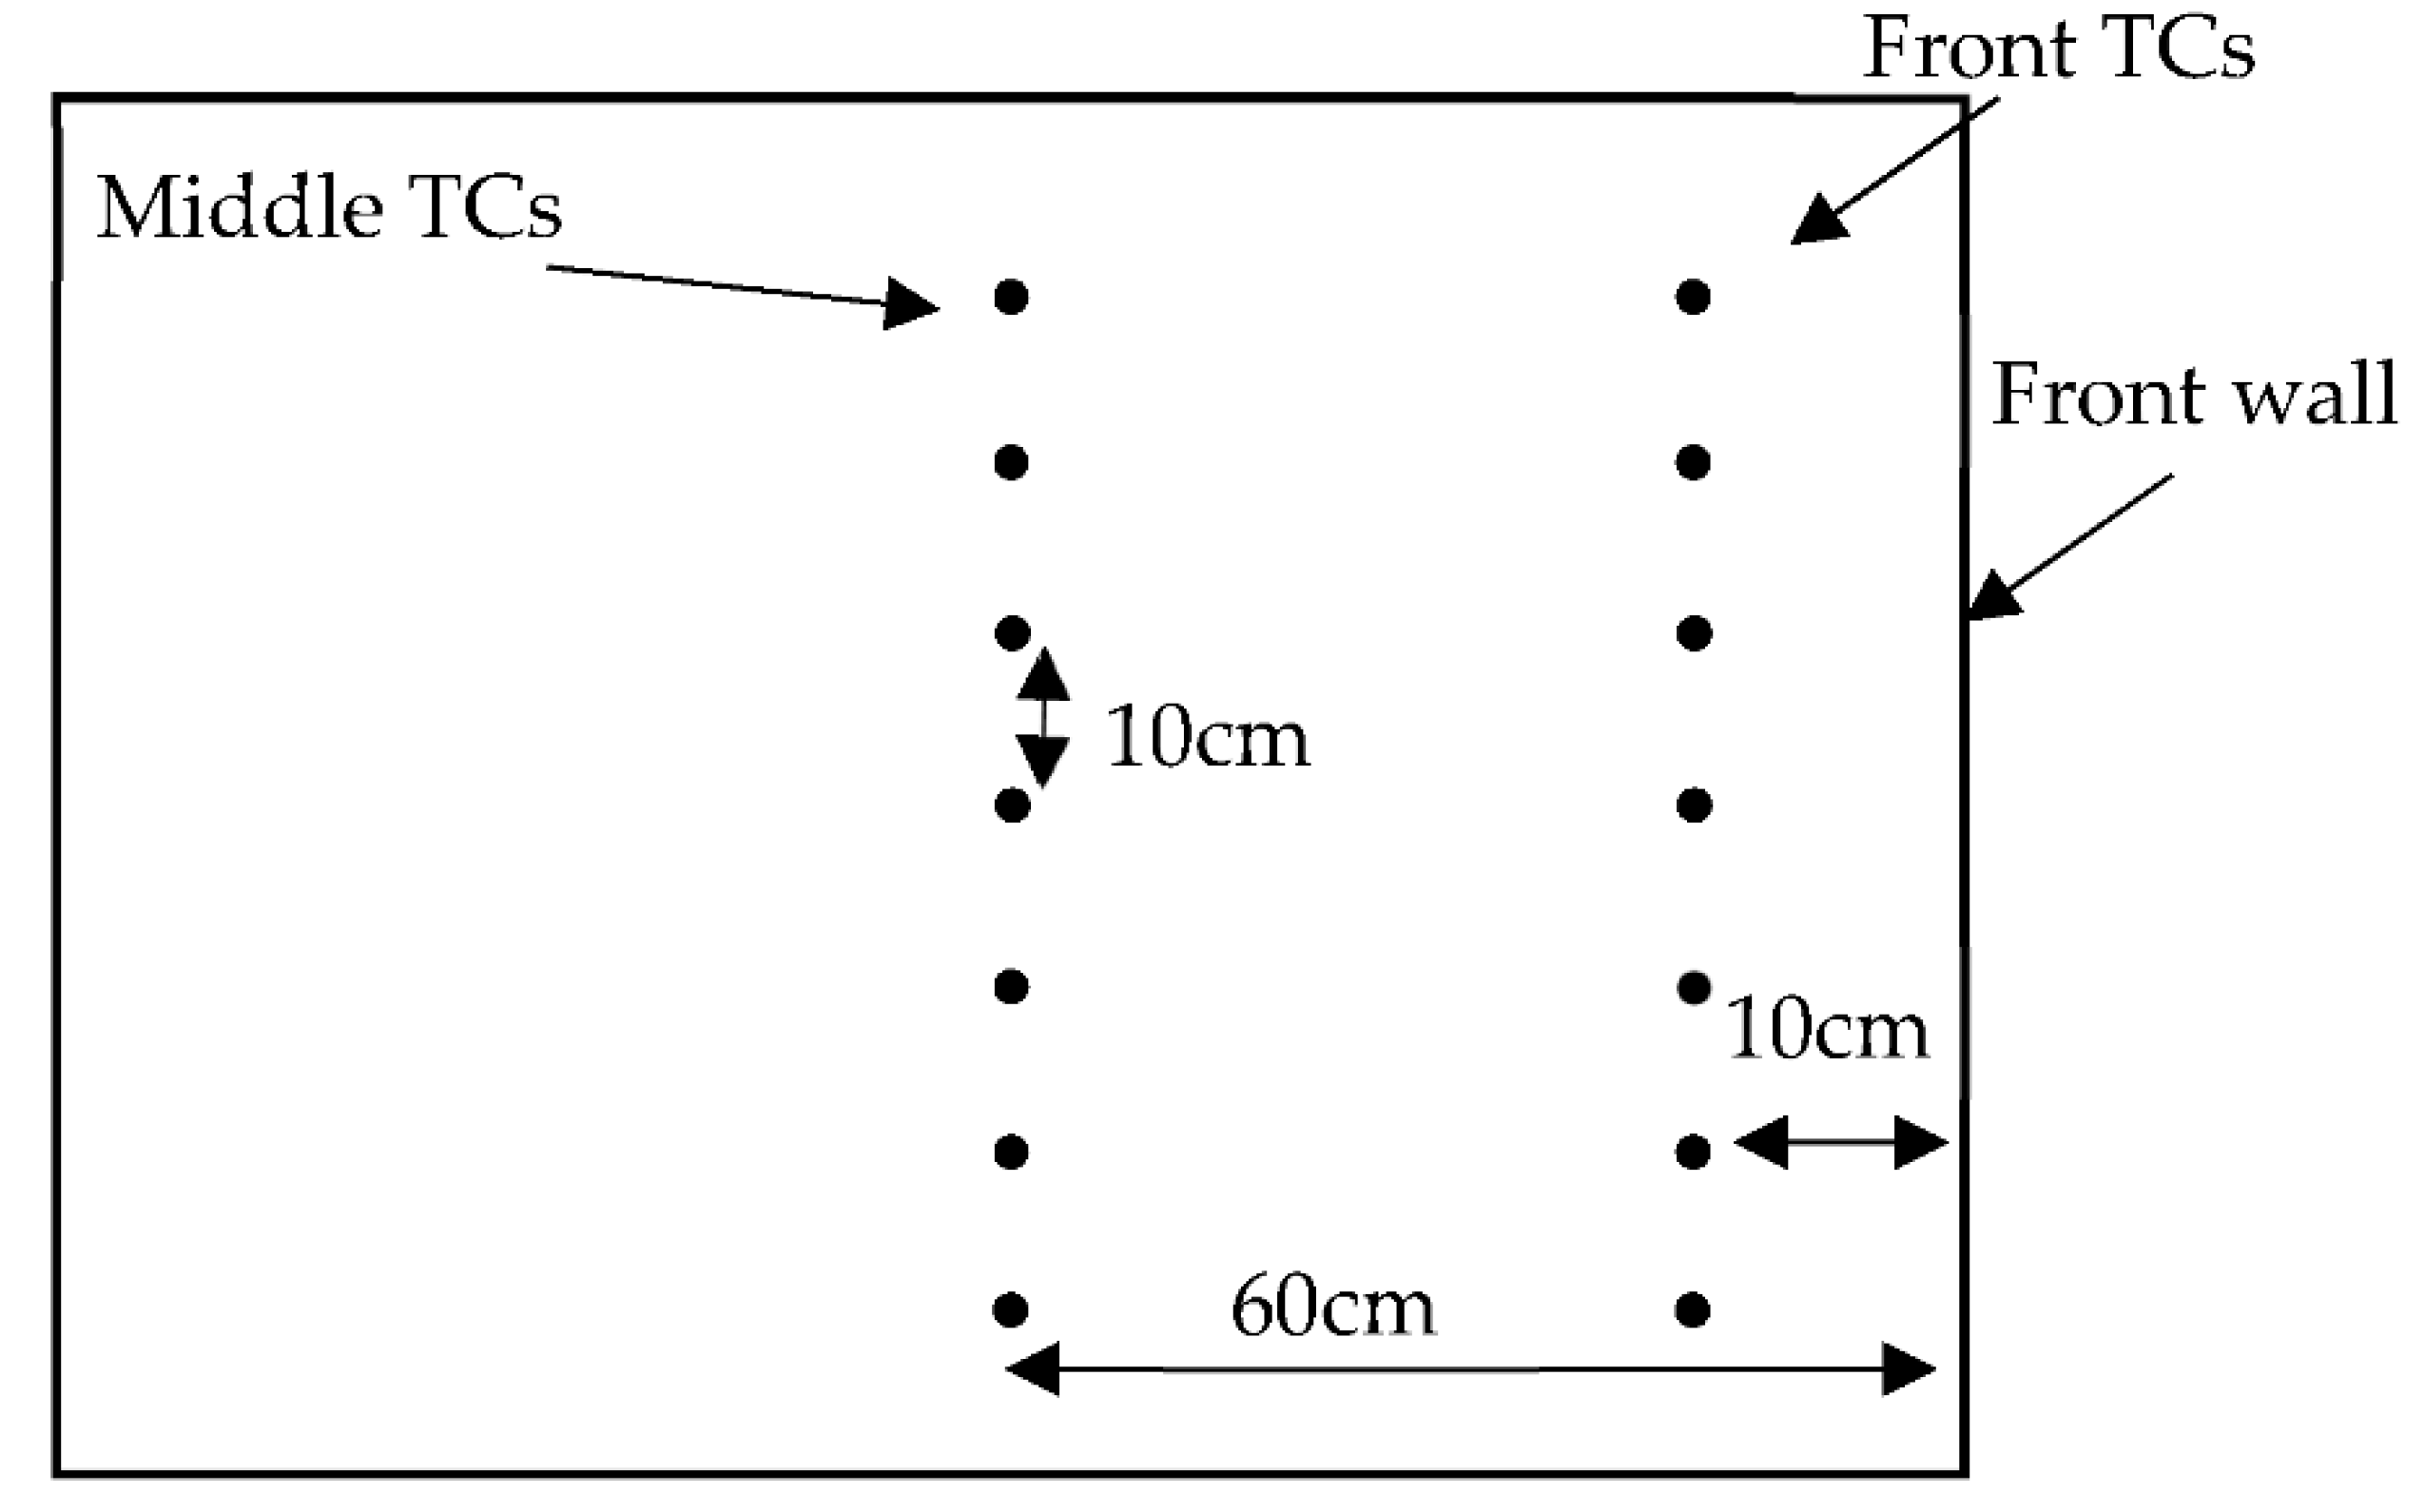
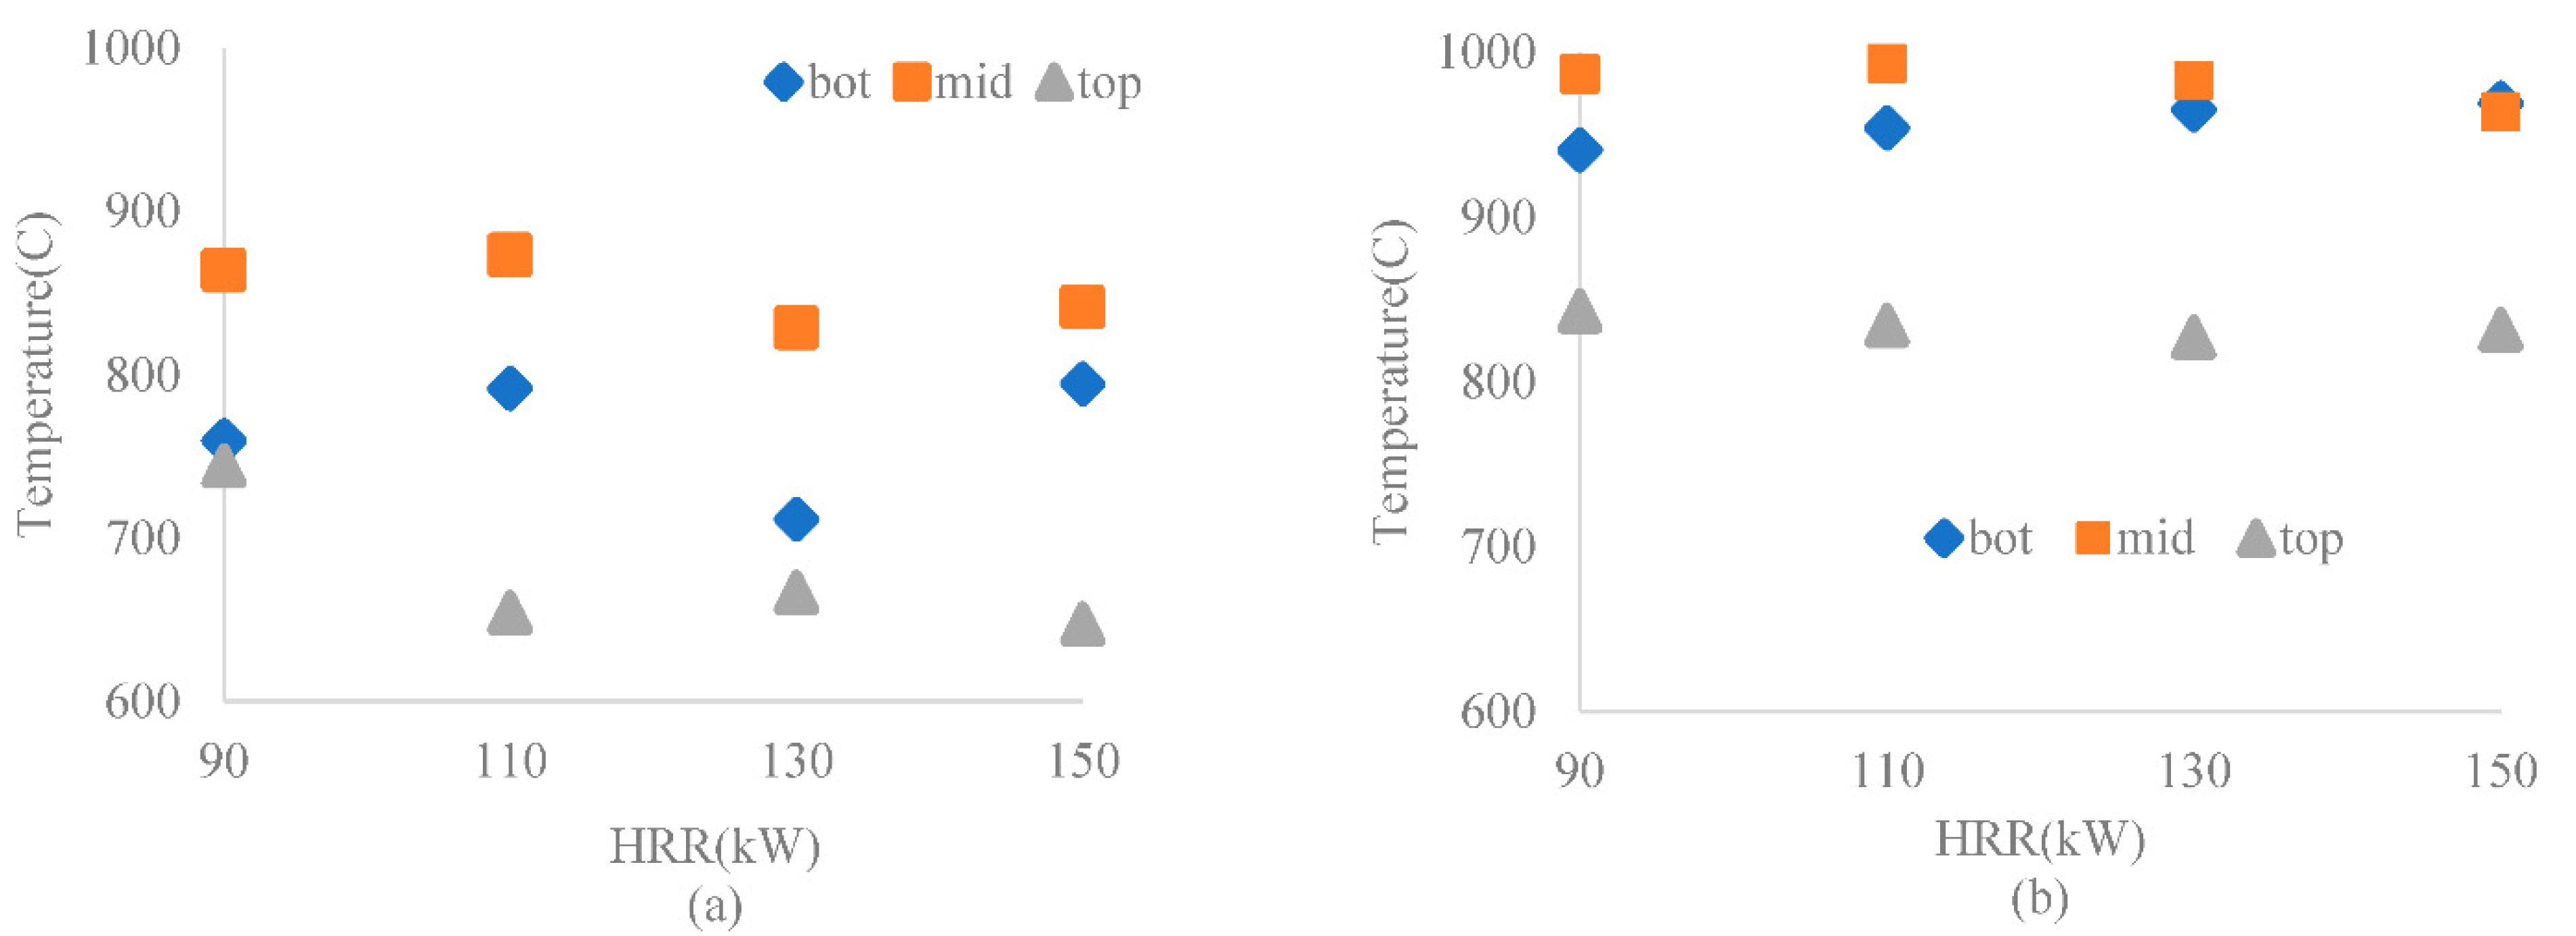
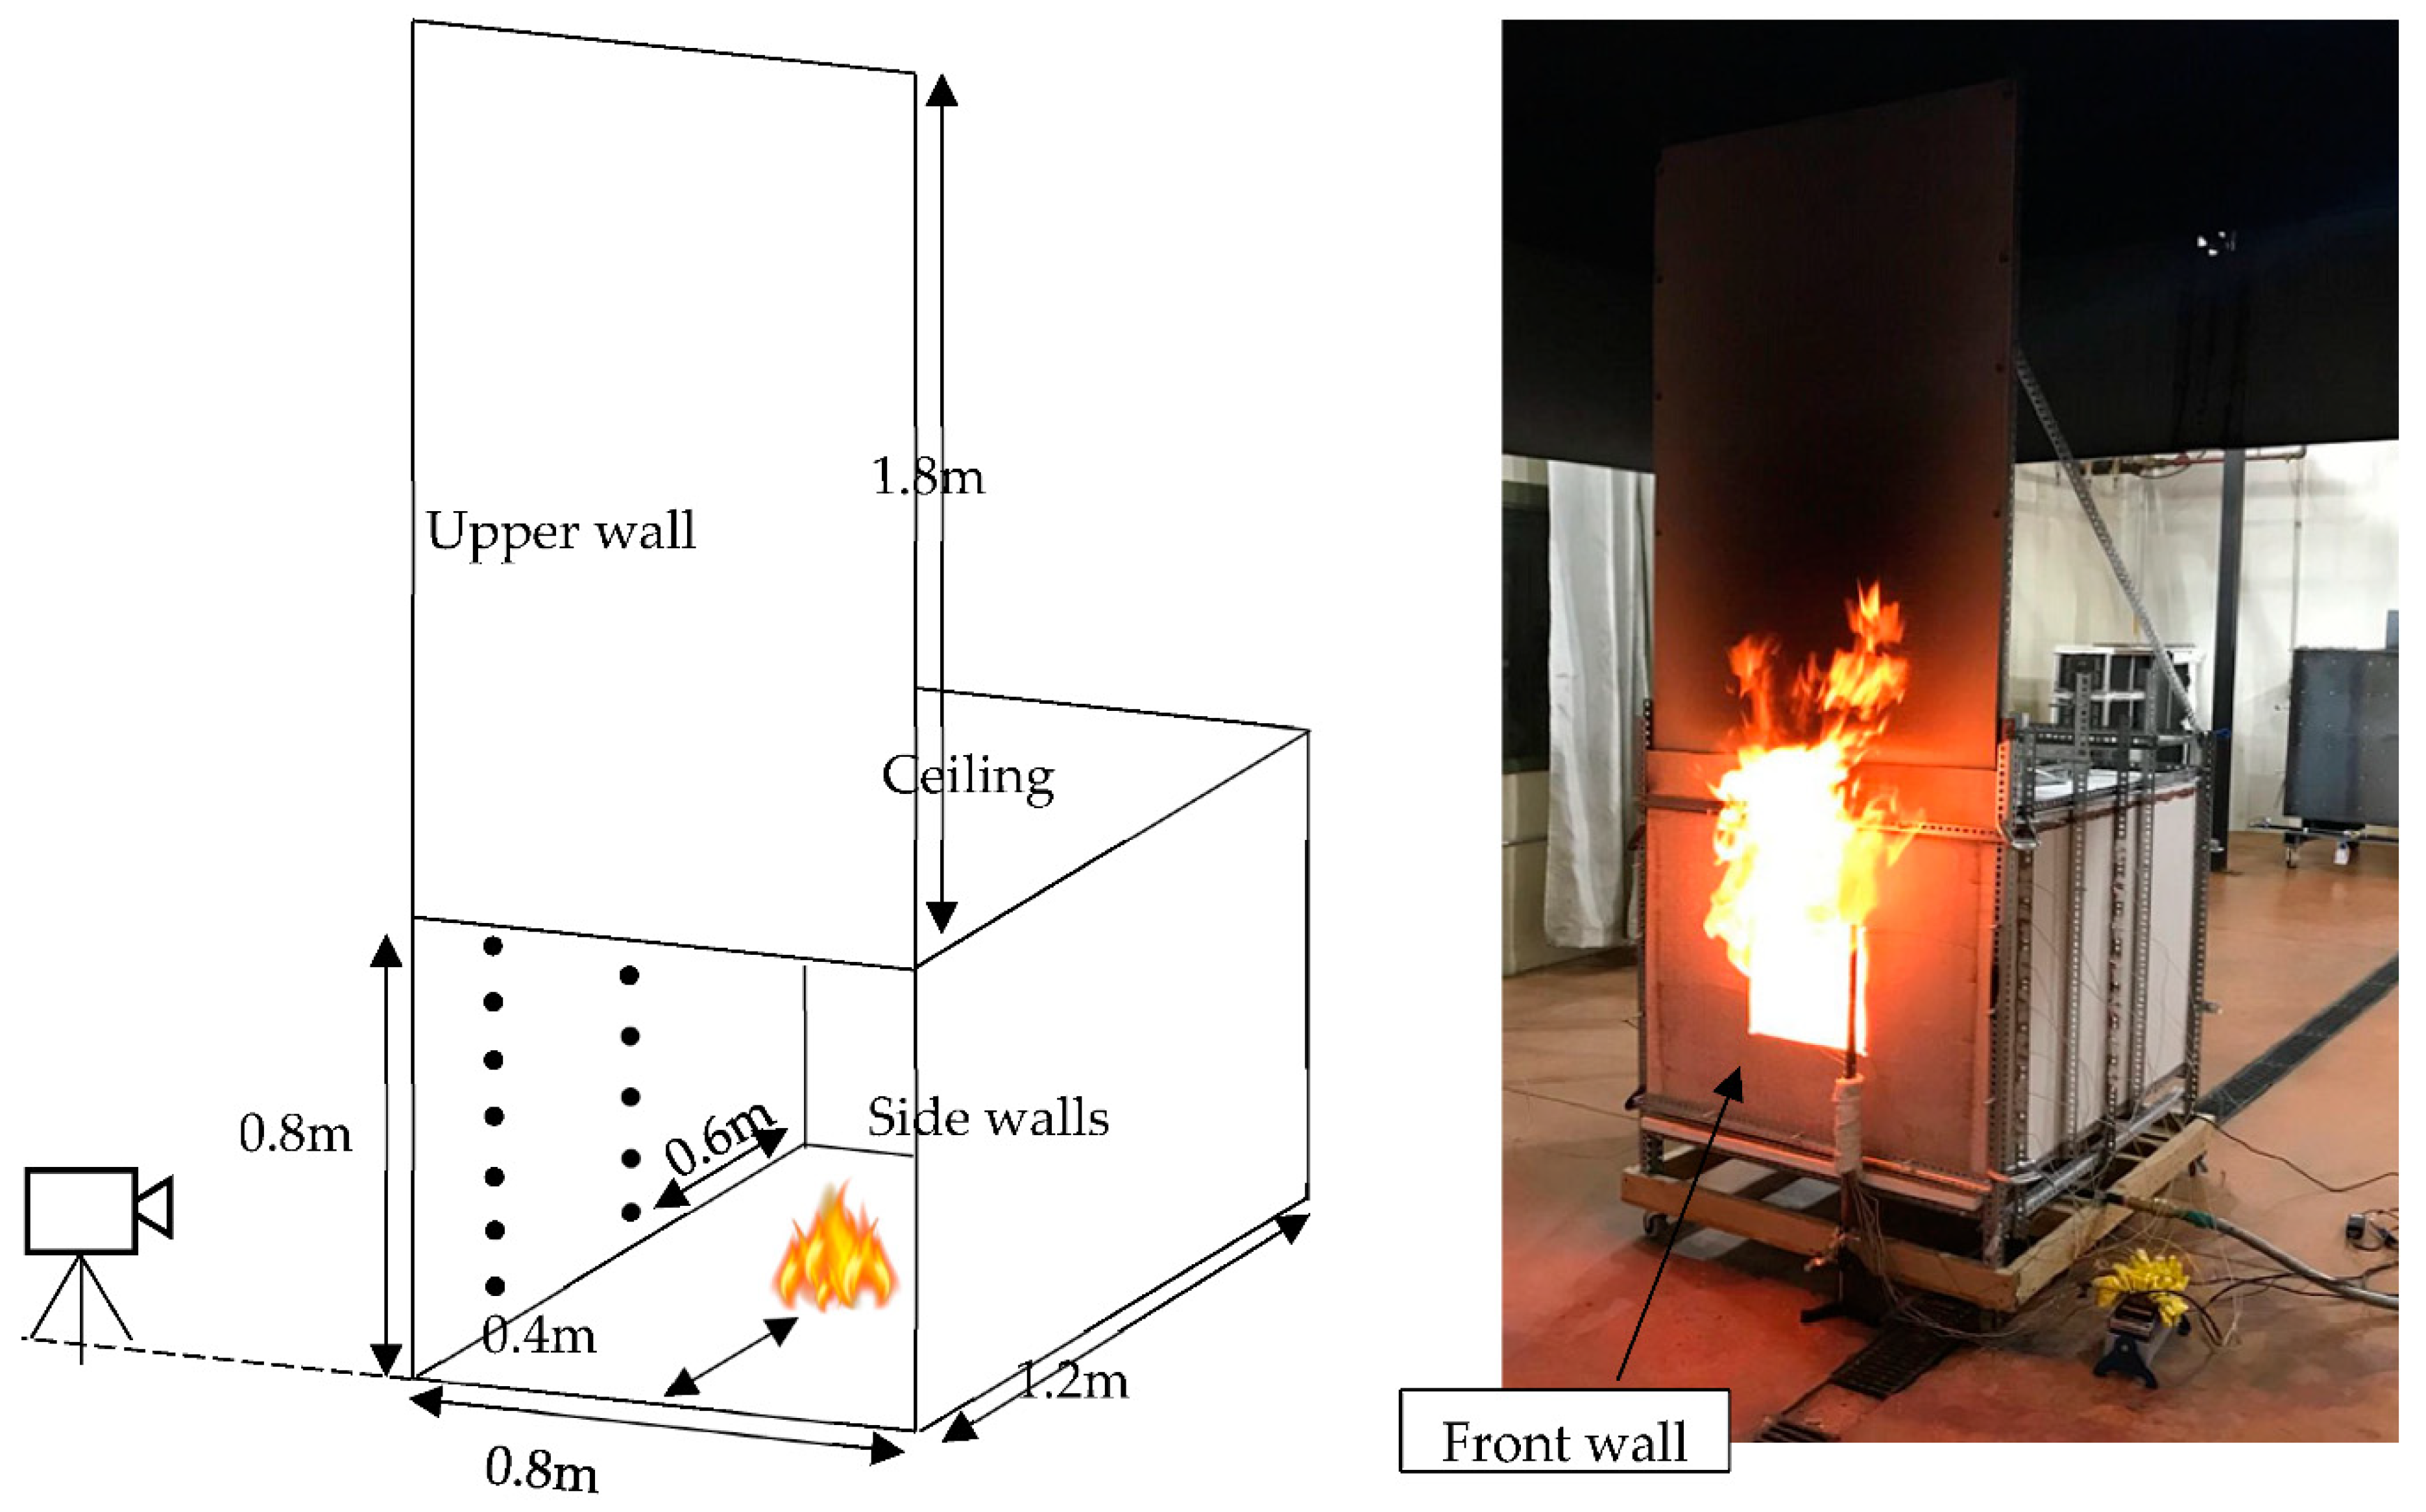
- The compartment gas temperature was measured using a total of 14 K-type thermocouples (TC), as shown in Figure 5. The front TCs and the middle TCs were 10 cm and 60 cm away from the front wall, respectively. The TC beads were located 5 cm away from the interior wall surface. As the compartment fire reaches a steady-state, the gas temperature inside the compartment also becomes relatively uniform [2,17]. For further analysis, the average value of the 14 TCs was used to represent the compartment temperature.
- (b)
- The external flames were captured using a charged-coupled device (CCD) camera, and the flame height was calculated using an in-house MATLAB code [23]. For accurate flame region extraction, a thick black cloth was located in the background for the video data. One image per second was sampled from the video data. A threshold value to discern the flame region from the rest of the image area was first determined by the authors based on three randomly selected flame images, and all the sampled images were subjected to the threshold value. This produced black and white imaging from the videos, as shown in Figure 6. The white area shows the flame shape. The pixels between the highest white point and the lowest white point were counted at each frame and 50% intermittency was used to calculate the flame height.
- (c)
- HRR was measured using an oxygen depletion calorimeter. The calorimeter was first calibrated against a propane gas flow meter at the four different fire sizes mentioned previously.
2.2. FDS Computer Modeling
- (a)
- Two HRR devices were located in the FDS model, one inside (), and the other outside () the compartment. This is one of the major advantages of computer modeling, as there are no accurate means to individually measure the HRR inside and outside the compartment in experiments.
- (b)
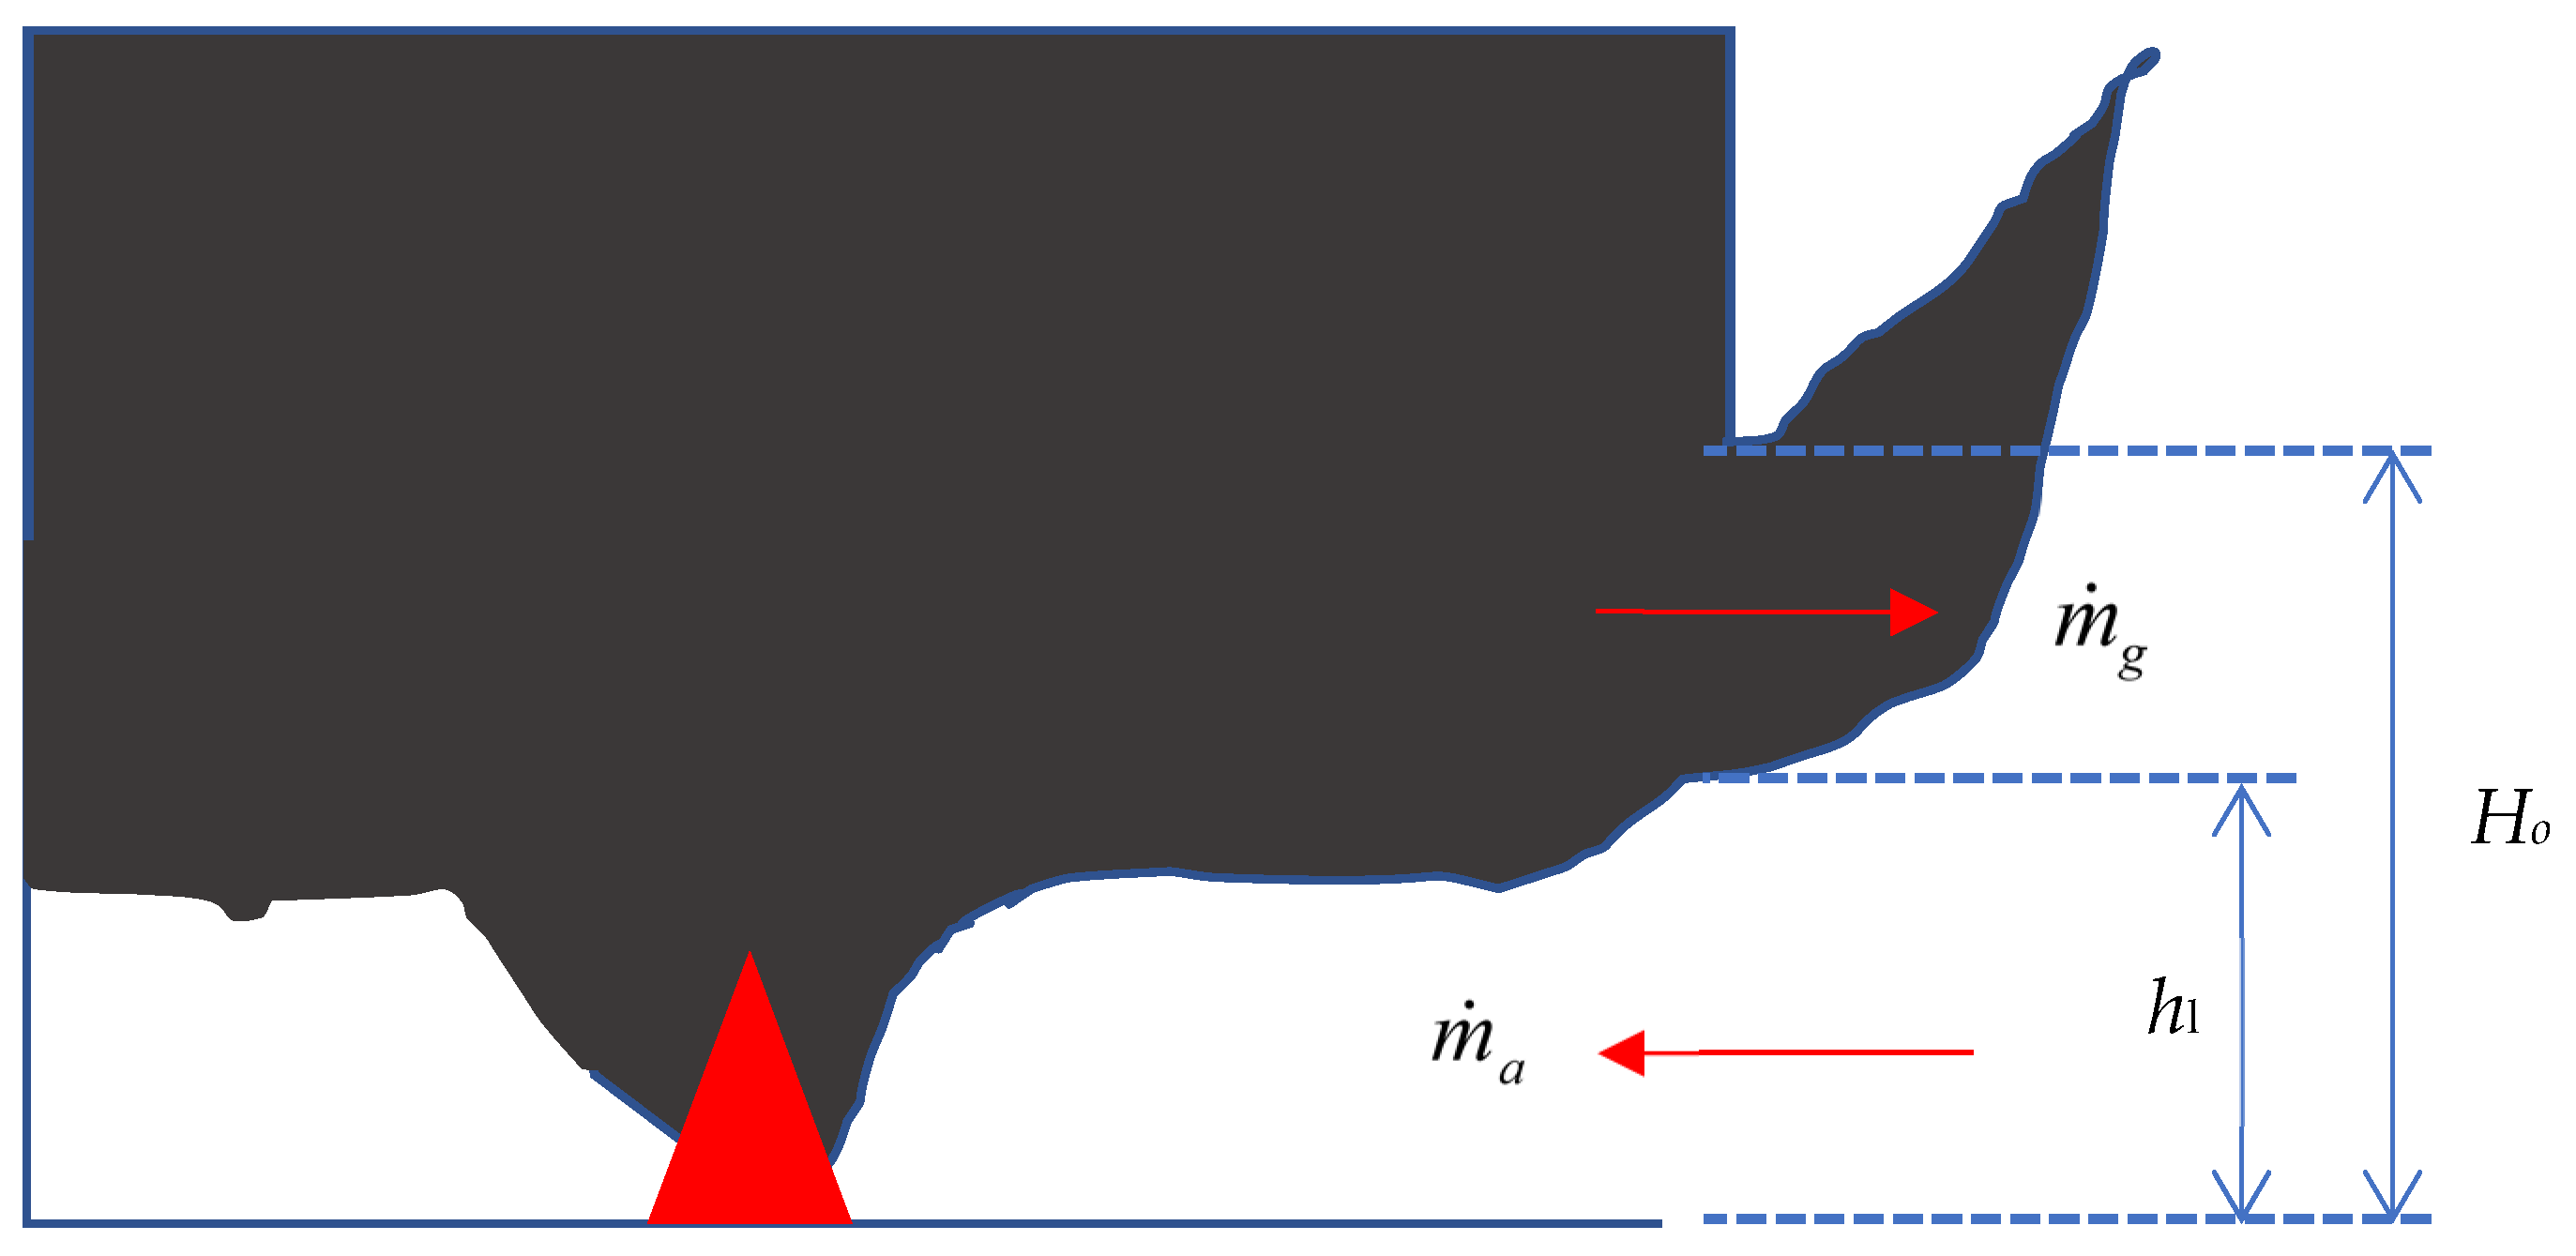
- In order to analyze the combustion reaction inside and outside of the compartment, substances in the inflow and the outflow through the opening need to be identified. Flow devices were located at the opening in the FDS model to calculate the bidirectional mass flow rates of the following substances: total mass flow, air, oxygen, fuel, product, CO2, CO, N2, water vapor, unburn fuel gas (propane), and soot.
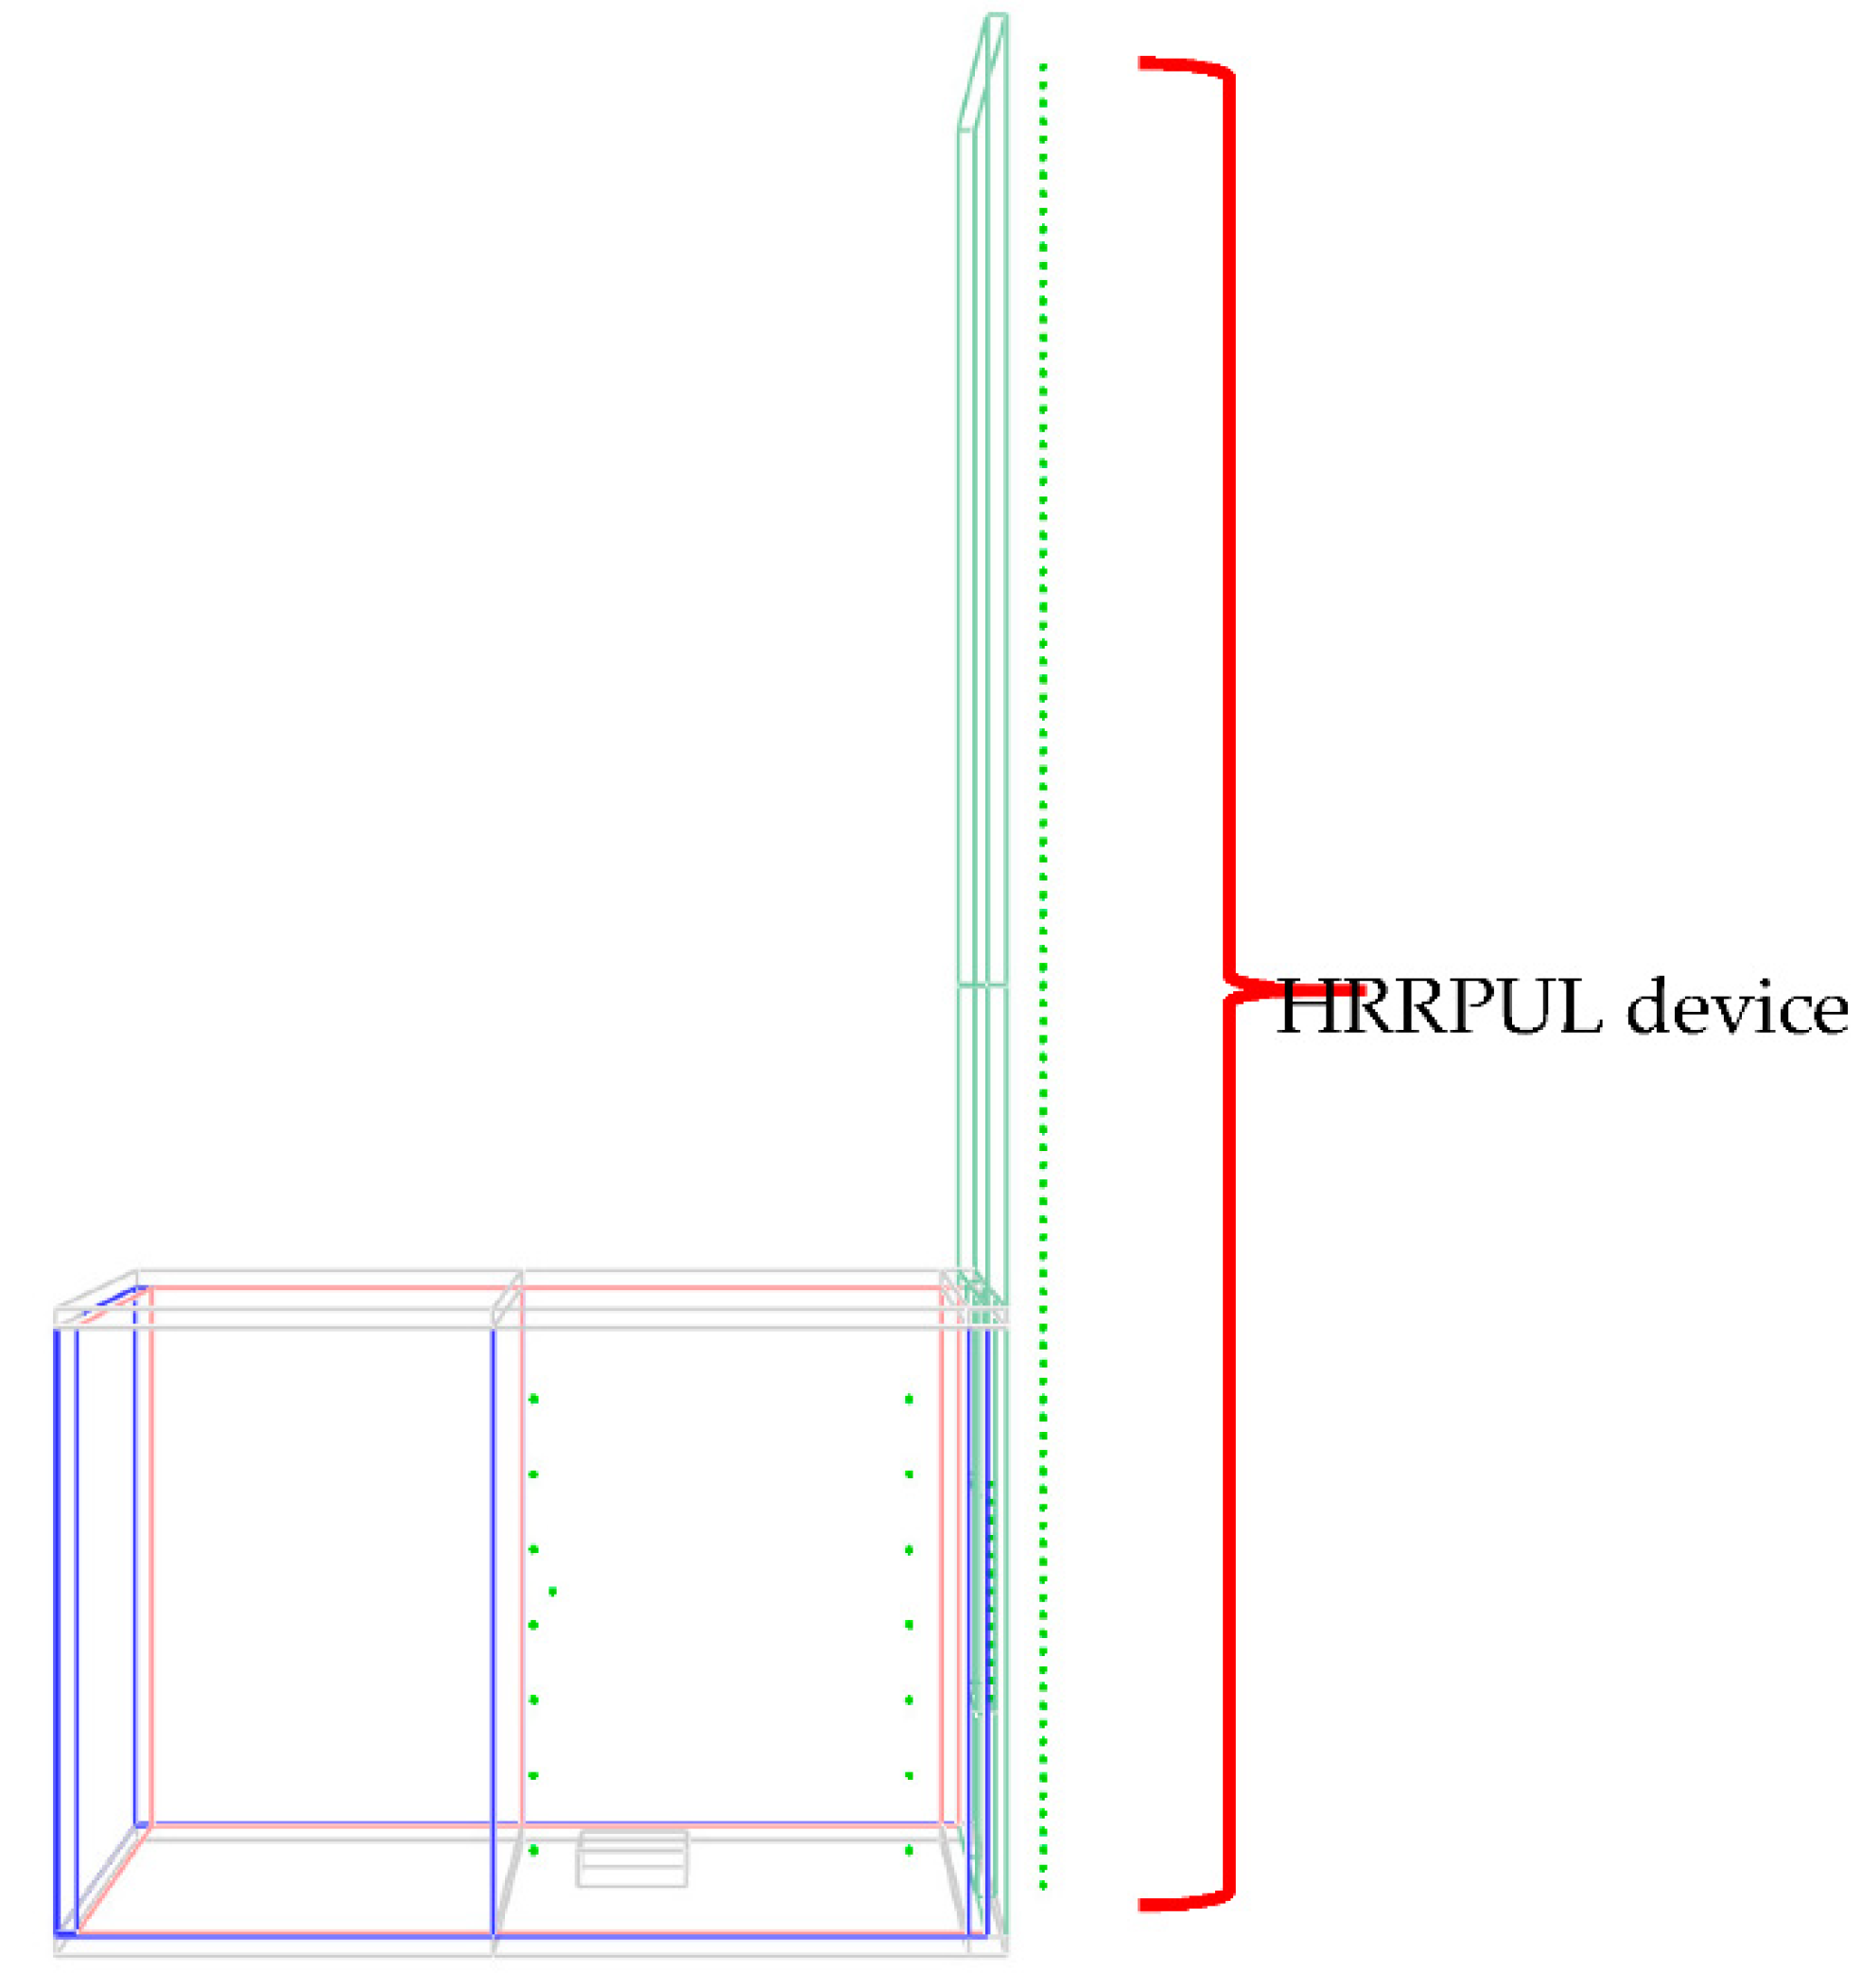
- (c)
- The external flame height () was determined by the heat release rate per unit length (HRRPUL) device. The HRRPUL device calculates the time-averaged heat release rate at the device height. As indicated in Figure 7, an HRRPUL device was inserted into each grid cell from the bottom of the compartment to the top of the front panel. The outputs were integrated from the bottom to the top until the integrated value reached 99% of the input HRR used for simulation and the top device’s location is considered to be the flame tip location [29]. The neutral plane height was calculated based on Equation (1), and flame height was determined from the neutral plane to the flame tip.
2.3. Test Matrix
2.4. Steady-State Data Extraction
3. Results
3.1. Experiment Results
3.2. FDS Results and Analysis
4. Discussion
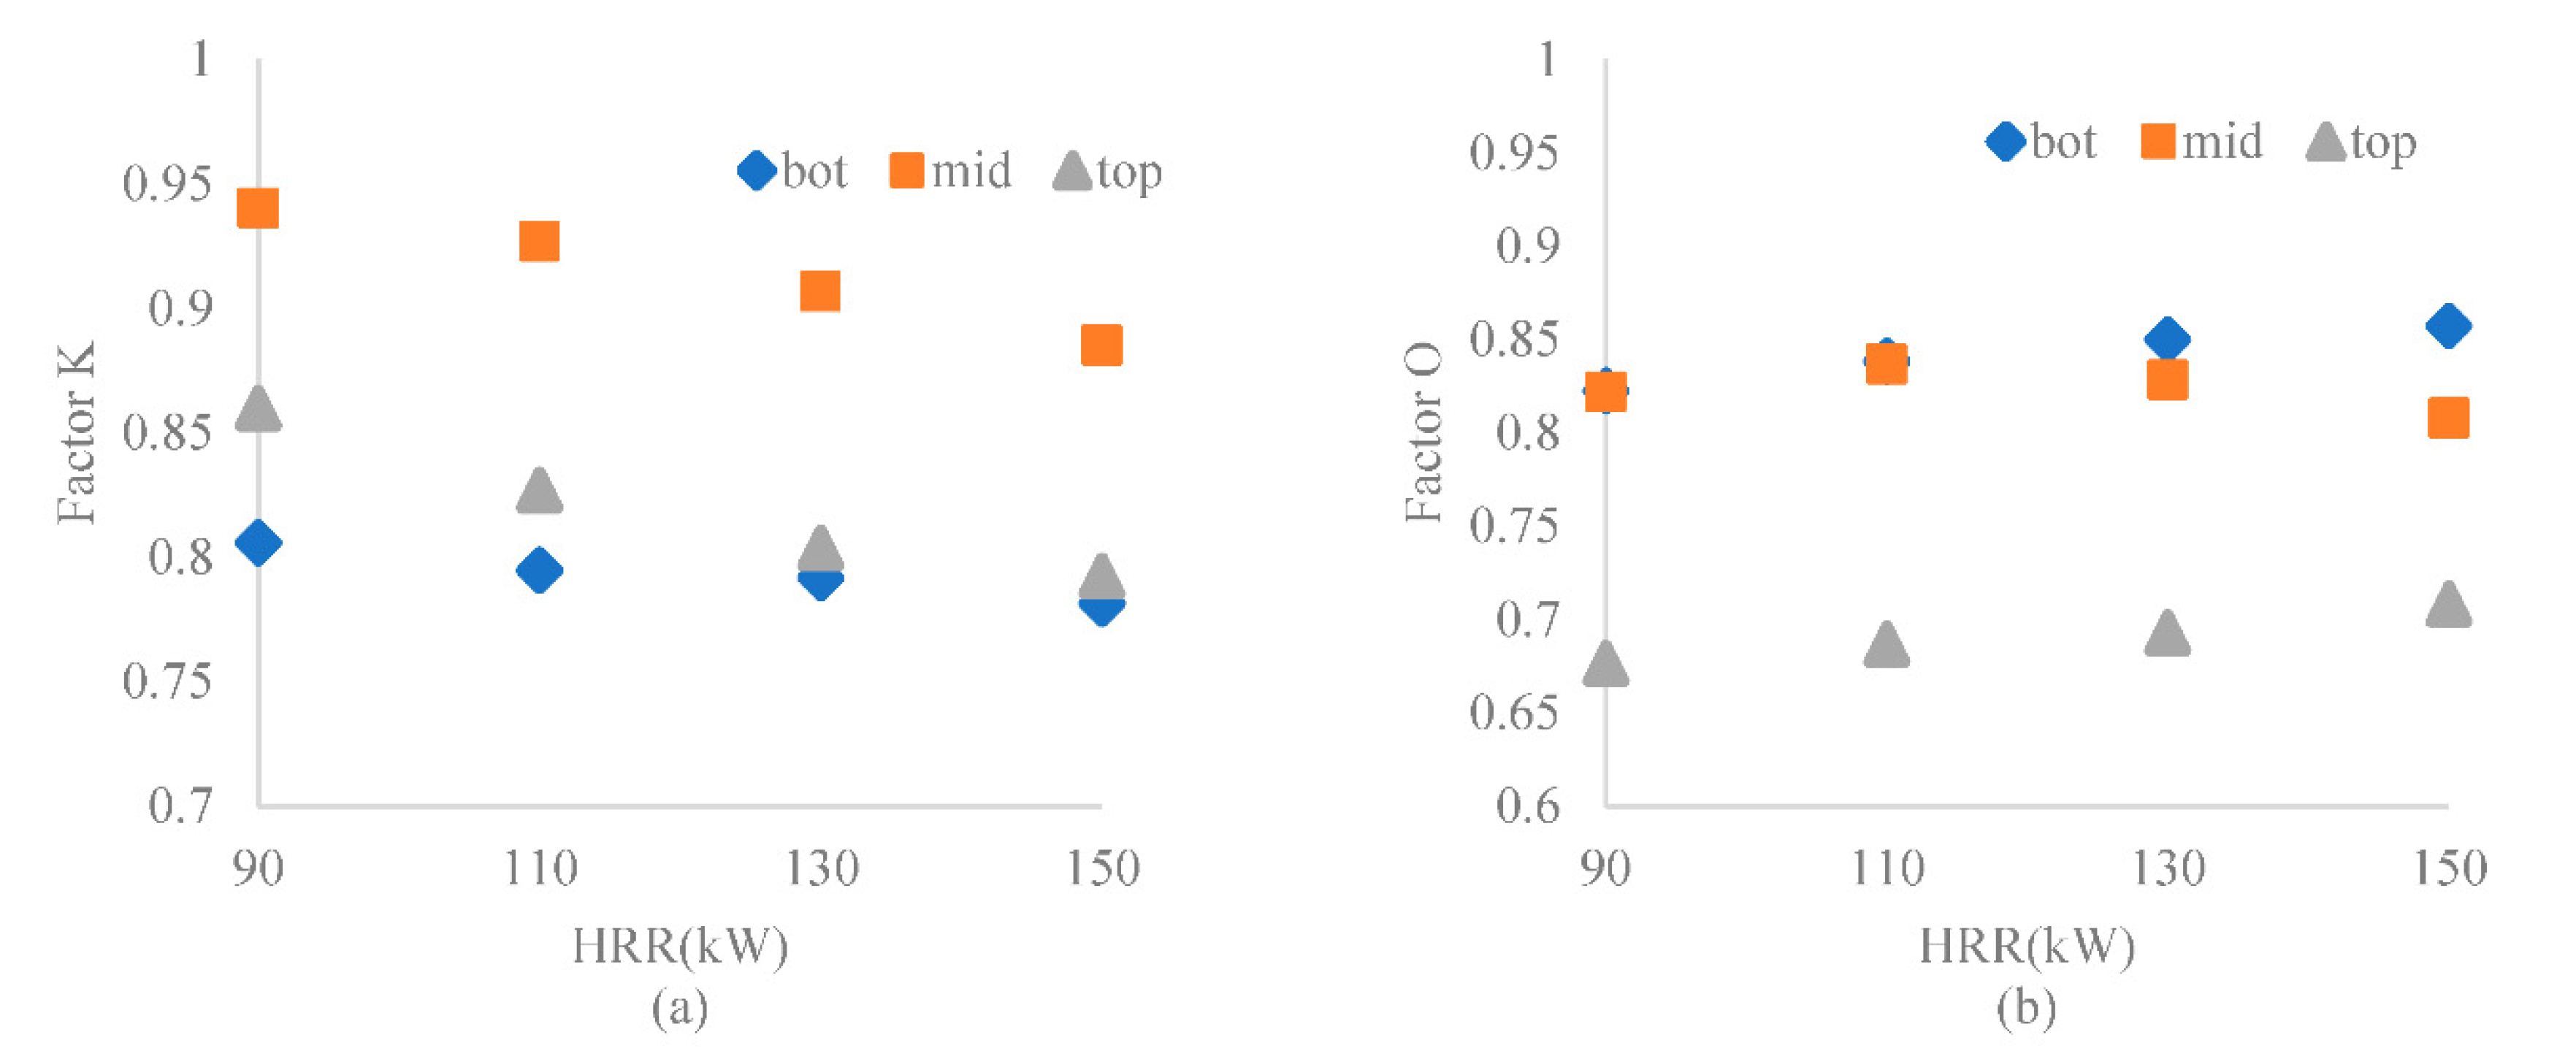
4.1. Factor K
4.2. Factor O
4.3. Updated Mass Flow Diagram for a Compartment Fire
5. Conclusions
Author Contributions
Funding
Conflicts of Interest
Nomenclature
| Opening area (m2) | |
| Drag coefficient | |
| df | Density factor |
| Gravitational acceleration (m/s2) | |
| Neutral plane height from the bottom of the opening (m) | |
| External flame height (m) | |
| Opening height (m) | |
| Mass flow rate of combustion products out of the compartment (kg/s) | |
| Mass flow rate of air into the compartment (kg/s) | |
| Mass flow rate of air into the compartment based on existing equations (kg/s) | |
| Mass flow rate of air into the compartment, determined by FDS (kg/s) | |
| Mass flow rate of unreacted air leaving the compartment (kg/s) | |
| Mass flow rate of combustion products leaving the compartment, including nitrogen (kg/s) | |
| Mass flow rate of entrained gases to the inflow from the outflow (kg/s) | |
| Mass flow rate of entrained air to the outflow from the inflow (kg/s) | |
| Net mass flow rate of gases contributing to external flame (kg/s) | |
| Mass flow rate of gases entering the compartment (kg/s) | |
| Mass consumption rate of oxygen (kg/s) | |
| Mass flow rate of oxygen into the compartment, determined by FDS (kg/s) | |
| Mass flow rate of gases leaving the compartment (kg/s) | |
| Mass flow rate of unburned fuel leaving the compartment (kg/s) | |
| Critical heat release rate inside the compartment (kW) | |
| Heat release rate inside the compartment, determined by FDS (kW) | |
| Total heat release rate (kW) | |
| Heat release rate outside the compartment, determined by FDS (kW) | |
| Ambient air temperature (K) | |
| Upper gas layer temperature in the compartment (K) | |
| Average gas temperature in the compartment(K) | |
| Opening width (m) | |
| Mass fraction of oxygen in the air | |
| α | Fraction of to |
| β | Fraction of to |
| Ambient air density (kg/m3) | |
| Density of gases in the compartment (kg/m3) |
References
- Utiskul, Y.; Quintiere, J.G.; Rangwala, A.S.; Ringwelski, B.A.; Wakatsuki, K.; Naruse, T. Compartment fire phenomena under limited ventilation. Fire Saf. J. 2005, 40, 367–390. [Google Scholar] [CrossRef]
- Delichatsios, M.A.; Silcock, G.W.; Liu, X.; Delichatsios, M.; Lee, Y.-P. Mass pyrolysis rates and excess pyrolysate in fully developed enclosure fires. Fire Saf. J. 2004, 39, 1–21. [Google Scholar] [CrossRef]
- Yokoi, S. Study on the Prevention of Fire-Spread Caused by Hot Upward Current; BRI Report; Building Research Institute, Ministry of Construction of Japan: Tokyo, Japan, 1960; p. 34. [Google Scholar]
- Ren, F.; Zhang, X.; Hu, L.; Sun, X. An experimental study on the effect of fire growth in a lower-floor compartment on fire evolution and facade flame ejection from an upper-floor compartment. Proc. Combust. Inst. 2019, 37, 3909–3917. [Google Scholar] [CrossRef]
- Lee, Y.-P.; Delichatsios, M.A.; Silcock, G.W.H. Heat fluxes and flame heights in façades from fires in enclosures of varying geometry. Proc. Combust. Inst. 2007, 31, 2521–2528. [Google Scholar] [CrossRef]
- Lee, Y.-P.; Delichatsios, M.; Ohmiya, Y. The physics of the outflow from the opening of an enclosure fire and re-examination of Yokoi s correlation. Fire Saf. J. 2012, 49, 82–88. [Google Scholar] [CrossRef]
- Lee, Y.-P.; Delichatsios, M.A.; Ohmiya, Y. The study for the physics of the outflow from the opening of a burning enclosure. In Proceedings of the 5th International Seminar on Fire and Explosion Hazards, Citeseer, Edinburgh, UK, 23–27 April 2007; p. 27. [Google Scholar]
- Himoto, K.; Tsuchihashi, T.; Tanaka, Y.; Tanaka, T. Modeling thermal behaviors of window flame ejected from a fire compartment. Fire Saf. J. 2009, 44, 230–240. [Google Scholar] [CrossRef]
- Quintiere, J.G.; Cleary, T.G. Heat flux from flames to vertical surfaces. Fire Technol. 1994, 30, 209–231. [Google Scholar] [CrossRef]
- Karlsson, B.; Quintiere, J.G. Enclosure Fire Dynamics; CRC Press: Boca Raton, FL, USA, 2000. [Google Scholar]
- Huggett, C. Estimation of rate of heat release by means of oxygen consumption measurements. Fire Mater. 1980, 4, 61–65. [Google Scholar] [CrossRef]
- Johansson, N.; Van Hees, P. A Simplified Relation Between Hot Layer Height and Opening Mass Flow. Fire Saf. Sci. 2014, 11, 432–443. [Google Scholar] [CrossRef]
- Tang, F.; Hu, L.; Qiu, Z.W.; Zhang, X.; Lu, K. Window ejected flame height and heat flux along facade with air entrainment constraint by a sloping facing wall. Fire Saf. J. 2015, 71, 248–256. [Google Scholar] [CrossRef]
- Huang, H.; Ooka, R.; Liu, N.; Zhang, L.; Deng, Z.; Kato, S. Experimental study of fire growth in a reduced-scale compartment under different approaching external wind conditions. Fire Saf. J. 2009, 44, 311–321. [Google Scholar] [CrossRef]
- Ren, F.; Hu, L.; Sun, X.; Hu, K. An experimental study on vertical temperature profile of facade fire plume ejected from compartment with an opening subjected to external wind normal to facade. Int. J. Therm. Sci. 2018, 130, 94–99. [Google Scholar] [CrossRef]
- Zhang, X.; Zhang, Z.; Zhang, Z.; Xu, W.; Luo, Q.; Tao, H.; Li, X. Experimental investigation of compartment fires with circular opening: From the aspects of internal temperature and facade flame. Combust. Flame 2020, 213, 107–116. [Google Scholar] [CrossRef]
- Delichatsios, M.A.; Lee, Y.-P.; Tofilo, P. A new correlation for gas temperature inside a burning enclosure. Fire Saf. J. 2009, 44, 1003–1009. [Google Scholar] [CrossRef]
- Sun, X.; Hu, L.; Yang, Y.; Ren, F.; Fang, X. Evolutions of gas temperature inside fire compartment and external facade flame height with a casement window. J. Hazard. Mater. 2020, 381, 120913. [Google Scholar] [CrossRef]
- Sun, X.; Hu, L.; Zhang, X.; Ren, F. Experimental study on evolution of compartment fire and facade flame through an opening with the fire source attached to a backwall at different elevations. Proc. Combust. Inst. 2019, 37, 3919–3926. [Google Scholar] [CrossRef]
- Snegirev, A.Y.; Makhviladze, G.M.; Talalov, V.A.; Shamshin, A.V. Turbulent Diffusion Combustion under Conditions of Limited Ventilation: Flame Projection through an Opening. Combust. Explos. Shock Waves 2003, 39, 1–10. [Google Scholar] [CrossRef]
- Takeda, H.; Akita, K. Critical phenomenon in compartment fires with liquid fuels. Symp. (Int.) Combust. 1981, 18, 519–527. [Google Scholar] [CrossRef]
- Tang, F.; Hu, L.; Delichatsios, M.A.; Lu, K.; Zhu, W. Experimental study on flame height and temperature profile of buoyant window spill plume from an under-ventilated compartment fire. Int. J. Heat Mass Transf. 2012, 55, 93–101. [Google Scholar] [CrossRef]
- Frank, K.; Park, H.; Baker, G.; Wade, C. SR360 Vertical External Fire Spread from Flames Extending out of an Opening; Study Report; BRANZ; Ministry of Business Innovation & Employment: Wellington, New Zealand, 2018. [Google Scholar]
- Lu, K.; Wang, Z.; Ding, Y.; Wang, J.; Zhang, J.; Delichatsios, M.A.; Hu, L. Flame behavior from an opening at different elevations on the facade wall of a fire compartment. Proc. Combust. Inst. 2020, 38, 4551–4559. [Google Scholar] [CrossRef]
- Hu, L.; Liu, S.; Xu, Y.; Li, D. A wind tunnel experimental study on burning rate enhancement behavior of gasoline pool fires by cross air flow. Combust. Flame 2011, 158, 586–591. [Google Scholar] [CrossRef]
- Hu, L.; Liu, S.; Wu, L. Flame radiation feedback to fuel surface in medium ethanol and heptane pool fires with cross air flow. Combust. Flame 2013, 160, 295–306. [Google Scholar] [CrossRef]
- Fleischmann, C.; Parkes, A. Effects Of Ventilation On The Compartment Enhanced Mass Loss Rate. Fire Saf. Sci. 1997, 5, 415–426. [Google Scholar] [CrossRef]
- Yang, D.; Hu, L.; Jiang, Y.Q.; Huo, R.; Zhu, S.; Zhao, X. Comparison of FDS predictions by different combustion models with measured data for enclosure fires. Fire Saf. J. 2010, 45, 298–313. [Google Scholar] [CrossRef]
- McGrattan, K.B. Fire Dynamics Simulator (Version 6): Technical Reference Guide; National Institute of Standards and Technology: Gaithersburg, MD, USA, 2021.
- McGrattan, K.B.; Forney, G.P. Fire Dynamics Simulator (Version 6): User’s Guide; National Institute of Standards and Technology: Gaithersburg, MD, USA, 2021.
- Hu, L.; Lu, K.; Delichatsios, M.; He, L.; Tang, F. An experimental investigation and statistical characterization of intermittent flame ejecting behavior of enclosure fires with an opening. Combust. Flame 2012, 159, 1178–1184. [Google Scholar] [CrossRef]


| Parameter | Calcium Silicate Board | Ceramic Fiber Board | Cement Board |
|---|---|---|---|
| Density [kg/m2] | 250 | 18 | 1400 |
| Specific heat [kJ/(kg·K)] | 1.03 | 1.13 | 1.05 |
| Conductivity [W/(m·K)] | 0.05 | 0.8–0.22 (260–1093 °C) | 0.36 |
| Thickness [m] | 0.0254 | 0.0127 | 0.006 |
| Fire Case | Parameters | 1.25 cm Grid | 2.5 cm Grid | 5 cm Grid | % Difference—1.25 vs. 2.5 | % Difference—2.5 vs. 5 |
|---|---|---|---|---|---|---|
| 90 kW with mid. opening | (kW) | 88 | 87 | 80 | 1.1% | 7.8% |
| (kW) | 55 | 54 | 30 | 0.5% | 45% | |
| (C) | 975 | 968 | 652 | 0.7% | 33% | |
| (m) | 0.8 | 0.9 | 0.9 | 13% | 0% | |
| 150 kW with mid. opening | (kW) | 149 | 148 | 140 | 0.9% | 5.41% |
| (kW) | 49 | 45 | 30 | 8.3% | 33% | |
| (C) | 947 | 896 | 676 | 5.4% | 25% | |
| (m) | 1.2 | 1.35 | 1.3 | 13% | 3.9% |
| Heat Release Rate (kW) | Experiment | FDS Modeling |
|---|---|---|
| 90 | E-90-Bot | F-90-Bot |
| E-90-Mid | F-90-Mid | |
| E-90-Top | F-90-Top | |
| 110 | E-110-Bot | F-110-Bot |
| E-110-Mid | F-110-Mid | |
| E-110-Top | F-110-Top | |
| 130 | E-130-Bot | F-130-Bot |
| E-130-Mid | F-130-Mid | |
| E-130-Top | F-130-Top | |
| 150 | E-150-Bot | F-150-Bot |
| E-150-Mid | F-150-Mid | |
| E-150-Top | F-150-Top |
| Trend | |
|---|---|
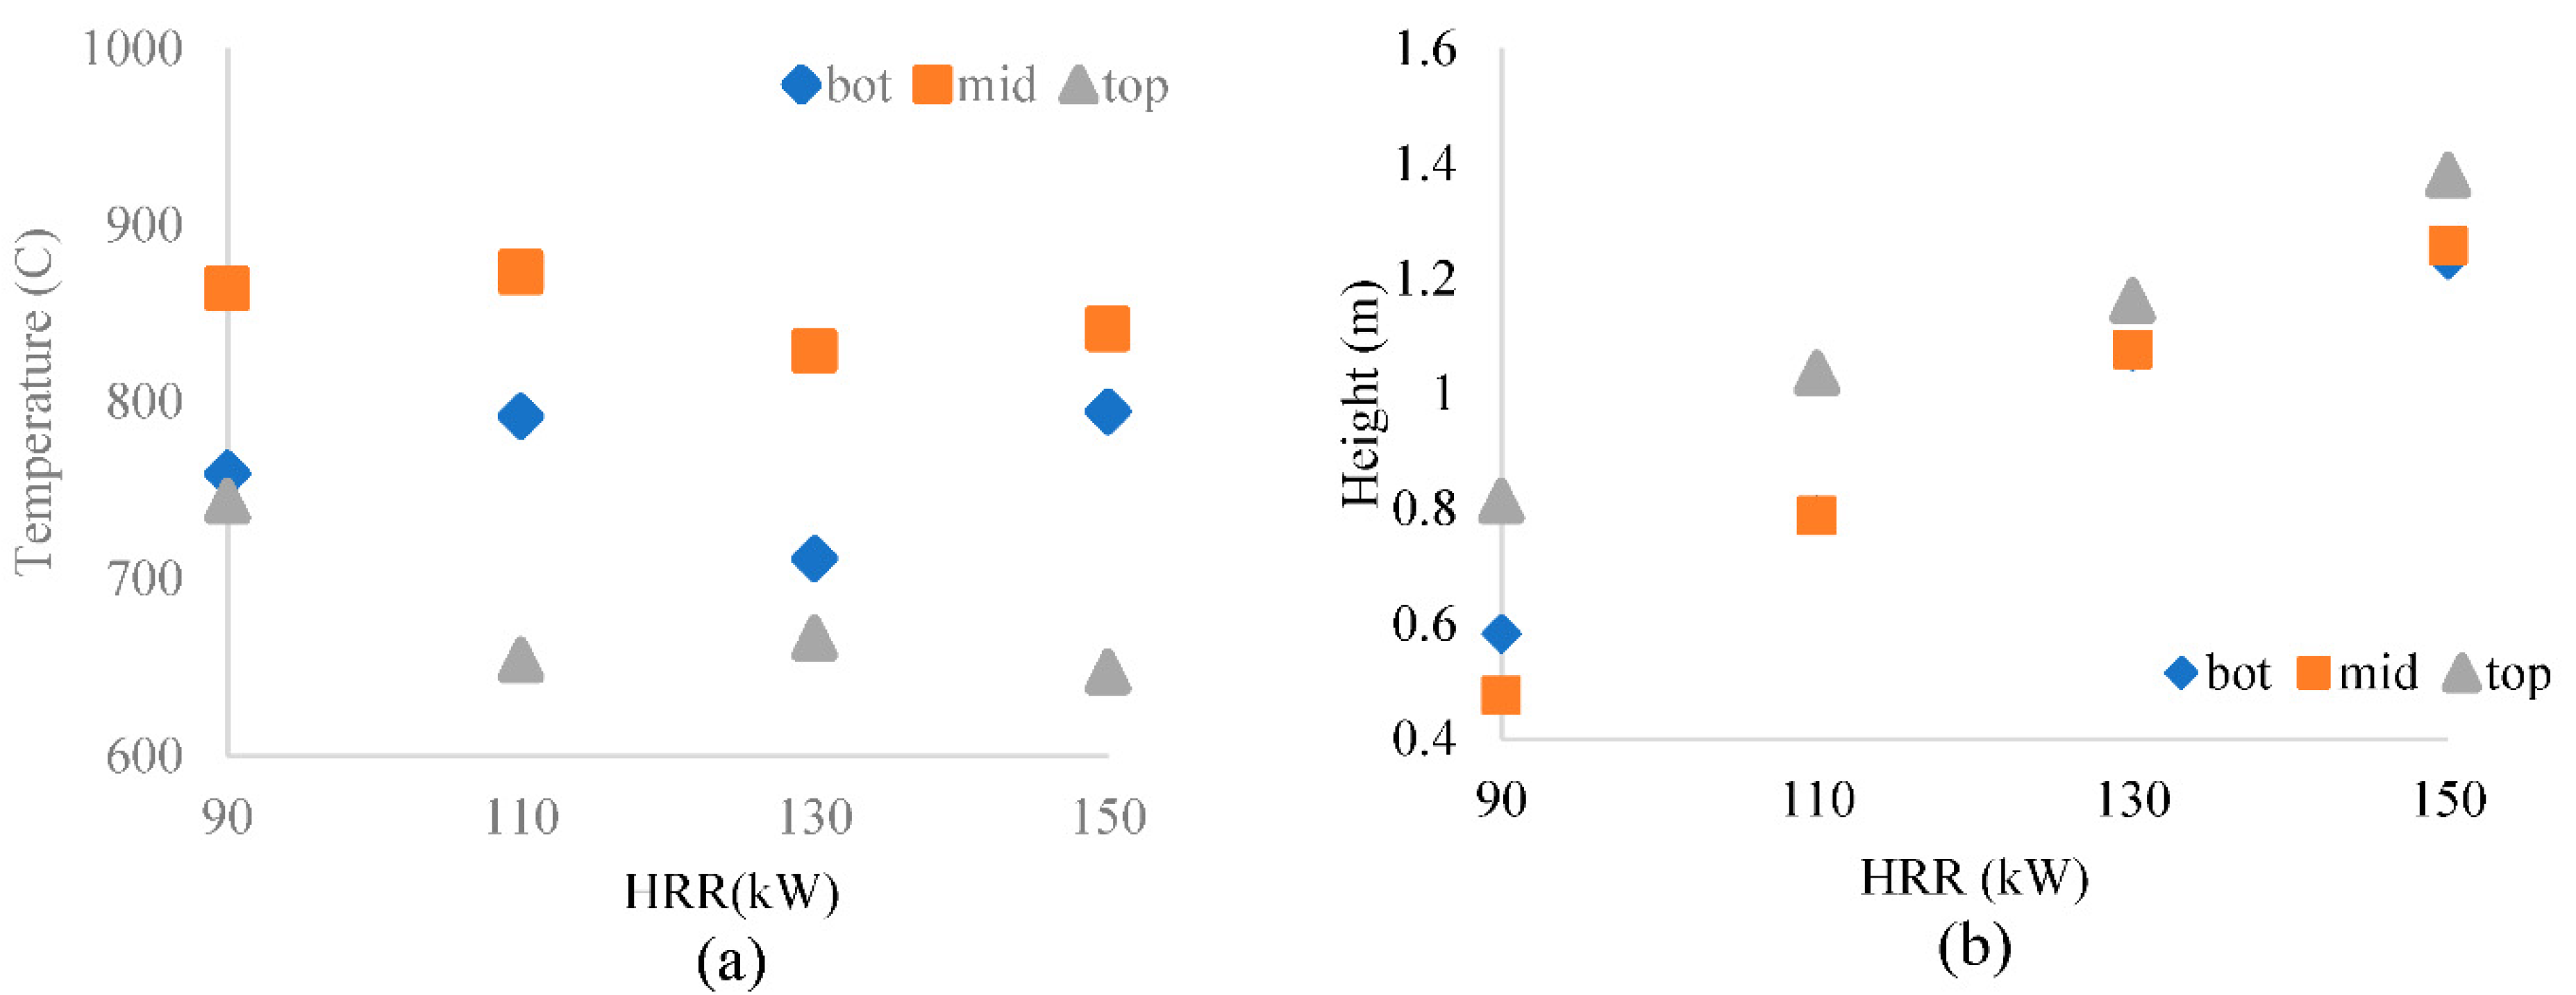
| Compartment gas temperature | Tin_mid > Tin_bot > Tin-top |
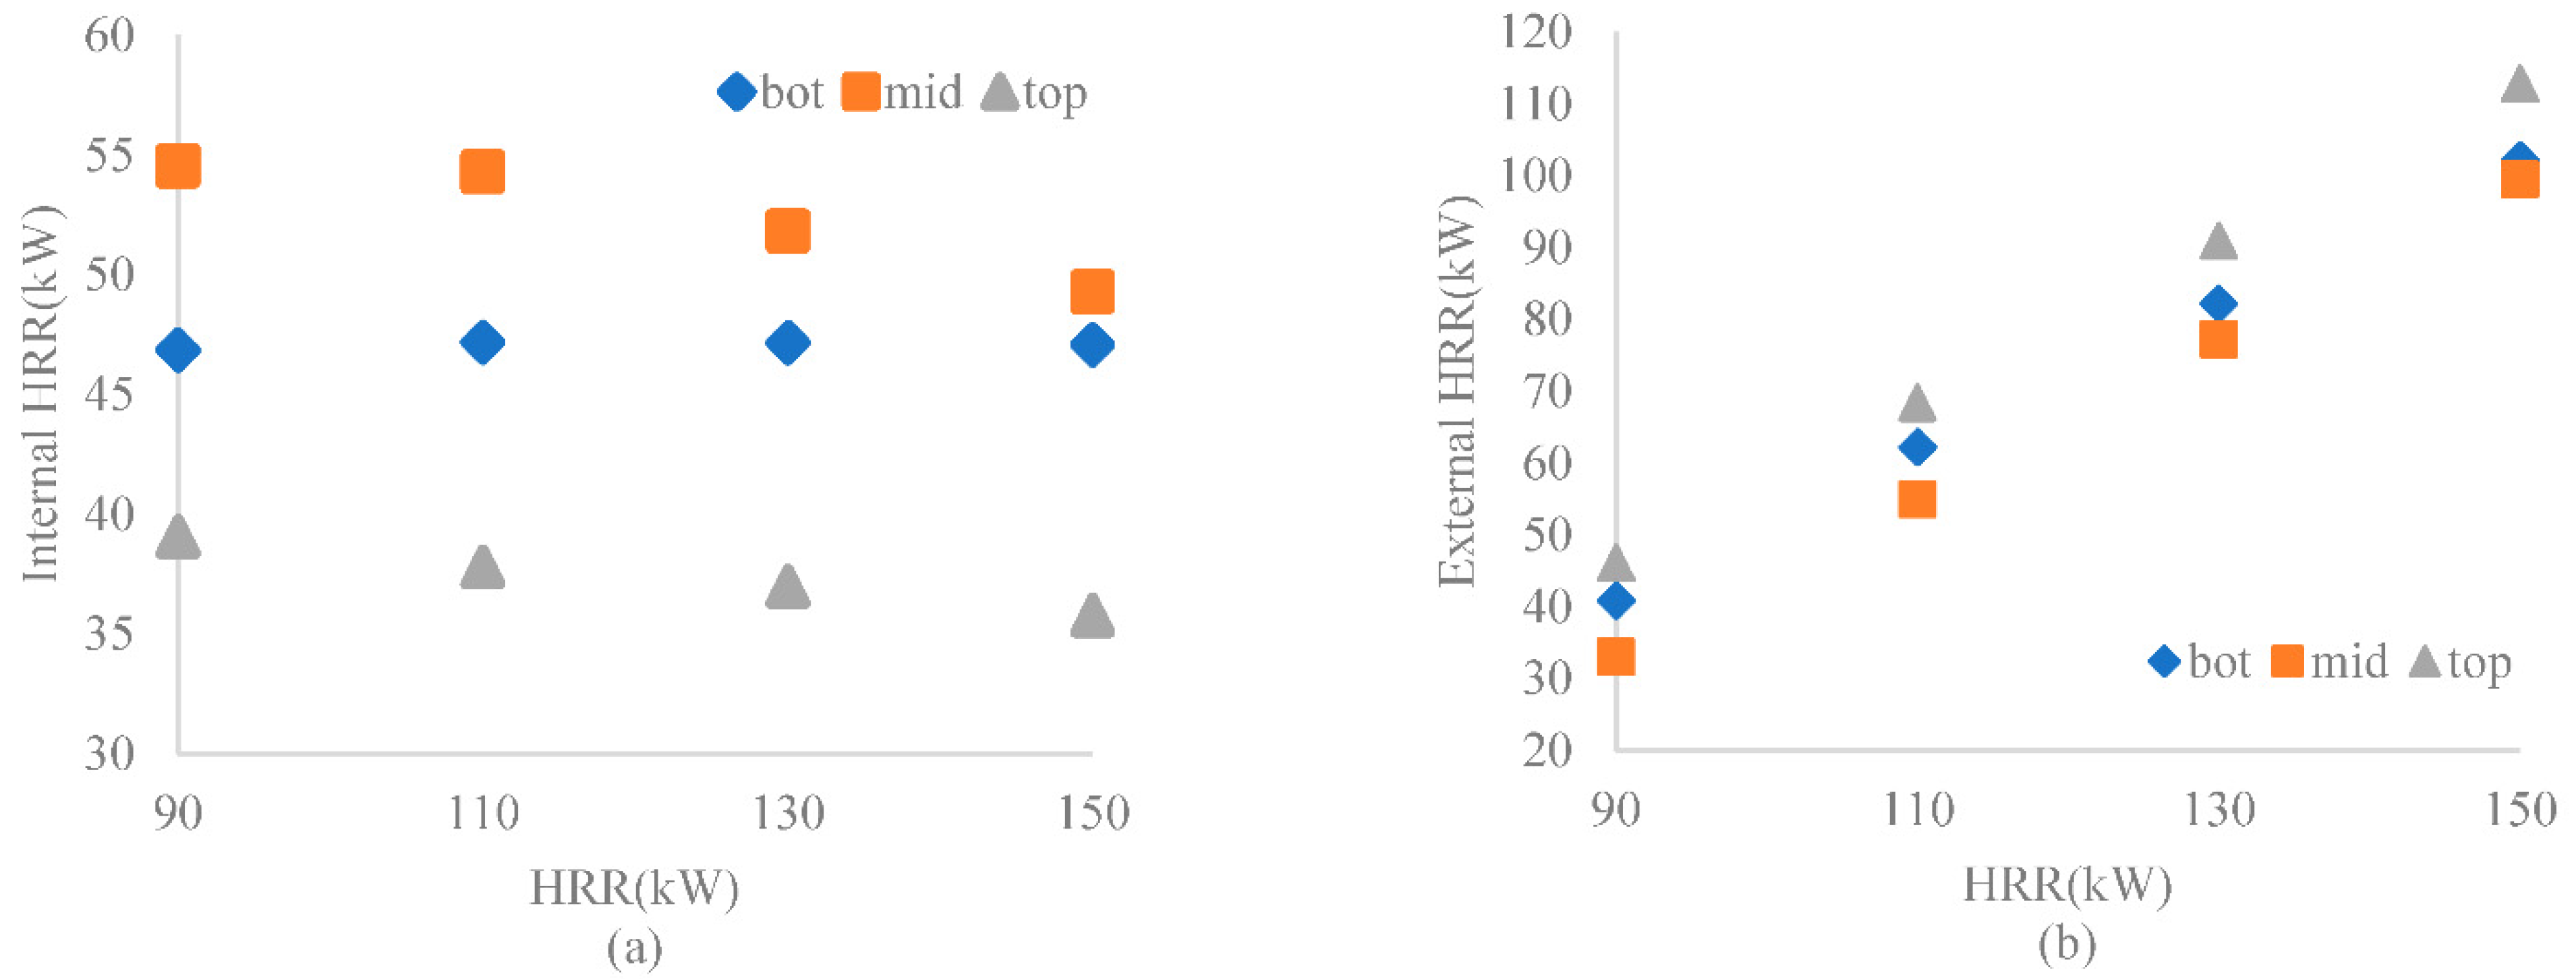
| HRR inside the compartment | Qin_mid > Qin_bot > Qin_top |
| HRR outside the compartment | Qex_mid < Qex_bot < Qex_top |
| External flame height | hf_mid ≈ hf_bot < hf_top |
Publisher’s Note: MDPI stays neutral with regard to jurisdictional claims in published maps and institutional affiliations. |
© 2022 by the authors. Licensee MDPI, Basel, Switzerland. This article is an open access article distributed under the terms and conditions of the Creative Commons Attribution (CC BY) license (https://creativecommons.org/licenses/by/4.0/).
Share and Cite
Wang, L.; Park, H. An Experimental and Modeling Study on the Effect of Wall Opening Location on the Under-Ventilated Compartment Fire. Sustainability 2022, 14, 12084. https://doi.org/10.3390/su141912084
Wang L, Park H. An Experimental and Modeling Study on the Effect of Wall Opening Location on the Under-Ventilated Compartment Fire. Sustainability. 2022; 14(19):12084. https://doi.org/10.3390/su141912084
Chicago/Turabian StyleWang, Lujia, and Haejun Park. 2022. "An Experimental and Modeling Study on the Effect of Wall Opening Location on the Under-Ventilated Compartment Fire" Sustainability 14, no. 19: 12084. https://doi.org/10.3390/su141912084
APA StyleWang, L., & Park, H. (2022). An Experimental and Modeling Study on the Effect of Wall Opening Location on the Under-Ventilated Compartment Fire. Sustainability, 14(19), 12084. https://doi.org/10.3390/su141912084