Article

Determining Factors Affecting the Perceived Preparedness of Super Typhoon: Three Broad Domains of Ergonomics Approach

by
Ma. Janice J. Gumasing
1,2,
Yogi Tri Prasetyo
1,3,*,
Ardvin Kester S. Ong
1,
Reny Nadlifatin
4 and
Satria Fadil Persada
5
1
School of Industrial Engineering and Engineering Management, Mapúa University, 658 Muralla St., Intramuros, Manila 1002, Philippines
2
School of Graduate Studies, Mapúa University, 658 Muralla St., Intramuros, Manila 1002, Philippines
3
Department of Industrial Engineering and Management, Yuan Ze University, 135 Yuan-Tung Rd., Taoyuan City 320, Taiwan
4
Department of Information Systems, Kampus ITS Sukolilo, Institut Teknologi Sepuluh Nopember, Surabaya 60111, Indonesia
5
Entrepreneurship Business Creation, Business School, Binus University, Jakarta 11480, Indonesia
*
Author to whom correspondence should be addressed.
Sustainability 2022, 14(19), 12202; https://doi.org/10.3390/su141912202
Submission received: 28 July 2022 / Revised: 3 September 2022 / Accepted: 6 September 2022 / Published: 26 September 2022

Abstract

:
Typhoon Rai (202122) was one of the most devastating natural disasters globally, and the Philippines is the country that was heavily hit by this super typhoon. This study examined the preparedness of Filipinos using a novel framework considering ergonomic domains and disaster knowledge. A total of 414 Filipinos in eight regions affected by the typhoon answered the online questionnaire distributed through social media sites using a convenience sampling approach. Ergonomic-based indicators for physical, cognitive, and macro-ergonomics were analyzed simultaneously with disaster-knowledge indicators such as awareness, adaptation, and risk perception. The results from the partial least square structural equation modeling (PLS-SEM) and artificial neural network (ANN) showed that physical ergonomics and macro-ergonomics are key factors affecting the perceived preparedness of Filipinos for Typhoon Rai (202122). Moreover, disaster awareness, adaptation, and risk perception were also found to positively influence the respondents’ perceived preparedness, while disaster awareness influenced adaptation and risk perception. The findings revealed that residents in highly exposed locations must practice typhoon preparation and evacuation ahead of time. The results of this study could be utilized to educate local communities about the importance of emergency response options during a typhoon to lessen the damage and risks associated with it. Academicians and disaster planners may extend the findings of this study to investigate the role of ergonomics and disaster knowledge in developing preparedness systems to increase resilience by strengthening emergency management knowledge, reinforcing coordination, and communication among communities, decreasing occupational dangers, and improving processes to improve response efficiency and effectiveness.

1. Introduction

Typhoons are the most prevalent natural disaster in the Philippines. Due to its geographical location, the Philippines is prone to tropical cyclones, which typically bring torrential rainfall and floods of vast areas and high winds, resulting in significant human casualties and agricultural and property destruction. As a result, having sufficient knowledge about such typhoon occurrences for practical reasons is critical [1]. Typhoons can strike the Philippines at any time of the year.
Mostly, typhoons occur between June and September, wherein the month of August is usually predicted to have the greatest number of typhoon occurrences. Chen et al. [2] expounded on tropical cyclones in both South and Eastern Asian inland regions. Their study covered the past and future impacts of super typhoons on climate effects. The study analyzed data from 1979 comparing it to 2016. It was seen that longer sustained times from 2 to 9 h was evident with a penetration of 30 to 190 kph inland effect brought by super typhoons. After the analysis, their study justified the future disaster brought by typhoons, especially in East and Southern Asian countries. Similarly, the study of Jiansheng et al. [3] presented the evolution of the super typhoon and its characteristics, focusing on the main functional area of China. They showed that from 1991 to 2010, an upward trend in typhoon risks was evident. Their study suggested starting to create mitigation plans for low and medium-risk areas as future typhoon-related events were predicted to affect the said areas. In addition, Lorenzo and Kinzig [4] generalized how meteorological typhoons are evidently increasing in Southeast Asian countries. Developing countries such as the Philippines were suggested to consider mitigation plans since evident typhoon disasters are consistent [5]. Around 20 tropical cyclones hit the Philippine area of responsibility each year. Ten cyclones are generally projected to be typhoons in a year, five of them potentially devastating [6]. The Haiphong typhoon was the deadliest tropical cyclone to impact the Philippines, killing up to 20,000 people in September 1881. In addition, Typhoon Yolanda (international name Haiyan) became the strongest landfalling tropical cyclone on record as it hit the Visayas in the central Philippines on 7–8 November 2013. It is considered the deadliest storm in contemporary meteorological records [7].
Typhoon Rai (202122), also known as Typhoon Odette in the Philippines, was a devastating tropical cyclone that distraught the country in December 2021 (see Figure 1). It was the third category 5 super typhoon following Pamela in 1954 and Rammasun in 2014. Moreover, Typhoon Rai (202122) was the 15th storm to hit the country in 2021. Before leaving the Philippine area of responsibility on 17th December, it made landfall in the Surigao del Norte and Dinagat Islands provinces in Mindanao, five provinces in the Visayas, and the island of Palawan in Luzon [8]. Thirteen (13) million people in the Philippines were estimated to be affected by Typhoon Rai (202122), harming a number of government and private buildings [9]. At least 1259 people have been injured, 80 are still missing, and 410 have died, the majority being from the island of Bohol, which has been severely damaged. Damages in the stated region were valued at PHP 5 billion (USD 88 million), PHP 20 billion (USD 352 million) in Siargao, and PHP 5.9 billion PhP (USD 104 million) in Negros Occidental.
Because the Philippines is prone to typhoons and other catastrophes, disaster preparedness and disaster risk reduction measures will remain critical to the Filipino people’s resilience. Investing and promoting disaster preparedness has been proven to save economic losses on relief and rehabilitation costs. Thus, both the government and the private sectors have increased their focus on disaster preparedness and prevention, resulting in fewer casualties [11].
Disaster preparedness is a set of steps taken to guarantee that the resources needed for a successful response are accessible before a disaster happens or that the resources can be accessed quickly when disaster strikes [12]. According to Moe and Pathranarakul [13], the number of people killed in a disaster can be effectively minimized if preparation is done before the crisis occurs. However, most people pay little attention to disaster planning and are unaware of its importance until it happens. Because of this, the goal of disaster risk reduction is to modify human habits. This requires using appropriate methods to urge individuals to change their behaviors to lower the risks and improve their ability to respond to disaster effects [14]. In typhoon preparation, beliefs about the extent to which preparations and adaptation are necessary to avoid the risk and hazards of a typhoon are critical [15,16]. Since typhoons are frequent in the Philippines, it is crucial to limit the dangers and threats they provide. Thus, future research on policy development should focus on improving the community’s typhoon preparedness and disaster risk literacy [16].
Several theoretical models of protective behavior have been developed to explain the relationship between behavioral factors and disaster risk reduction, one of which is the Theory of Planned Behavior (TPB). According to the TPB, three core components shape an individual’s behavioral intentions: attitude, subjective norms, and perceived behavioral control [17]. However, the difficulty in conceptualizing and capturing an individual’s attitudes is a challenge in TPB measurement, which is a crucial factor during a disaster [18]. Protection Motivation Theory (PMT) is another model utilized to define individuals’ responses to perceived threats and uses threat and coping appraisal as opportunities for motivational protection during a disaster [19]. However, the model does not consider all the environmental and cognitive variables, such as the influence of social norms that may influence the adaptive behavior of individuals during disasters [20]. Another model used to predict individuals’ behavior to carry out an action relating to a threat such as a disaster is the Social Cognition Theory (SCT). This model considers the distinctive way individuals acquire and maintain behavior and the social environment in which individuals perform the behavior during a disaster [21]. It is assumed in this model that factors such as a person’s cognitive, affective, and physiological characteristics and behavioral patterns and environmental events interact and influence one another. According to Lee and Lemyre [22], people’s motivation to prepare in the context of disaster preparedness is a function of their cognitive and affective reactions to a natural hazard. However, other than through reference to previous experience, SCT theory does not focus on emotion or motivation. As a result, these factors receive little attention in assessing natural disaster-related studies.
Various behavioral theories have been established as a strategic basis for supporting the adoption of disaster preparedness measures. However, most models focused only on cognitive and psychological factors for the adaptive behavior of individuals in a disaster. In a substantial disaster situation, a thorough assessment of the human factors and ergonomic issues affecting disaster management is critical to ensuring an effective response during a disaster. Thus, further research on disaster preparedness using ergonomic domains such as physical, cognitive, and macro-ergonomics is highly required.
With a focus on disaster preparedness, ergonomics can help at the system, organizational, community, and individual levels. Ergonomics provides analytical tools and strategies for identifying aspects of resilient performance and successful disaster-related adaptations [23]. Recent research has also demonstrated the value of ergonomics methodologies in enabling proactive risk assessment and improving response preparedness. Gurses et al. [24] evaluated numerous system aspects to discover failure modes and hazards connected to tasks, physical environments, and tools and technologies to identify ambiguous guidelines, protocols, and processes during disaster ergonomics.
Ergonomics considers a work system design’s physical, cognitive, and macro-ergonomic aspects. Physical ergonomics is concerned with injury prevention through workplace design and evaluation. It studies how people’s bodies engage with the devices they use daily. Human performance within a system is the focus of cognitive ergonomics. It investigates the ability of the mind to process and relate to information. On the other hand, macro-ergonomics focuses on designing organization-system interactions by imparting the required knowledge and procedures for improving work systems.
By addressing the interconnectedness of interpersonal, technological, and environmental elements and the potential impacts on all parts of the system of work design changes, ergonomics contributes to the establishment of a safe and sustainable work system. Since hazards interact with physical, social, economic, and environmental vulnerabilities to create these risks, the role of ergonomics in disaster preparedness is thus vital.
Furthermore, effective disaster preparedness techniques require a thorough understanding of the public’s awareness of natural disaster hazards [25,26]. In recent years, many studies have placed greater attention on the public’s natural disaster awareness and risk perception [27]. In disaster preparedness and response, governments, organizations, community groups, and people must have the information, actions, and competencies to predict successfully, take action, and recover from possible, impending, or existing hazards events and situations [28].
Several studies have identified the role of ergonomics in disaster preparedness. In the U.S., Sasangohar et al. [23] studied the issues relevant to human factors and ergonomics in disaster management. However, the study focuses on the disaster management challenges during the COVID-19 pandemic response and recovery, which differs from other kinds of disasters. In Australia, Horberry et al. [29] presented related studies in mining emergency management, highlighting the contributions of human factors and ergonomics to help create a safe and efficient mining disaster management system. However, the study only investigated the challenges associated with underground coal mining emergencies. In London, an ergonomic evaluation of disaster management had been studied but only considered the area of offshore oil platforms. Four main areas of ergonomics were identified in response to disaster preparation and management, including safety management, interface design, training, and human behavior [30].
Despite the numerous available studies related to disaster response effectiveness, there has been limited academic research about the role of ergonomics and their domains in disaster preparedness during a typhoon. Thus, the purpose of the present study was to investigate the factors influencing the perceived preparedness of Filipinos for Typhoon Rai (202122) using a novel framework of ergonomic domains and disaster knowledge. Using the findings of this study, future academicians and disaster planners may look into how ergonomics can help develop disaster preparedness systems that enhance resilience by increasing emergency management knowledge, strengthening community coordination and communication, reducing occupational hazards, and improving processes to improve response efficiency and effectiveness. In addition, the model developed in the present study can also be applied as a theoretical framework for evaluating similar ergonomic-based natural disaster responses.

2. Conceptual Framework

This paper looked into the relationship of ergonomic factors with perceived preparedness for disaster, particularly typhoons. Addressing the interconnectedness of ergonomics’ physical, cognitive, and macro-ergonomic aspects during disaster response contributes to establishing disaster preparedness systems. Figure 2 shows the theoretical framework of this study to measure the perceived preparedness for typhoons.
Previous research has looked into ergonomics to address disaster management concerns. In Bangladesh, physical ergonomics’ role in designing the physical structure and structural support of shelters during cyclones was investigated [31]. The study showed that poor design of shelter infrastructure posed additional challenges during disaster operations and aggravated the persons’ distress during the calamity [31]. In Colombia, a similar study proved the significant role of public infrastructure serving as a temporary shelter during disasters in the coping strategies of communities in vulnerable cities during natural calamities [32]. In prior research, cognitive ergonomics’ role in individuals’ psychological and mental conditions during disasters was also discussed. A study by Zulch [33] stated that individuals need to be mentally prepared to reduce their psychological distress during disasters to manage disaster preparedness and implement disaster warning situations successfully. Mishra and Suar [34] have also proved that social anxiety during calamities reduced flood preparedness in India, with disaster education and resources acting as partial mediators.
Moreover, macro-ergonomics’ roles in organizations responsible for disaster management, like local government units (LGUs), play an essential role in disaster response and preparedness [35]. Lower typhoon mortality is connected to the effectiveness of the government’s response [36]. When catastrophe risk reduction techniques have positive outputs, it directly impacts their success. Thus, the ability of the local community to respond to disaster preparedness is deemed crucial [37].
On the other hand, disaster risk reduction knowledge of natural hazards is essential for developing and implementing adequate disaster management practices. Several researchers have looked into the impact of disaster knowledge on preparedness in terms of awareness, adaptation, and risk perception. In a study by Tuladhar et al. [38], the local Nepalese people’s disaster risk reduction (DRR) knowledge was evaluated to determine the readiness and adaptation of people for natural disasters. The study revealed a low level of disaster preparedness of local people, as measured by their inability to identify and address the perceived risk of disaster, adaptation, and awareness. The study found that disaster risk reduction education initiatives are insufficient, and there are gaps in disseminating disaster knowledge in Nepal. Hence, the findings will help government agencies in Nepal modify their disaster programs and management for local communities [38].
In the Philippines, a similar study was conducted to measure the impact of disaster education knowledge on Grade 11 students to strengthen students’ resiliency toward natural calamities [39]. According to the study, incorporating disaster readiness and risk reduction (DRRD) as a core subject for senior high school in the K-12 basic education curriculum helped students exhibit a high degree of disaster-related knowledge. Through this course, the students acquired awareness of disaster preparation, adaptation, readiness, and risk perception, thus aiding them to lead in disaster readiness activities and promoting greater consciousness about disaster risk reduction in their respective communities [39].

2.1. Determinants of Perceived Preparedness for Typhoon Based on Ergonomic Domains

Physical ergonomics (PE) refers to people’s physiological interactions and activities. Improvements are sought in the physical design of the work environment that aids in the safety movements of people, workstation arrangement, safety protocols, and overall health. According to studies, shelters’ infrastructure and physical layout play a key function in large-scale disasters and perform a critical component of disaster response and management [40,41]. Similarly, the physical design of disaster evacuation centers in the community can aid in preparing individuals for disaster [42,43] and play a vital role in the community’s resilience during a disaster [31]. A disaster evacuation shelter’s physical layout and infrastructure should be considered to preserve critical public safety as best as feasible. Adequate shelter, according to the United Nations High Commissioner for Refugees [44], has a significant impact on the survival of people in the early phases of a disaster. Thus, it is hypothesized that:
Hypothesis 1 (H1)
Physical ergonomics (PE) has a significant positive effect on perceived preparedness (PP) for a typhoon.
Cognitive ergonomics (CE) refers to mental and psychological aspects that may affect interactions among humans and other system elements. According to Malkina-Pykh and Pykh [45], psychological preparedness and cognitive awareness during disasters have assumed compelling importance for coping with emotional responses. A study by Tepstra [46] also proved that their cognitive and emotional mechanisms significantly influence the preparedness intention of people for disasters. Lindell and Prater [47] also showed that the psychosocial effects of disaster hazards could result in greater preparedness and intrusiveness of individuals, especially for communities in high-risk areas. Thus, it is hypothesized that:
Hypothesis 2 (H2)
Cognitive ergonomics (CE) has a significant positive effect on perceived preparedness (PP) for a typhoon.
Macro-ergonomics (ME) refers to optimizing socio-technical systems, including organizational structures, policies, and processes. Hossain [48] stated that when disaster affected people, a requirement for immediate assistance before and during the emergency response to a disaster was needed. An organization can play a critical role in overcoming its constraints in a well-organized manner. Organizations such as LGUs have a significant role in establishing emergency support during disaster emergencies [49,50]. The various initiatives of LGUs to support typhoon disaster-affected individuals are crucial in community preparation planning and can improve community readiness and lessen the effect of disaster. Thus, it is hypothesized that:
Hypothesis 3 (H3)
Macro-ergonomics (CE) has a significant positive effect on perceived preparedness (PP) for a typhoon.

2.2. Determinants of Perceived Preparedness for Typhoon Based on Disaster-Knowledge Indicators

Disaster adaptation refers to absorbing, preparing, and recovering from disaster impacts. In most cases, adaptation is a proactive response to expected hazards to mitigate potential adverse effects or dangers ahead of time [51]. According to IPCC [52], in sustainable development, taking a longer-term view enhances the possibility that more urgent adaptation measures will strengthen future disaster response preparation. The adjustments in human behavior in response to disasters can mitigate the risks and hazards of natural disasters such as typhoons [53]. Disaster adaptation will also allow a system to reduce the risk associated with these hazards by reducing social vulnerability [54]. The socio-economic and demographic factors that influence community resilience are referred to as social vulnerability. According to studies, the socially vulnerable are more likely to be harmed during disasters. Moreover, a study by Mishra and Mazumdar [55] proved that psychological adaptation to disasters could influence the preparedness and coping of an individual to disaster. Thus, it is hypothesized that:
Hypothesis 4 (H4)
Disaster adaptation (AD) has a significant positive effect on perceived preparedness (PP) for a typhoon.
Risk perception refers to an individual’s subjective assessment of the possibility of unfavorable disaster consequences and impact. According to numerous studies, risk perception significantly impacts disaster preparedness [56,57,58]. Demuth et al. [59] and Xu et al. [60] have proved that risk perception in households significantly impacted their behavior, such as relocation and disaster preparedness. When they sense a disaster is imminent, families make appropriate behavioral decisions. This finding is also supported by a study by Miceli et al. [57] that showed people in a community with a higher perceived risk for disaster have increased disaster preparation and supported the adoption of specified protective behaviors. Thus, it is hypothesized that:
Hypothesis 5 (H5)
Risk perception (RP) has a significant positive effect on preparedness (PP) for a typhoon.
Disaster awareness (DA) refers to the degree of catastrophe risk awareness and the causes that lead to disasters. Awareness of a disaster is vital in adequately implementing mitigation and disaster preparedness stages [61]. According to Jennings-Sanders [62], a disaster education program can help individuals and populations affected by disasters achieve positive outcomes. These may result in reduced death rates, improved health status, and lower disaster-related expenses. A study by Tanaka [63] also proved that disaster awareness serves as educational information that aids in the strengthening of adaptation to social activities and academic sources. Various sorts of disaster education freely offered to the general population in easily accessible locations help adapt individuals for a disaster. Furthermore, a study by Rana and Routray [64] also recognized that awareness and knowledge about disasters could significantly influence the degree of vulnerability and risk of disaster hazard that is essential for the successful implementation of preparedness initiatives. Thus, it is hypothesized that:
Hypothesis 6 (H6)
Disaster awareness (AW) has a significant positive effect on disaster adaptation (AD).
Hypothesis 7 (H7)
Disaster awareness (AW) has a significant positive effect on risk perception (RP).
Hypothesis 8 (H8)
Disaster awareness (AW) has a significant positive effect on perceived preparedness (PP) for a typhoon.

3. Methodology

3.1. Survey

The non-probability sampling method, specifically convenience sampling using an online survey, was utilized in this study. Research ethics committee approval from the Mapua University (ethical code: FM-RS-22-22) was obtained before survey dissemination. The survey link was given to the target respondents during the onslaught of Typhoon Rai (202122) in the Philippines from 15 December to 20 December 2021. The questionnaire was distributed across eight (8) regions greatly affected by Super Typhoon Rai (202122).
Region V had 4337 people affected. Furthermore, 2,823,048 people were affected in Region VI, 5,807,633 in Region VII, 1,287,561 people in Region VIII, 154,020 people in Region X, and 1283 people in Region XI, and infrastructure damage occurred for both CAR and NCR. Across the country, 12,020,545 people were affected by Super Typhoon Rai (202122) [4,5]. In each region, the target population was the adult population (18 years old and above). The questionnaire was presented in the English language as this language is considered the second largest English-speaking nation, spoken by 95% of the population [65]. A total of 414 adult Filipinos volunteered to participate in the self-administered survey concerning the perceived preparedness for Typhoon Rai (202122). The sample size was calculated using Yamane’s [66] formula in Equation (1).
n = N 1 + N e 2
The total population for the eight (8) regions aged 18 and above is 41.6 M [67]. Using 95% accuracy, the computed sample size is 400. Many of the fit indices in the PLS-SEM method are influenced by sample size. Some papers recommend that the minimum sample size used in the PLS-SEM be at least ten times the number of indicators used to measure the construct [68]. Some papers in the literature also stated that the sample size for PLS-SEM should be between 200 and 500 [60,61,62,63,64,65,66,67,68,69,70,71,72]. The present study has collected 414 respondents. Thus, the gathered sample size is considered acceptable.
The survey was made available on the internet via various social media sites such as Facebook, Twitter, Instagram, and LinkedIn. It was distributed to several groups in a public forum, specifically targeting the respondents affected by the typhoon in different regions. To comply with the Data Privacy Act or Republic Act No. 10173 in the Philippines, the respondents were asked to sign a consent form stating that the information acquired from the survey and other pertinent data they provided would only be used for academic research purposes. A consent paragraph was presented in the introduction part of the questionnaire, and respondents were asked to confirm the checkbox before proceeding with the questionnaire items. After that, data were collected into spreadsheets and collated into a single statistical analysis database.
The survey consists of 42-item questions. The respondent’s demographic profile was determined in the first part of the questionnaire, which included age, gender, educational level, area of residence, residential type, and total household monthly income. The second part of the questionnaire consists of the indicators based on ergonomics and disaster knowledge domains. This was used to measure the perceived preparedness of respondents for Typhoon Rai (202122). The survey consists of item questions, where all answers were on a 5-point Likert scale ranging from strongly disagree to strongly agree. Seven (7) latent variables were used in the survey, which included: (1) physical ergonomics, (2) cognitive ergonomics, (3) macro-ergonomics, (4) disaster adaptation, (5) disaster awareness, (6) perceived risk, and (7) perceived preparedness as shown in Table 1.
The items for the constructs of disaster knowledge, which include disaster adaptation, disaster awareness, perceived risk, and perceived preparedness, were adopted from existing instruments developed by Tuladhar et al. [38], wherein the questionnaire survey items in the study were acquired from several books and literature [63,72,73,74,75,76,77,78]. They were embedded together within a single survey sheet.
The items for the construct of ergonomic domains, including physical ergonomics, cognitive ergonomics, and macro-ergonomics, were developed from the research literature and a series of consultations and focus group discussions from a panel of disaster management expert practitioners. The panel consisted of five (5) experts from local government units (LGU) and the National Disaster Coordinating Council (NDCC), who specialize in the field of disaster risk reduction and management.
To validate the content of the questionnaire, four (4) researchers from the Directed Research for Innovation and Value Enhancement (DRIVE) of Mapua University were contacted through e-mail and asked to evaluate the questionnaire and check for common errors like double-barreled, confusing, and leading questions. They were selected based on their ergonomics and disaster risk management expertise, which is a requirement for content validation [79]. After this, a pilot test was conducted to assess the questionnaire’s validity and reliability using SPSS 24. Initial survey responses of 150 samples that were not considered for the main study were used in the pilot test. The sampling size met the recommended sample size of 5 subjects per item, or at least 120 participants for a 24-item questionnaire [80,81]. They were asked to answer the questionnaire, and the researcher was always available to clarify any phrases or terms.
After gathering the initial data, an exploratory factor analysis (EFA) and measure of internal consistency using Cronbach’s alpha were used to validate the items in the questionnaire. Data suitability for EFA was met by having a Kaiser–Meyer–Olkin (KMO) value of >0.7 [81] and a significant p-value < 0.05 for Bartlett’s test of sphericity [82] for the constructs in the questionnaire. The number of factors was determined using an eigenvalue greater than 1.0 and a visual inspection of the scree plot. The factors were extracted using the principal axis factoring method. Cronbach’s alpha coefficient was used and was found to be more than 0.70, as suggested by Hair [83]. Furthermore, Harman’s single-factor test was also used to examine if there was any common method bias (CMB) after the work of Ong et al. [20]. With a value of 25.64%, the test showed no CMB. Afterward, the questionnaire was disseminated to obtain the final data.
Table 1. The construct and measurement items.
ConstructItemsMeasureSupporting Reference
Physical ErgonomicsPE1I have a prepared disaster kit at home for Typhoon OdetteZafra et al. [84]; Wang et al. [85]; Sushanti et al. [86]; UNISDR [87]
PE2I have the means of transportation to go to evacuation centers
PE3The evacuation center in our area is comfortable
PE4The evacuation center in our area has good lighting condition
PE5The evacuation center in our area has good ventilation
PE6The evacuation center in our area is not noisy
PE7The evacuation center in our area is not hot and humid
PE8The evacuation center in our area is not congested
PE9The facilities in the evacuation center in our area are properly designed
Cognitive ErgonomicsCE1I can easily shut off my appliances and utilities at home during a disaster like Typhoon OdetteUdwin et al. [88] Cook & Bickman [89]; Berah & Valent [90]; Mason et al. [91]
CE2I trust the government in the disaster response to Typhoon Odette
CE3I have access to the media and other sources of information for Typhoon Odette
CE4I don’t feel anxious about Typhoon Odette
CE5I don’t feel stressed about Typhoon Odette
CE6I don’t feel depressed about Typhoon Odette
CE7I have a way of communicating with my family during Typhoon Odette
Macro-ergonomicsME1I think our LGU has enough emergency responders for Typhoon OdetteMatunhay [92]; Tizon & Comighud [93]; Stewart [15]; Yang et al. [94]
ME2I think our LGU is prepared to respond to Typhoon Odette
ME3I think our LGU can properly allocate relief goods for Typhoon Odette
ME4I think our LGU can maintain peace and order in case we evacuate for Typhoon Odette
ME5I think the LGU can secure our properties and assets in case we evacuate for Typhoon Odette
ME6I think I will receive financial support from the government during Typhoon Odette
ME7I think I will have access to healthcare services (hospitals, clinics) during Typhoon Odette
Disaster AdaptationAD1I am fully informed about the evacuation system and plan in my area for Typhoon OdetteTaludhar et al. [38]; Kuroiwa [72]
AD2I think the government is ready to provide assistance after Typhoon Odette
AD3I am confident that reconstruction activities can be implemented after Typhoon Odette
AD4I have sufficient information about Typhoon Odette adaptation from the government
Disaster AwarenessAW1I actively participate in Typhoon Odette awareness campaignsTanaka [63]; Ronan et al. [77]
AW2I am aware of the proper emergency procedure for Typhoon Odette
AW3I am aware of the shelter areas or evacuation centers for Typhoon Odette
AW4I am aware of which government institutions need to be contacted after Typhoon Odette
AW5I do prioritize awareness at the local and national levels for Typhoon Odette
AW6I am aware of the importance of building or infrastructure retrofitting for Typhoon Odette
Risk PerceptionRP1I am sure that large-scale disasters like Typhoon Odette will definitely happen in the next 10 yearsMcMillan & Schumacher [73]; Andrews et al. [74]
RP2I think my locality is safe from Typhoon Odette
RP3I know who are vulnerable members of my family and community for Typhoon Odette
RP4I am informed about the possible risks of Typhoon Odette
Perceived PreparednessPP1I know the significance of sharing knowledge and information about preparation for Typhoon Odette Henning et al. [76]; Taludhar et al. [38]; Lekalakala [78]
PP2I recognize the importance of making preparations for Typhoon Odette with family, friends and relatives
PP3I have enough knowledge on how to prepare for Typhoon Odette from experts in disaster reduction
PP4I think my house/shelter is well designed to withstand any disaster like Typhoon Odette
PP5I think our assets are well protected from Typhoon Odette

3.2. Structural Equation Modeling

The survey results were analyzed using partial least squares analysis structural equation modeling (PLS-SEM). The collected data were analyzed using Smart PLS v3.3.3 to determine the link between indicators and perceived preparation for Typhoon Rai (202122). PLS-SEM is a multivariate analysis approach widely used to correlate many indicators or constructs simultaneously [95]. According to Fan et al. [96], when comparing other modeling methodologies, PLS-SEM looks at the impacts of direct and indirect factors on pre-assumed causal links. It is becoming more common in scientific inquiries and studies [96,97]. PLS-SEM is also used to identify critical indicators and constructs and examine the relationship of an existing structural theory compared to covariance-based SEM using AMOS [81]. PLS-SEM is also the preferred approach in exploratory research. In other words, when the theory is still being developed, and relationships need to be explained, PLS-SEM is recommended [98].
Several fit indices were utilized to justify the model fit in this study using PLS-SEM, such as the standardized root mean square residual (SRMR), normal fit index (NFI), and chi-squared test. For SRMR, a value of less than 0.08 is considered a good fit [99]. According to Baumgartner and Homburg [100], for NFI, a value of 0.80 and above represents an acceptable fit, while for chi-squared, a value below 5.0 indicates a well-fitting model.
In addition, reliability analysis was done before the structural equation modeling (SEM). In analyzing behavioral intention models, Cronbach’s alpha, composite reliability (CR), and average variance extracted (AVE) are used. Cronbach’s α and CR requires a value higher than 0.7, and AVE needs to be higher than 0.5 [84].
Furthermore, the R2 measurements and path coefficient significance levels are established, and an R2 value of 0.20 and above will be considered a cut-off following Hair et al.’s study [68]. Path analysis was used to uncover the causal relationship between the variables and quantify the connection among numerous variables by generating a path diagram [81]. A typical function of path analysis is that a variable can directly or indirectly influence an outcome via different variables [96].

3.3. Artificial Neural Network

The current trend of analysis nowadays considers machine learning algorithms (MLA). The use of MLA has been evident in analysis with prediction, recognition of patterns, and classification, among several factors. The MLA that has higher computational power and algorithm is the artificial neural network (ANN). ANNs have been considered for evaluating and predicting factors under human behavior, usually considered with SEM as a hybrid to classify and validate the findings. The study of Yuduang et al. [101] considered an SEM-ANN hybrid to evaluate the perceived and actual use of mobile mental health assessment among Filipinos. In relation to this study, Oktarina et al. [102] evaluated casualties and damages brought by natural disasters in Indonesia using an ANN. In Iran, Yariyan et al. [103] considered an ANN for risk assessment of natural disasters. Comparing the MLA ensemble to the traditional and multivariate statistical analysis, it was proven from the study of Ong et al. [104,105] how MLA has a better result or could be a validation for the SEM result. ANNs were considered to be highly efficient in assessing both linear and nonlinear relationships due to their computational powers, which is one limitation present in solely using SEM. Therefore, the dataset from the collected response was analyzed with an MLA ensemble to verify the findings of the newly developed framework considered in this study.
An ANN is an MLA inspired by how the human body transfers signals to the brain by connecting neurons in the brain. The ANN has a classification model involving an input layer where the independent factors from the normalized dataset are utilized. Following is the hidden layer. Nodes in this layer underwent an optimization process to determine the minimum number for the computation. In addition, the activation function considering tanh, elu, and Sigmoid were utilized [106,107,108]. For the output layer, 1 node representing the dependent variable was utilized with activation functions of swish, sigmoid, and softmax [106,109,110,111]. Lastly, optimizers such as adam, SGD, and RMSProp were utilized [103,104]. Initial optimization was run with 150 epochs with 10 runs per combination [111]. A total of 16,200 runs were conducted to determine the best parameters for the optimum ANN classification model.

4. Results

4.1. Respondent’s Profile

The descriptive statistics of respondents’ demographic information are shown in Table 2. The questionnaire considered the residential type (where the people live) among town, city, and province. A town is a walled or fenced place (e.g., village or farm), a city is a large or important town with local government and municipalities, and a province is a principal division of a country. A total of 414 study participants were surveyed, composed of 51% females and 49% males, with the majority age ranging from 21–40 years old (65%) and having attended college (56%). Since the target respondents are individuals living in the most affected areas by the typhoon, it could be seen that the majority of the respondents are from the Mindanao and Visayas regions, particularly in Region XI (43%). In terms of household income, the majority of respondents (47%) have a total household income of less than 40,000 a month, have a household size of four or more people (25%), and live in the city (62%).

4.2. The Result of Initial SEM

The initial SEM for determining the perceived preparedness of Filipinos for Typhoon Rai (202122) is presented in Figure 3. It can be seen that the model is comprised of 7 latent and 42 indicators.
The values of the initial and final model’s reliability and validity indicators are shown in Table 3. The items with initial loading values of less than 0.7 were not considered in the final loading because the factor extracts represent insufficient variance from the variable. After this, the composite reliability using average variance extracted (AVE) and composite reliability (CR) are determined. It could be seen in Table 4 that each construct from this model can be regarded as valid and reliable because all values exceed the required standards.
To prove the significant correlation between each variable and evaluate the measurement model, discriminant validity is conducted utilizing the Fornell–Larcker criterion and the Heterotrait–Monotrait correlation ratio, as established by Henseler et al. [69]. According to Kline [70], a discriminant validity is confirmed when a value between two reflective constructs falls below 0.85 when using variance-based SEM for the Heterotrait–Monotrait ratio and assigned constructs have a higher value than all loadings of other constructs for Fornell–Larcker [81]. As reported in Table 5 and Table 6, the values are within the desired range, and the results indicate satisfactory reliability and convergent validity. Thus, the overall results among the constructs are accepted.

4.3. Model Fit Analysis

A model fit analysis was performed to show the validity of the suggested model. Table 7 shows that all parameter estimates exceeded the minimum threshold value, indicating that the proposed model is acceptable.
Bootstrap samples are also drawn from modified sample data. This modification entails an orthogonalization of all variables and a subsequent imposition of the model-implied correlation matrix. According to Henseler and Djisktra [69], if more than 5% of the bootstrap samples produce discrepancy values greater than those of the actual model, it is plausible that the sample data come from a population that behaves under the hypothesized model. Thus, to show the model’s overall quality, dG and dULS were considered. These distance measurements relate more than one way to calculate the difference between two matrices to contribute to the model fitness index in PLS-SEM. The results showed the dG and dULS values of 1.237 and 4.251, respectively, reflecting a perfectly matched measurement model. This suggested that the quality of the model was appropriate and efficient to use for explaining the data [112].

4.4. The Result of Final SEM

The PLS-SEM was performed to test the proposed hypotheses. The result is shown in Table 8. It could be seen that perceived preparedness for Typhoon Rai (202122) was significantly influenced by disaster adaptation (β = 0.582, p = 0.000), disaster awareness (β = 0.249, p = 0.000), macro-ergonomics (β = 0.234, p = 0.000), risk perception (β = 0.213, p = 0.000), and physical ergonomics (β = 0.158, p = 0.009). Moreover, it was also revealed that disaster awareness has significant influence on disaster adaptation (β = 0.751, p = 0.000), and risk perception (β = 0.483, p = 0.000). On the contrary, cognitive ergonomics is found to have an insignificant effect on perceived preparedness (β = 0.021, p = 0.657).
The final SEM model is shown in Figure 4. The beta coefficients and R2 values were determined to assess the hypothesis model. The model allocates 49.9% of the variation to disaster adaptation, 46.2% to perceived preparedness, and 29.9% to risk perception. This reveals that the model is sufficient to explain or predict the perceived preparedness for Typhoon Rai (202122) since an R2 score of 20% and above is deemed high for behavioral intention studies [79].

4.5. Artificial Neural Network

The ANN’s final optimization was conducted with the activation functions of sigmoid and softmax for the hidden and output layers, respectively. We used Adam for the optimizer, which produced an average accuracy of 92.5% with 90 nodes in the hidden layer. Presented in Table 9 is the summarized result for training and testing accuracies at a 90:10 ratio. Similar to the RFC, the 90:10 training and testing ratio produced the highest average accuracy. Running the ANN model at 200 epochs, Ong et al. [104,105] explained that the sequence of most significant indicators aligns with the highest accuracy result.
It could be deduced that the most significant indicator is AD, followed by AW, ME, RP, PE, and CE. To further validate the findings, a score of normalized importance was generated using SPSS 25, as seen in Table 10. In addition, the training and validation loss rate are presented in Figure 5. As the figure represents, the validation loss is close to the training loss, indicating no underfitting or overfitting. If the validation loss rate is significantly paralleled below, an underfitting result is seen. When the validation loss rate is higher than the training loss, overfitting is processed from the result. Thus, it could be deduced that no over(under)fitting is present.
It was seen from the results that AD was the most significant, followed by AW, ME, and RP preceding perceived preparedness among Filipinos for Typhoon Rai (202122). Consistent with the results of SEM, it was also seen that PE was significant, but CE was seen to be insignificant with SEM. Subsequently, ANN presented that CE is within the threshold for significant consideration. This indicates that CE is a latent variable that is relatively significant. Presented in Figure 6 is the optimum ANN classification model.

5. Discussion

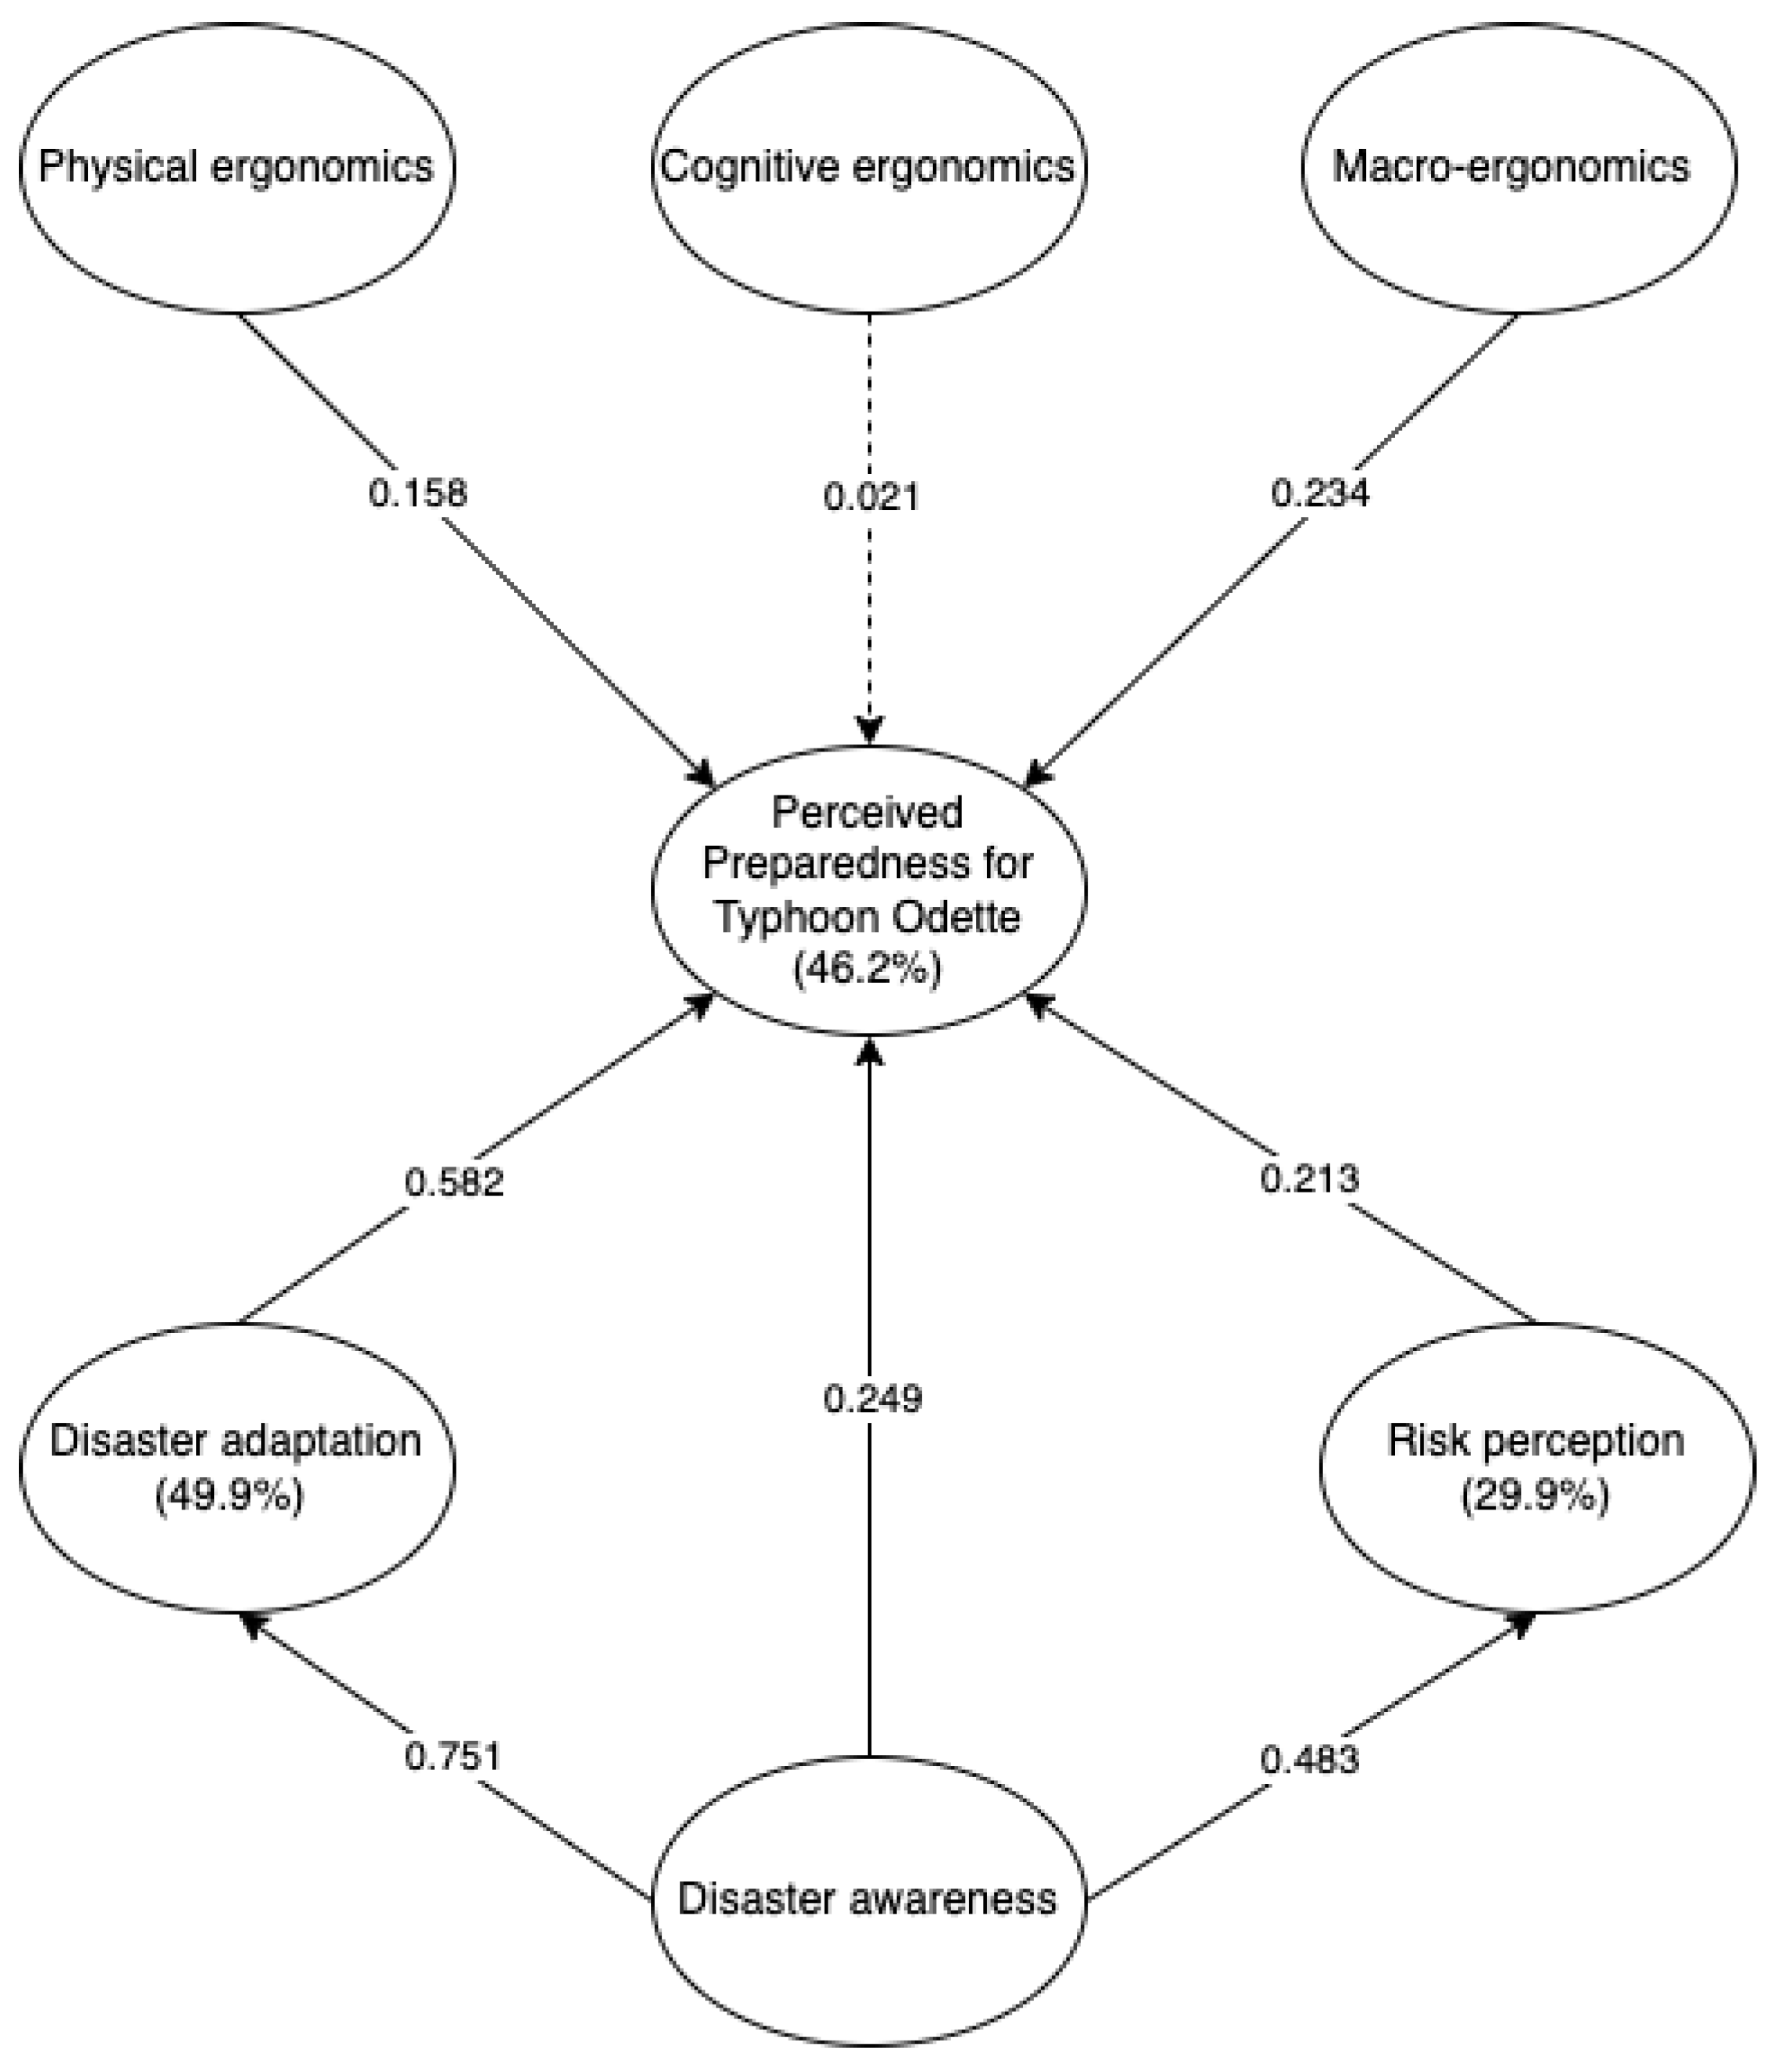
This study investigated the role of physical, cognitive, and macro-ergonomics and risk perception, adaptation, and awareness related to the disaster, which will help prepare for Typhoon Rai (202122). Partial least squares structural equation modeling (PLS-SEM) was utilized to determine factors affecting the perceived preparedness of Filipinos. In addition, machine learning using ANN was also utilized to verify and highlight the significant latent variables in the study. It was indicated from the result that AD was the most significant factor affecting perceived preparedness for Typhoon Rai (202122), followed by AW, ME, RP, PE, and CE as relatively significant.
From the results, it could be seen that disaster adaptation (AD) has the highest significant and direct effect on perceived preparedness (β = 0.582, p ≤ 0.001) with a 100 score of importance from ANN. According to Howe [113], individuals and households in the affected area’s adaptability to natural disasters will play a role in determining communities’ ability to recover after a catastrophic calamity such as a typhoon. The result of the study is supported by the findings of Mavhura et al. [114], which proved that the government’s institutional capacity for disaster preparedness significantly influences the community’s survival strategy against disasters. According to UNISDR [87], public and private investment in disaster risk prevention and reduction through structural and non-structural measures are essential to enhance community resilience and adaptability. Previous studies proved that government measures play a pivotal role in disaster adaptation and preparedness. Examples of these measures include the following: implementation of early recovery and rehabilitation interventions and early-stage reconstruction activities [115]; providing early warnings and information about evacuation orders before the typhoon [116]; and providing financial assistance to augment the resources of affected families for their acquisition of shelter materials and providing relief assistance and essential services to the disaster-stricken areas [117]. As the primary subject of disaster management, the government must take the lead in the emergency management process.
In addition, risk strategies should also be implemented based on specific components that predict community preparedness, especially in highly vulnerable communities, to improve overall community resilience. The need for efficient disaster management and adaptation techniques in these vulnerable communities is increasingly pressing. Hence, to be fully supported by the government and other agencies involved in disaster risk management, an adequately resourced regional strategy must be executed at the community level. According to UNISDR [53], floods can be reduced during a typhoon by monitoring and assessing rainfall intensity hourly, especially in places where the construction of houses or roads has hampered natural drainage without sufficient bridges. Then, a complete map of the community’s drainage can be constructed to restore natural drainage and build structural and design methods for increasing streams, extending bridges and using natural soil infiltration approaches. Furthermore, initiatives could include flood monitoring and control advancements and social support for affected households. With this, LGUs can prepare for disasters by decreasing and controlling the elements contributing to disasters at the community level.
Disaster awareness (AW) was also proved to have a significant positive effect on perceived preparedness for typhoons (β = 0.249, p ≤ 0.001). AW was the second most important factor for ANN, with 96.60%. Shi et al. [25] and Burningham et al. [26] found that awareness of the dangers of natural disasters can considerably improve an individual’s self-efficacy and ability to take preventive activities, confirming this finding. In a study by Gumasing et al. [118], it was mentioned that people would be able to recognize the procedures that must be followed during a typhoon and grasp the preventive steps to take in unforeseen calamities such as a typhoon if they are aware of the typhoon’s potential hazard. According to Guo et al. [119], one way to increase community awareness of natural disasters is to provide more information-seeking channels such as social media for residents during calamities. Because of their easy access and availability for social connectedness and interaction, social media has been a preferred source of information among Filipinos. It can quickly disseminate information about natural disasters, resulting in affective outcomes [120]. In this study, disaster awareness was found to be a significant factor in disaster preparedness since most of the study’s respondents are the younger generation (21–40 years old), who make up the largest population of social media users in the country. According to the Federal Emergency Management Agency [121], during natural disasters, people use social media for various reasons, including checking in on family and friends, seeking support, gathering information about the scope of the disaster, and providing ground-zero first-hand accounts. Hence, social media can play a significant role in emergency response and management during natural calamities [122].
Moreover, disaster education strives to improve individuals’ resiliency by strengthening disaster knowledge, building skills for preparing, adapting, mitigating, and responding to disaster’s detrimental consequences, and increasing public awareness of disaster risk mitigation methods that broaden the breadth of understanding. In the Philippines, disaster risk reduction management (DRRM) was incorporated into the curriculum for primary education to promote and strengthen the students’ culture of awareness, preparedness, and resiliency for disasters. According to Apronti et al. [123], students are the most vulnerable victims of disasters, as hazards can have a negative impact on their physical, emotional, and mental health. By integrating DRRM into the curriculum, students have acquired some disaster-related concepts and ideas. These have made them well-prepared, adaptive, and mindful of the risks posed by natural disasters. As such, it was proved in the study that disaster awareness played a significant role in disaster preparedness since most of the study’s respondents are the younger generation who have taken DRRM in their curriculum. With this, instructional intervention successfully achieved significant changes in students’ knowledge of disaster preparedness, as evidenced by improvements and changes in their attitudes toward disaster. Hence, disaster education is essential for successfully implementing disaster risk reduction strategies [38].
Subsequently, disaster awareness was also proven to positively influence risk perception (β = 0.483, p ≤ 0.001). Based on a disaster’s perceived risk and impact, natural disaster knowledge and awareness were favorably connected with residents’ coping and responding behavior, similar to the findings of Jiang et al. [124] and Jiang et al. [125]. It was also suggested by Sattar et al. [126] that the individuals’ perceptions of disaster risk, particularly in highly vulnerable locations, must be enhanced for them to make accurate judgments about natural disaster dangers. Individual risk perceptions must be formed to ensure a public response and effective protective action. Since most of the respondents of the study lived in the Visayas and Mindanao regions, which are considerably vulnerable to typhoons, it was found that they are more susceptible to experiencing threats brought by natural disasters due to their location, thus contributing to an increase in risk perception. In addition to being one of the most disaster-prone countries, the Philippines is subjected to numerous severe tropical cyclones and storms each year. Thus, disaster risk reduction measures should be integrated into climate change adaptation plans, development, and poverty reduction programs.
Furthermore, disaster awareness was also proved to significantly influence disaster adaptation (β = 0.751, p ≤ 0.001). This finding is supported by the study by Tanaka [63], which found that disaster awareness can be used as academic knowledge to help people adapt to disaster risk measures and motivate people to undertake protective behaviors during disasters. It could be inferred that since Filipinos are highly susceptible to natural disasters such as typhoons [20], their knowledge and awareness about disasters is high due to constant typhoon experience, thus resulting in high disaster adaptation [127]. In relation to a study by Tanaka [63], awareness of disasters, community knowledge, and previous experience serve as educational resources that aid disaster preparedness and adaptation. According to Bronfman et al. [127], individuals aged 30–44 years old are better prepared for flood-related disasters. This is because young people, according to studies, have a better ability to deal with a disaster situation practically and mentally [128,129]. When the demographics of this study are compared, it can be seen that the majority of the respondents (65%) are between the ages of 21 and 40. This demonstrates how respondents are more likely to have disaster adaptation due to their awareness.
Macro-ergonomics was also proved to significantly influence perceived preparedness (β = 0.234, p < 0.001). This was indicated to be the third most significant factor, with a score of importance of 79.50% in the ANN. In a study by DeYoung and Peters [130], it was found that disaster preparedness relates to confidence in the government in most populations. In understanding the challenges of predicting preparedness behaviors, the role of trust in the government in disaster situations remains critical. The role of government organizations and local actors during disasters plays a significant role in effective emergency preparations. These agencies play an important part in disaster preparedness by providing sufficient funds for key actors and reducing the demand for resources during the disaster response stage. Local governments and authorities must recognize their critical role in disaster management and the necessary skills and preparation to give support during the disaster response. Because the most effective disaster management occurs at the grassroots level, investments in local NGOs, civil society organizations, and community-based organizations are essential. They are frequently more capable of responding during disasters if given the resources and tools. Thus, local communities should promptly implement disaster response strategies through community participation and capacity building.
Risk perception was also proved to significantly affect perceived preparedness (β = 0.213, p = 0.001), similarly to the ANN results (74.50%). According to studies, the risk perception and fear of disasters increase an individual’s ability to take protective action [20,118,120]. This explains that as individuals become more at risk of natural disasters such as typhoons, they develop more emergency preparedness. In this present study, given that most of the respondents reside in typhoon-prone areas, it can be presumed that they frequently experience typhoon impacts. According to Kurata et al. [120], people who experienced natural disasters significantly increased their hazard awareness, and they used their acquired knowledge from the experience to prevent future occurrences. It is further explained that people’s risk perception of disaster is affected by the impact and aftermath of calamity on their assets, properties, and livelihood [120]. Typhoons generate many losses compared to other disasters; according to Bronfman et al. [127], there is a higher risk perception for typhoons than other disasters.
Physical ergonomics also significantly influenced perceived preparedness (β = 0.158, p < 0.010) with a 73.80% importance score from the ANN. This finding is supported by prior studies showing that the shelter’s physical design and structural support during calamities were crucial in disaster protection behaviors [32]. A study by Bashwari et al. [41] proved that shelters are an integral aspect of disaster response and recovery, especially in large-scale disasters such as typhoons. During calamities, shelters provide personal safety, climate security, and health protection for displaced individuals. Therefore, when planning and developing shelters, many elements should be considered, including their physical location and the demands and needs of potential users. All essential actors, such as local communities, NGOs, and other organizations, should provide complementary support to shelters. Local public health officials should also plan evacuation shelters’ construction, operation, and disassembly. As suggested by the WHO [131], to guarantee that all community members understand what should be done during an evacuation, affected communities must participate through community leaders, government, and non-governmental organizations. Additionally, the entire planning, response, and recovery process should be overseen by community leaders to aid in the identification and to secure local evacuation shelters. In the same way, community leaders can also assist in evaluating what supplies are available locally and the essential needs people have in the shelters, if any.
On the contrary, cognitive ergonomics (CE) was proven to have no significant influence on perceived preparedness from the SEM (β = 0.021, p = 0.657) and relatively low significance from the ANN (61.90%). Ong et al. [104,105] set a threshold of 60% for the acceptable significance level. The results indicate that CE may not be considered a factor in Filipinos’ perceived preparedness for Typhoon Rai (202122). This means that individuals’ mental and psychological states during typhoons do not play a role in enhancing their coping abilities and preparedness in the face of disaster. This finding contradicts the study of Tugade et al. [132], which proved that positive emotions are good indicators of coping resources and psychological resilience during adverse events like disasters. As mentioned in a study by Bollettino et al. [133], Filipinos have developed strong coping mechanisms over their long history of disaster experience since the Philippines is one of the world’s most hazardous countries regarding disaster exposure and vulnerability. Thus, people may lack an emotional basis stemming from previous typhoon experiences.
Because the Philippines is prone to natural disasters, the negative impact caused by typhoons is not unusual. Therefore, better information on typhoon safety measures, evacuation protocols, and shelter and relief operations is recommended to build resilience in disaster response.

5.1. Disaster Management Implications

The Philippines is particularly vulnerable to various risks due to its geographic location, including frequent typhoons, among the deadliest and most expensive natural disasters in the world [134]. The nation’s economy has suffered long-term effects from major and frequent disasters. Almost USD 8 million is projected to be lost annually from many hazards, roughly 69% of the nation’s spending [135]. Recent disaster events, particularly Super Typhoon Rai (202122), have resulted in many fatalities, population displacements, and financial expenses, indicating the need for increased disaster preparedness [136].
The Philippine government has invested a considerable number of resources in enhancing disaster preparedness and lowering susceptibility and exposure. The advantages of investing strategies to reduce the risk of natural disasters can significantly outweigh the expenses. Investing in preparedness and disaster risk reduction not only reduces costs from disasters; but also has positive effects on the economy, society, and environment, which improve the resilience of the country. Concerning this study, it could be seen that citizens of the country adapted to the disaster and are aware of the disastrous events of natural disasters, which led them to prepare. Subsequently, the government may capitalize on this and create mitigation plans and give assistance since people are highly willing to comply and follow based on their knowledge and experience with past natural disasters. The country has decided that preparing for disasters and acting on climate change are mandatory tasks for all levels of government to help shelter development.
The study’s findings also found that disaster knowledge should be given priority and are crucial in supporting institutional policies to enhance the resilience and adaptability of the Filipino people. With the 1.7 million houses, fishing communities, and agricultural land that were destroyed, which affected 9.9 million people across 8 regions, the government was able to act swiftly, which promoted the pre-emptive evacuation plans [137]. However, it was stated that the government response was still lacking due to the large impact of Super Typhoon Rai’s (202122) aftermath. The government should increase the response, development plans, humanitarian actions, disaster risk reduction, and assess different foreign and local financial institutions. In this way, the aftermath of future massive events may be reduced.
Moreover, reviewing institutional structures, revisiting policy, and addressing problems with resource mobilization are all necessary for disaster preparations. The Philippines’ principal concerns are finding ways to cope with the risks that are continually pushing the country’s institutions and preparedness procedures to their breaking point. In addition, the country recognizes the increasing frequency and severity of catastrophes made worse by climate change. With its high risk, the Philippines can be used as a model by other countries for fostering resilience and advance disaster risk reduction and preparations due to the country and its people’s adaptation and continuous improvement despite the negative effects brought by constant natural disasters such as typhoons [134].

5.2. Theoretical Contributions

Typhoons are regarded as the most destructive and devastating natural disasters. Although the Philippines is prone to typhoons due to its location along the Pacific Ring of Fire, emergency preparedness and efficient hazard mitigation methods might considerably lessen the effects of typhoons [20]. The present study investigated the Filipinos’ perceived preparedness for natural disasters, particularly typhoons. The indicators considered in the study are based on ergonomics and disaster risk reduction knowledge. Using the findings of this study, future academicians and disaster planners may look into how ergonomics can help develop disaster preparedness systems that increase resilience by increasing emergency management knowledge, strengthening community coordination and communication, reducing occupational hazards, and improving processes to improve response efficiency and effectiveness. In addition, the model developed in the present study can also be utilized as a theoretical framework for evaluating similar ergonomic-based [138,139,140,141] and knowledge-based disaster responses.

5.3. Practical Implications

To avoid the risks of typhoons, the outcomes of this study have highlighted the need to learn how to prepare for typhoons by doing the recommended action steps. Knowing the many reaction alternatives increase Filipinos’ confidence in implementing a solution. The study’s findings revealed that residents in highly exposed locations must practice typhoon preparation and evacuation ahead of time. The findings of this study can also be utilized to educate local communities about the importance of emergency response options during a typhoon to lessen the damage and risks associated with it. The findings of this study can potentially be used as a foundation for developing and executing natural disaster risk reduction strategies and policies by LGUs and NGOs.

5.4. Limitations

Despite the study’s encouraging outcomes, a few drawbacks were still considered. First, the investigation only gathered a small number of respondents because the data were only collected for a brief period of time. Thus, a similar study with a larger sample size is advised to conduct a multi-group analysis employing SEM and data mining. Second, the survey questionnaire was only distributed online because of the current COVID-19 pandemic and stringent lockdown execution; hence, most respondents were younger (21–40 y/o) since they have more access to online platforms and social media. Because older persons are more vulnerable to natural catastrophes like typhoons, it is proposed that future studies target respondents from a higher age group (41 and up). This would allow for a more comprehensive examination and explanation of Filipinos’ response effectiveness in preparing for the impending typhoon. In addition, other demographic characteristics may also be focused on, such as respondents of the lower economic bracket and those having less educational attainment, which may result in other results affecting perceived preparedness for super typhoons, such as Typhoon Rai (202122). Due to the limitations of the present scenario, such as COVID-19 lockdowns and closed regions due to the natural disaster, those with access to the internet were the only respondents this study could consider. Lastly, the study did not consider the moderating effects of socio-economic factors such as age, gender, location, residential type, and income on the perceived preparedness of Filipinos for a typhoon. Skewed samples can be observed in age, education, location, and income, which was one of the limitations of using an online survey. In addition, clustering these demographic statuses may also be considered to highlight the difference in behaviors. Hence, future researchers could replicate this study and consider these factors as moderators to confirm the hypotheses proposed in the study.

6. Conclusions

Since there has been little information on the role of ergonomics and disaster knowledge in understanding how individuals decide to prepare for natural disasters, it is essential to study these indicators’ effects on Filipinos’ preparedness for a typhoon. Ergonomic-based indicators for physical, cognitive, and macro-ergonomics were analyzed simultaneously with disaster-knowledge indicators such as awareness, adaptation, and risk perception. The partial least squares structural equation modeling (PLS-SEM) and an artificial neural network (ANN) were used to investigate the association of variables contributing to typhoon preparedness. The results showed that physical ergonomics and macro-ergonomics are key factors affecting the perceived preparedness of Filipinos for Typhoon Rai (202122). Moreover, disaster awareness, adaptation, and risk perception were also found to positively influence the respondents’ perceived preparedness, while awareness was found to significantly affect adaptation and risk perception.
As a result, better information on typhoon safety measures, evacuation protocols, and shelter and relief operations is recommended. People will be more aware of typhoon response behavior due to this study. Moreover, in areas where preparatory actions have been ineffectual or unsuccessful, people’s response efficacy will improve as an outcome of this research. Thus, future academics and disaster planners may use the results of this study to find ways to improve the effectiveness of typhoon preparedness even in different countries.

Author Contributions

Conceptualization, M.J.J.G., Y.T.P. and A.K.S.O.; methodology, M.J.J.G., Y.T.P. and A.K.S.O.; software, M.J.J.G., Y.T.P. and A.K.S.O.; validation, R.N. and S.F.P.; formal analysis, M.J.J.G., Y.T.P. and A.K.S.O.; investigation, M.J.J.G., Y.T.P. and A.K.S.O.; resources, M.J.J.G.; writing—original draft preparation, M.J.J.G., Y.T.P. and A.K.S.O.; writing—review and editing, R.N. and S.F.P.; supervision, Y.T.P., S.F.P. and R.N.; funding acquisition, Y.T.P. All authors have read and agreed to the published version of the manuscript.

Funding

This research was funded by Mapúa University Directed Research for Innovation and Value Enhancement (DRIVE).

Institutional Review Board Statement

This study was approved by Mapúa University Research Ethics Committees (FM-RC-22-22).

Informed Consent Statement

Informed consent was obtained from all subjects involved in the study.

Data Availability Statement

The data presented in this study are available on request from the corresponding author.

Acknowledgments

The researchers would like to extend their deepest gratitude to the respondents of this study despite the current COVID-19 inflation rate.

Conflicts of Interest

The authors declare no conflict of interest.

References

  1. About Tropical Cyclones. PAGASA (n.d.). Available online: https://www.pagasa.dost.gov.ph/information/about-tropical-cyclone (accessed on 27 July 2022).
  2. Chen, J.; Tam, C.-Y.; Cheung, K.; Wang, Z.; Murakami, H.; Lau, N.-C.; Garner, S.T.; Xiao, Z.; Choy, C.-W.; Wang, P. Changing impacts of tropical cyclones on East and Southeast Asian inland regions in the past and a globally warmed future climate. Front. Earth Sci. 2021, 9, 1065. [Google Scholar] [CrossRef]
  3. Jiansheng, W.; Yuhao, Z.; Tian, Y.; Bikai, C. Evolution of typhoon disasters characteristics and non-structural disaster avoidance measures in the china coastal main functional area. Int. J. Disaster Risk Reduct. 2020, 46, 101490. [Google Scholar] [CrossRef]
  4. Lorenzo, T.E.; Kinzig, A.P. Double exposures: Future water security across urban southeast asia. Water 2019, 12, 116. [Google Scholar] [CrossRef]
  5. Santos, G.D. 2020 tropical cyclones in the Philippines: A Review. Trop. Cyclone Res. Rev. 2021, 10, 191–199. [Google Scholar] [CrossRef]
  6. Songalia, R. In numbers: Typhoons in the Philippines and the 2016 Polls. RAPPLER. 19 March 2016. Available online: https://www.rappler.com/moveph/126001-typhoons-enter-philippines-fast-facts/ (accessed on 27 July 2022).
  7. Encyclopedia Britannica. Haiphong Cyclone; Encyclopedia Britannica: Chicago, IL, USA. 2021. Available online: https://www.britannica.com/event/Haiphong-cyclone (accessed on 27 July 2022).
  8. DSWD Dromic Report #21 on Typhoon "Odette" as of 25 December 2021, 6AM—Philippines. ReliefWeb. Available online: https://reliefweb.int/report/philippines/dswd-dromic-report-21-typhoon-odette-25-december-2021-6am (accessed on 27 July 2022).
  9. Mogul, R. Philippines’ Typhoon Death Toll Rises Further as Areas Remain Cut Off; CNN: Atlanta, GA, USA, 22 December 2021; Available online: https://www.cnn.com/2021/12/21/asia/typhoon-rai-philippines-deaths-intl-hnk/index.html (accessed on 27 July 2022).
  10. DOST PAGASA HIMARAWI-8 IRi, 16 December 2021. Available online: https://www.pagasa.dost.gov.ph/products-and-services/satellite (accessed on 27 July 2022).
  11. Luz, G.M. Why Disaster Preparedness Is Important. INQUIRER.net. 3 June 2017. Available online: https://opinion.inquirer.net/104497/disaster-preparedness-important (accessed on 27 July 2022).
  12. Bradley, T. Handbook to Practical Disaster Preparedness for the Family; CreateSpace Independent Publishing Platform: Scotts Valley, Ca, USA, 2010. [Google Scholar]
  13. Moe, T.L.; Pathranarakul, P. An integrated approach to natural disaster management: Public project management and its critical success factors. Disaster Prev. Manag. Int. J. 2006, 15, 396–413. [Google Scholar] [CrossRef]
  14. Wang, J.J.; Tsai, N.Y. Factors affecting elementary and junior high school teachers’ behavioral intentions to school disaster preparedness based on the theory of planned behavior. Int. J. Disaster Risk Reduct. 2022, 69, 102757. [Google Scholar] [CrossRef]
  15. Stewart, A.E. The Measurement of Personal Self-Efficacy in Preparing for a Hurricane and Its Role in Modeling the Likelihood of Evacuation. J. Mar. Sci. Eng. 2015, 3, 630–653. [Google Scholar] [CrossRef]
  16. Guo, C.; Sim, T.; Ho, H.C. Evaluation of risk perception, knowledge, and preparedness of extreme storm events for the improvement of Coastal Resilience Among Migrants: A Lesson from Hong Kong. Popul. Space Place 2020, 26, e2318. [Google Scholar] [CrossRef]
  17. Ajzen, I. From Intentions to Actions: A Theory of Planned Behavior. In Action Control. SSSP Springer Series in Social Psychology; Kuhl, J., Beckmann, J., Eds.; Springer: Berlin, Heidelberg, 1985. [Google Scholar] [CrossRef]
  18. Ryan, S.; Carr, A. Applying the biopsychosocial model to the management of rheumatic disease. Rheumatology 2010, 63–75. [Google Scholar] [CrossRef]
  19. Heidenreich, A.; Masson, T.; Bamberg, S. Let’s talk about flood risk—Evaluating a series of workshops on private flood protection. Int. J. Disaster Risk Reduct. 2020, 50, 10188. [Google Scholar] [CrossRef]
  20. Ong, A.K.; Prasetyo, Y.T.; Lagura, F.C.; Ramos, R.N.; Sigua, K.M.; Villas, J.A.; Young, M.N.; Diaz, J.F.; Persada, S.F.; Redi, A.A. Factors affecting intention to prepare for mitigation of “The big one” earthquake in the Philippines: Integrating protection motivation theory and extended theory of planned behavior. Int. J. Disaster Risk Reduct. 2021, 63, 102467. [Google Scholar] [CrossRef]
  21. Wong, C.; Monaghan, M. Behavior change techniques for diabetes technologies. Diabetes Digit. Health 2020, 65–75. [Google Scholar] [CrossRef]
  22. Lee, J.E.; Lemyre, L. A social-cognitive perspective of terrorism risk perception and individual response in Canada. Risk Anal. 2009, 29, 1265–1280. [Google Scholar] [CrossRef] [PubMed]
  23. Sasangohar, F.; Moats, J.; Mehta, R.; Peres, S.C. Disaster ergonomics: Human factors in COVID-19 pandemic emergency management. Hum. Factors J. Hum. Factors Ergon. Soc. 2020, 62, 1061–1068. [Google Scholar] [CrossRef]
  24. Gurses, A.P.; Tschudy, M.M.; McGrath-Morrow, S.; Husain, A.; Solomon, B.S.; Gerohristodoulos, K.A.; Kim, J.M. Overcoming COVID-19: What can human factors and ergonomics offer? J. Patient Saf. Risk Manag. 2020, 25, 49–54. [Google Scholar] [CrossRef]
  25. Shi, J.; Visschers, V.H.; Siegrist, M. Public perception of climate change: The importance of knowledge and cultural worldviews. Risk Anal. 2015, 35, 2183–2201. [Google Scholar] [CrossRef]
  26. Burningham, K.; Fielding, J.; Thrush, D. ‘It’ll never happen to me’: Understanding public awareness of local flood risk. Disasters 2008, 32, 216–238. [Google Scholar] [CrossRef]
  27. Zhang, W.; Wang, W.; Lin, J.; Zhang, Y.; Shang, X.; Wang, X.; Huang, M.; Liu, S.; Ma, W. Perception, knowledge and behaviors related to typhoon: A cross sectional study among rural residents in Zhejiang, China. Int. J. Environ. Res. Public Health 2017, 14, 492. [Google Scholar] [CrossRef] [PubMed]
  28. Chan, E.Y.Y.; Ho, J.Y. Urban community disaster and emergency health risk perceptions and preparedness. Sci. Technol. Disaster Risk Reduct. Asia 2018, 95–110. [Google Scholar] [CrossRef]
  29. Horberry, T.; Xiao, T.; Fuller, R.; Cliff, D. The role of Human Factors and Ergonomics in Mining Emergency Management: Three case studies. Int. J. Hum. Factors Ergon. 2013, 2, 116. [Google Scholar] [CrossRef]
  30. Gibson, W.H.; Megaw, E.D. An ergonomics appraisal of the piper alpha disaster. In Contemporary Ergonomics 1993; 1993; pp. 227–232. Available online: https://shora.tabriz.ir/Uploads/83/cms/user/File/657/E_Book/Economics/Contemporary%20Ergonomics%201993.pdf (accessed on 27 July 2022).
  31. Mallick, B.; Rahaman, K.R.; Vogt, J. Coastal Livelihood and physical infrastructure in Bangladesh after Cyclone Aila. Mitig. Adapt. Strateg. Glob. Chang. 2011, 16, 629–648. [Google Scholar] [CrossRef]
  32. Melgarejo, L.F.; Lakes, T. Urban adaptation planning and climate-related disasters: An integrated assessment of public infrastructure serving as temporary shelter during river floods in Colombia. Int. J. Disaster Risk Reduct. 2014, 9, 147–158. [Google Scholar] [CrossRef]
  33. Zulch, H. Psychological Preparedness for Natural Hazards–Improving Disaster Preparedness Policy and Practice; United Nations Office for Disaster Risk Reduction: Geneva, Switzerland, 2019; pp. 1–43. [Google Scholar]
  34. Mishra, S.; Suar, D. Effects of anxiety, disaster education, and resources on disaster preparedness behavior. J. Appl. Soc. Psychol. 2011, 42, 1069–1087. [Google Scholar] [CrossRef]
  35. Adger, W.N. Social capital, collective action, and adaptation to climate change. Econ. Geogr. 2003, 79, 387–404. [Google Scholar] [CrossRef]
  36. Tennant, E.; Gilmore, E.A. Government effectiveness and institutions as determinants of tropical cyclone mortality. Proc. Natl. Acad. Sci. USA 2020, 117, 28692–28699. [Google Scholar] [CrossRef]
  37. Newnham, E.A.; Balsari, S.; Lam, R.P.; Kashyap, S.; Pham, P.; Chan, E.Y.; Patrick, K.; Leaning, J. Self-efficacy and barriers to disaster evacuation in Hong Kong. Int. J. Public Health 2017, 62, 1051–1058. [Google Scholar] [CrossRef]
  38. Tuladhar, G.; Yatabe, R.; Dahal, R.K.; Bhandary, N.P. Disaster risk reduction knowledge of local people in Nepal. Geoenviron. Disasters 2015, 2, 5. [Google Scholar] [CrossRef]
  39. Mamon, M.A.C.; Suba, R.A.V.; Son, I.L. Disaster Risk Reduction Knowledge of Grade 11 Students: Impact of Senior High School Disaster Education in the Philippines. Int. J. Health Syst. Disaster Manag. 2017, 5, 69–74. [Google Scholar]
  40. Wedawatta, G.; Kulatunga, U.; Amaratunga, D.; Parvez, A. Disaster risk reduction infrastructure requirements for south-western Bangladesh. Built Environ. Proj. Asset Manag. 2016, 6, 379–390. [Google Scholar] [CrossRef]
  41. Bashawri, A.; Garrity, S.; Moodley, K. An overview of the design of disaster relief shelters. Procedia Econ. Financ. 2014, 18, 924–931. [Google Scholar] [CrossRef] [Green Version]
  42. Wei, Y.; Jin, L.; Xu, M.; Pan, S.; Xu, Y.; Zhang, Y. Instructions for planning emergency shelters and open spaces in China: Lessons from global experiences and expertise. Int. J. Disaster Risk Reduct. 2020, 51, 101813. [Google Scholar] [CrossRef]
  43. Akamatsu; Yamamoto. Suitability analysis for the emergency shelters allocation after an earthquake in Japan. Geosciences 2019, 9, 336. [Google Scholar] [CrossRef]
  44. United Nations High Commissioner for Refugees. The Sphere Project: Humanitarian Charter and Minimum Standards in Humanitarian Response; UNHCR: Geneva, Switzerland, 19 May 2011. [Google Scholar]
  45. Malkina-Pykh, I.G.; Pykh, Y.A. An integrated model of psychological preparedness for threat and impacts of climate change disasters. WIT Trans. Built Environ. 2013, 133, 121–132. [Google Scholar] [CrossRef]
  46. Terpstra, T. Emotions, trust, and perceived risk: Affective and cognitive routes to Flood Preparedness Behavior. Risk Anal. 2011, 31, 1658–1675. [Google Scholar] [CrossRef]
  47. Lindell, M.K.; Prater, C.S. Assessing community impacts of natural disasters. Nat. Hazards Rev. 2003, 4, 176–185. [Google Scholar] [CrossRef]
  48. Hossain, B. Role of organizations in preparedness and emergency response to flood disaster in Bangladesh. Geoenviron. Disasters 2020, 7, 1–16. [Google Scholar] [CrossRef]
  49. Dariagan, J.D.; Atando, R.B.; Asis, J.L. Disaster preparedness of local governments in Panay Island, Philippines. Nat. Hazards 2020, 105, 1923–1944. [Google Scholar] [CrossRef]
  50. Mondal, D.; Chowdhury, S.; Dasu, D. Role of Non Governmental organization in Disaster Management. Res. J. Agric. Sci. 2015, 6, 1485–1489. [Google Scholar]
  51. Lei, Y.; Wang, J.; Yue, Y.; Zhou, H.; Yin, W. Rethinking the relationships of vulnerability, resilience, and adaptation from a disaster risk perspective. Nat. Hazards 2014, 70, 609–627. [Google Scholar] [CrossRef]
  52. IPCC. Ipcc Fifth Assessment Report; IPCC: Geneva, Switzerland, 2014; Available online: https://www.ipcc.ch/assessment-report/ar5/ (accessed on 27 July 2022).
  53. UNISDR. Terminology on Disaster Risk Reduction; UNISDR: Geneva, Switzerland, 2009; Available online: https://www.undrr.org/publication/2009-unisdr-terminology-disaster-risk-reduction (accessed on 27 July 2022).
  54. Young, O.R.; Berkhout, F.; Gallopin, G.C.; Janssen, M.A.; Ostrom, E.; van der Leeuw, S. The globalization of socio-ecological systems: An agenda for scientific research. Glob. Environ. Chang. 2006, 16, 304–316. [Google Scholar] [CrossRef]
  55. Mishra, S.; Mazumdar, S. Disaster Management and Preparedness. Ecopsychology 2015, 7, 167–170. [Google Scholar] [CrossRef]
  56. Xu, D.; Peng, L.; Liu, S.; Wang, X. Influences of risk perception and sense of place on landslide disaster preparedness in southwestern China. Int. J. Disaster Risk Sci. 2018, 9, 167–180. [Google Scholar] [CrossRef]
  57. Miceli, R.; Sotgiu, I.; Settanni, M. Disaster preparedness and perception of flood risk: A study in an alpine valley in Italy. J. Environ. Psychol. 2008, 28, 164–173. [Google Scholar] [CrossRef]
  58. Martin, W.E.; Martin, I.M.; Kent, B. The role of risk perceptions in the risk mitigation process: The case of wildfire in high risk communities. J. Environ. Manag. 2009, 91, 489–498. [Google Scholar] [CrossRef]
  59. Demuth, J.L.; Morss, R.E.; Lazo, J.K.; Trumbo, C. The effects of past hurricane experiences on evacuation intentions through risk perception and efficacy beliefs: A mediation analysis. Weather. Clim. Soc. 2016, 8, 327–344. [Google Scholar] [CrossRef]
  60. Xu, G.; Feng, X.; Li, Y.; Chen, X.; Jia, J. Environmental risk perception and its influence on well-being. Chin. Manag. Stud. 2017, 11, 35–50. [Google Scholar] [CrossRef]
  61. Teo, M.; Goonetilleke, A.; Ahankoob, A.; Deilami, K.; Lawie, M. Disaster awareness and information seeking behaviour among residents from low socio-economic backgrounds. Int. J. Disaster Risk Reduct. 2018, 31, 1121–1131. [Google Scholar] [CrossRef]
  62. Jennings-Sanders, A. Teaching disaster nursing by utilizing the Jennings Disaster Nursing Management Model. Nurse Educ. Pract. 2004, 4, 69–76. [Google Scholar] [CrossRef]
  63. Tanaka, K. The impact of Disaster Education on public preparation and mitigation for earthquakes: A cross-country comparison between Fukui, Japan and the San Francisco Bay Area, California, USA. Appl. Geogr. 2005, 25, 201–225. [Google Scholar] [CrossRef]
  64. Rana, I.A.; Routray, J.K. Actual vis-à-vis perceived risk of flood prone urban communities in Pakistan. Int. J. Disaster Risk Reduct. 2016, 19, 366–378. [Google Scholar] [CrossRef]
  65. Santos, A.N.N.I.E.; Fernandez, V.A.N.E.S.S.A.; Ilustre, R.A.M.I.L. English language proficiency in the Philippines: An overview. Int. J. Engl. Lang. Stud. 2022, 4, 46–51. [Google Scholar] [CrossRef]
  66. Yamane, T. Statistics: An introductory Analysis, 2nd ed.; Harper & Row: New York, NY, USA; Manhattan, NY, USA, 1967. [Google Scholar]
  67. PSA. Household Population, Number of Households, and Average Household Size of the Philippines (2020 Census of Population and Housing). Philippine Statistics Authority. 23 March 2022. Available online: https://psa.gov.ph/content/household-population-number-households-and-average-household-size-philippines-2020-census (accessed on 27 July 2022).
  68. Hair, J.; Hult, G.; Ringle, C.; Sarstedt, M. A Primer on Partial Least Squares Structural Equation Modeling PLS-SEM; SAGE: Thousand Oaks, CA, USA, 2017. [Google Scholar]
  69. Henseler, J.; Dijkstra, T.; Sarstedt, M.; Ringle, C.; Diamantopoulos, A.; Straub, D. Common beliefs and reality about partial least squares: Comments on Rönkkö & Evermann (2013). Organ. Res. Methods 2014, 17, 182–209. [Google Scholar]
  70. Kline, R. Principles and Practice of Structural Equation Modeling, 3rd ed.; Guilford: New York, NY, USA, 2011. [Google Scholar] [CrossRef]
  71. German, J.D.; Redi, A.A.; Prasetyo, Y.T.; Persada, S.F.; Ong, A.K.; Young, M.N.; Nadlifatin, R. Choosing a package carrier during COVID-19 pandemic: An integration of pro-environmental planned behavior (PEPB) theory and Service Quality (SERVQUAL). J. Clean. Prod. 2022, 346, 131123. [Google Scholar] [CrossRef] [PubMed]
  72. Kuroiwa, J. Peru’s National Educational Program for Disaster Prevention and Mitigation (PNEPDPM). In Training and Education for Improving Earthquake Disaster Management in Developing Countries Report and Summary of Proceedings of the Sixth International Research and Training Seminar on Regional Development Planning for Disaster Prevention Tsukuba Japan 14 December 1992 Nagoya Japan; UNCRD Meeting Report Series No. 57; United Nations Centre for Regional Development: Nagoya, Japan, 1993; pp. 95–102. [Google Scholar]
  73. McMillan, J.H.; Schumacher, S. Research in Education: A Conceptual Introduction; Longman: New York, NY, USA, 1993. [Google Scholar]
  74. Andrews, J.; Benthien, M.; Tekula, S. Southern California Earthquake Center Outreach Report 1998: Public Awareness, Education and Knowledge Transfer Programs and Fiscal Year 1998 Activities; Southern California Earthquake Center: Los Angeles, CA, USA, 1998. [Google Scholar]
  75. Thorne, S.R.N. Data analysis in qualitative research. Evid. Based Nurs. 2000, 3, 68–70. [Google Scholar] [CrossRef]
  76. Henning, E.; Van Rensburg, W.; Smit, B. Finding Your Way in Qualitative Research; Van Schaik Publishers: Pretoria, South Africa, 2004. [Google Scholar]
  77. Ronan, K.; Crellin, K.; Johnston, D. Correlates of hazards education for youth: A replication study. Nat. Hazards 2010, 53, 503–526. [Google Scholar] [CrossRef]
  78. Lekalakala, M.J. Teachers perceptions about lesson planning to include a disaster risk reduction focus. Master’s Thesis, University of the Free State, Bloemfontein, South Africa, 2011. [Google Scholar]
  79. Taherdoost, H. Validity and reliability of the research instrument; how to test the validation of a questionnaire/survey in a Research. SSRN Electron. J. 2016, 5, 28–36. [Google Scholar] [CrossRef]
  80. Costello, A.B.; Osborne, J. Best practices in exploratory factor analysis: Four recommendations for getting the most from your analysis. Pract. Assess. Res. Eval. 2005, 10, 7. [Google Scholar]
  81. Hair, J.F. Multivariate Data AnalysisAn Overview. In International Encyclopedia of Statistical Science; Lovric, M., Ed.; Springer: Berlin/Heidelberg, Germany, 2011. [Google Scholar] [CrossRef]
  82. Arpaci, I. Understanding and predicting students’ intention to use mobile cloud storage services. Comput. Hum. Behav. 2016, 58, 150–157. [Google Scholar] [CrossRef]
  83. Hair, J.F.; Black, W.C.; Babin, B.J.; Anderson, R.E. Multivariate Data Analysis, 7th ed.; Pearson: New York, NY, USA, 2010. [Google Scholar]
  84. Zafra, R.G.; Mayo, J.R.; Villareal, P.J.; De Padua, V.M.; Castillo, M.H.; Sundo, M.B.; Madlangbayan, M.S. Structural and thermal performance assessment of shipping container as post-disaster housing in tropical climates. Civ. Eng. J. 2021, 7, 1437–1458. [Google Scholar] [CrossRef]
  85. Wang, D.; Liang, S.; Chen, B.; Wu, C. Investigation on the impacts of natural lighting on occupants’ wayfinding behavior during emergency evacuation in underground space. Energy Build. 2022, 255, 111613. [Google Scholar] [CrossRef]
  86. Sushanti, I.R.; Imansyah, N.H.; Hirsan, F.P.; Putranadi, A. Feasibility Study and resilience disaster assessment toward shelter and settlement areas in Rinjani Circumference, Sembalun District, East Lombok, West Nusa tenggara province. IOP Conf. Ser. Mater. Sci. Eng. 2019, 674, 012016. [Google Scholar] [CrossRef]
  87. UNISDR. Sendai Framework for Disaster Risk Reduction 2015–2030; UNISDR: Geneva, Switzerland, 2015; Available online: https://www.undrr.org/publication/sendai-framework-disaster-risk-reduction-2015-2030 (accessed on 27 July 2022).
  88. Udwin, O.; Boyle, S.; Yule, W.; Bolton, D.; O’Ryan, D. Risk factors for long-term psychological effects of a disaster experienced in adolescence: Predictors of post traumatic stress disorder. J. Child Psychol. Psychiatry 2000, 41, 969–979. [Google Scholar] [CrossRef] [PubMed]
  89. Cook, J.D.; Bickman, L. Social Support and psychological symptomatology following a natural disaster. J. Trauma. Stress 1990, 3, 541–556. [Google Scholar] [CrossRef]
  90. Berah, E.F.; Jones, H.J.; Valent, P. The experience of a mental health team involved in the early phase of a disaster. Aust. N. Z. J. Psychiatry 1984, 18, 354–358. [Google Scholar] [CrossRef]
  91. Mason, V.; Andrews, H.; Upton, D. The psychological impact of exposure to floods. Psychol. Health Med. 2010, 15, 61–73. [Google Scholar] [CrossRef]
  92. Matunhay, L.M. Disaster Preparedness and Resiliency of the Local Government Unit of Compostela. Int. J. Sci. Basic Appl. Res. (IJSBAR) 2018, 42, 56–67. [Google Scholar]
  93. Comighud, S.M.T. Implementation of the Public Schools’ Disaster Risk Reduction Management Program and Level of Capabilities to Respond. Int. J. Sci. Res. 2020, 9, 752. [Google Scholar] [CrossRef]
  94. Yang, L.; Cao, C.; Wu, D.; Qiu, H.; Lu, M.; Liu, L. Study on Typhoon Disaster Loss and Risk Prediction and Benefit Assessment of Disaster Prevention and Mitigation. Trop. Cyclone Res. Rev. 2018, 7, 237–246. [Google Scholar]
  95. Ouellette, J.A.; Wood, W. Habit and intention in everyday life: The multiple processes by which past behavior predicts future behavior. Psychol. Bull. 1998, 124, 54. [Google Scholar] [CrossRef]
  96. Fan, Y.; Chen, J.; Shirkey, G.; John, R.; Wu, S.R.; Park, H.; Shao, C. Applications of structural equation modeling (SEM) in ecological studies: An updated review. Ecol. Processes 2016, 5, 1–12. [Google Scholar] [CrossRef]
  97. Shi, J.; Sun, Y.; Su, H.; Wang, Y.; Huang, Z.; Gao, L. Risk-taking behavior of drilling workers: A study based on the structural equation model. Int. J. Ind. Ergon. 2021, 86, 103219. [Google Scholar] [CrossRef]
  98. Rigdon, E. Rethinking partial least squares path modelling: In praise of simple methods. Long Range Plan. 2012, 45, 341–358. [Google Scholar] [CrossRef]
  99. Hu, L.T.; Bentler, P.M. Cutoff criteria for fit indexes in covariance structure analysis: Conventional criteria versus new alternatives. Struct. Equ. Modeling: A Multidiscip. J. 1999, 6, 1–55. [Google Scholar] [CrossRef]
  100. Baumgartner, H.; Homburg, C. Applications of structural equation modeling in marketing and consumer research: A review. Int. J. Res. Mark. 1996, 13, 139–161. [Google Scholar] [CrossRef]
  101. Yuduang, N.; Ong, A.K.; Vista, N.B.; Prasetyo, Y.T.; Nadlifatin, R.; Persada, S.F.; Gumasing, M.J.; German, J.D.; Robas, K.P.; Chuenyindee, T.; et al. Utilizing structural equation modeling–artificial neural network hybrid approach in determining factors affecting perceived usability of mobile mental health application in the Philippines. Int. J. Environ. Res. Public Health 2022, 19, 6732. [Google Scholar] [CrossRef] [PubMed]
  102. Oktarina, R.; Bahagia, S.N.; Diawati, L.; Pribadi, K.S. Artificial neural network for predicting earthquake casualties and damages in Indonesia. IOP Sci. Earth Environ. Sci. 2020, 426, 12156. [Google Scholar] [CrossRef]
  103. Yariyan, P.; Zabihi, H.; Wolf, I.D.; Karami, M.; Amiriyan, S. Earthquake risk assessment using an integrated fuzzy analytic hierarchy process with artificial neural networks based on GIS: A case study of sanandaj in Iran. Int. J. Disaster Risk Reduct. 2020, 50, 101705. [Google Scholar] [CrossRef]
  104. Ong, A.K.; Chuenyindee, T.; Prasetyo, Y.T.; Nadlifatin, R.; Persada, S.F.; Gumasing, M.J.; German, J.D.; Robas, K.P.; Young, M.N.; Sittiwatethanasiri, T. Utilization of random forest and deep learning neural network for predicting factors affecting perceived usability of a COVID-19 contact tracing mobile application in Thailand “Thaichana.”. Int. J. Environ. Res. Public Health 2022, 19, 6111. [Google Scholar] [CrossRef]
  105. Ong, A.K.; Prasetyo, Y.T.; Velasco, K.E.; Abad, E.D.; Buencille, A.L.; Estorninos, E.M.; Cahigas, M.M.; Chuenyindee, T.; Persada, S.F.; Nadlifatin, R.; et al. Utilization of random forest classifier and artificial neural network for predicting the acceptance of reopening decommissioned nuclear power plant. Ann. Nucl. Energy 2022, 175, 109188. [Google Scholar] [CrossRef]
  106. Sharma, S.; Sharma, A.; Athaiya, A. Activation Functions in Neural Network. Int. J. Appl. Sci. Technol. 2020, 4, 310–316. [Google Scholar] [CrossRef]
  107. Feng, J.; Lu, S. Performance Analysis of Various Activation Function in Artificial Neural Networks. IOP Conf. Ser. J. Phys. Conf. Ser. 2019, 1237, 22030. [Google Scholar] [CrossRef]
  108. Eckle, K.; Schmidt-Heiber, J. A comparison of deep networks with RELU activation function and linear spline-type methods. Neural Netw. 2019, 110, 232–242. [Google Scholar] [CrossRef] [PubMed]
  109. Pi, Y.; Nath, N.D.; Behzadan, A.H. Convultional neural networks for object detection in aerial imagery for disaster response and recovery. Adv. Eng. Inform. 2020, 43, 101009. [Google Scholar] [CrossRef]
  110. Anbarasan, M.; Muthu, B.; Sivaparthipan, C.B.; Sundarasekar, R.; Kadry, S.; Krishnamoorthy, S.; Samuel, D.J.; Dasel, A.A. Detection of flood disaster system based on IoT, big data, and convolutional neural network. Comput. Commun. 2010, 150, 150–157. [Google Scholar] [CrossRef]
  111. Satwik, P.M.; Sundram, M. An integrated approach for weather forecasting and disaster prediction using deep learning architecture based on memory Augmented Neural Network’s (MANN’s). Mater. Today Proc. 2021; in press. [Google Scholar]
  112. Dijkstra, T.K.; Henseler, J. Consistent partial least squares path modeling. MIS Q. 2015, 39, 297–316. [Google Scholar] [CrossRef]
  113. Howe, P.D. Hurricane Preparedness as anticipatory adaptation: A case study of community businesses. Glob. Environ. Chang. 2011, 21, 711–720. [Google Scholar] [CrossRef]
  114. Mavhura, E.; Manyena, S.B.; Collins, A.E.; Manatsa, D. Indigenous Knowledge, coping strategies and resilience to floods in Muzarabani, Zimbabwe. Int. J. Disaster Risk Reduct. 2013, 5, 38–48. [Google Scholar] [CrossRef]
  115. Suppasri, A.; Goto, K.; Muhari, A.; Ranasinghe, P.; Riyaz, M.; Affan, M.; Mas, E.; Yasuda, M.; Imamura, F. A decade after the 2004 I ndian Ocean Tsunami: The progress in disaster preparedness and future challenges in Indonesia, Sri Lanka, Thailand and the Maldives. Pure Appl. Geophys. 2015, 172, 3313–3341. [Google Scholar] [CrossRef]
  116. Walch, C. Evacuation ahead of natural disasters: Evidence from cyclone phailin in India and typhoon haiyan in the Philippines. Geo Geogr. Environ. 2018. [Google Scholar] [CrossRef]
  117. Luna, E.M. Disaster mitigation and preparedness: The case of ngos in the Philippines. Disasters 2001, 25, 216–226. [Google Scholar] [CrossRef]
  118. Gumasing, M.J.; Prasetyo, Y.T.; Ong, A.K.; Nadlifatin, R. Determination of factors affecting the response efficacy of Filipinos under Typhoon Conson 2021 (jolina): An extended protection motivation theory approach. Int. J. Disaster Risk Reduct. 2022, 70, 102759. [Google Scholar] [CrossRef]
  119. Guo, C.; Sim, T.; Ho, H.C. Impact of information seeking, disaster preparedness and typhoon emergency response on perceived community resilience in Hong Kong. Int. J. Disaster Risk Reduct. 2020, 50, 101744. [Google Scholar] [CrossRef]
  120. Kurata, Y.B.; Prasetyo, Y.T.; Ong, A.K.; Nadlifatin, R.; Persada, S.F.; Chuenyindee, T.; Cahigas, M.M. Determining factors affecting preparedness beliefs among Filipinos on Taal Volcano eruption in Luzon, Philippines. Int. J. Disaster Risk Reduct. 2022, 76, 103035. [Google Scholar] [CrossRef]
  121. Federal Emergency Management Agency. Episode 91: Public Information in Emergency Management; FEMA.gov: Washington, DC, USA, 2020.
  122. Phengsuwan, J.; Shah, T.; Thekkummal, N.B.; Wen, Z.; Sun, R.; Pullarkatt, D.; Thirugnanam, H.; Ramesh, M.V.; Morgan, G.; James, P.; et al. Use of social media data in Disaster Management: A survey. Future Internet 2021, 13, 46. [Google Scholar] [CrossRef]
  123. Apronti, P.T.; Osamu, S.; Otsuki, K.; Berisavljevic, G.K. Education for disaster risk reduction (DRR): Linking theory with practice in Ghana’s basic schools. Sustainability 2015, 7, 9160–9186. [Google Scholar] [CrossRef]
  124. Jiang, L.P.; Fu, L.Y.; Wang, Y.T.; Wang, Y. Risk perception of rural inhabitants and their capacity to respond to typhoon. Chin. Rural Health Serv. Adm 2011, 7, 715–717. [Google Scholar]
  125. Jiang, L.P.; Yao, L.; Bond, E.F.; Wang, Y.L.; Huang, L.Q. Risk perceptions and preparedness of typhoon disaster on coastal inhabitants in China. Am. J. Disaster Med. 2011, 6, 119–126. [Google Scholar] [CrossRef]
  126. Sattar, S.A.L.A.; Zahra, N.A.I.; Mohamed, W.M. The effect of an educational intervention about disaster preparedness on knowledge and attitudes of technical nursing institute intern-nurse students. Am. J. Nurs. 2018, 7, 287–295. [Google Scholar]
  127. Bronfman, N.C.; Cisternas, P.C.; Repetto, P.B.; Castañeda, J.V. Natural disaster preparedness in a multi-hazard environment: Characterizing the sociodemographic profile of those better (worse) prepared. PLoS ONE 2019, 14, e0214249. [Google Scholar] [CrossRef]
  128. Finnis, K.K.; Johnston, D.M.; Ronan, K.R.; White, J.D. Hazard perceptions and preparedness of Taranaki youth. Disaster Prev. Manag. Int. J. 2010, 19, 175–184. [Google Scholar] [CrossRef]
  129. Khorram-Manesh, A. Youth Are Our Future Assets in Emergency and Disaster Management. Bull. Emerg. Trauma 2017, 5, 1–3. [Google Scholar] [PubMed]
  130. DeYoung, S.E.; Peters, M. My Community, My Preparedness: The Role of Sense of Place, Community, and Confidence in Government in Disaster Readiness. Int. J. Mass Emergencies Disasters 2016, 34, 250–282. [Google Scholar]
  131. WHO. Disaster Evacuation Shelters in the Context of COVID-19. Available online: https://www.who.int/westernpacific/publications-detail/WPR-DSE-2020-033 (accessed on 2 September 2022).
  132. Tugade, M.M.; Fredrickson, B.L. Resilient individuals use positive emotions to bounce back from negative emotional experiences. J. Personal. Soc. Psychol. 2004, 86, 320. [Google Scholar] [CrossRef] [PubMed]
  133. Bollettino, V.; Alcayna, T.; Enriquez, K.; Vinck, P. Perceptions of Disaster Resilience and Preparedness in the Philippines; Harvard Humanitarian Initiative: Cambridge, MA, USA, 2018. [Google Scholar]
  134. Doroteo, H.J.E. Disaster Risk Profile and Disaster Risk Management Framework of the Philippines: Natural Disasters. Master’s Thesis, University of Oviedo, Asturias, Spain, 2015. [Google Scholar]
  135. Alcayna, T.; Bollettino, V.; Dy, P.; Vinck, P. Resilience and Disaster Trends in the Philippines: Opportunities for National and Local Capacity Building. PLoS Curr. 2016. [Google Scholar] [CrossRef] [PubMed]
  136. Resuello, M.D. Building disaster resilient local economy: The case of the Philippines. J. Public Adm. Gov. 2020, 10, 179. [Google Scholar] [CrossRef]
  137. Philippines: Super Typhoon Rai (odette) humanitarian needs and priorities revision (Dec 2021–Jun 2022) (2 Feb 2022)—Philippines. Available online: https://reliefweb.int/report/philippines/philippines-super-typhoon-rai-odette-humanitarian-needs-and-priorities-revision (accessed on 3 September 2022).
  138. Lin, C.J.; Efranto, R.Y.; Santoso, M.A. Identification of workplace social sustainability indicators related to employee ergonomics perception in Indonesian industry. Sustainability 2021, 13, 11069. [Google Scholar] [CrossRef]
  139. Lin, C.J.; Lukodono, R.P. Sustainable human–robot collaboration based on Human Intention Classification. Sustainability 2021, 13, 5990. [Google Scholar] [CrossRef]
  140. Lin, C.J.; Belis, T.T.; Caesaron, D.; Jiang, B.C.; Kuo, T.C. Development of sustainability indicators for employee-activity based production process using Fuzzy Delphi method. Sustainability 2020, 12, 6378. [Google Scholar] [CrossRef]
  141. Lin, C.J.; Belis, T.T.; Kuo, T.C. Ergonomics-based factors or criteria for the evaluation of Sustainable Product Manufacturing. Sustainability 2019, 11, 4955. [Google Scholar] [CrossRef] [Green Version]
Figure 1. Typhoon Rai (202122) satellite image [10] (there is no copyright issue).
Sustainability 14 12202 g001
Figure 2. The proposed conceptual framework.
Sustainability 14 12202 g002
Figure 3. The initial SEM for determining the perceived preparedness for Typhoon Rai (202122).
Sustainability 14 12202 g003
Figure 4. The final SEM for determining the perceived preparedness for Typhoon Rai (202122).
Sustainability 14 12202 g004
Figure 5. Training and validation loss rate.
Sustainability 14 12202 g005
Figure 6. Optimal ANN model.
Sustainability 14 12202 g006
Table 2. Respondents’ descriptive statistics (n = 414).
CharacteristicsCategoryN%
GenderFemale21051%
Male20449%
Age20 and below10024%
21–4026865%
41–604611%
61 and above00%
EducationFinished college or with a graduate degree12831%
Attended college23256%
Attended high school5213%
Attended at least grade school level20%
RegionRegion V328%
CAR20%
NCR123%
Region VI4210%
Region VII5413%
Region VIII7418%
Region X195%
Region XI17943%
ResidentialCity25862%
Town5814%
Province10826%
Household Size141%
2266%
34812%
4 10425%
5 or more23256%
Household Monthly IncomeLess than 40,00019647%
40,001–70,00010225%
70,001–100,0005213%
100,001–130,000164%
More than 130,0004812%
Table 3. Statistical analysis of indicators.
VariableItemMeanSDFactor Loading
InitialFinal
Physical ErgonomicsPE13.3041.1250.7290.885
PE23.3141.1520.7760.812
PE32.8791.0720.553-
PE44.1301.1910.8320.854
PE54.1981.2530.8690.881
PE64.3571.0200.8320.845
PE73.4400.9660.7540.813
PE83.3960.9870.616-
PE93.2220.9820.527-
Cognitive ErgonomicsCE12.9741.2030.711-
CE23.1881.3360.7070.791
CE32.8601.2640.8640.882
CE43.9571.2170.8170.898
CE53.2331.1920.7620.791
CE63.4061.1710.7310.788
CE73.7291.2290.682-
Macro-ergonomicsME12.9281.0820.8600.868
ME22.8161.0920.8790.885
ME33.2471.1860.8890.902
ME42.8451.2020.8530.898
ME53.1391.1160.9000.905
ME63.1021.2030.8370.841
ME72.5801.1350.628-
Disaster AdaptationAD13.7831.1570.8270.897
AD23.8121.0710.8180.828
AD33.4351.1180.8850.885
Disaster AwarenessAW13.1451.2700.8630.875
AW23.4641.1910.8330.885
AW33.6861.0280.9790.963
AW43.8501.1340.8670.888
AW53.3291.2190.627-
AW63.1280.8790.584-
Risk PerceptionRP14.0051.0140.8530.863
RP22.7891.1830.8170.837
RP33.3090.8950.8350.857
Perceived PreparednessPP14.3040.9110.8200.836
PP24.3960.8890.7460.829
PP33.5311.0670.620-
PP43.4981.1070.7640.777
PP53.4780.8950.7210.810
PP63.6141.1360.8000.803
PP73.3241.0430.8690.900
Table 4. Composite reliability.
Latent VariablesItemsCronbach’s αFactor LoadingsAverage Variance Extracted (AVE)Composite Reliability (CR)
Physical ErgonomicsPE10.9390.8850.7210.849
PE20.812
PE40.854
PE50.881
PE60.845
PE70.813
Cognitive ErgonomicsCE20.9170.7910.6910.831
CE30.882
CE40.898
CE50.791
CE60.788
Macro-ergonomicsME10.9510.8680.7950.892
ME20.885
ME30.902
ME40.898
ME50.905
ME60.841
Disaster AdaptationAD10.9030.8970.7580.871
AD20.828
AD30.885
Disaster AwarenessAW10.9470.8750.8160.903
AW20.885
AW30.963
AW40.888
Risk PerceptionRP10.8880.8630.7270.852
RP20.837
RP30.857
Perceived PreparednessPP10.9280.8360.6830.827
PP20.829
PP40.777
PP50.810
PP60.803
PP70.900
Table 5. Discriminant validity: Fornell–Larcker criterion.
ConstructDisaster AdaptationDisaster AwarenessCognitive ErgonomicsMacro-ErgonomicsPhysical ErgonomicsPerceived PreparednessRisk Perception
Disaster Adaptation0.891
Disaster Awareness0.7120.832
Cognitive Ergonomics0.5210.4290.850
Macro-ergonomics0.5500.4500.6040.810
Physical Ergonomics0.7500.6290.6840.6790.856
Perceived Preparedness0.6820.6730.6290.5810.6290.829
Risk Perception0.5240.5430.4270.4920.4590.6030.873
Table 6. Heterotrait–Monotrait (HTMT) ratio.
ConstructDisaster AdaptationDisaster AwarenessCognitive ErgonomicsMacro-ErgonomicsPhysical ErgonomicsPerceived Preparedness
Disaster Awareness0.712
Cognitive Ergonomics0.5510.523
Macro-ergonomics0.5830.4470.623
Physical Ergonomics0.7920.6280.7120.602
Perceived Preparedness0.6540.5890.6480.6120.534
Risk Perception0.4720.4520.4670.5130.4670.547
Table 7. Model fit.
Table 7. Model fit.
Goodness of Fit Measures of the SEMParameter EstimatesMinimum Cut-OffRecommended by
SRMR0.061<0.08Hu & Bentler [99]
(Adjusted) Chi-square/dF3.214<5.0Hooper [99]
Normal Fit Index (NFI)0.898>0.80Baumgartner [100]
Table 8. Direct, indirect, and total effects.
NoVariableDirect Effectp-ValueIndirect Effectp-ValueTotal Effectp-Value
1PE→PP0.1580.009--0.1580.009
2CE→PP0.0210.657--0.0210.787
3ME→PP0.2340.000--0.2340.000
4AD→PP0.5820.000--0.5820.000
5RP→PP0.2130.000--0.2130.000
6AW→AD0.7510.000--0.7510.000
7AW→RP0.4830.000--0.4830.000
8AW→PP0.2490.0000.4520.0000.7010.000
Table 9. Summary of ANN.
LatentAverage TrainingStandard DeviationAverage TestingStandard Deviation
AD75.825.56888.334.765
AW73.376.05487.865.312
RP75.253.54784.954.764
PE70.954.80283.864.581
CE79.616.33680.144.386
ME72.922.97686.904.323
Table 10. Score of importance.
LatentImportanceScore (%)
AD0.206100
AW0.19996.60
ME0.16379.50
RP0.15374.50
PE0.15273.80
CE0.12761.90
Publisher’s Note: MDPI stays neutral with regard to jurisdictional claims in published maps and institutional affiliations.

