1. Introduction
Large-diameter Open-Ended Pipe Piles (LDOEPPs) are steel or prestressed concrete pipe piles with diameters larger than 0.91 m [
1]. These piles, when properly constructed, could provide high load-carrying capacity against axial loading, uplift, and overturning, even in poor soil conditions [
2,
3]. The initial uses and experiences with LDOEPPs are acquired in the offshore industry [
4,
5]. They are becoming attractive in other areas, such as the transportation engineering, due to savings in construction costs and project schedules [
1]. As these piles can be driven into the ground through water, there is no need to build a cofferdam, as is required for the construction of conventional drilled shafts. A US national survey on the use of LDOEPPs conducted by the state Department of Transportations (DOTs) in the US indicated that 44% of state DOTs have had experience with LDOEPPs in recent years [
1]. An example application in California showed the use of large open-ended pipe piles for a bridge project had reduced the foundation construction time by half and led to a cost saving of
$2.8 million [
6].
Despite the advantages in offshore engineering projects, there are also challenges in the design and construction of this type of piling, due to the limited experience at present. As a pile is driven into the ground, soil is squeezed inside the pipe and forms an arching effect within the soil column, which prevents further soil intrusion, but significantly increases the inner unit frictional resistance [
7]. The bearing capacity and drivability of open-ended pipe piles depend largely on the degree of soil plugging [
8,
9]. A fully plugged pipe pile behaves like a closed-ended pile [
10]. Experience also indicates that this type of pile cannot be treated merely as a scaled-up version of a standard driven pile. Bradshaw et al. [
11] measured the load transfer curves from a static load test performed on a 1.8 m-diameter pipe pile in silty soils in Rhode Island and reported a smaller loading carrying capacity compared to conventional piles.
Various experimental studies have been conducted aiming to understand the soil plug formation mechanism inside LDOEPPs [
12,
13,
14]. By using photo-elastic materials, Dijkstra and Broere [
15] demonstrated the force transmission and arching effect at the bottom of a soil plug. Laboratory experiments also indicated that there is a significantly high load transfer over the bottom of a soil plug, which is about three to four times the pile diameter [
16,
17]. Field tests on large-diameter pipe piles have shown that a relatively large displacement is required to fully mobilize the plug resistance [
11]. Numerical methods, such as the finite element method and discrete element method, were also used to study the mechanical performance of open-ended pipe piles under axial loads [
18,
19,
20,
21]. Factors determining the plugging mechanism include: hammer-pile impact, construction disturbance (driven pile or jacked pile), pile diameter, pile length to diameter ratio, mechanical soil properties, and friction at the soil–pile interface [
22,
23,
24,
25,
26]. There are also studies focusing on the potential corrosion of steel materials in long-term service life [
27].
Recently, engineers and researchers have proposed various geometric designs, including the use of pile sleeves, for LDOEPPs to control the formation of soil plugging inside the pipe pile. Kumara et al. [
28] showed that the installation of a small inner sleeve at the bottom of pipe piles could increase the degree of soil plugging. Kien and Ito [
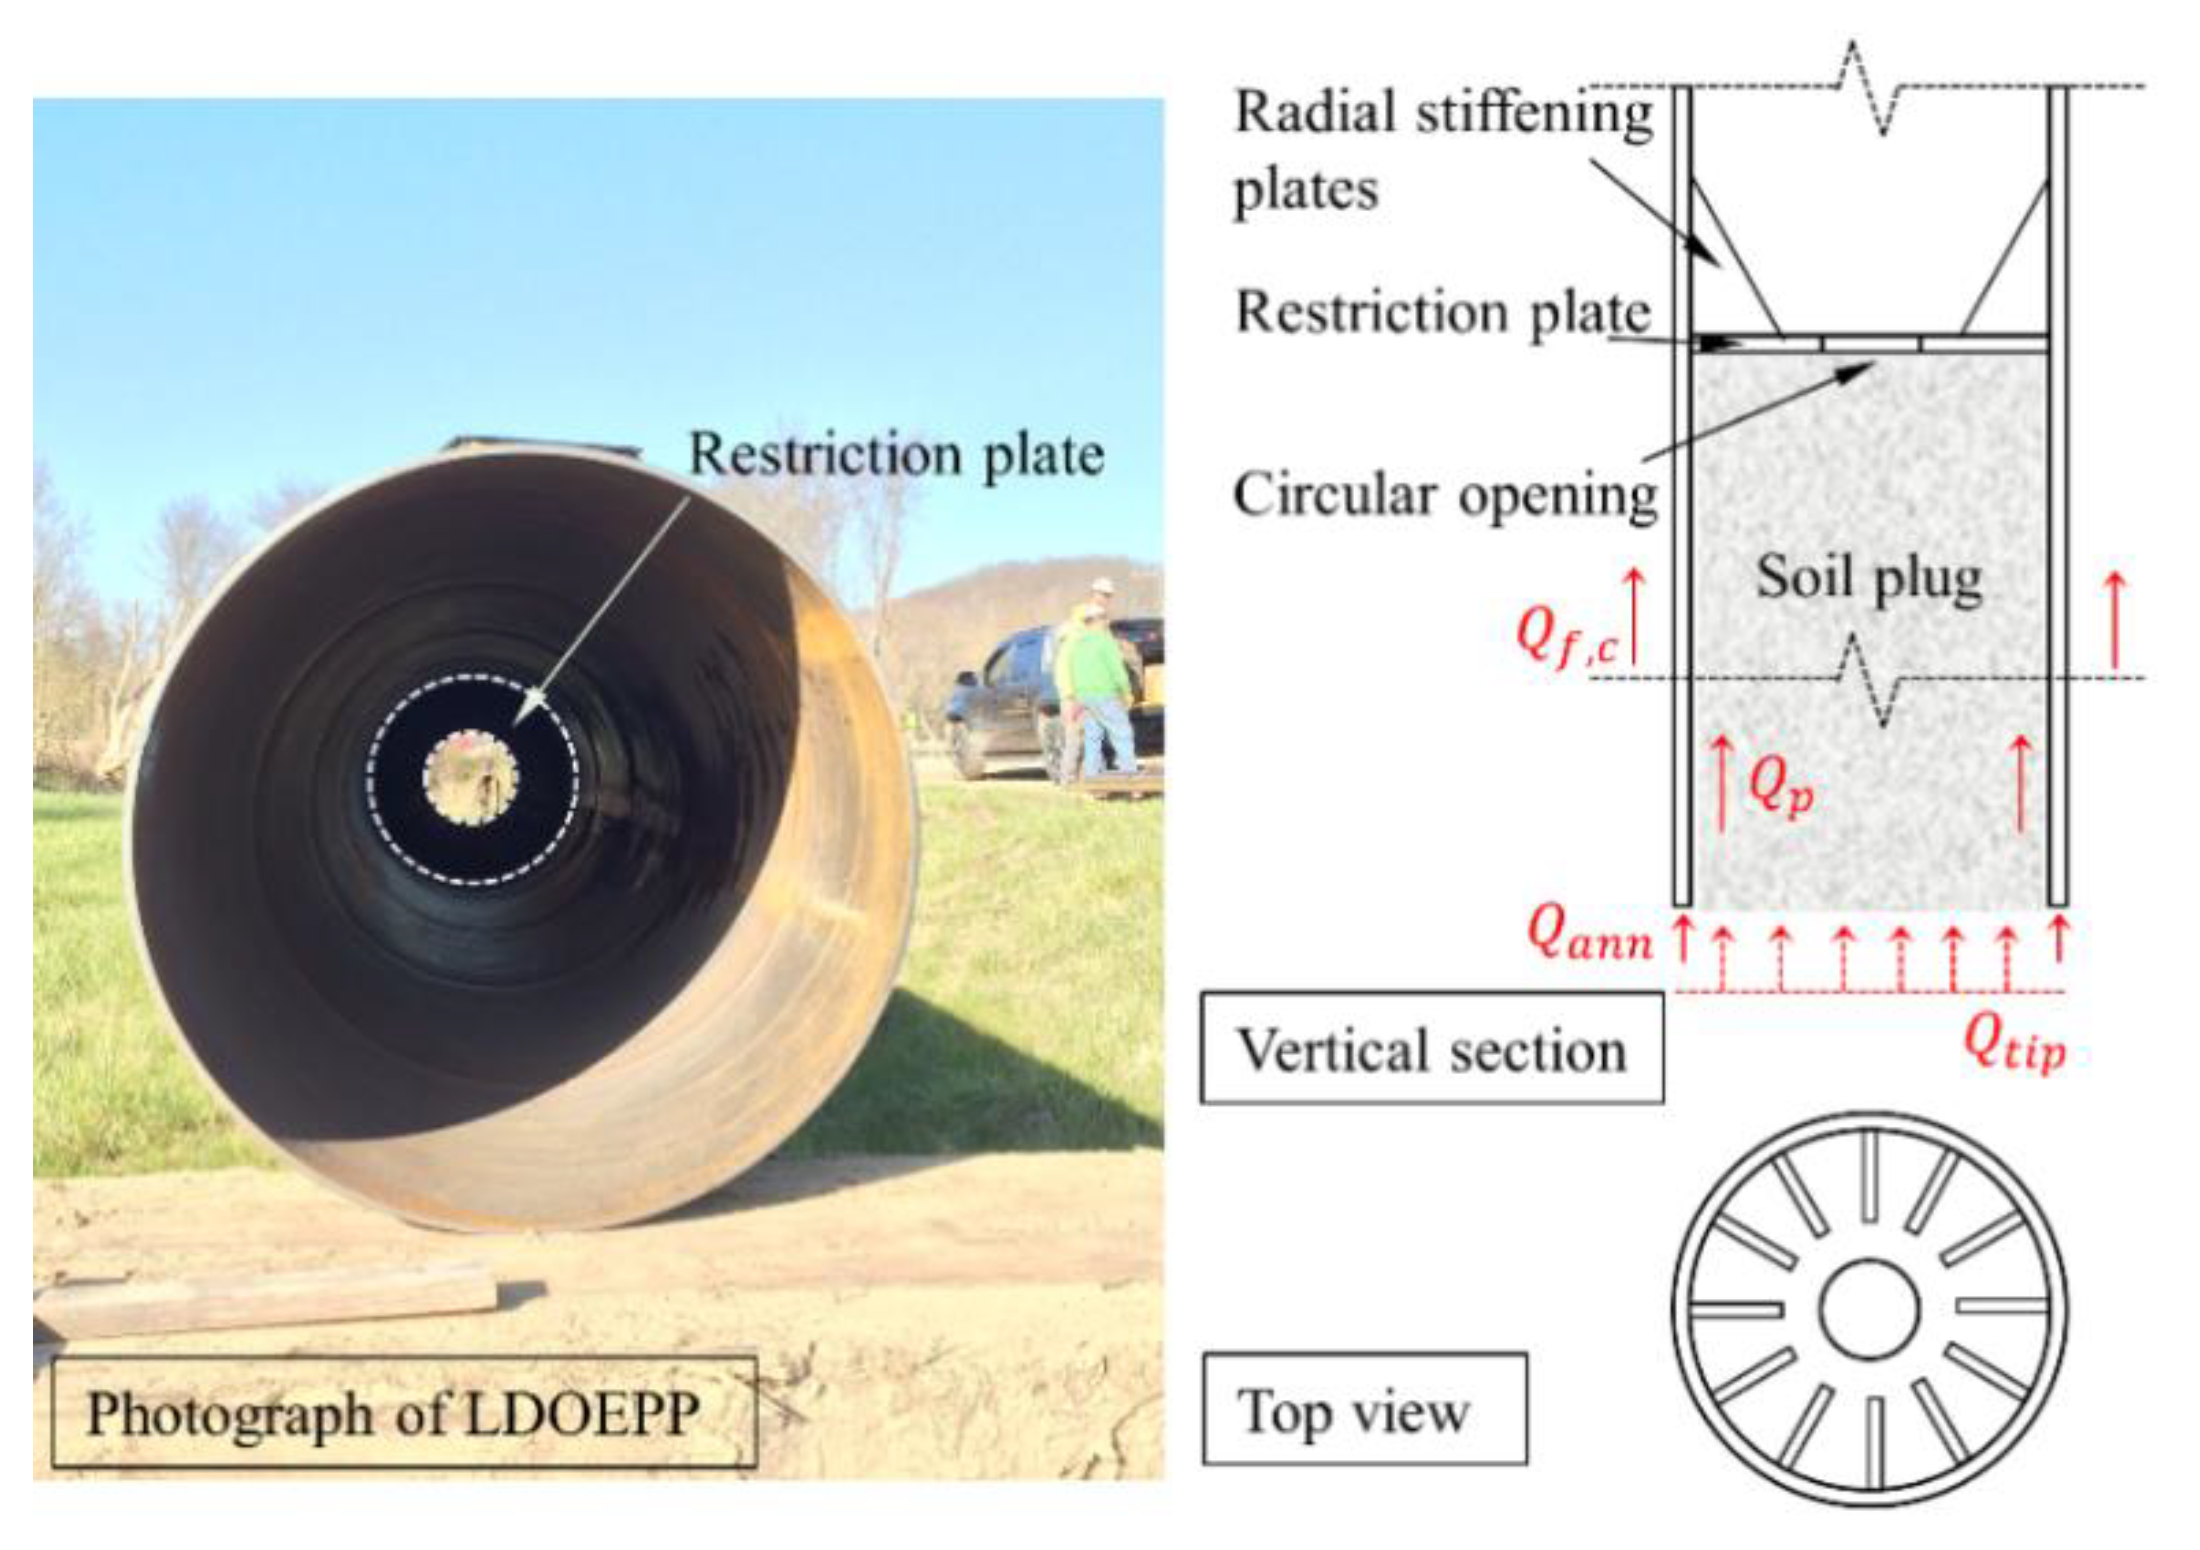
29] implemented an external spiral wing (700 mm in diameter) at the bottom of a 355 mm-diameter steel pipe pile to improve the bearing capacity. In this study, the soil plugging mechanism of pipe piles in cohesionless soils, particularly in relation to the pipe diameter, is presented. Two innovatively designed restriction plates, i.e., a one-hole plate (
Figure 1) and a four-hole plate, were installed inside the model pipes and compared by conducting laboratory and geotechnical centrifuge load tests. The results may help to further the understanding of the load carry behavior of LDOEPPs.
2. Current Design Practice
This section summarizes seven commonly used design methods for LDOEPPs to facilitate a brief understanding of the current design practice. In general, the soil plugging effect determines the load-carrying behavior of LDOEPPs and, therefore, should be properly considered in the pile design.
2.1. Soil Plugging Effect in Pipe Pile Design
Most of the design experience of LDOEPPs are accumulated in the offshore industry [
2,
4,
30]. The American Petroleum Institute (API) recommends that the total axial resistance is the sum of the external shaft friction and the end bearing on the pipe wall annulus plus the total internal shaft friction (i.e., plug resistance) or the end bearing of the pile, whichever is the less, as given in Equation (1) [
31]:
where
is the total resistance of an open-ended pipe pile;
is the shaft friction provided by the outer soil–pile interface;
is the tip resistance of the whole cross section;
is the resistance of the pipe tip annulus; and
is the plug resistance.
As the open-ended pipe pile is driven underground, soils are squeezed into the pipe and form a soil column inside, called the soil plug. There are frictional contact forces on the pile–soil plug surface, which mobilize soil particles moving downwards. As these soil particles inside the soil plug are confined by the pipe wall, the pile driving process squeezes the soil column to form a densely-packed soil plug, which significantly increases the normal contact force on the pile–soil plug surface, and, in turn, leads to higher frictional forces. Under certain conditions, the soil column inside the pipe pile may be fully plugged and the driving and bearing behavior of an open-ended pipe pile is like that of a close-ended pipe pile.
In the current design practice, the plugging effect is usually considered in terms of two factors, pile dimension and soil mechanical strength [
32,
33,
34,
35]. Some additional parameters that can be acquired during the pile installation, such as the Incremental Filling Ratio (IFR) and the Plug Length Ratio (PLR), have been incorporated to describe the degree of soil plugging [
14,
36]. The typical definitions of IFR and PLR for LDOEPPs are provided in Equation (2). When the IFR equals zero as the length of soil plug remains constant under driving, the pipe pile is considered to be fully plugged and the base resistance is regarded as equivalent to a closed-ended pile. The API design practice also indicates that the plugged or unplugged condition needs to be verified, based on static analyses, i.e., a pile can be driven in an unplugged condition but behaves as plugged under static loads [
31].
where
is the plug length increment;
is the pile driving increment;
is the length of soil plug; and
is the driving length of pipe pile.
2.2. Comparison of Different Design Methods
A literature review was conducted on the state of practice of the design methods for LDOEPPs [
37].
Table 1 compares seven major design criteria of LDOEPPs for offshore and transportation projects, which include the API design practice [
31], the Federal Highway Administration (FHWA) recommended method [
38], the Norwegian Geotechnical Institute (NGI) method [
39], the Finnish National Road Administration (FinnRA) method [
40], the China Ministry of Construction (CMC) code for deep foundations [
41], the Imperial College Pile (ICP) method [
42], and the University of Western Australia (UWA) method [
43]. These design criteria can be classified into two groups depending on the different descriptions of soil plugging: (1) the explicit approach, that considers annulus tip resistance as well as plug resistance, such as the API design practice, the FHWA method, and the NGI method; and (2) the implicit method, that considers equivalent tip resistance, such as the FinnRA method, the CMC Code, the ICP method, and the UWA method.
For the API, FHWA, and NGI methods, the plug resistance and annulus resistance are calculated and compared with the tip resistance within the total cross-sectional area of the pile. The soil plugging state is determined and the smaller value is used as the pile tip resistance. However, there are major differences in determining the plug resistance, as the formation mechanism of the soil plug is still unclear. The inner unit shaft friction in the NGI method is assumed to be three times larger than the outer unit friction considering soil arching. The API method assumes the inner and outer unit shaft frictions are the same, while in the FHWA method, the inner unit friction is assumed to be 0.33 to 0.50 of the outer unit friction, and the annulus unit resistance is also reduced by half [
31,
38,
39].
Table 1.
Comparison of different design methods for LDOEPPs.
Table 1.
Comparison of different design methods for LDOEPPs.
| Method | Pile Tip Resistance | Basic Principle | Feature | Determinant Factors |
|---|
| API Design Practice [31] | Lesser of annulus + plug resistance and tip resistance | Soil strength acquired through laboratory or in-situ test | Inner unit shaft friction equals outer unit friction | Soil property |
| FHWA Method [38] | Inner unit shaft friction is 1/2~1/3 of outer unit friction; reduction in unit tip resistance | Soil property, pile diameter, pile shoe configuration |
| NGI Method [39] | CPT based approach | Inner unit shaft friction is three times outer unit friction in sand | Cone tip resistance, relative density, etc. |
| FinnRA Method [40] | Equivalent tip resistance | A plugging coefficient to describe degree of soil plugging | Fully plugged as pile length-diameter ratio (L/D) > 10 in moraine, and L/D > 15 in sand | Soil property, pile length-diameter ratio |
| China Deep Foundation Code [41] | Fully plugged as L/D > 5 | Pile length-diameter ratio |
| ICP Method [42] | CPT based approach | CPT data are used to classify plugged or unplugged pile | Cone tip resistance, pile diameter, relative density, driving depth |
| UWA Method [43] | IFR is used to describe plugging mode during installation | Cone tip resistance, pile diameter, IFR |
In the FinnRA and CMC methods, the soil plugging effect is considered implicitly by implementing a plugging coefficient for the pile tip resistance, as shown in
Table 1. The plugging coefficient is determined by the pile length–diameter ratio (L/D), and a fully plugged pile has a plugging coefficient of 0.8 [
40,
41]. From the CMC code, pipe piles with a length–diameter ratio larger than 5 is assumed to be fully plugged, while in the FinnRA method, the critical pile length–diameter ratio is 10 in moraine conditions and increases to 15 in sand. These two methods are easy to implement but lack the consideration of complex soil conditions, e.g., various soil types.
Both the ICP and UWA methods are based on the in-situ Cone Penetration Test (CPT) results [
42,
43]. In the ICP method, piles are divided into plugged or unplugged mode according to the pile diameter and soil condition. The tip resistance is assumed to be proportional to the cone tip resistance as measured in the CPT test. In the UWA method, the IFR has been used as a way of correction for tip resistance. However, in-situ large scale tests provide evidence that the CPT-based method provides a reliable prediction on the skin friction while the accurate estimation of the end bearing capacity is still challenging [
44].
3. Experimental Program
The load-carrying behavior of pipe piles in cohesionless soils was investigated by conducting laboratory-scale and geotechnical centrifuge experiments. The experimental program, that combined different pile configurations, i.e., different pile diameters, types of restriction plates, and embedment depths, is introduced in this section.
3.1. Laboratory-Scale Pile Static Load Test
As the field-scale pile load tests are time-consuming and inefficient, we started the tests with small diameter pipe piles in the laboratory to study the bearing behavior of pipe piles with the customized restriction plate. There is no scaling-up implemented in this part of work. For the laboratory-scale experiment, a series of tests were conducted on pipe piles of three different diameters (i.e., 51-mm, 102-mm, and 152-mm in diameter) in combination with different configurations of the restriction plate (i.e., no restriction plate, restriction plate with one circular hole, restriction plate with four circular holes), as shown in
Figure 2. The restriction plates were designed to provide additional confinement to the soil plug to increase the inner frictional force. The area of one of the holes was equivalent to the area of four holes.
The geometric dimensions of pipe piles tested in the laboratory-scale experiment are listed in
Table 2. The tests were conducted with one case for each scenario. The restriction plates were cut using a water jet cutter and glued to the specified location with epoxy at a height of 0.35 m from the bottom. A position of 0.35 m for the restriction plate corresponded to a further driving depth of 0.10 m after the soil plug reached the restriction plate surface. It was shown that this was enough to achieve a fully mobilized soil plug without disturbing the stress concentration at the pile tip. A customized loading system was developed for the laboratory pipe pile test to provide enough vertical force without loading eccentricity. The maximum vertical loading capacity of the load cell was 17.8 kN and the maximum displacement range of the loading piston was 17.8 cm, meeting the experimental needs in our trial test.
The cylindrical sand box, that had a diameter of 0.75 m and a height of 1.05 m, is shown in
Figure 2. The air-pluviation method was used in preparing the soil samples, in which sand grains were poured layer by layer through a single pipe with a constant pouring height of around 30 cm and a steady deposing intensity. After pouring sand into the sand box, the soil sample was slightly densified by tapping the box walls uniformly with a rubber hammer to achieve a relative density of 74% and a density of 1.604 g/cm
3, which were the same as used in the centrifuge tests. After each loading test, the soil samples were removed and refilled with the same preparing procedure. Before each test, the pipe piles were driven into the sand manually by dropping a 10 kg hammer from a height of 15 cm to simulate the pile driving, and the final embedment depth was 0.45 m with a variance less than 1 mm. The thickness of the bottom sand layer below the pile tip was at least four times that of the pile diameter, and the diameter of the drum was at least five times that of the pile diameter, which helped to minimize the potential boundary effect [
45]. It should be noted that the pile installation would densify the sands around the pile, and its influence has been neglected for simplicity in this study.
A stepwise loading sequence was applied on top of the pile to mobilize the ultimate resistance of pipe piles [
46]. The increment of loading levels was calculated by estimating the failure resistance (at movement exceeds 15% of pile diameter) divided by fifteen loading levels. Once prepared, the vertical loading force was applied to the pipe pile to drive it into the sand box with a constant velocity of 1.0 mm/s until reaching the preset force value. The loading frame had a maximum limit of 25,000 N for the axial loading force with considerations of possible buckling. From trial tests, the model piles achieved the full displacement in dry sand quickly, in less than two minutes (around 100 mm cap displacement). To ensure reaching the steady state, each loading level was maintained for 5 min after reaching the preset force value.
For LDOEPPs, a relatively large cap displacement is required to fully mobilize the pile’s base resistance. The conventional Davisson offset method may underestimate the base resistance, especially for piles with diameters larger than 0.6 m. For this reason, some agencies (e.g., Florida DOT) use a modified Davisson offset method to determine the ultimate bearing capacity of piles that are 0.6 m or larger [
1]. The displacement at the strength limit is defined as the offset of
D/30 plus the elastic deformation of piles, where
D is the pile diameter, see Equation (3). This modified Davisson’s method was used to calculate the bearing capacity of the pipe piles. However, it should be noted that agencies may choose more conservative methods in the pipe pile design.
where
is the maximum allowable pile displacement, in m;
P is the axial load, in N;
L is the pile length, in m;
A is the cross-section area of the pile, in m
2;
E is the elastic modulus of the steel pipe, in Pa, using a value of 200 GPa in this study; and
D is the pile diameter, in m.
3.2. Centrifuge Pile Static Load Test
The geotechnical centrifuge experiment was conducted to scale up the pile dimensions to approximate field sizes. The centrifuge experiment tests small-scale models under high gravitational levels to simulate the stress state of field conditions [
47]. By using the centrifuge, the dimensions of the prototype models (e.g., pile diameter and pile length) were scaled up by the applied gravity acceleration, according to established scaling laws, as shown in
Table 3 [
48]. For example, a 1 cm-diameter model pile tested under a gravity of 100 g represents the behavior of a 1 m-diameter prototype pile under gravity of 1 g.
The geotechnical centrifuge at Case Western Reserve University (CWRU) was used for this study. The centrifuge payload capacity was a 20 g-ton with a maximum acceleration of 200 g for static tests and 100 g for dynamic tests. The internal dimensions of the specimen box were 53.3 cm (length) by 24.1 cm (width) by 17.7 cm (height). Similar to the laboratory experiments, pipe piles with different diameters, in combination with different types of restriction plates, were tested for their bearing performance. Pipe pile models were made of steel and the restriction plates were made from 3D printed polylactic acid to achieve the most accurate dimensions. The design of the restriction plates were the same as that shown in
Figure 2.
The model setup of the geotechnical centrifuge experiment is shown in
Figure 3. The customized loading system consisted of an actuator, a load cell, and a linear variable differential transformer. The maximum range of the load cell was 1330 N. Nine model pipe piles were tested under different centrifugal accelerations of 1 g, 10 g, 30 g, and 50 g, respectively. The 1 g test was conducted in the soil container without spinning. The geometric dimensions of the model piles are provided in
Table 4. The inner diameters of these piles were 19.0 mm, 25.4 mm, and 38.4 mm. The embedment depth of the model pile was 8 cm. As the model piles were scaled up by different factors, the embedment depth of prototypes would be different. The wall thickness influenced the soil squeezing inside the pipe. In this study, we assumed the influence of wall thickness on soil plugging was negligible as it is generally much smaller compared to the pile inner diameter. For each of the pile diameters, a one-hole or four-hole restriction plate was included for comparison with the open-ended pipe pile. The restriction plates were installed 4.0 cm up from the pile tip. Due to the limitation of the soil container in height, the embedded depth of the pile was set at 8.0 cm in this study so that the restriction plate was engaged with soil with a significant driving distance of 4.0 cm before the load test.
The air-pluviation method was used in soil sample preparation. The pipe pile model was installed by hammer driving to simulate the installation in field conditions. The installation was conducted under a 1 g environment. Before the loading process, the specimen box was spinning to the target acceleration to reach the balance under gravity. Similar to the 1 g laboratory-scale test, a stepwise load was applied on top of the model piles under target centrifugal accelerations. There are studies showing the installation method may lead to different pile bearing behaviors in the centrifuge modeling [
49]. Li et al. [
50] compared the traditional pile installation at 1 g with the in-flight installation at 50 g, and concluded that the in-flight pile installation leads to a denser neighboring soil and a higher bearing capacity. In this paper, the potential influence of the pile installation method and the changing soil relative density were not considered. To achieve the ultimate bearing capacity in a short time period, there were six loading stages and four unloading stages implemented during the centrifuge test. The magnitude of each loading stage was determined by a trial test. The loading force was applied through the actuator with a self-defined servo mechanism, and usually it took less than 15 s to achieve the target force. The cap displacement and load force were recorded in real time during the test, and the steady state was determined case-by-case based on the cap displacement. Each loading state was held for around 45 s to ensure the pile reached the steady state.
3.3. Soil Properties
The soil used in the testing program was silica sand provided by Oglebay Norton Industrial Sand Inc., a commercial supplier in north Ohio. The maximum and minimum bulk densities were 1.67 g/cm
3 and 1.43 g/cm
3, respectively. The mean particle diameter was 0.20 mm from the sieve analysis, with a uniformity coefficient of 2.10 and a coefficient of gradation of 1.22. The sand was classified as poorly graded sand (SP), based on the unified soil classification system [
51]. The ratio of pile inner diameter on the sand’s D
90 was 68 for the 19.0 mm-diameter model pile. A direct shear test was conducted to measure the internal friction angle of sand specimens under dry conditions, and the normal stress ranged from 50 kPa to 200 kPa. With a relative density of 75% prepared in the direct shear test, which was similar to the sand sample used for the pile load test, the deduced internal friction angle was 31.6
°.
4. Experimental Results
The testing results of the laboratory and centrifuge pile loading experiments are presented in this section. The ultimate bearing resistance of pipe piles with different pile diameters and types of restriction plates was compared.
4.1. Ultimate Resistance from Laboratory-Scale Experiment
The length of soil plug was recorded before and after the pile load test by measuring the surface height of soils inside the pipe pile, and the results are shown in
Figure 4. In general, a shorter soil plug, as in
Figure 4a, indicated a more compacted soil column after pile installation. If there was no plugging, the soil plug length should equal the penetration depth, i.e., 45 cm. If the pipe pile was fully plugged, the soil plug length should be much lower than 45 cm, as was the case for all the 51-mm piles and 102-mm piles with restriction plates. During the pile installation, it was observed that the restriction plate was effective in facilitating the soil plugging, especially for 51-mm and 102-mm piles. For the 152-mm piles, the length of soil plug was similar with or without the restriction plate.
Figure 4b plots the measured soil plug length after the load test. As the piles were driven downward, the soil plug length was expected to increase, except for the fully plugged condition, in which it would remain the same. By comparing the plug length increment before and after the pile load test, one can see that all the 51-mm piles were in a fully plugged condition, while only the 102-mm piles with restriction plates were fully plugged, which was consistent with our discussion from
Figure 4a. For the 152-mm piles, the soil plug length increased for pipe pile and the pile with 1-hole plate, indicating an unplugged condition.
The load–displacement curves of different-sized piles are provided in
Figure 5. The modified Davisson’s offset [
1] was plotted as well, based on Equation (3). The intersect between the load–displacement curve and the offset line determines the ultimate bearing capacity of pipe piles. As the elastic deformation of model piles was small, the Davisson’s offset approximates a horizontal line in
Figure 5. Each loading curve represented one testing case under that scenario. For the 51-mm piles shown in
Figure 5a, all these piles were fully plugged, and the bearing capacities were similar. The effectiveness of restriction plate was more obvious for the 102-mm and 152-mm piles. With the installation of restriction plates, the ultimate bearing capacities of 102-mm piles increased from 2.9 kN to 4.2 kN (or by 45%) with the one-hole restriction plate, and to 6.5 kN (or by 124%) with the four-hole restriction plate. Similar observations existed for the 152-mm piles, as shown in
Figure 5c. With the installation of the restriction plate, the soil plug was confined vertically, leading to an increase in inner frictional force on the pile-soil plug surface. The four-hole restriction plate provided better confinement than the one-hole restriction plate. In general, the use of a restriction plate significantly improved the load bearing capacity, and the four-hole restriction plate was more effective than the one-hole restriction plate with the same opening plate area.
4.2. Ultimate Resistance from Scaled Centrifuge Experiment
The soil plug length was been recorded in the centrifuge experiment, as the manual installation of small model piles might introduce variances, which could be large by scaling up the pile dimensions.
Figure 6 plots three examples of load–displacement curves of different-sized model piles under 50 g. The axial load was scaled by a factor of 2500, while the cap displacement was scaled by a factor of 50 following
Table 3. The modified Davisson’s offset was also plotted in these figures, following Equation (3), in which it consists of an offset based on pile diameter and an offset for elastic deformation. The inclination was relatively small due to the small elastic deformations of these piles. Compared to the laboratory-scale experiments, there were similar observations in terms of the ultimate bearing capacity of the pipe piles. The use of a restriction plate confined the vertical motion of the soil plug which led to a higher ultimate bearing capacity, and the piles with a four-hole restriction plate had the best load carrying performance.
The ultimate bearing capacities of prototype piles (after applying the scaling law) under different centrifugal accelerations (i.e., 1 g, 10 g, 30 g, and 50 g) are listed in
Appendix A. The laboratory-scale and centrifuge experiments contain data that represent the load-carrying behaviors of pipe piles of different pile diameters, types of restriction plates, and embedment depths. The location of restriction plate was also different for different prototype piles. In the design practice, the location of restriction plate was mainly determined by the soil conditions, e.g., in northern Ohio, the restriction plate was placed one meter below the bearing dense sand layer. In these experiments, the location of the restriction plate was designed below the embedment depth with a sufficiently long mobilizing distance during the pile driving. As the soil plug was fully mobilized after driven and soil plug confinement was more obvious at the bottom pile, well below the restriction plate, the degree of soil plugging was similar for piles with different restriction plate locations. Considering this, these experimental data were compiled in
Appendix A without considering the difference in restriction plate locations.
It was also noted that the measured ultimate bearing capacity was slightly lower than the data reported by other researchers. The primary reason was the different relative density of the sand samples. The sand samples prepared through the air-pluviation method tended to form a loose packing state, while the ultimate bearing capacity of the pipe pile was quite sensitive to the relative density. Besides, the embedment depth also influenced the skin friction and the tip resistance.
5. Further Discussions
In this section, the experimental data from the laboratory-scale and centrifuge experiments are synthetized and analyzed by comparing the normalized bearing capacity and equivalent tip resistance over different pile diameters. A soil plug coefficient, which describes the degree of soil plugging inside the pipe pile, is also proposed.
5.1. Normalized Bearing Capacity
To compare the bearing capacity of pipe piles of different diameters, a simplified normalization process was used by dividing the bearing capacity by the cross-section area (to determine unit bearing capacity) and the vertical earth pressure at the pile tip (to account for confinement effects by the embedment depth), as given in Equation (4).
Figure 7 plots the normalized unit area bearing capacity versus the pile diameter. A fully plugged open-ended pile behaved as a close-ended pile with a higher end bearing capacity. As a result, the normalized unit area bearing capacity was much higher for small diameter piles. As the pile diameter increased, the bearing capacity was provided by the inner frictional force and the normalized unit area bearing capacity became stable. The figure also shows that large-diameter pipe piles with a restriction plate generally had a high normalized unit area bearing capacity, particularly for pipe piles with four-hole restriction plates.
where
is the normalized unit area ultimate bearing capacity of the pile;
is the ultimate bearing capacity derived from the modified Davisson’s criteria;
A is the cross-section area of the pile;
is soil bulk density;
g is the gravitational acceleration; and
H is the embedment depth of the pile.
The variance of normalized bearing capacity over pile diameter is primarily due to the different bearing mechanisms of pipe piles. For a small diameter pipe pile, it is easier to form a fully plugged condition after driven. As it behaves as a close-ended pile, the normalized bearing capacity is generally higher. As the diameter increases, the bearing capacity is provided by the frictional force on the inner pile surface, which is smaller than the direct bearing resistance of soils at the pile toe. As a result, the normalized bearing capacity decreases over pile diameter.
5.2. Equivalent Tip Resistance
The above normalization does not separate shaft resistance from the ultimate bearing capacity. Therefore, the concept of equivalent tip resistance in the FinnRA [
40] and CMC [
41] methods was adopted to better quantify the load-carrying performance of pipe piles over different pile diameters. The equivalent tip resistance was calculated by subtracting the external shaft resistance from the total bearing capacity. As the ratio of pile embedment depth to pile diameter is smaller than 10.0, a triangular earth pressure distribution is assumed to estimate the external shaft resistance, as given in Equation (5) [
52]. The frictional angle on soil-steel interface was 18.1° as measured from the direct shear test, in which the bottom shearing box was replaced with a steel plate with similar surface roughness as the pipe pile, and the top shearing chamber was filled with sand.
where
is the unit frictional resistance of the external shaft;
is the frictional angle of soil-pile interface; and
is the coefficient of lateral earth pressure.
The sorted data on equivalent tip resistance over pile diameter are visualized in
Figure 8. With the installation of a restriction plate, a remarkable improvement in end bearing capacity was obtained. The average increment in equivalent tip resistance for pipe piles with one-hole restriction plates was 91% compared to the same-sized pipes, and increases to 155% for pipe piles with four-hole restriction plates, as also see
Appendix A.
Figure 9 plots the equivalent tip resistance of pipe piles versus the pile diameter. The pile piles with diameters smaller than 0.15 m were not incorporated as they are not commonly used in engineering practice. The Terzaghi’s theoretical bearing capacity was also plotted for comparison, see Equation (6) for details:
where
is the theoretical ultimate bearing resistance;
D is the pile diameter;
and
are Terzaghi’s bearing capacity factors, and were 20.7 and 33.0 from Meyerhof’s recommendation;
is the shape correction factor;
H is the embedment depth of model piles.
For pipe piles of a given diameter, Terzaghi’s bearing capacity theory estimates a linear relationship between the theoretical bearing resistance and the embedment depth (see Equation (6)).
Figure 10 compares the equivalent tip resistance of different model piles over different embedment depths. For piles with a small embedment depth, the contribution on tip resistance mainly came from the first term in Equation (6), which is determined by pile diameter. As the embedment depth increased, the second term (determined by embedment depth) dominated the tip resistance, and the variance of equivalent tip resistance for large embedment depth piles, in
Figure 10, became small. It was also observed that the equivalent tip resistance did not follow a linear relationship with the diameter or the embedment depth, as the resistance of the LDOEPPs was provided by the inner pipe friction rather than the tip bearing assumed by Terzaghi’s theory.
5.3. Soil Plug Coefficient
The end bearing capacity of open-ended pipe piles depends highly on the degree of soil plugging. A fully plugged pipe pile has similar behavior to a close-ended pipe pile, and the bearing capacity can be estimated by Terzaghi’s theoretical bearing resistance. As the pile diameter increases, the equivalent end bearing capacity decreases and there are relative motions between the pile and soil plug. The degree of soil plugging can be described by a defined soil plug coefficient, which equals the equivalent tip resistance divided by the theoretical ultimate bearing resistance, as is given in Equation (7). Values of the soil plug coefficient range from zero to one, and a fully plugged pipe pile corresponds to a value of one. The calculated soil plug coefficient of the model piles is listed in
Appendix A. For LDOEPPs driven in dense sands, the pile diameter is one of the most important determining factors on the pile’s plugging state.
Figure 11 plots the calculated soil plug coefficients over pile diameters ranging from 0.15 m to 1.92 m. It is shown that the soil plug coefficient for small-diameter piles might exceed 1.0, indicating a much higher end bearing resistance than the theoretical calculation. A possible explanation was that the fully plugged pipe pile behaved as a closed-ended pile. As the pile was driven downwards for a significant distance, soils around the pile tip were densified, which introduced additional resistance on the pile tip.
where
is the soil plug coefficient;
is the equivalent tip resistance; and
is the theoretical ultimate bearing resistance.
The critical diameter for pipe piles is defined as the pile diameter corresponding to a soil plug coefficient of one. Below the critical pile diameter, the pipe pile is regarded as fully plugged. The critical pile diameter of pipe piles without restriction plates was 0.08 m, and increased to 0.30 m for pipe piles with one-hole restriction plates and 0.70 m for pipe piles with four-hole restriction plates. Equations (8)–(10) give the power law regressions between soil plug coefficient and pipe pile diameter, taking into consideration the critical pile diameter. With these equations, the equivalent tip resistance of LDOEPPs with different restriction plates driven in sand could be estimated, and the total bearing capacity of the pile equaled the equivalent tip resistance plus the shaft resistance. It should be noted that the regressed soil plug coefficient showed a high variance due to limitations in experimental setups, and each test was conducted once without a parallel case. The primary goal of the soil plug coefficient model is to provide a simplified approach for bearing capacity estimation; however, due to limitations of this study, the usage should be determined on a case-by-case basis.
For open-ended pipe piles:
For open-ended pipe piles with one-hole restriction plates:
For open-ended pipe piles with four-hole restriction plates:
5.4. Limitations of Current Research
While this study covered a wide range of pile configurations in cohesionless soils with/without restriction plate, there were a few simplifications adopted, considering the complexity of this problem. In the geotechnical centrifuge experiment, the potential influence of particle size and relative density was generally ignored in scaling up the model piles. With the implementation of restriction plates, soil particles are confined in the vertical motion, which means soil arching forms easily, as is shown in
Figure 12. Current experience indicates that the arching effect is also determined by soil grain size and relative density. Further study is needed to improve the current understanding. A comparison between the geotechnical centrifuge test and full-scale experiment may also be helpful in clarifying this. Due to equipment limitations, the embedment depths of prototype piles were within 5.0 m. Here we assumed the bearing mechanism of restriction plates was similar over different embedment depths as the soil plug was fully mobilized. The proposed soil plug coefficient simplified the estimation of pile end bearing capacity. However, due to the complexity of soil plug formation and the limitations of this study, there is still room for improvement, as can be seen from the high variance shown in
Figure 11.
6. Conclusions
In this paper, the current design practice for LDOEPPs was reviewed by comparing a few design methods used by different international associations. An experimental program, including laboratory-scale and geotechnical centrifuge pile load tests, was conducted to study the load-carrying behavior of pipe piles covering a wide range of pile diameters and embedment depths. The results were used to analyze the influence of soil plugging and the bearing behavior of LDOEPPs. Two innovatively designed restriction plates, i.e., a one-hole plate and a four-hole plate, were implemented inside the pipe piles and their effectiveness in facilitating the soil arching discussed. With certain simplifications and assumptions for the soil plug coefficient, a new method was proposed for a quick estimation of the bearing capacity of LDOEPPs with different restriction plates.
By comparing the normalized bearing capacity of pipe piles with different pile diameters, it was shown that small-diameter pipe piles tend to form a high degree of soil plugging, compared to large-diameter pipe piles. By using a restriction plate, the soil plug can be forced to form inside the pipe pile, which was proven by the laboratory-scale and centrifuge models. A four-hole restriction plate mobilizes more end bearing resistance than a one-hole restriction plate with the same plate opening area. While a higher end bearing capacity may cause drivability issues in the pile construction, the selection of one-hole and four-hole plates should be assessed on a case-by-case basis with considerations of mechanical performance and pile drivability. The experimental results were synthetized into a new method for bearing capacity evaluation by introducing a soil plug coefficient, which accounted for the effects of the soil plug as well as two different types of restriction plates. Overall, this study provides some insights into the behaviors of LDOEPPs. The integrated laboratory and geotechnical centrifuge experiments help to explain the formation of soil plugging. Due to schedule and resource constraints, the coverage of this study was not exhaustive. The design recommendations to account for the soil plug effect need to be further validated with the practice data, and other factors, e.g., pile corrosion, should be addressed in future study.


