Article

Determination of Truck–Shovel Configuration of Open-Pit Mine: A Simulation Method Based on Mathematical Model

1
School of Resources and Safety Engineering, Central South University, Changsha 410083, China
2
Changsha Digital Mine Co., Ltd., Changsha 410221, China
3
School of Mechanic Engineering, University of Science and Technology Beijing, Beijing 100083, China
*
Author to whom correspondence should be addressed.
Sustainability 2022, 14(19), 12338; https://doi.org/10.3390/su141912338
Submission received: 3 August 2022 / Revised: 15 September 2022 / Accepted: 21 September 2022 / Published: 28 September 2022

Abstract

:
The truck–shovel system is the most common material transportation system in open-pit mines. The configuration of trucks and shovels directly affects the efficiency and cost of transportation in open-pit mines. Under the condition that the types and quantities of trucks and shovels are known, in order to obtain the optimal configuration scheme in the open-pit mine transportation system this paper presents a method to determine the optimal scheme by conducting experiments based on the simulation truck–shovel system model in Flexsim software. We test candidate configuration schemes that are solved by the mathematical model with daily minimum production and expected profit constraints in the simulation model, and finally obtain the optimal truck–shovel configuration scheme that meets the ore output requirements of each loading point. Through simulation experiments, the daily production of the optimal truck–shovel configuration scheme is 3.75% higher than that of the original mine scheme and the profit is increased by 3.85%. The results show that the open-pit truck–shovel system constructed by Flexsim has great research potential and value for the optimization of truck–shovel configuration schemes.

1. Introduction

The transportation system cost of open-pit mining accounts for about 50–60% of the total production cost [1,2]. Therefore, improving transportation efficiency and reducing transportation costs are the most important ways for mines to increase revenue [3,4]. The truck–shovel system is a kind of material transportation system widely used in open-pit mines on a global scale, which is generally composed of multiple transportation trucks and shovel-loading equipment [1,5,6]. The production and maintenance cost of equipment accounts for a large proportion of the total production cost of the whole truck–shovel system. Consequently, at the stage of mine design planning and production practice, the configuration optimization of truck–shovel equipment can improve equipment efficiency and production capacity and reduce the production and maintenance cost of the whole system in order to maximize the economic benefit of the mine [6].
During the period of mine design and production, it is necessary to preset, evaluate and optimize the overall layout, transportation network and production plan of the mine [7,8]. When evaluating a mine truck–shovel system, the usual method is to adopt mathematical modeling, a simulation experiment or a field experiment. However, the open-pit truck–shovel system is a typical random, dynamic and discrete material transportation system [9]. The state of each object in the system changes discontinuously with time, resulting in a series of random events. The mine truck–shovel transportation model established by the mathematical method usually simplifies or ignores some dynamic random characteristics in the system [10], such as truck loading and unloading time, loading capacity, running speed and other parameters, which are often treated as constants. However, these parameters are closely related to equipment type, transportation route, truck queuing, material characteristics, etc. It is difficult to build an accurate mathematical model to describe the operation of mine transportation system. Field experiments require a lot of human resources, material resources and time, and it is a hard task to obtain enough experimental data in a short time, especially for mines that are already in the production stage and where field experiments will affect the normal production and operation of mines.
When optimizing the truck–shovel system, the main goal is to optimize the selection and configuration of the equipment and to adjust the equipment type, quantity and matching relation according to a certain scheduling strategy or yield demand [11]. Analogy and experience methods are often used to optimize the truck–shovel system while building or expanding a mine, but these methods are difficult to meet the requirements in the face of complex transportation conditions. Some scholars use single or complex mathematical models to solve this problem. Meredith [12] applied the queuing theory to determine the scale of trucks and shovels in the transportation cycle. This method only takes the arrival rate of the input port as the judgment standard and its model is relatively simple. In fact, it depends on more factors. S. P. Upadhyay [13] proposed a mixed integer linear programming model based on four expected goals to formulate the truck–shovel allocation strategy, but the model is only effective for short-term production planning. Lijun Zhang [14] took the mileage from the loading area to the unloading area as the optimization goal and transformed the truck–shovel allocation problem into an integer programming problem, but the model could not deal with the actual transportation problem under complex conditions. M. Monjezi [15] proposed a hybrid model, which takes the allocation matrix of each vehicle as the input of a genetic algorithm to determine the optimal solution of multi-stage truck–shovel dynamic allocation. This method is more suitable for local planning but is difficult to coordinate the global requirements of open-pit production. In addition, some scholars combine mathematical methods and simulation methods for system optimization. Shiv Prakash [16] proposed a simulation optimization framework that uses the discrete event simulation model of transportation operations to formulate a short-term production plan based on the uncertainty of the truck–shovel system. Burak Ozdemir [17] proposed a two-level scheduling system to maximize the utilization of truck–shovel distribution. In the first stage, the uncertain simulation optimization method was used to divide the truck fleet and the shovel fleet into several sub-fleets to operate in specific mine pits. However, due to the influence of onsite random factors, the simulation model still has some errors compared with the actual mine.
The application of the simulation method in mines can be traced back to the 1960s. With the development of computer technology, simulation methods have developed from the initial application of general process languages such as FORTRAN to simulation programming languages such as GPSS/H and SIMAN, and then to the use of simulation tools based on object-oriented languages such as Arena, JaamSim, Haulsim, Flexsim, etc., in addition to the functions of visualization and animation technology, graphical user interface (GUI), data analysis, etc. The basic information of these simulation software is listed in Table 1. These tools also make up for the lack of portability of models developed through simulation language [9]. The use of simulation software can effectively take into account various random and dynamic factors that affect the production efficiency of the open-pit transportation system when it is actually running [18] in order to evaluate the truck–shovel system more truly and reasonably. When the simulation model is similar enough to the actual circumstance, the simulation results will have important guiding significance for the improvement of the practical scheme. Clifford [19] used the periodic data collected in one year of a mine to establish a multi-mine pit operation simulation model through GPSS/H, which can evaluate 279 production operations, including transportation. Furthermore, Chen Chong [20] simulated and modeled the truck dispatching system based on Extend, presented the three most important performance parameters for evaluating the truck dispatching system of an open-pit mine and applied them to the system simulation. Weiguo Zeng [21] proposed a truck–shovel system simulation model based on JaamSim, which can truly and dynamically simulate the interaction between the mining equipment and the transportation environment and can evaluate the performance of the truck–shovel system. Louis [22] used Arena to simulate the performance of the material transportation system on mines with different geographical characteristics, to optimize parameters including the number of trucks and the time to join the fleet and to achieve results suitable for the mine with less time and resource consumption. Hashemi [23] designed a model representing the fixed assignment of trucks based on Arena. On this basis, taking minimizing the waiting time of trucks as the objective function, they simulated the scene after modifying the matching coefficient of the transportation system, which significantly improved the production efficiency. The simulation method can also be combined with virtual reality technology [24,25,26] to make the simulation process of open-pit transportation operations clear and intuitive. However, the above simulation software has the problems of a long modeling cycle, complex modeling means and a certain gap with the actual mine, which makes it difficult to promote the simulation tools applied in the mineral industry. Flexsim is widely used in the mining industry, with better visualization, programmability and random simulation conditions. Bardzinski [27] built the simulation model of an underground ore haulage system with the implemented function of estimating ore qualitative and quantitative parameters in the dedicated Flexsim simulation environment for the purpose of ore processing control. Sebastian [28] analyzed the possibilities of creating the representations of mining exploitation elements in Flexsim, as well as the description of the influence that the spatial characteristics of surface mines have on simulation processes. Its application also includes the simulation, calculation and optimization of the production and transportation system of an open-pit mine [29], establishing the simulation model of a truck-dispatching system in an open-pit mine and optimizing the fixed truck-allocation scheme [30], simulating and tracking the ore flow of different grades and determining the ore flow rate through the ore bin [31], etc. These examples prove that Flexsim has a strong application ability in the field of mining material transportation.
In order to solve the problem of optimizing the configuration of the truck–shovel system in open-pit mines under situations where the type and quantity of trucks and shovels are determined, firstly, this paper analyzes the composition of the open-pit truck–shovel system and builds the corresponding ideal mathematical model according to the actual operation logic, taking the ore output requirement in the loading area as the constraint condition and calculating the candidate truck–shovel configuration scheme. Then, we build the simulation model of an open-pit mine truck–shovel system based on Flexsim, and verify the reliability of the model by comparing the simulation productivity with the actual productivity under the original truck–shovel configuration scheme. Secondly, the candidate truck–shovel configuration scheme experiments are carried out in the simulation environment and the results of each scheme are compared and analyzed. Finally, we obtain the optimal truck–shovel configuration scheme that meets the constraints under the current transportation situation. Through the modeling analysis and experiment of a real mine, we obtained the optimal truck–shovel configuration scheme under the existing transportation conditions of this mine. This model can also be applied to other mines by modification.
The other structures of this paper are as follows: In Section 2, we build an ideal mathematical model of the open-pit mine truck–shovel system. Section 3 introduces the simulation method based on Flexsim and the specific model construction process. In Section 4, we use real mine data to test the reliability of the model and to verify the candidate schemes and we analyze the experimental results to obtain the optimal configuration scheme. Section 5 summarizes and looks forward to future work.
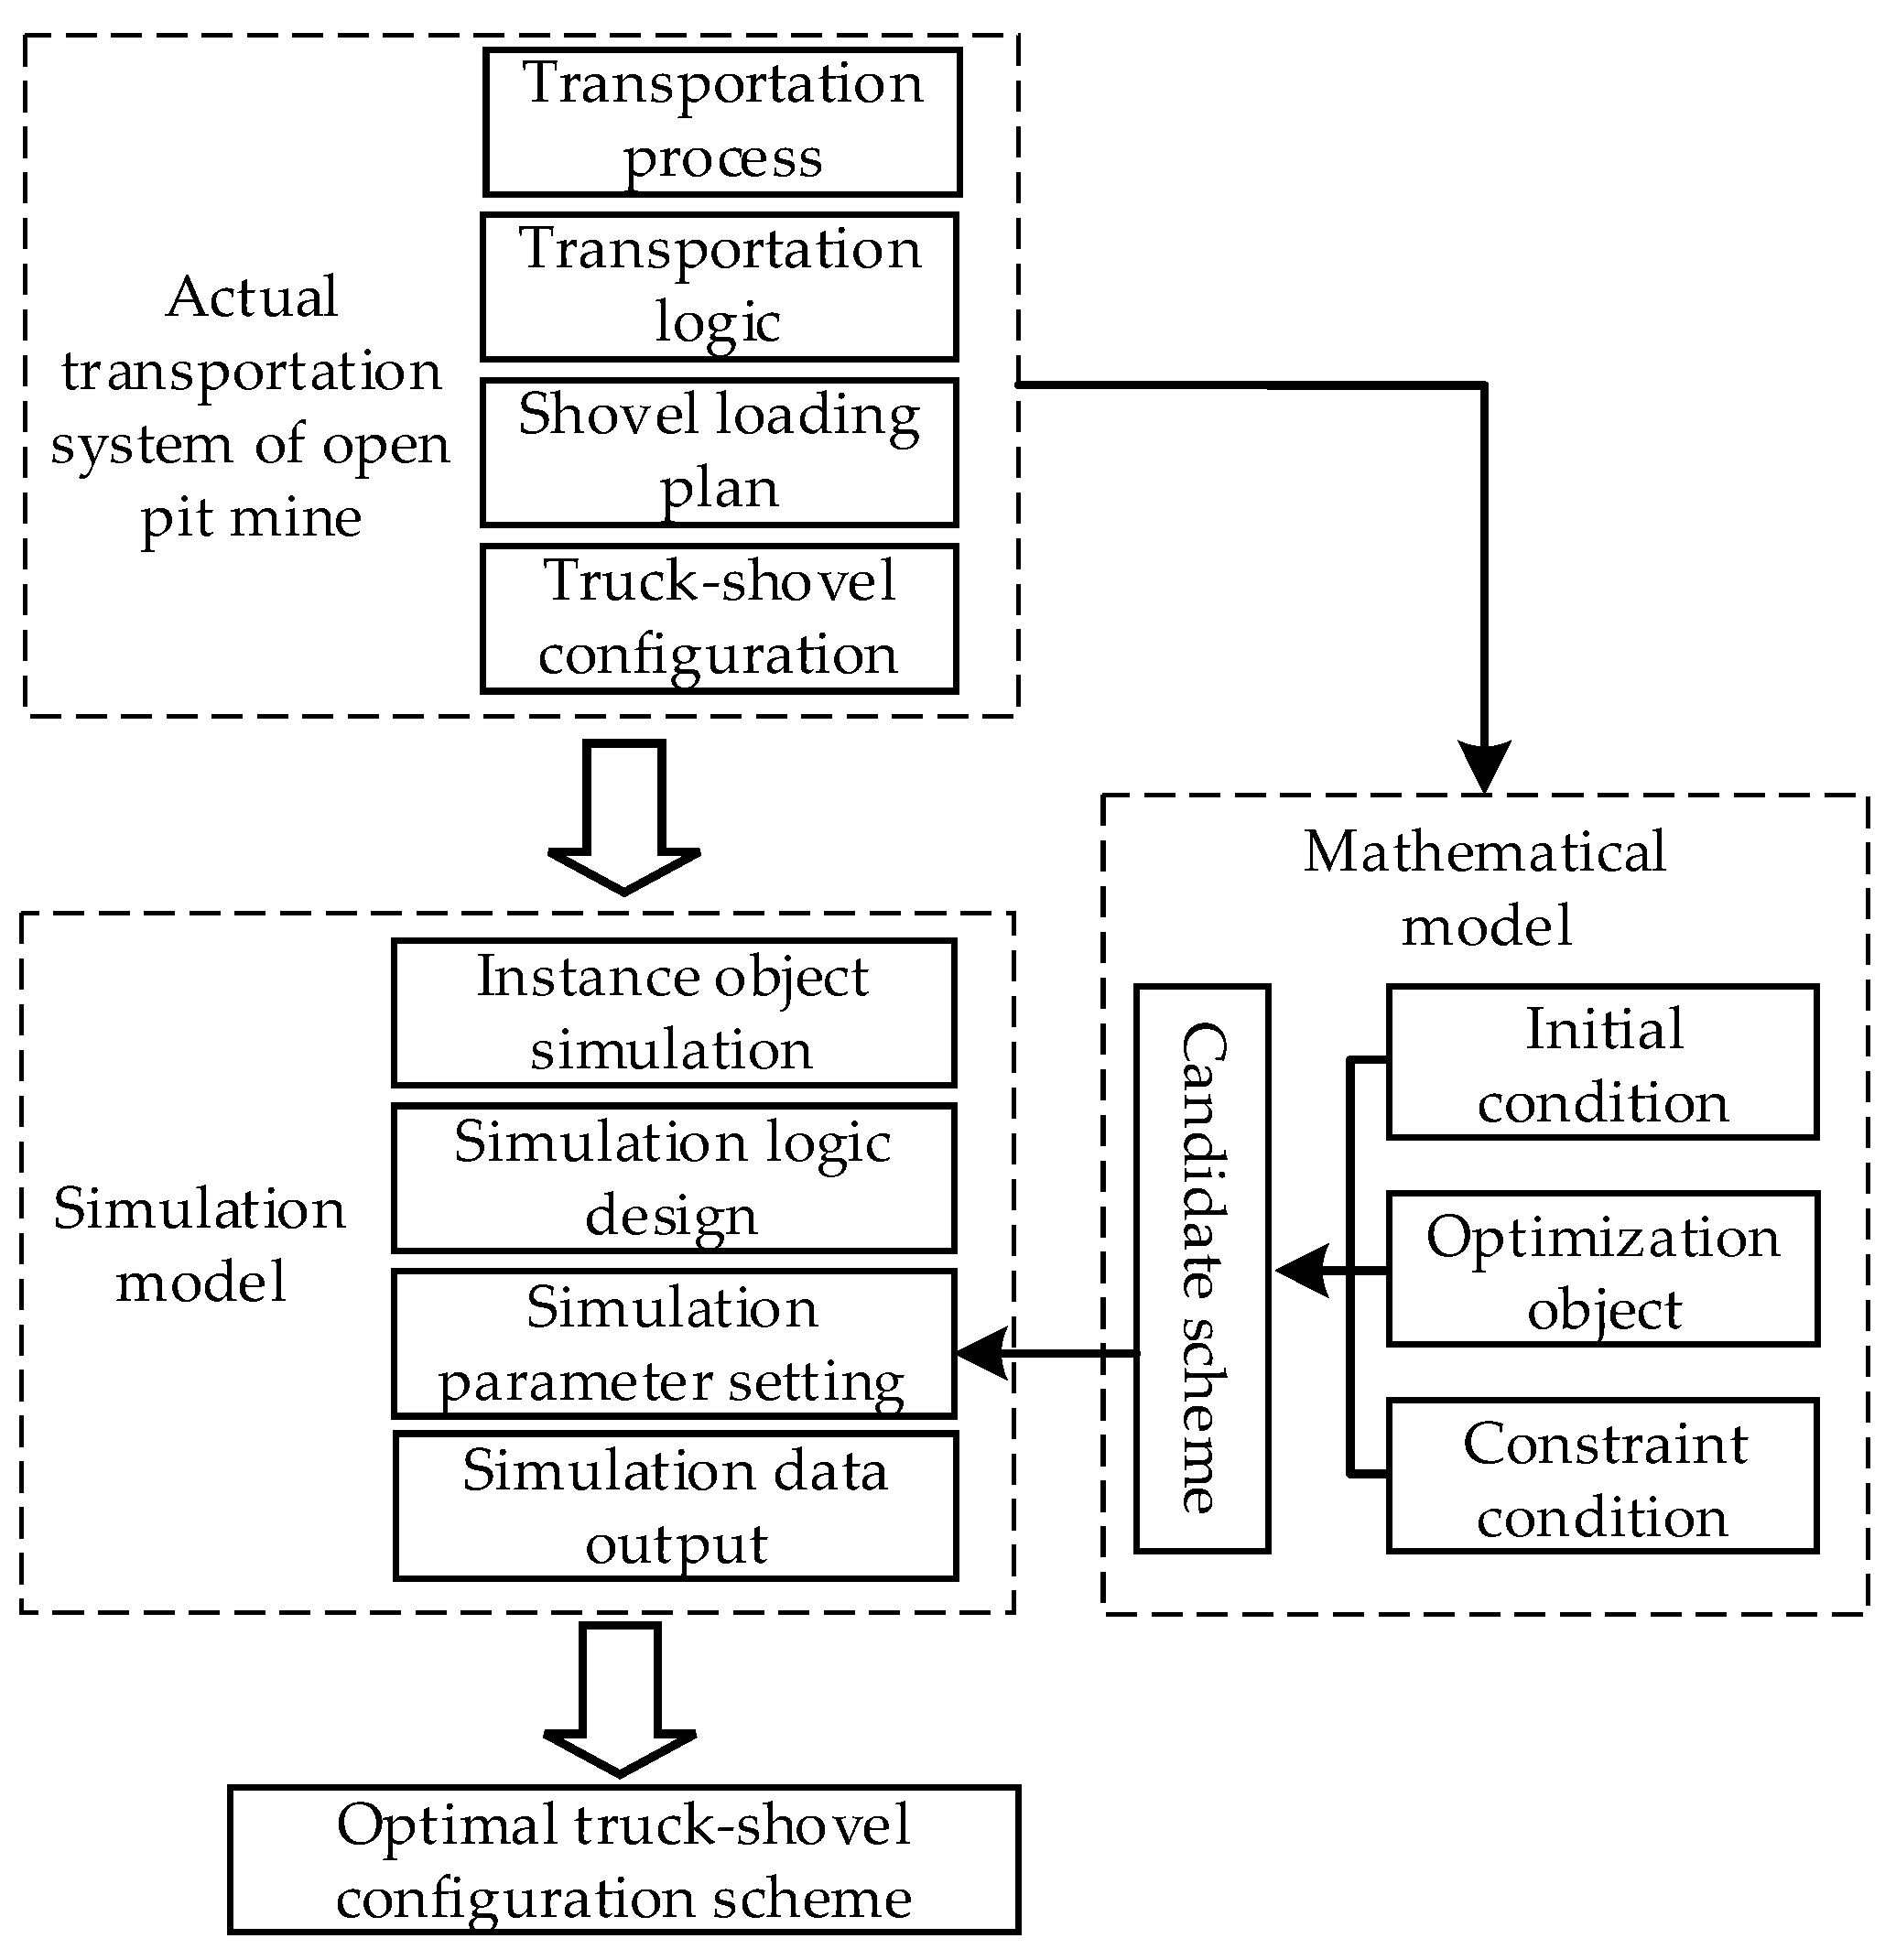
The technical route of this paper is shown in Figure 1.

2. Construction of Ideal Mathematical Model of Truck–Shovel System in Open-Pit Mine

2.1. Overview of Open-Pit Truck–Shovel System

The specific task of open-pit mining is to transport the economically valuable mineral resources on the surface to the designated unloading area for subsequent processing after blasting and shoveling. As the core to undertaking the task of shovel loading, transportation and unloading, the truck–shovel system mainly includes four submodules: shovel-loading area, unloading area, transportation route and dispatching center. The basic structure of the system is shown in Figure 2. Among them, the shovel-loading-area submodule includes the work platform for the generating materials, blasting pile, shovels and transportation trucks. The transportation-route submodule includes transportation routes and trucks, and the routes are also divided into loaded truck lines and empty truck lines. The unloading area submodule mainly includes the material unloading point and the transportation trucks. The main function of the dispatching center is to connect the above three submodules, to allocate the loading and unloading tasks to trucks and shovels and to coordinate the whole shovel-loading, transportation and unloading process.
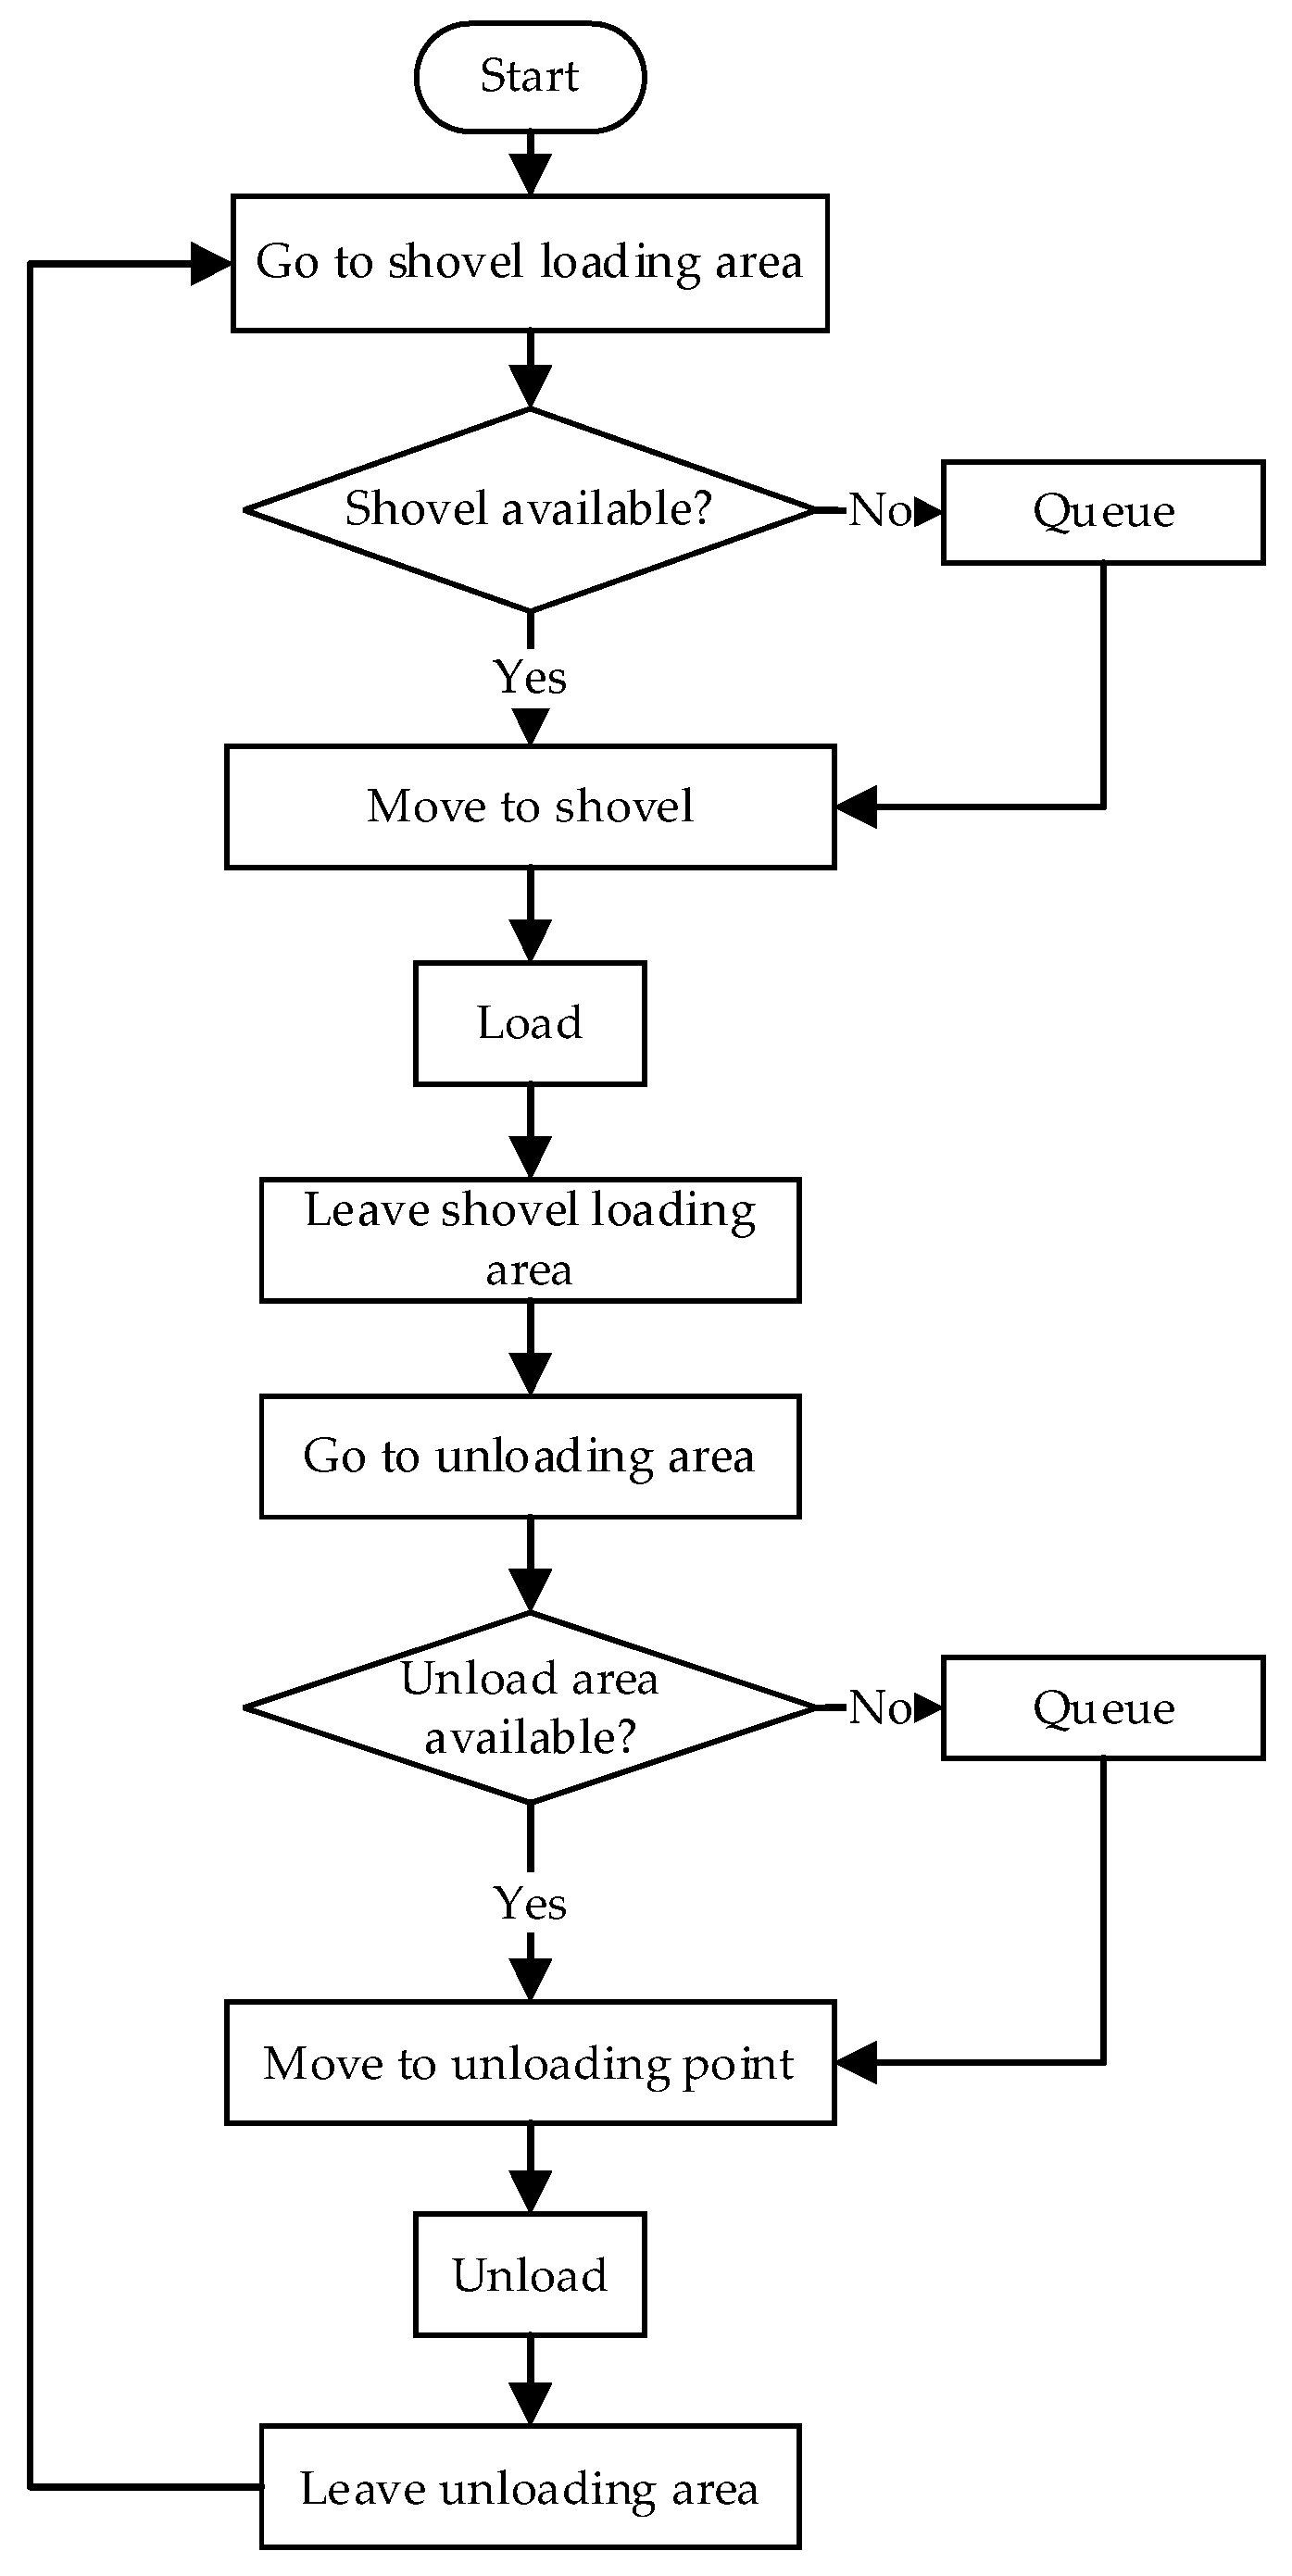
In the truck–shovel system, the main research object is the transportation truck, because trucks exist in each submodule and undertake the tasks of loading, transportation and unloading, and these running states are dynamic. After receiving the transportation instructions from the dispatching center, the truck will go to the shovel-loading area and wait for the shovel to transfer materials from the blasting pile to the truck. If there are other trucks loading in this area, the current truck needs to queue until the prior truck completes the loading task and leaves before loading. After the truck is fully loaded, it will leave the shovel-loading area along the designated loaded-truck line to the unloading area. When arriving at the unloading area, if there are other trucks performing unloading tasks in this area, the current truck needs to wait in line until the truck ahead completes the unloading task and leaves before unloading. After unloading, the truck returns to the shovel-loading area along the designated empty-truck line to continue the loading task. The circulation process of single transportation operation is shown in Figure 3.

2.2. Mathematical Model of Open-Pit Truck–Shovel System

In order to satisfy the requirements of daily production of the mine, mining enterprises usually arrange a shovel-loading machine in each shovel-loading area and configure multiple transportation trucks in this area to give full play to the potential of the equipment and to ensure the continuity of transportation. Therefore, we propose a mathematical model to describe the truck–shovel system, which is an ideal transportation model.
Firstly, it is necessary to clarify the problem to be solved by building the model, that is, how to configure the equipment under the given types and quantity of transportation trucks and shovels in order to maximize the total production and profit of the system within a certain time. Then, according to the operation characteristics of the truck–shovel system, set the initial conditions and parameters of the model, take the actual transportation requirements of the mine as constraints, take the daily total production and profit as expectations and set the truck–shovel configuration as the solution target to complete the construction of the mathematical model.
The initial conditions and parameters of the transportation trucks are:
  • There are n types of transportation trucks and each model’s name is T r u c k i i = 1 ,   2 , , n
  • There are q i i = 1 ,   2 , , n , q i N trucks of each model, i = 1 n T r u c k i × q i trucks in total;
  • The loading capacity (LC) of each type of truck is L C i i = 1 ,   2 , , n tons per truck;
  • The unloading time (ULT) of each type of truck is U L T i i = 1 ,   2 , , n seconds;
  • The transportation cost of each type of truck is C o s t t r u c k i i = 1 ,   2 , , n CNY per ton;
  • The average running speed of all types of trucks is v ˉ m/s, which is the average of the loaded speed and the empty speed.
The initial conditions of the shovels are:
  • There are S h o v e l j j = 1 ,   2 , , m types of shovels, each of which has one machine, m shovels in total;
  • The bucket volume (BV) of each model of shovel is B V j j = 1 ,   2 , , m cubic meters;
  • The single loading operation time (LOT) of each model of shovel is L O T j j = 1 ,   2 , , m seconds;
  • The loading cost of each type of shovel is C o s t s h o v e l j j = 1 ,   2 , , m CNY per ton.
Other initial conditions are:
  • The daily transportation time (DTT) of the mine is D T T seconds;
  • In case of truck blockage, the duration is B T k k = 1 ,   2 , seconds, which is determined by the efficiency of the trucks and shovels;
  • The unit weight of raw ore after crushing is ρ tons per cubic meter;
  • The price of raw ore is C o s t o r e CNY per ton;
  • The quantity of loading areas is m , and there is only one shovel at each loading area;
  • The minimum daily production requirement for each loading area is D P j tons;
  • The number of unloading areas is one;
  • The distance from the loading area to the unloading area is D j j = 1 ,   2 , , m m.
From the above initial conditions, we can know that there is a total of m ! allocation methods if m shovels are allocated to m loading areas in the form of one shovel per loading area. For convenience of explanation, the first allocation method is adopted here for the modeling description.
First, we need to model and analyze the transportation capacity of the trucks. Without considering the blocking situation, that is, when only one truck is running on the route, for the loading area   j with one S h o v e l j deployed, the single transportation time of T r u c k i is shown in Formula (1):
T j i = 2 D j v ˉ + U L T i + L O T j × L C i ρ × B V j              
Then, the maximum daily transportation volume of a single T r u c k i at the loading area j is shown in Formula (2):
T r a n s j i = L C i × D T T T j i
When there are multiple trucks driving on the transportation route, the trucks may queue in the loading area or unloading area to wait for the trucks ahead to complete operation. The blocking time is determined by the operation efficiency. Therefore, the blocking time is a fluctuation dynamic value. To simplify the calculation, a fixed value is given in the model for approximate calculation. Considering the blocking, the single transportation time of T r u c k i at the loading area j   is shown in Formula (3):
T j i _ b l o c k = 2 D j v ˉ + U L T i + L O T j × L C i ρ × B V j + B T k
Under the situation of blocking, the maximum daily transportation volume of a single T r u c k i at the loading area j is shown in Formula (4):
T r a n s j i = L C i × D T T T i j _ b l o c k
To make the model more precise, the following constraints need to be added:
  • All loading areas must be configured with more than two trucks to ensure that shovels will not be idle for a long time;
  • The sum of the transportation volume of all trucks needs to meet the minimum daily transportation volume requirements.
Based on the above constraints, it is assumed that a j i a j i N   T r u c k i s are deployed in the loading area j , where a j i   satisfies j = 1 m a j i = q i and i = 1 n a j i 2 . Then, the truck configuration at the loading area j can be expressed as Formula (5).
Q j = [ a j 1 , a j 2 , , a j i ] Τ
For the loading area j , the single-cycle transportation volume of each truck configured can be expressed as Formula (6):
T r a n s j = T r a n s j 1 , T r a n s j 2 , , T r a n s j i
Therefore, for the current configuration, the overall transportation volume of the mine is shown in Formula (7).
T r a n s a l l = j = 1 m T r a n s j Q j = j = 1 m T r a n s j 1 × a j 1 + T r a n s j 2 × a j 2 + + T r a n s j i × a j i ,
where T r a n s j Q j needs to meet T r a n s j Q j D P j .
After enumerating and solving the model, all truck allocation schemes that meet the requirements can be obtained, as shown in Formula (8):
P l = Q 1 , Q 2 , , Q j ,
where l is the number of schemes.
Furthermore, we consider the operating profit into the model. It is known that the single transportation cost of all types of trucks is expressed in Formula (9), so the single operation cost of all types of shovels is Formula (10):
C o s t t r u c k _ a l l = C o s t t r u c k 1 , C o s t t r u c k 2 , , C o s t t r u c k i
C o s t s h o v e l _ a l l = C o s t s h o v e l 1 , C o s t s h o v e l 2 , , C o s t s h o v e l j
For the truck–shovel allocation scheme P l , the total cost of truck transportation is Formula (11), the total cost of shovel operation is Formula (12) and the profit is Formula (13).
C o s t t r u c k _ l = j = 1 m C o s t t r u c k _ 1 × T r a n s j 1 × a j 1 + C o s t t r u c k _ 2 × T r a n s j 2 × a j 2 + + C o s t t r u c k _ i × T r a n s j i × a j i
C o s t s h o v e l _ l = j = 1 m [ C o s t s h o v e l _ j × T r a n s j 1 × a j 1 + T r a n s j 2 × a j 2 + + T r a n s j i × a j i ]
P F l = T r a n s a l l _ l × C o s t o r e C o s t t r u c k l C o s t s h o v e l l
In the actual transportation of open-pit mines, truck blocking occurs frequently and it is difficult to determine the specific queuing duration. The queuing time is a dynamically changing value, including unforeseen truck speed fluctuations, shovel-loading efficiency fluctuations and other issues. Therefore, the mathematical model can only obtain the truck–shovel allocation scheme in the ideal condition. In order to achieve the optimal configuration scheme of the open-pit mine truck–shovel system as close to the real situation as possible, we use Flexsim to build a simulation platform of the open-pit mine transportation system so that it can simulate various uncertainties of the trucks and shovels during operation. Based on this simulation platform, we conduct simulation experiments on the candidate schemes obtained through the mathematical model, take the maximum profit as the goal and obtain the local optimal truck allocation scheme under the current shovel and loading area distribution mode. Then, we compare it with the local optimal scheme in the other m ! 1 modes to obtain the global optimal scheme, which is the final optimal solution for the configuration of the open-pit mine truck–shovel system under the existing truck–shovel conditions.

3. Simulation Model of Open-Pit Mine Truck–Shovel System Based on Flexsim

3.1. Overview of Simulation Model Construction

When evaluating or optimizing the current mine truck–shovel system in the simulation environment, there are two difficulties in constructing the simulation model: one is whether the accuracy of the established model can meet the requirements of the simulation experiment; the second is whether the relevant logic of the model can truly reflect the operation of the real system, such as the problem of truck speed control, the queuing strategy of trucks in the loading and unloading area, whether trucks are allowed to overtake, etc. Only the above two points satisfy the requirements; the simulation model can represent the real situation as much as possible and its simulation results can have guiding significance and value.
During the process of constructing the simulation model of the open-pit mine truck–shovel system and realizing the optimization purpose, on the one hand, the random variable parameters of the system should be determined, on the other hand, the system logic should be designed and secondarily developed. Considering the uncertainties of the real truck–shovel system, such as the loading and unloading time of the truck, the running speed of the truck and many other parameters that are in dynamic changes, we designed and developed the system behaviors in Flexsim in order to realize the simulation of the uncertainty in the transportation processes of an open-pit mine.
After completing the overall layout construction of the truck–shovel system model and clarifying the operation process of the simulation system, it is also necessary to set up the submodules and their basic objects and to use the object attributes and the interaction logic between objects to realize the main functions of the four submodules of the shovel-loading area, unloading area, transportation route and dispatching center in the system.
Finally, in addition to the macro model, it is also necessary to consider the micro impact of the system. By inputting the actual data into the model, we can verify the simulation model and further adjust the model to reduce the overall impact of some unconstrained micro variables in the system; collect and analyze the production data of loading and unloading time, bucket capacity, single loading capacity, average speed, etc., of trucks and shovels in a mine; apply the data in the simulation model and compare the output with the daily production results of the mine; test whether the parameters in the system are reasonable and whether the correlation between the operation logic and the system efficiency is correct in order to build a simulation model of the open-pit mine truck–shovel system that conforms to the realistic logic with reasonable errors. Based on this model, the candidate truck–shovel allocation scheme obtained from the mathematical model in Section 2 can be tested to determine the best allocation scheme.

3.2. Specific Construction Process in Flexsim

To build the simulation model of the truck–shovel system in Flexsim and to model each submodule with its entity objects, it is necessary to establish the communication and interaction logic between entity objects with the help of Flexsim functions such as Port Connection, Labels, Triggers and Temporary Entity Flow, and finally realize the stable operation of the simulation system. Among them, port connection establishes the connection between entities, realizes the communication between entities and transmits temporary entity items. Labels store entity information and are often used for reference of entity attributes and logic, condition decision making and real-time tracking of attribute information in programming. Trigger refers to when events related to entities occur in the simulation system, the corresponding trigger executes relevant logic, resulting in the occurrence of other behaviors or events. Temporary entity flow controls the entry and exit mode of temporary entities and determines upstream and downstream entities. In addition, other basic attributes of the entity object in Flexsim are also used to realize the basic attributes and functions of the corresponding entity of the truck–shovel system. The logic of the submodule construction of the shovel-loading area is shown in Figure 4.
(1)
Construction of shovel-loading area
The shovel-loading area is used to simulate the generation of ore piles and materials and the process of the shovel-loading link, mainly including working faces, blasting piles, shovel-loading equipment and unloaded trucks. In the Flexsim entity library, Source, Queue, Processor and Task Executor entities are applied to simulate the above objects and to implement their functions. The specific operation process of the shovel-loading area is as follows: after the mineral materials are produced on the working face, the materials are temporarily stored in the blasting pile, then the shovel transfers them to the truck. Figure 4 shows the logic of the submodule construction of the shovel-loading area, including mine entity, the corresponding Flexsim entity and the function realization.
The main function of Queue is to temporarily store the materials to be loaded, which simulates the blasting pile generated after the blasting operation. Item simulation mainly sets the Source (working face), Arrival Schedule and On Creation, and parametrically defines the physical properties, generation time, type, quantity, grade, etc., of materials. By setting the rules of last in/first out (LIFO), late arriving materials can be processed first. By setting the temporary entity Flow, the downstream entity of the material, namely the output port, is controlled, which is generally the shovel in the current shovel-loading area. Triggers include three functions: entry, message and reset. It is mainly used to record properties such as type, processing time and transportation volume of materials in the stack segment.
Processor simulates the shovel to transfer the blasting materials onto the transport truck. The Labels of shovels mainly include “Size”, “DipperCapacity”, “CurrentState”, “ProcessTime”, “TotalOreItemWeight”, “CurrentTruck”, etc., which respectively record the attributes of shovel size and bucket capacity, track the real-time state of shovel, record the running time of the shovel, record the quality of materials loaded by the shovel and display the trucks currently performing loading tasks at this shovel. The shovel connects the upstream and downstream entities of the material through Input Ports and Output Ports, i.e., the blasting pile and the unloading point, to determine the source and destination of the material. The shovel is connected to the Dispatcher and the Network Node through the central port. When the shovel finishes handling materials, it generates a transportation task sequence. After obtaining the task sequence, the Dispatcher sends it to the designated or available truck, and the truck goes to this shovel to implement the loading task. Set the material handling time and loading animation of the shovel by setting the Processing Time, On Reset trigger, entry trigger, exit trigger and message trigger and record the quantity and quality of materials handled by the shovel, as well as the number of collaborative transportation trucks.
Task Executor simulates the transportation truck, which is the most important entity object in the truck–shovel system. It runs in the loading and unloading area and on the transportation line to complete the loading, transportation and unloading of materials. In the shovel-loading area, it mainly interacts with the shovel to execute the shovel-loading task sequence. The main attributes of the trucks include capacity, max speed, acceleration, deceleration, rotation threshold, load time, unload time, queue strategy, etc. The labels of trucks mainly include “MaxSpeed”, “LoadCapacity”, “TotalTravel”, “CurrentState”, “LoadTime”, “UnloadedTime”, “BlockTime”, “TotalOreItemWeight”, “CurrentLocation”, etc. These truck labels respectively set the maximum speed and load capacity, record the total distance, track the real-time status, set the loading and unloading time, queue time, record the total mass of materials and track and display the real-time location, etc. Through the above multi-type triggers, the attributes of trucks can be set and recorded and the simulation of the truck operation process can be realized.
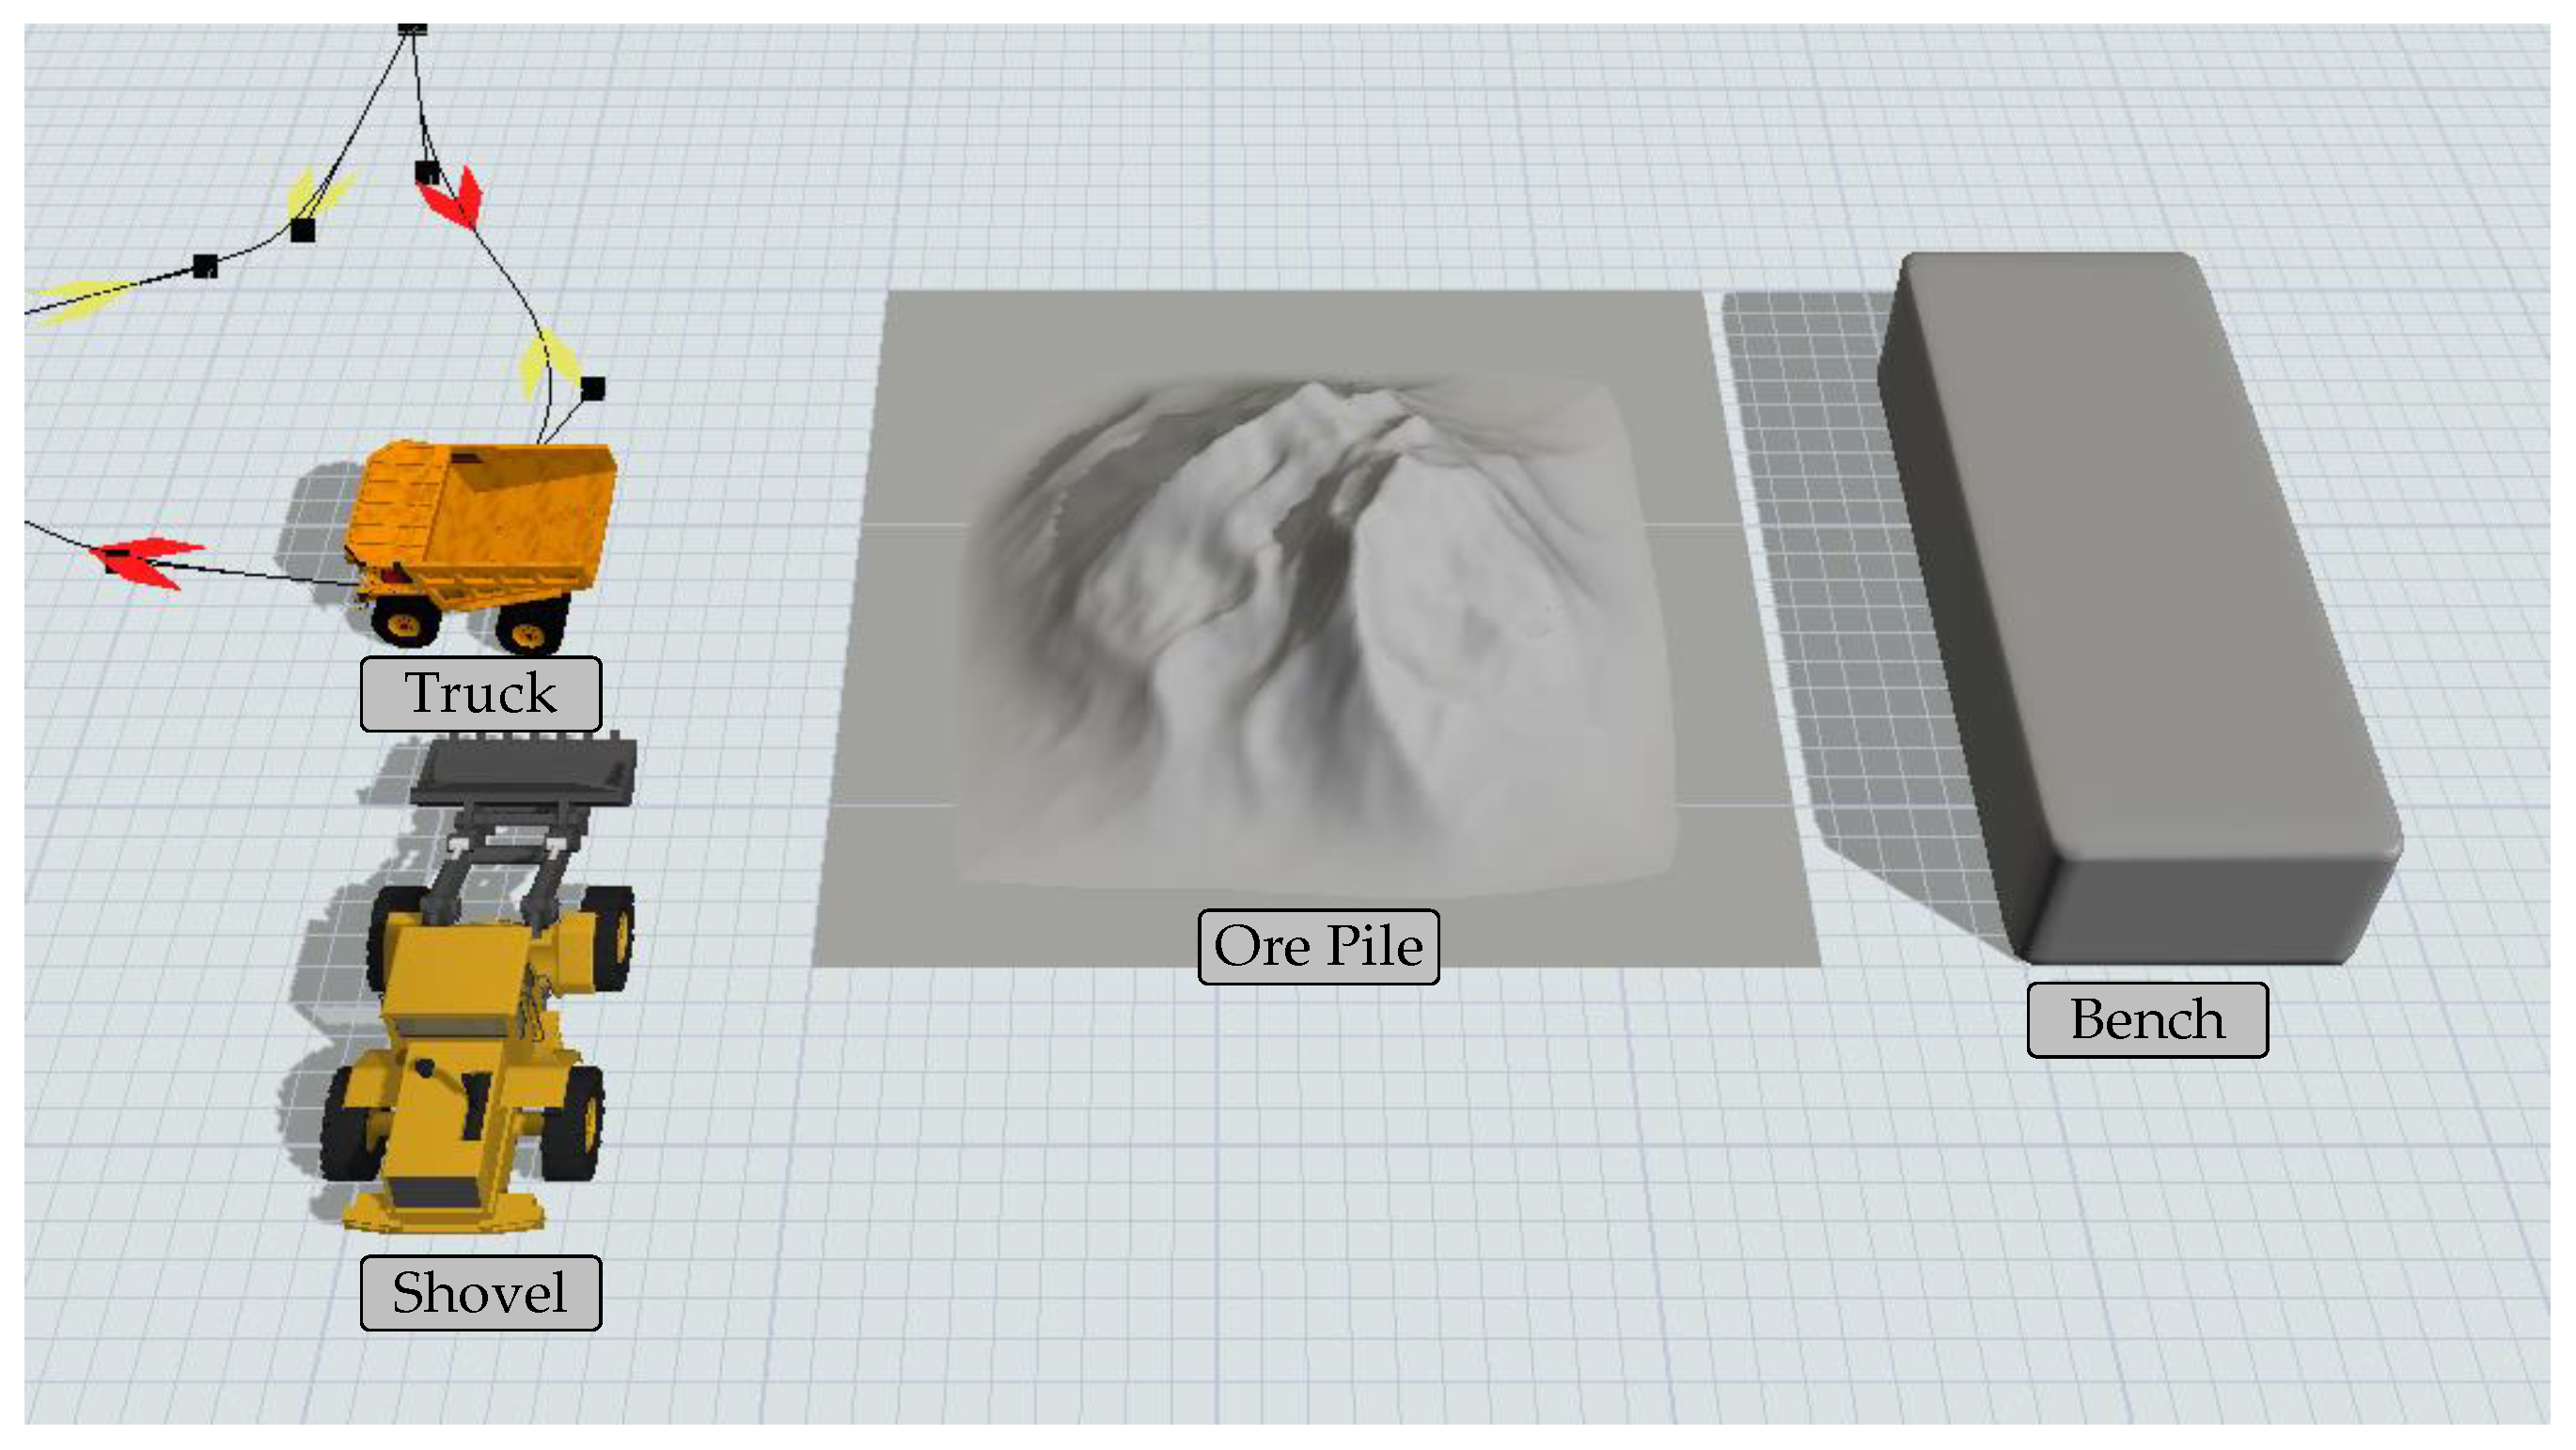
The 3D model of a shovel-loading area built in Flexsim is shown in Figure 5.
(2)
Construction of unloading area
The unloading area is used to simulate unloading, belt transportation, storage and other functions of materials, mainly including unloading points, heavy loading trucks, conveyor belts and other entities. In the Flexsim entity library, the above objects are simulated with Queue, Task Executor, Conveyor, Sink and other functions. Figure 6 shows the logic of the submodule construction of the unloading area. We use the unloading point to receive the materials unloaded by the truck and to store them. It can be connected to multiple input ports, which means that the materials from multiple shovel-loading areas can be transported to this unloading point for unloading. When there is an ore blending demand, the ore blending function can be realized by setting attributes such as the material unloading ratio. The materials unloaded at the unloading point will be transported to the downstream beneficiation plant by belt and the simulation will be realized by applying the Conveyor object and the Sink object in Flexsim.
The 3D model of an unloading area built in Flexsim is shown in Figure 7.
(3)
Design of transportation route
The transportation route submodule is an important module for transferring materials. It provides the driving route for the transportation truck and simulates the driving situation of the truck on the real road, mainly including the transportation route and the truck performing transportation tasks. In the Flexsim entity library, we use Network Node and Task Executor entities to simulate the above objects, respectively. Figure 8 shows the logic of the submodule construction of the transportation route. According to the original geological data of the mine, the three-dimensional node information is established and the node connection forms routes. Since the node is three-dimensional, the route naturally has a slope attribute. The more the node information is established, the more accurately the transportation route is constructed. The transportation route is deployed in the simulation environment. After the truck connects with its port and establishes an interactive relationship, it will drive between the loading and the unloading areas according to the transportation path to complete the material transportation task. We set the transportation route attributes through transportation route nodes, including the maximum number of passing devices, overtaking rules, truck safety distance, speed limit, queuing strategy, etc.
The 3D model of the transportation route built in Flexsim is shown in Figure 9.
(4)
Design of dispatching center
The main function of the dispatching center submodule is to generate a command sequence for the truck according to the shovel task sequence and to simulate the truck dispatching function; the construction process is shown in Figure 10. The dispatching center realizes interactive communication by connecting with the shovel to judge whether the shovel currently has a task sequence. When there is a task sequence, it turns it into a command sequence and sends it to the designated or available truck. Then, the truck performs specific tasks according to the command sequence.
The 3D model of the dispatching center is shown in Figure 11.
(5)
Design of equipment parameter
In the open-pit mine truck–shovel simulation system, the relevant equipment parameters have a significant impact on the system operation efficiency. The main parameters are truck speed, loading time, unloading time, single transportation quality, etc. Among them, the truck speed is usually related to the truck’s own attributes, transportation route characteristics, mining equipment operation requirements, etc. In addition, there are speed limits when the truck is in the shovel-loading area, unloading area, intersection and uphill or downhill. In the simulation model, the average speed of the truck is set by the maximum speed, which means that the truck starts driving at a constant speed when it reaches the maximum speed. The value of this parameter is determined according to the actual situation of the mine. For random variables such as loading and unloading time, the distribution law can be determined by historical data collection and analysis of onsite trucks; the same probability distribution function can be used to assign values to them in Flexsim. After the data statistics and analysis of the loading and unloading time of a truck in a cement mine in Jiangsu Province, the results satisfy the normal distribution law, so the standard normal distribution will be applied in this example to assign values to the loading and unloading time of trucks.
(6)
Example simulation model
For the purpose of verifying the reliability of the method and for obtaining the optimization scheme through experiments, we built a simulation model based on the above modeling process according to the specific situation of a cement mine in Jiangsu, China. The simulation model of this open-pit mine truck–shovel system is shown in Figure 12. The basic mining parameters of this mine are shown in Table 2.
4. Simulation Example and Optimization Analysis

4.1. Reliability Test of Simulation Model

In order to explore the reliability of the simulation model, we input the configuration parameters of a cement mine truck–shovel system into the simulation model to verify whether its transportation capacity is consistent with the real situation. The Flexsim version used is 19.0.0. The configuration of the computing platform is shown in Table 3 and the configuration of simulation parameters is shown in Table 4, Table 5 and Table 6.
In the simulation environment, the main factors that affect the final transportation volume of the mine include the traffic blocking time of the truck, the driving distance of the truck, the loading time of the truck and the loading volume of the truck. These factors will produce random fluctuations according to the given initial values. Therefore, we have conducted 10 simulation tests with the same set of parameters; the results are shown in Table 7. The total simulated transportation volume of each time is compared with the actual transportation volume of the mine, as shown in Figure 13.
Among them, the truck average speed is the average speed of all trucks in transportation in the simulation process, and the average efficiency of the truck refers to the ratio of the non-queuing time of the truck to the driving time in the cycle.
It can be concluded from Figure 13 that the average error of the transportation volume of the simulation test compared with the actual transportation volume is 2.20% at loading point 1, 0.58% at loading point 2, 0.86% at loading point 3 and 1.22% with the total transportation volume of this mine. The reason for the error is that in the actual transportation scenario of the mine, uncertain factors such as ore block falling, abnormal parking and driver operation fault may occur during the transportation process; however, the overall error is small and within an acceptable range.

4.2. Experiment of Determining the Best Truck–Shovel Allocation Scheme

We analyzed the configuration in Table 2, Table 3 and Table 4 according to the mathematical model described in Section 2, in which there are three shovel-loading areas and three types of shovels, so there is a total of A 3 3 = 6 shovel-loading area matching schemes. Then, the six configurations are traversed in the simulation model and the optimal truck–shovel configuration scheme under each shovel-loading area matching is obtained. Finally, the global optimal truck–shovel configuration scheme is selected by comparing the six local optimal schemes. The main factor to evaluate the advantages and disadvantages of the scheme is the transportation profit under the condition of meeting the requirements of the daily transportation volume. In order to reduce the error, each scheme will be tested in the simulation platform three times and the average profit will be taken as the final profit of this scheme.
(1)
Longitudinal comparison
The longitudinal comparison results of the candidate truck–shovel configuration schemes under the six shovel-loading area matchings are shown in Figure 14.
It can be concluded from Figure 14 that after sorting, for the same shovel-loading area configuration, the transportation profit has a positive correlation with the total transportation volume of the transportation system. With the decrease of the total transportation volume, the profit will also decrease synchronously. However, when the total transportation volume difference is small and the transportation volume difference between the two types of trucks is large, the profit will also decline.
The following conclusions can be drawn from the analysis results:
The selling price per ton of raw ore is much higher than the shovel-loading and transportation cost per ton of ore, so the total transportation volume is the most crucial factor affecting profits. When the difference between the total transportation volume is small, since the cost of transporting ore per ton of type 2 truck is more than that of type 1 truck, this results in the abnormal situation of an individual large total transportation volume with reduced profits. The transportation volume of different types of trucks is the main factor affecting profits. Although the shovel-loading costs per ton of different models of shovels also varies, the impact of the difference in shovel-loading capacity per 10,000 tons on the transportation profit is less than 1‰ and the transportation distance from different loading points to the unloading point of the mine changes little. After statistical analysis, the mine has included this cost into the transportation cost of two types of trucks. Therefore, the total shovel-loading capacity and the transportation distance of different loading points are secondary factors affecting the profit, which have little impact on transportation profits.
(2)
Horizontal comparison
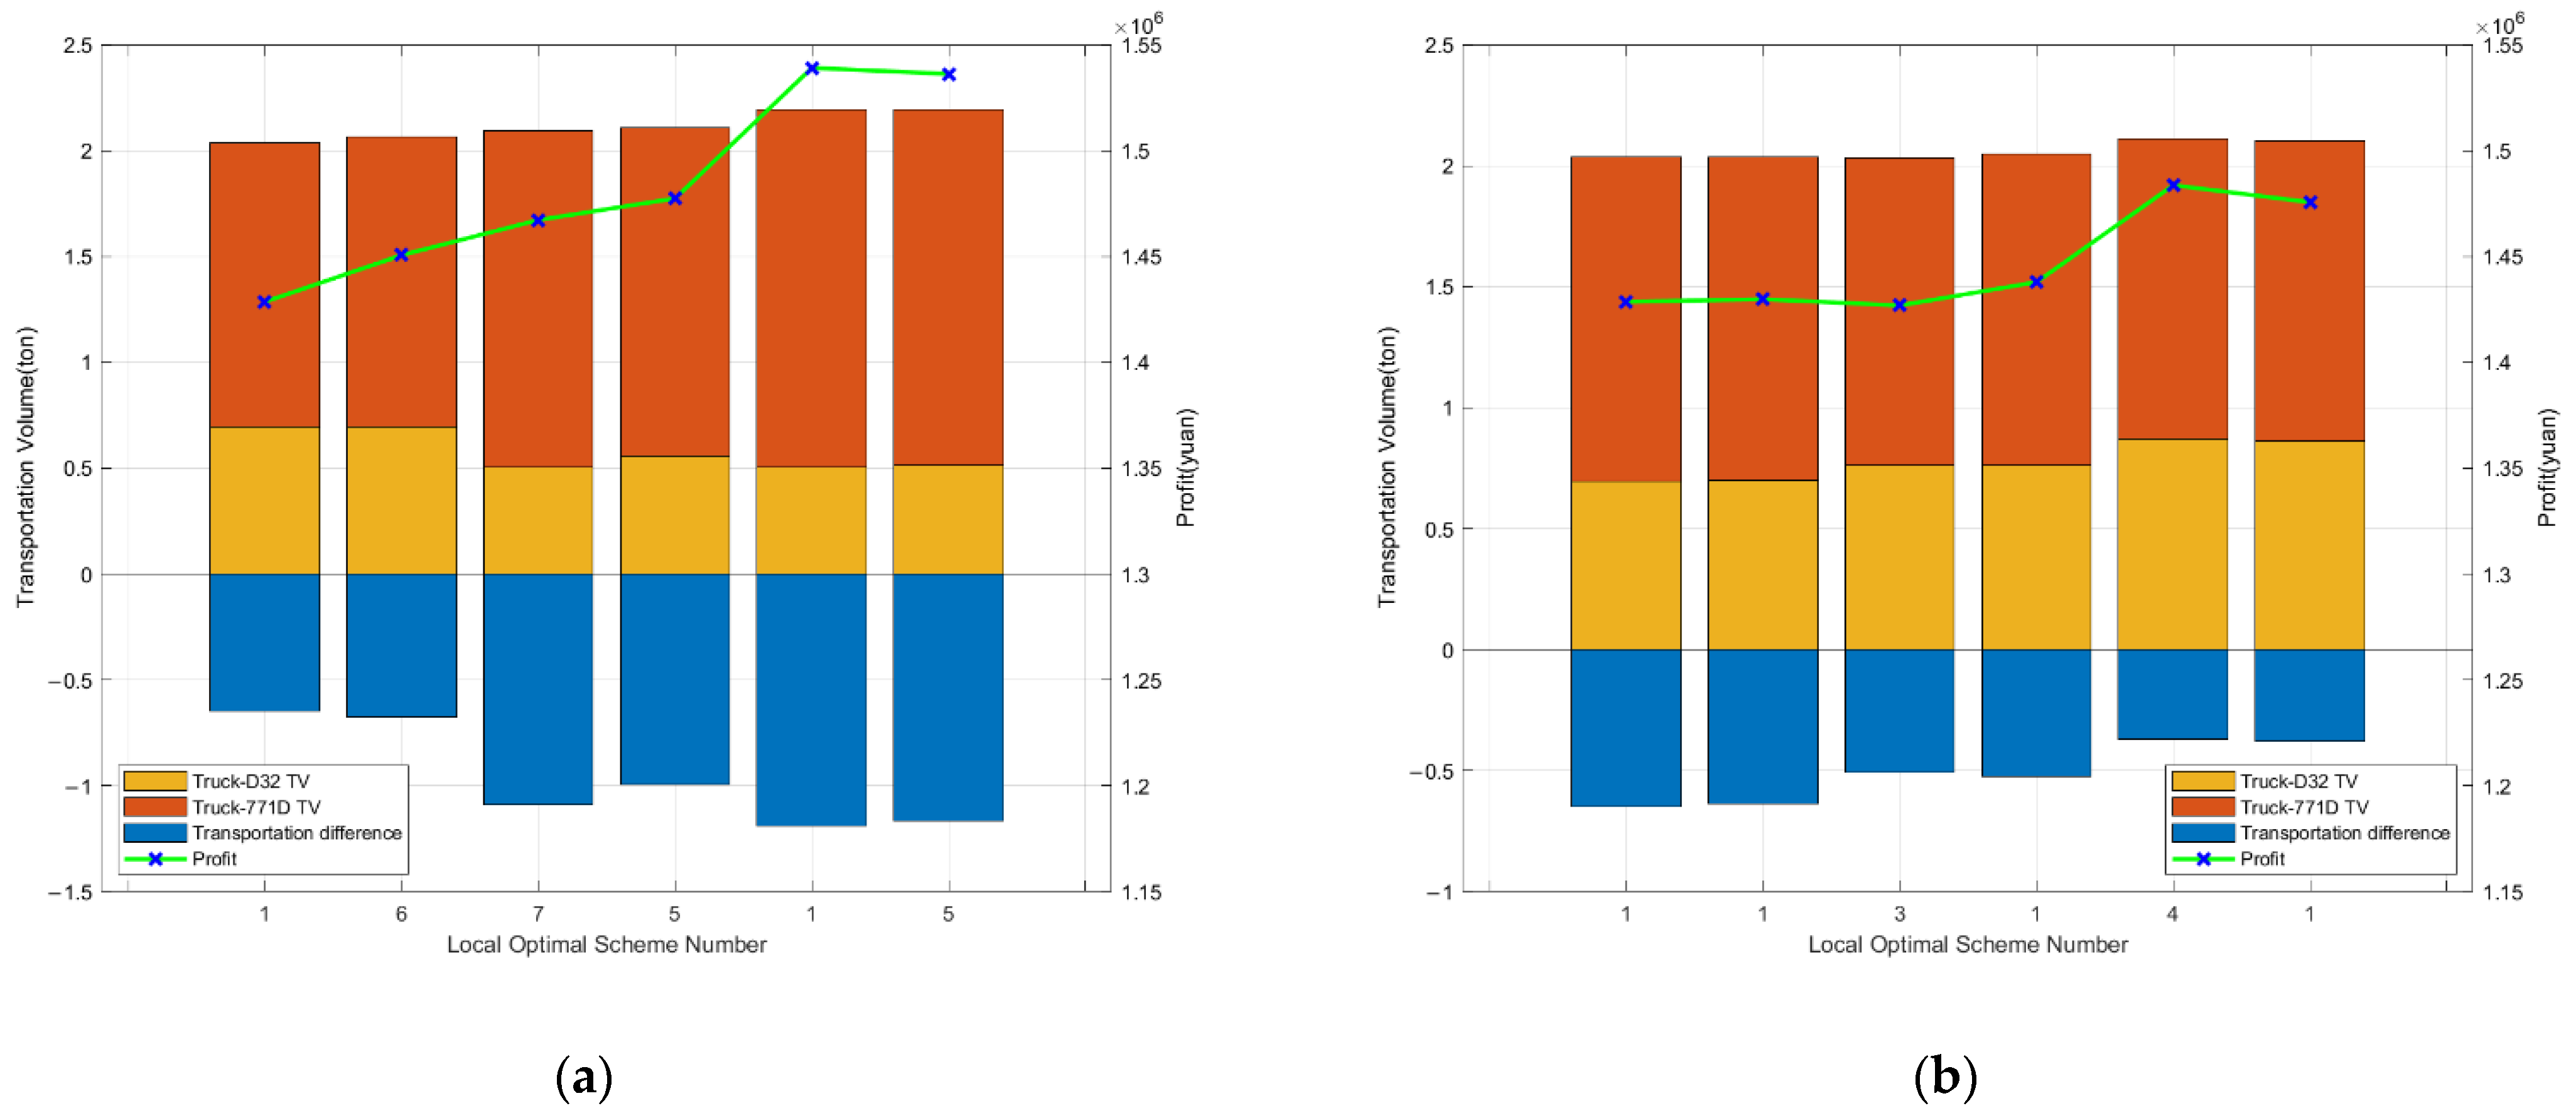
The horizontal comparison results of local optimal truck–shovel configuration schemes under the six shovel-loading area matchings are shown in Figure 15.
When only the total transportation volume is applied as the screening standard for the best scheme, the optimal truck–shovel configuration is the first set of subschemes under the fifth shovel-loading area matching. The transportation volume of this scheme is 7.84% higher than the initial scheme of the mine and the profit is 7.73% higher. The details of this truck–shovel configuration are shown in Table 8. When considering the ore output requirement at the loading point, the optimal truck–shovel configuration is the fourth set of subschemes under the fifth shovel-loading area configuration. The transportation volume of this scheme is 3.75% higher than the initial scheme of the mine and the profit is 3.85% higher. The details of this truck–shovel configuration are shown in Table 9.

5. Conclusions

By analyzing the experimental results, it can be found that, without considering the ore output requirement of a single loading point, the overall transportation volume of the optimal truck–shovel configuration is increased by 7.84% and the profit is increased by 7.73%, compared with the original scheme of the mine. When considering the ore output requirement of a single loading point, the overall transportation volume of the optimal truck–shovel configuration is increased by 3.75% and the profit is increased by 3.85%, compared with the original scheme of the mine. In the two optimal schemes, the number of trucks is evenly allocated among the loading points, and the shovels with the largest bucket capacity are arranged in the loading area closest to the unloading point, which illustrates that when there are enough transportation trucks, evenly allocating them to each loading point can effectively reduce the queuing situation and give full play to the truck transportation capacity. The total transportation volume can be further improved by arranging shovels with high-shoveling efficiency and trucks with strong-loading capacity to the nearest loading point. The contributions of this paper are:
  • We propose a method to choose the candidate scheme using the mathematical model to guide the simulation experiment and to determine the global optimal truck–shovel configuration scheme of the open-pit transportation system through the simulation model.
  • We established a simulation model of an open-pit mine truck–shovel transportation based on Flexsim. The model can truly restore and reflect the production links of open-pit mine shovel loading, transportation and unloading, especially simulating the uncertainty characteristics in the system.
The current work still focuses on the configuration optimization when the type and quantity of equipment are known; the future work should consider establishing a more perfect mathematical model according to the mine production planning in the design stage, taking the model selection and quantity as the solution target and obtaining more realistic candidate schemes. On the other hand, the actual mine truck–shovel operation data should be recorded more accurately in order to build a more accurate simulation model, so that the simulation system should run closer to the real mine and should realize the digital twin technology.

Author Contributions

Data curation, investigation, software, Y.Z.; conceptualization, formal analysis, writing—original draft, Y.Z., Z.Z. and L.W.; formal analysis, funding acquisition, supervision, writing—review and editing, L.B.; methodology, resources, writing—review and editing, Q.G. All authors have read and agreed to the published version of the manuscript.

Funding

This study was funded by the National Key R&D Program of China, 2019YFC0605300.

Institutional Review Board Statement

Not applicable.

Informed Consent Statement

Not applicable.

Data Availability Statement

Not applicable.

Acknowledgments

The authors gratefully acknowledge the funders and all advisors and colleagues who supported our work.

Conflicts of Interest

The authors declare no conflict of interest. The funders had no role in the design of the study; in the collection, analyses, or interpretation of data; in the writing of the manuscript, or in the decision to publish the results.

References

  1. Chaowasakoo, P.; Seppälä, H.; Koivo, H.; Zhou, Q. Digitalization of mine operations: Scenarios to benefit in real-time truck dispatching. Int. J. Min. Sci. Technol. 2017, 27, 229–236. [Google Scholar] [CrossRef]
  2. Chaowasakoo, P.; Seppälä, H.; Koivo, H.; Zhou, Q. Improving fleet management in mines: The benefit of heterogeneous match factor. Eur. J. Oper. Res. 2017, 261, 1052–1065. [Google Scholar] [CrossRef]
  3. Zhang, X.; Zou, J. Research on collaborative control technology of coal spontaneous combustion and gas coupling disaster in goaf based on dynamic isolation. Fuel 2022, 321, 124123. [Google Scholar] [CrossRef]
  4. Zhang, X.; Pan, Y. Preparation, Properties and Application of Gel Materials for Coal Gangue Control. Energies 2022, 15, 557. [Google Scholar] [CrossRef]
  5. Ercelebi, S.G.; Bascetin, A. Optimization of shovel-truck system for surface mining. J. South. Afr. Inst. Min. Metall. 2009, 109, 433–439. [Google Scholar]
  6. Askari Nasab, H.T.E. Truck-Shovel Operational Planning Using Discrete Event Simulation. In Proceedings of the 36th APCOM Symposium—Applications of Computers and Operations Research in Mineral Industry, Porto Alegre, Brazil, 4–8 November 2013. [Google Scholar]
  7. Xie, C.; Nguyen, H.; Choi, Y.; Armaghani, D.J. Optimized functional linked neural network for predicting diaphragm wall deflection induced by braced excavations in clays. Geosci. Front. 2022, 13, 101313. [Google Scholar] [CrossRef]
  8. Xie, C.; Nguyen, H.; Bui, X.-N.; Nguyen, V.-T.; Zhou, J. Predicting roof displacement of roadways in underground coal mines using adaptive neuro-fuzzy inference system optimized by various physics-based optimization algorithms. J. Rock Mech. Geotech. Eng. 2021, 13, 1452–1465. [Google Scholar] [CrossRef]
  9. Zeng, W. A Simulation Model for Truck-Shovel Operation. Ph.D. Thesis, School of Civil, Mining and Environmental Engineering, University of Wollongong, Wollongong, Australia, 2018. Available online: https://ro.uow.edu.au/theses1/270 (accessed on 7 June 2022).
  10. Ta, C.H.; Ingolfsson, A.; Doucette, J. A linear model for surface mining haul truck allocation incorporating shovel idle probabilities. Eur. J. Oper. Res. 2013, 231, 770–778. [Google Scholar] [CrossRef]
  11. Burt, C.N.; Caccetta, L. Equipment Selection for Surface Mining: A Review. Interfaces 2014, 44, 143–162. [Google Scholar] [CrossRef]
  12. May, M.A. Applications of Queuing Theory for Open-Pit Truck/Shovel Haulage Systems. Master’s Thesis, Virginia Tech, Blacksburg, VA, USA, 2013. [Google Scholar]
  13. Upadhyay, S.P.; Askari-Nasab, H. Truck-shovel allocation optimisation: A goal programming approach. Min. Technol. 2016, 125, 82–92. [Google Scholar] [CrossRef]
  14. Zhang, L.; Xia, X. An Integer Programming Approach for Truck-Shovel Dispatching Problem in Open-Pit Mines. Energy Procedia 2015, 75, 1779–1784. [Google Scholar] [CrossRef] [Green Version]
  15. Ghobadi Samani, M.; Monjezi, M.; Khademi Hamidi, J.; Mousavinogholi, A. A Mathematical Model to Optimize Allocation Sequence in Dispatching Problem. J. Min. Environ. 2020, 11, 185–192. [Google Scholar]
  16. Upadhyay, S.P.; Askari-Nasab, H. Simulation and optimization approach for uncertainty-based short-term planning in open pit mines. Int. J. Min. Sci. Technol. 2018, 28, 153–166. [Google Scholar] [CrossRef]
  17. Ozdemir, B.; Kumral, M. Simulation-based optimization of truck-shovel material handling systems in multi-pit surface mines. Simul. Model. Pract. Theory 2019, 95, 36–48. [Google Scholar] [CrossRef]
  18. Tarshizi, E.; Sturgul, J.; Ibarra, V.; Taylor, D. Simulation and animation model to boost mining efficiency and enviro-friendly in multi-pit operations. Int. J. Min. Sci. Technol. 2015, 25, 671–674. [Google Scholar] [CrossRef]
  19. Stout, C.E.; Conrad, P.W.; Todd, C.S.; Rosenthal, S.; Knudsen, H.P. Simulation of a large multiple pit mining operation using GPSS/H. Int. J. Min. Miner. Eng. 2013, 4, 278–295. [Google Scholar] [CrossRef]
  20. Chen, C.; Zhang, Y.; Wang, Q.; Xu, W.; Wang, Y. Simulation of Truck Dispatching System in Surface Mine Based on Extend. J. Syst. Simul. 2007, 19, 914–921. [Google Scholar]
  21. Zeng, W.; Baafi, E.; Walker, D. A simulation model to study bunching effect of a truck-shovel system. Int. J. Min. Reclam. Environ. 2019, 33, 102–117. [Google Scholar] [CrossRef]
  22. Bernardi, L.; Kumral, M.; Renaud, M. Comparison of fixed and mobile in-pit crushing and conveying and truck-shovel systems used in mineral industries through discrete-event simulation. Simul. Model. Pract. Theory 2020, 103, 102100. [Google Scholar] [CrossRef]
  23. Hashemi, A.S.; Sattarvand, J. Simulation Based Investigation of Different Fleet Management Paradigms in Open Pit Mines—A Case Study of Sungun Copper. Studium Przypadku: Kopalnia Miedzi W Sungun. Arch. Min. Sci. 2015, 60, 195–208. [Google Scholar]
  24. Wan, L.-R.; Gao, L.; Liu, Z.-H.; Wang, L. The Application of Virtual Reality Technology in Mechanized Mining Face. In Advances in Intelligent Systems and Computing, Proceedings of the 2012 International Conference on Communication, Electronics and Automation Engineering: Advances in Intelligent Systems and Computing, Xi’an, China, 23–25 August 2012; Springer: Berlin/Heidelberg, Germany, 2013; Volume 181, pp. 1055–1061. [Google Scholar]
  25. Stothard, P.; Squelch, A.; Stone, R.; Van Wyk, E. Towards sustainable mixed reality simulation for the mining industry. Min. Technol. 2019, 128, 246–254. [Google Scholar] [CrossRef]
  26. Rozmus, M.; Tokarczyk, J.; Michalak, D.; Dudek, M.; Szewerda, K.; Rotkegel, M.; Lamot, A.; Rošer, J. Application of 3D Scanning, Computer Simulations and Virtual Reality in the Redesigning Process of Selected Areas of Underground Transportation Routes in Coal Mining Industry. Energies 2021, 14, 2589. [Google Scholar] [CrossRef]
  27. Bardzinski, P.J.; Walker, P.; Krol, R.; Kawalec, W. Simulation of Random Tagged Ore Flow through the Bunker in a Belt Conveying System. Int. J. Simul. Model. 2018, 17, 597–608. [Google Scholar] [CrossRef]
  28. Chęciński, S.; Witt, A. Modeling and simulation analysis of mine production in 3D environment. Min. Sci. 2015, 22, 181–189. [Google Scholar]
  29. Chen, C.; Shi, L. Simulating and Optimizing of Tramcar Transportation Attempter in Open Pit Mine. In Proceedings of the 2nd International Conference on Modelling, Simulation and Applied Mathematics, Bangkok, Thailand, 26–27 March 2017. [Google Scholar]
  30. Gao, Y.; Bo, Z. Modeling method of truck dispatching system in open pit mine based on Flexsim. Machinery 2019, 46, 7. [Google Scholar]
  31. Bardzinski, P.; Jurdziak, L.; Kawalec, W.; Król, R. Copper Ore Quality Tracking in a Belt Conveyor System Using Simulation Tools. Nat. Resour. Res. 2020, 29, 1031–1040. [Google Scholar] [CrossRef] [Green Version]
Figure 1. Flow for determining the optimal truck–shovel configuration scheme.
Sustainability 14 12338 g001
Figure 2. Basic structure of truck–shovel system.
Sustainability 14 12338 g002
Figure 3. Single operation cycle of transportation truck.
Sustainability 14 12338 g003
Figure 4. Construction flow of shovel-loading area. The first line is the simulation model of mine entity object, the second line is the corresponding Flexsim entity object, and the third line is the corresponding function.
Sustainability 14 12338 g004
Figure 5. A 3D model of shovel-loading area. The yellow arrow and the red arrow respectively represent the direction of the two routes for the transport truck to complete operation.
Sustainability 14 12338 g005
Figure 6. Construction flow of unloading area. The meaning of each line is the same as Figure 4.
Sustainability 14 12338 g006
Figure 7. A 3D model of unloading area. The yellow arrow and the red arrow respectively represent the direction of the two routes for the transport truck to complete operation.
Sustainability 14 12338 g007
Figure 8. Construction flow of transportation route. The meaning of each line is the same as Figure 4.
Sustainability 14 12338 g008
Figure 9. A 3D model of transportation route. The yellow arrow and the red arrow respectively represent the direction of the two routes for the transport truck to complete operation.
Sustainability 14 12338 g009
Figure 10. Construction flow of dispatching center. The meaning of each line is the same as Figure 4.
Sustainability 14 12338 g010
Figure 11. A 3D model of dispatching center.
Sustainability 14 12338 g011
Figure 12. Top view of example simulation model: (a) is the top view of the truck–shovel simulation model in Flexsim; (b) is the top view of this model with the orthophoto image of an open-pit mine. The yellow symbol and black text are used to highlight the modules in each area of this mine. The texts in other colors indicate surveying information in different areas of this mine.
Sustainability 14 12338 g012
Figure 13. Error between simulated transportation volume and actual transportation volume. The blue line represents the error between the simulated transportation volume and the actual transportation volume of loading point 1; the pink line represents the error between the simulated transportation volume and the actual transportation volume of loading point 2; the green line represents the error between the simulated transportation volume and the actual transportation volume of loading point 3; the red line represents the error between the simulated total transportation volume and the actual total transportation volume of all loading points.
Sustainability 14 12338 g013
Figure 14. Longitudinal comparison results after descending sort of profits; (af), respectively, represent the candidate schemes in the six configurations of shovel-loading area after ranking the total profit in descending order; the yellow bar represents the total transportation volume of truck 1 (D32) and the red bar represents the total transportation volume of truck 2 (771d); the green line represents the total profit of each subscheme.
Sustainability 14 12338 g014aSustainability 14 12338 g014b
Figure 15. Optimal scheme screening. (a) shows the truck–shovel scheme only considering the total loading capacity; (b) shows the truck–shovel scheme considering the ore output requirement at each loading point; the yellow bar represents the total transportation volume of truck 1 (D32), the red bar represents the total transportation volume of truck 2 (771d) and the blue bar represents the difference between the two kinds of trucks; the green line represents the total profit of each sub scheme.
Sustainability 14 12338 g015
Table 1. The simulation software information.
Software NameVersionCreatorLocation
Arena16.0Rockwell AutomationAmerica
Flexsim22.2FlexSim Software ProductsAmerica
JaamSimv2.0JaamSim Development TeamAmerica
HaulsimV3.0RPMGLOBALAustralia
Table 2. The basic mining parameters.
Parameter NameParameter Value
MineralCement limestone
Mining modeopen-pit mining
Production scale/million t/a600
Mining area/km23
Mining elevation/m−40~190
Mining recovery rate/%100
Table 3. Configuration of computing platform.
Hardware NamePerformance
CPUIntel i9-9900K
GPUNVIDIA RTX 2080Ti
RAM32 GB
SSD512 GB
Table 4. Simulation parameters/transportation truck parameters.
NumberModelQuantityLoading Capacity/tUnloading Time/sAverage Speed/m/sTransportation Cost/CNY/t
1D32330506.53.2
2CAT771D640606.54.0
Table 5. Simulation parameters/shovel parameters.
NumberModelQuantityBucket Capacity/m3Loading Time/sRunning Cost/CNY/t
1PC430-811.9191.15
2PC650LC-8E13.1211.13
3CAT998H17.7271.03
Table 6. Simulation parameters/actual mine configuration.
Parameter NameParameter Value
Daily total transportation time of the mine/s57,600
Unit weight of raw ore after crushing/t/m31.6
Price of raw ore/CNY/t75
Minimum production requirement of loading area I/t6500
Minimum production requirement of loading area II/t 6000
Minimum production requirement of loading area III/t5500
Distance between loading area I and unloading area/m1200
Distance between loading area II and unloading area/m2100
Distance between loading area III and unloading area/m2250
Configuration of truck/shovel in loading area IOne No 1 shovel/Three No 1 truck
Configuration of truck/shovel in loading area IIOne No 2 shovel/Three No 2 truck
Configuration of truck/shovel in loading area IIIOne No 3 shovel/Three No 2 truck
Table 7. Simulation experiment data.
Experiment NumberAverage Speed/m/sAverage Efficiency %Loading Point1 TV/tLoading Point2 TV/tLoading Point1 TV/tTotal Transportation Volume/t
15.6697.366968.626747.046622.7220,338.38
25.6597.306917.996747.026619.2120,284.22
35.6697.346926.996727.376675.5220,329.88
45.6697.526989.336766.216643.6220,399.16
55.6697.356973.836762.896667.4020,404.12
65.6697.426935.206726.886688.9420,351.02
75.6697.466966.166720.916677.0420,364.11
85.6597.276940.566708.176697.7920,346.52
95.6597.226958.676722.016639.2120,319.89
105.6597.386920.686761.566633.2020,315.44
Average5.6697.366949.806739.006656.4720,345.27
Actual TV of the mine/t6800.006700.006600.0020,100.00
Table 8. Screening results of optimal truck–shovel configuration considering the total transportation volume.
NumberLoading AreaShovel ConfigurationTruck ConfigurationTotal Transportation Volume/tProfit/CNY
1INo1 shovelThree No1 truck20,359.101,428,568.78
IINo2 shovelThree No2 truck
IIINo3 shovelThree No2 truck
2INo1 shovelThree No1 truck20,670.071,450,609.11
IINo3 shovelFour No2 truck
IIINo2 shovelTwo No2 truck
3INo2 shovelThree No2 truck20,933.261,467,198.47
IINo1 shovelThree No1 truck
IIINo3 shovelThree No2 truck
4INo2 shovelThree No2 truck21,071.091,477,406.57
IINo3 shovelThree No1 truck and One No2 truck
IIINo1 shovelTwo No2 truck
5INo3 shovelThree No2 truck21,955.341,539,032.61
IINo1 shovelThree No1 truck
IIINo2 shovelThree No2 truck
6INo3 shovelThree No2 truck21,912.791,536,156.91
IINo2 shovelThree No1 truck and One No2 truck
IIINo1 shovelTwo No2 truck
Table 9. Screening results of optimal truck–shovel configuration considering each loading point ore output requirement.
NumberLoading AreaShovel ConfigurationTruck ConfigurationTotal Transportation Volume/tProfit/CNY
1INo1 shovelThree No1 truck20,359.101,428,568.78
IINo2 shovelThree No2 truck
IIINo3 shovelThree No2 truck
2INo1 shovelThree No1 truck20,375.321,429,812.30
IINo3 shovelThree No2 truck
IIINo2 shovelThree No2 truck
3INo2 shovelThree No1 truck20,326.381,426,839.45
IINo1 shovelThree No2 truck
IIINo3 shovelThree No2 truck
4INo2 shovelThree No1 truck20,483.451,437,885.66
IINo3 shovelThree No2 truck
IIINo1 shovelThree No2 truck
5INo3 shovelThree No1 truck21,123.511,483,627.82
IINo1 shovelThree No2 truck
IIINo2 shovelThree No2 truck
6INo3 shovelThree No1 truck21,009.831,475,596.70
IINo2 shovelThree No2 truck
IIINo1 shovelThree No2 truck
Publisher’s Note: MDPI stays neutral with regard to jurisdictional claims in published maps and institutional affiliations.