Article

A Comparative Study on the Export Competitiveness of Rare Earth Products from China, the United States, Russia and India

School of Economics and Trade, Guangdong University of Foreign Studies, Guangzhou 510006, China
*
Author to whom correspondence should be addressed.
Sustainability 2022, 14(19), 12358; https://doi.org/10.3390/su141912358
Submission received: 31 August 2022 / Revised: 21 September 2022 / Accepted: 26 September 2022 / Published: 28 September 2022

Abstract

:
This paper evaluates and compares the export competitiveness of rare-earth products from China, the US, Russia, and India between 2006 and 2020 using the CMS model and the WRCA index. The results show that (1) the competitiveness of the four countries’ rare-earth products has changed differently. The overall competitiveness of rare-earth products of China, the US, and India has decreased, whereas the competitiveness of Russia’s rare-earth products has increased. (2) The factors inhibiting the development of the competitiveness of rare-earth products in the four countries are different. In China and India they are market factors and product factors, in the US it is the overall market share factor, and in Russia it is the market factor. (3) The competitiveness of rare-earth products varies greatly among the four countries. China has the highest rare-earth export competitiveness, whereas the US has significantly lower export competitiveness of rare-earth products than China. Russia and India do not have comparative advantages. (4) The four countries have different trends in the evolution of the competitiveness of rare-earth products. The export competitiveness of rare-earth products of China and India tends to decline, whereas that of the United States and Russia tends to rise. Based on the above findings, the paper puts forward corresponding policy recommendations.

1. Introduction

Rare-earth products play a pivotal role in modern industry and are widely used not only in traditional industries such as metallurgy, petrochemicals, glass and ceramics manufacturing, but also as an indispensable raw material for the military industry, new-energy industries, and other high-tech industries. However, rare earth resources are not evenly distributed around the world and most countries obtain them through trade. Rare earth is an important raw material for the sustainable development of all countries in the world, and the supply of rare earth is particularly important. Therefore, it is necessary to conduct research on the export of several major rare-earth-supply countries. For a long time, China has occupied the position of the largest rare-earth exporter with its rich reserves of rare-earth resources and advanced extraction and separation technology. In 2012, China’s rare-earth production reached 100,000 tonnes, accounting for 91% of the world’s total output (US Geological Survey), and has a dominant position in the international rare-earth supply chain. However, it is also noted that in recent years, the international-trade market has become increasingly volatile due to the impact of major events such as the Sino–US trade war and the COVID-19 pandemic, and the original supply chain has suffered some impact. which makes finding new supply sources one of the most important pillars of securing supply, and in 2017, the President of the United States issued an executive order titled “Federal Strategy to Ensure the Secure and Reliable Supply of Critical Minerals,” which calls for measures to ensure the security of rare-earth supply in the United States through measures such as deepening trade and investment with international partners. In this context, there is potential for a restructuring of the original rare-earth trade competitiveness pattern, with China’s share of total world output falling from 91% to 58% between 2012 and 2020, and an opportunity for some improvement in the international competitiveness of other countries. For China, the United States, Russia, and India are three competitors with abundant rare-earth resources and high technological capabilities. According to the distribution of the world’s rare-earth reserves published by the U.S. Bureau of Minerals 2022, the three countries ranked fourth, fifth, and seventh, respectively in the world in terms of rare-earth resources reserves in 2021 and have an important position in the global rare-earth market. In addition, all three countries had high rare-earth production and reserves between 2000 and 2020, and, like China, are at the centre of a geopolitical maelstrom. In recent years, the behaviour of these major powers has given rise to a number of turbulent events. Examples include the Sino–Indian Donglang border issue, the US–China Taiwan Strait issue, the US–China trade-friction issue, and the Russia–Ukraine conflict. As a sensitive strategic resource, these events have had varying degrees of impact on the development policies of the rare-earth industry and rare-earth production in various countries. For example, China promulgated the “Several Opinions of the State Council on Promoting the Sustainable and Healthy Development of the Rare Earth Industry” in 2011 to protect China’s rare-earth resources by enhancing industrial concentration and other measures, and in 2008 Putin signed the federal law “Regulations on Foreign Investment in Industries of Strategic Importance to National Defence and Security,“ which prohibits foreign investment in the development and production of special metals and alloys such as rare earths. These policies have affected the global rare-earth supply chain to varying degrees. In the context of the increasingly complex factors affecting the production and export of rare earths and the increasingly fragmented rare-earth-producing areas, a retrospective analysis of the export competitiveness of rare-earth products from China, the US, Russia, and India is useful for gaining a deeper understanding of the status of the four countries in the rare-earth trade, as well as for understanding the evolution of the international competitiveness of rare-earth products in each country.
Due to China’s important role in the supply of rare earths, many scholars have studied the issue of Chinese rare-earth exports in some detail. Sanyal et al. [1] developed a stochastic frontier-modelling approach for the development of gravity of rare-earth trade between China and its trading partners and found that some countries may be substituting China’s rare-earth product exports. Zhang et al. [2] used the Lerner index with a BP neural network and found that a series of rare-earth export policies introduced by China increased the market dominance and price sensitivity of Chinese rare-earth products, verifying the effectiveness of the export policies. Zhü et al. [3] found that China’s best short-term development strategy was to establish a strategic reserve system for rare earths and to improve its technological innovation capacity through the ANP-SWOT approach. Pan et al. [4], through the entropy-power method Ni [5], pointed out that China’s rare-earth products need environmental protection to be strengthened and suffer from overproduction of separated products and insufficient independent innovation. Li [6], in the context of the financial crisis, pointed out that China’s rare-earth industry still suffers from small-scale rare-earth enterprises, poor competitiveness, low market concentration, waste of resources, and serious environmental pollution.
The US was once the world’s largest exporter of rare earths, but less research has been conducted on US rare-earth exports. Goldman [7] reviewed the growth and decline of the US rare-earth industry and highlighted the key role of state support in the development of the industry. Vekasi [8] reviewed the mechanisms by which the dominance of the rare-earth industry shifted from the US to China after 1990 through an extensive study. Islam et al. [9] using a newly developed intelligent calculation tool to assess a realistic view of actual commodity prices for the implementation of several CRM exploration projects and performed backwards calculations to find a feasible price for each project.Some scholars have also analysed the Russian rare-earth industry in some detail. Buynovskiy [10] pointed out that due to the collapse of the Soviet Union, Russia, which has a large number of rare-earth resources, lacks the appropriate extraction technology, resulting in a large number of rare-earth resources not being used effectively, and suggested the establishment of various rare-earth raw-material-processing enterprises to promote the development of the rare-earth industry. Krutov et al. [11] argued that the focus of the Russian rare-earth industry should be on developing high-technology products and stimulating demand for high-technology products and their components, and suggested that the experience of China may be useful in this regard. Gasanov et al. [12] stated that the future direction of rare-earth development in Russia should be the development of new enterprises for the production of consumer rare earths rather than increasing the production of primary products. Cherepovitsyn and Solovyova [13] explored the prospects for the development of the Russian rare-earth industry in the context of the global energy transition based on an extensive literature survey, arguing that the Russian rare-earth industry can contribute to the energy transition and compete with China. Kryukov et al. [14] argued that events such as the COVID-19 pandemic in recent years that have had a negative impact on the trade environment have somewhat cut off the world’s original rare-earth supply chain and promoted the restructuring of the original competitiveness pattern, arguing that Russia, as a country with large rare-earth reserves, should seize the opportunity to shape the competitiveness of its rare-earth industry.
The development of India’s rare-earth industry has meanwhile received some scholarly attention. Chandrashekar and Sundaresan [15] noted that India remains a low-cost supplier of rare earths and argued that the Indian rare-earth industry suffers from a disconnect between the research community and industry and lacks the support of a national strategy that would extend the rare-earth value chain.
Rare-earth trade issues have also been studied from a more international perspective. Ilankoon et al. [16] found that the commercial uncertainty in the rare earth industry and China’s control over the global supply chain of rare earth are the dominant factors affecting the development of the rare earth industry in other countries except China.Chen et al. [17] found through social-network analysis that the scale of rare-earth trade among countries continues to grow, but the vast majority of countries belong to the importing type of rare-earth trade, and the global rare-earth trade has sharp contradictions between supply and demand. Hau et al. [18] used wavelet analysis with quantile nonparametric causality tests to find that in the long run, rare-earth elements are negatively related to China’s trade-policy uncertainty and positively related to US trade-policy uncertainty. Zhou et al. [19], by analysing the responses to the supply constraints of rare earths in the world during the study period, pointed out that changes in the global rare-earth market have reduced the demand for rare earths, leading to a reduction in the dependence of countries on China’s rare earths. Pan [20], using data on China’s rare-earth trade with 18 countries, found that different types of institutional distance have different effects on China’s rare-earth exports: Institutional distance on Freedom from Corruption and Fiscal Freedom have positive effects. In the case of Business Freedom and Trade Freedom, they have a negative impact.
The development and trade of the rare-earth industry in each country has been studied in some depth by the academic community, but studies on the country comparison of the export competitiveness of rare-earth products are still relatively scarce. In order to understand the differences in the competitiveness of rare-earth products in different countries, we need to start from three aspects: (1) What are the characteristics of rare-earth product exports in various countries? This question helps us to understand the different characteristics of the export of rare-earth products in different countries. (2) What role does the competitiveness of each country play in its export value? This question further strips the competitiveness factor from the appearance of the export value so that we can have a deeper understanding of the rare-earth trade of various countries. (3) Is the role of each country’s competitiveness in exports dynamic or static? This question will help us understand the differences in competitiveness changes across countries. To answer the above three questions this paper asks the following three questions: (1) What changes have the four countries’ rare-earth exports undergone during the study period? What are the characteristics of their market structure and commodity structure? (2) To what extent are the fluctuations in the overall and upstream, midstream, and downstream rare-earth product exports of the four countries due to changes in competitiveness? (3) What is the dynamic evolution of the competitiveness of the four countries’ rare-earth products based on the perspective of their overall competitiveness?

2. Data Sources and Research Methods

2.1. Data Sources

The research period of this paper is from 2006 to 2020, covering major events such as the international financial crisis in 2008, the continuous reduction of China’s rare-earth export quota from 2006 to 2010, the abandonment of China’s rare-earth quota policy in 2014, and the US–China trade war in 2018. In this paper, rare-earth products are defined as the four HS codes in the 1992 edition of the Harmonised System codes (HS92): 253090 (Mineral substances; n.e.c. in chapter 25), 280530 (Earth metals, rare; scandium and yttrium, whether intermixed or interalloyed), 284690 (Compounds, inorganic or organic (excluding cerium), of rare-earth metals, yttrium, scandium, or of mixtures of these metals), and 850511 (Magnets; permanent magnets and articles intended to become permanent magnets after magnetisation of metal). Furthermore, this paper divides the rare-earth resource chain into upstream (extraction), midstream (smelting and processing), and downstream (applications), i.e., 253090 is upstream, 280530 and 284690 are midstream, and 850511 is downstream. The data used in this paper, unless otherwise stated, are taken from UN COMTRADE, the United Nations trade database, where China, the United States, Russia, and India are recorded as trading partners in rare earths within the markets studied.

2.2. Research Methodology

2.2.1. CMS Model

The CMS model, or Constant Market Share Model, was first proposed by Tyszynski in 1951. The principle is to decompose the change in a country’s exports over a period of time into structural benefits, competitiveness effects, and second-order effects, on the premise that changes in competitiveness are the only cause of changes in market share. The most widely used version is the one proposed by Jepma [21], whose first- and second-order decomposition is as follows.
First-order decomposition.
q = i j S i j Q i j + i j S i j Q i j + i j S i j Q i j
Structural effects; competitiveness effect; second-order effects.
Second-order decomposition.
Δ q = s 0 Δ Q + i j s i j 0 Δ Q i j i s i 0 Δ Q i + i j s i j 0 Δ Q i j j s j 0 Δ Q j
The growth effect; the market effect; commodity effects.
+ i s i 0 Δ Q i s 0 Δ Q i j s i j 0 Δ Q i j j s j 0 Δ Q j + s Q
Structural-interaction effect; overall-competitiveness effect.
+ i j Δ s i j Q i j 0 s Q 0 + Q 1 / Q 0 1 i j Δ s i j Q i j 0
Specific-competitiveness effects; pure second-order effects.
+ i j Δ s i j Δ Q i j Q 1 / Q 0 1 i j Δ s i j Q i j 0
Dynamic structural surplus.
Here, ∆q denotes the difference between a country’s exports at the beginning and end of the period, i.e., export growth, S = E/Q, where E denotes a country’s exports and Q denotes imports in the target market. s denotes a country’s market share in the target market, i and j represent different commodity i and country j, respectively, and 0 and 1 represent the beginning and end of the period, respectively.
The first-order decomposition of the competitiveness effect into the fifth (overall-competitiveness effect) and sixth (specific-competitiveness effect) terms in the second-order decomposition has generalised the change in export value due to changes in competitiveness in a particular market and the change in export value due to changes in competitiveness in a particular commodity to a specific competitiveness effect, making it impossible for the researcher to distinguish precisely whether the change in export value is due to market factors or commodity factors. To overcome the limitations of Jepma’s CMS model, Sun [22] modified it by further decomposing the specific competitiveness effect into a market competitiveness effect and a commodity competitiveness effect in the following basic form.
Δ q = s 0 Δ Q + i S i 0 Δ Q i s 0 Δ Q + i j s i j 0 Δ Q i j i s i 0 Δ Q i + S Q 0
Growth effects; product-structure effects; market-structure effect; overall-competitiveness effect.
+ i S i Q i 0 S Q 0 + i j S i j Q i j 0 i S i Q i 0 + i j S i j Q i j
Commodity-competitiveness effect; market-competitiveness effect; second-order effect.
The meaning of each term in this formula is shown in Table 1.
Given the greater focus on competitiveness in this study, the modified CMS model of Sun (2007) is used in this paper for the need to explore in more detail the sources that lead to changes in competitiveness.

2.2.2. Weighted RCA Index

In this study, a number of variables reflecting a country’s comprehensive rare-earth international competitiveness is downscaled by the projection-tracing method to obtain comprehensive weights and multiplied with the traditional RCA index to construct the WRCA index, which is modelled as follows.
W R C A i j k = W k R C A i j k
where W denotes the composite weight and i, j, k denote the i-th commodity group, j-th country, and k-th period, respectively. The composite weight W is a measure of a country’s overall competitiveness and is corrected for export volumes accordingly. The acquisition of the traditional RCA index and the composite weights is explained next.
(1)
Traditional RCA Index
The RCA index (revealed comparative-advantage index) was proposed by Balasa (1965) to reflect the comparative advantage of a country’s trade in a particular industry. Its basic form is as follows.
RCA = ( E i / E t ) / W i / W t
This formula represents the ratio of the share of a country’s exports of a commodity in the total value of that country’s exports to the share of total world exports of that commodity. If 0 < RCA < 1, then an industry or product has a comparative disadvantage; if RCA > 1, then an industry or a product of a country has a demonstrated comparative advantage in the international economy.
However, in the context of industrial development relying more on a country’s overall strength and the ever-shortening global value chains, the traditional RCA measurement results have been questioned in a number of ways. Some scholars have pointed out that the original trade statistics suffer from a large amount of double counting, making it so the traditional RCA measurement results do not fully reflect a country’s competitiveness in the trade of various products (Koopman et al. [23]). Moreover, the competitiveness of a country’s rare-earth products also depends on many non-economic factors that are not captured by the traditional RCA index, such as national-level rare-earth industrial-development policies and export-regulation policies (Wübbeke, [24]). In order to overcome the shortcomings of the traditional RCA index, this paper selects a number of indicators related to the overall competitiveness of each country’s rare-earth industry and constructs an evaluation-index system to evaluate the overall competitiveness of a country’s rare-earth industry.
(2)
Competitiveness weights
In this study, the projection-tracing method is used to obtain the competitiveness weights. Projection tracing is a class of statistical methods for processing and analysing high-dimensional data. The basic idea is to project high-dimensional data onto a low-dimensional subspace and find a projection that reflects the structure or characteristics of the original high-dimensional data in order to analyse the high-dimensional data. This study uses this method to transform multiple variables related to the competitiveness of rare-earth products, i.e., p-dimensional data {x(i,j)|j = 1,2,...,p} into one-dimensional data, i.e., competitiveness weights W = {W(1),W(2),W(3),..., W(p)}, where the larger the coefficient of a variable’s prediction vector, the more influential that variable is.
Selection of comprehensive competitiveness indicators
Some scholars have already compared the international competitiveness of the rare-earth industry of various countries based on non-display indicators. For example, Shang [25] compared the international competitiveness of rare-earth products from China, Japan, and the USA through the four indicators of resource base, market control, scientific- and technological-management ability, and industrial environment, with 24 subdivided indicators. Chen [26] compared the international competitiveness of rare-earth products from China and the USA through the three indicators of competitive strength, competitive ability, and competitive potential with 24 subordinate subdivided indicators to compare the international competitiveness of rare-earth industries in China, the United States, and Russia. However, the indicators used in these studies (e.g., national will to develop the rare-earth industry, enterprise-management system and means, etc.) were not measured by international standards, and the data for each indicator were obtained using expert scoring, which is inevitably subjective and lacks practical guidance. In this paper, the international competitiveness of a country is evaluated using 18 indicators in four categories, as shown in Table 2, including rare-earth reserves and production from the US Geological Survey and other data from the World Development Index (WDI).
Projection-tracing modelling process
The projection-tracing modelling process is as follows.
  • a.
    Standardised data
In this study, the data were normalised using the min–max normalisation method with the following transformation function for the series x.
y i = x i min x / max x min x
  • b.
    Selection of projection indicators
For a vector W = {W(1),W(2),W(3),..., W(p)}, the value of the one-dimensional projection of case i in the direction of that W is
Z i = p = 1 p W i X i j
In this paper, we use the Friedman–Tukey projection indicator of the dense projection index, which requires that the projection results require that each projection point of the projection value Zi be densely coalesced into point clusters and that each projection-point cluster be spread out as much as possible, with the following projection objective function.
Q W = S W D W
where S(W) is the standard deviation of the projected values, i.e.,
S W = 1 n j = 1 n z i z ¯ 2
D(W) denotes the local density, with
D W = i = 1 n j = 1 p R r i j f R r i j
where R is the window radius of the local density, which in this study is taken to be that R = 0.1S(w), rij is the inter-sample distance, and f x is the step signal, i.e.,
r i j = z i z j
f x = 0 ,               x < 0 1 ,               x 0
Optimising the direction of projection requires both Wij, so that
max Q W
s . t .     j = 1 p a j 2 = 1
The derived W = {W(1),W(2),W(3),..., W(p)} is the competitiveness weight for this study.

3. Overview of Rare-Earth Exports from China, the US, Russia, and India

The data provided by UN comtrade are problematic due to changes in national statistics and changes in government, such as missing data on rare-earth imports from Afghanistan and North Korea, whereas exports to these countries are still recorded in the data provided by exporting countries. For robustness reasons, the missing data are removed from this paper. Although this reduces the export value of the exporting countries to some extent, the remaining data are considered to be an accurate reflection of the changes in export competitiveness of each country, given that the deleted countries are mainly less-importing countries with low trade volumes and that the data for major rare-earth-importing countries or regions such as Japan, the USA, and the EU, which are more important for rare-earth trade, are still complete and accurate.

3.1. Growth in the Value of Rare-Earth Exports

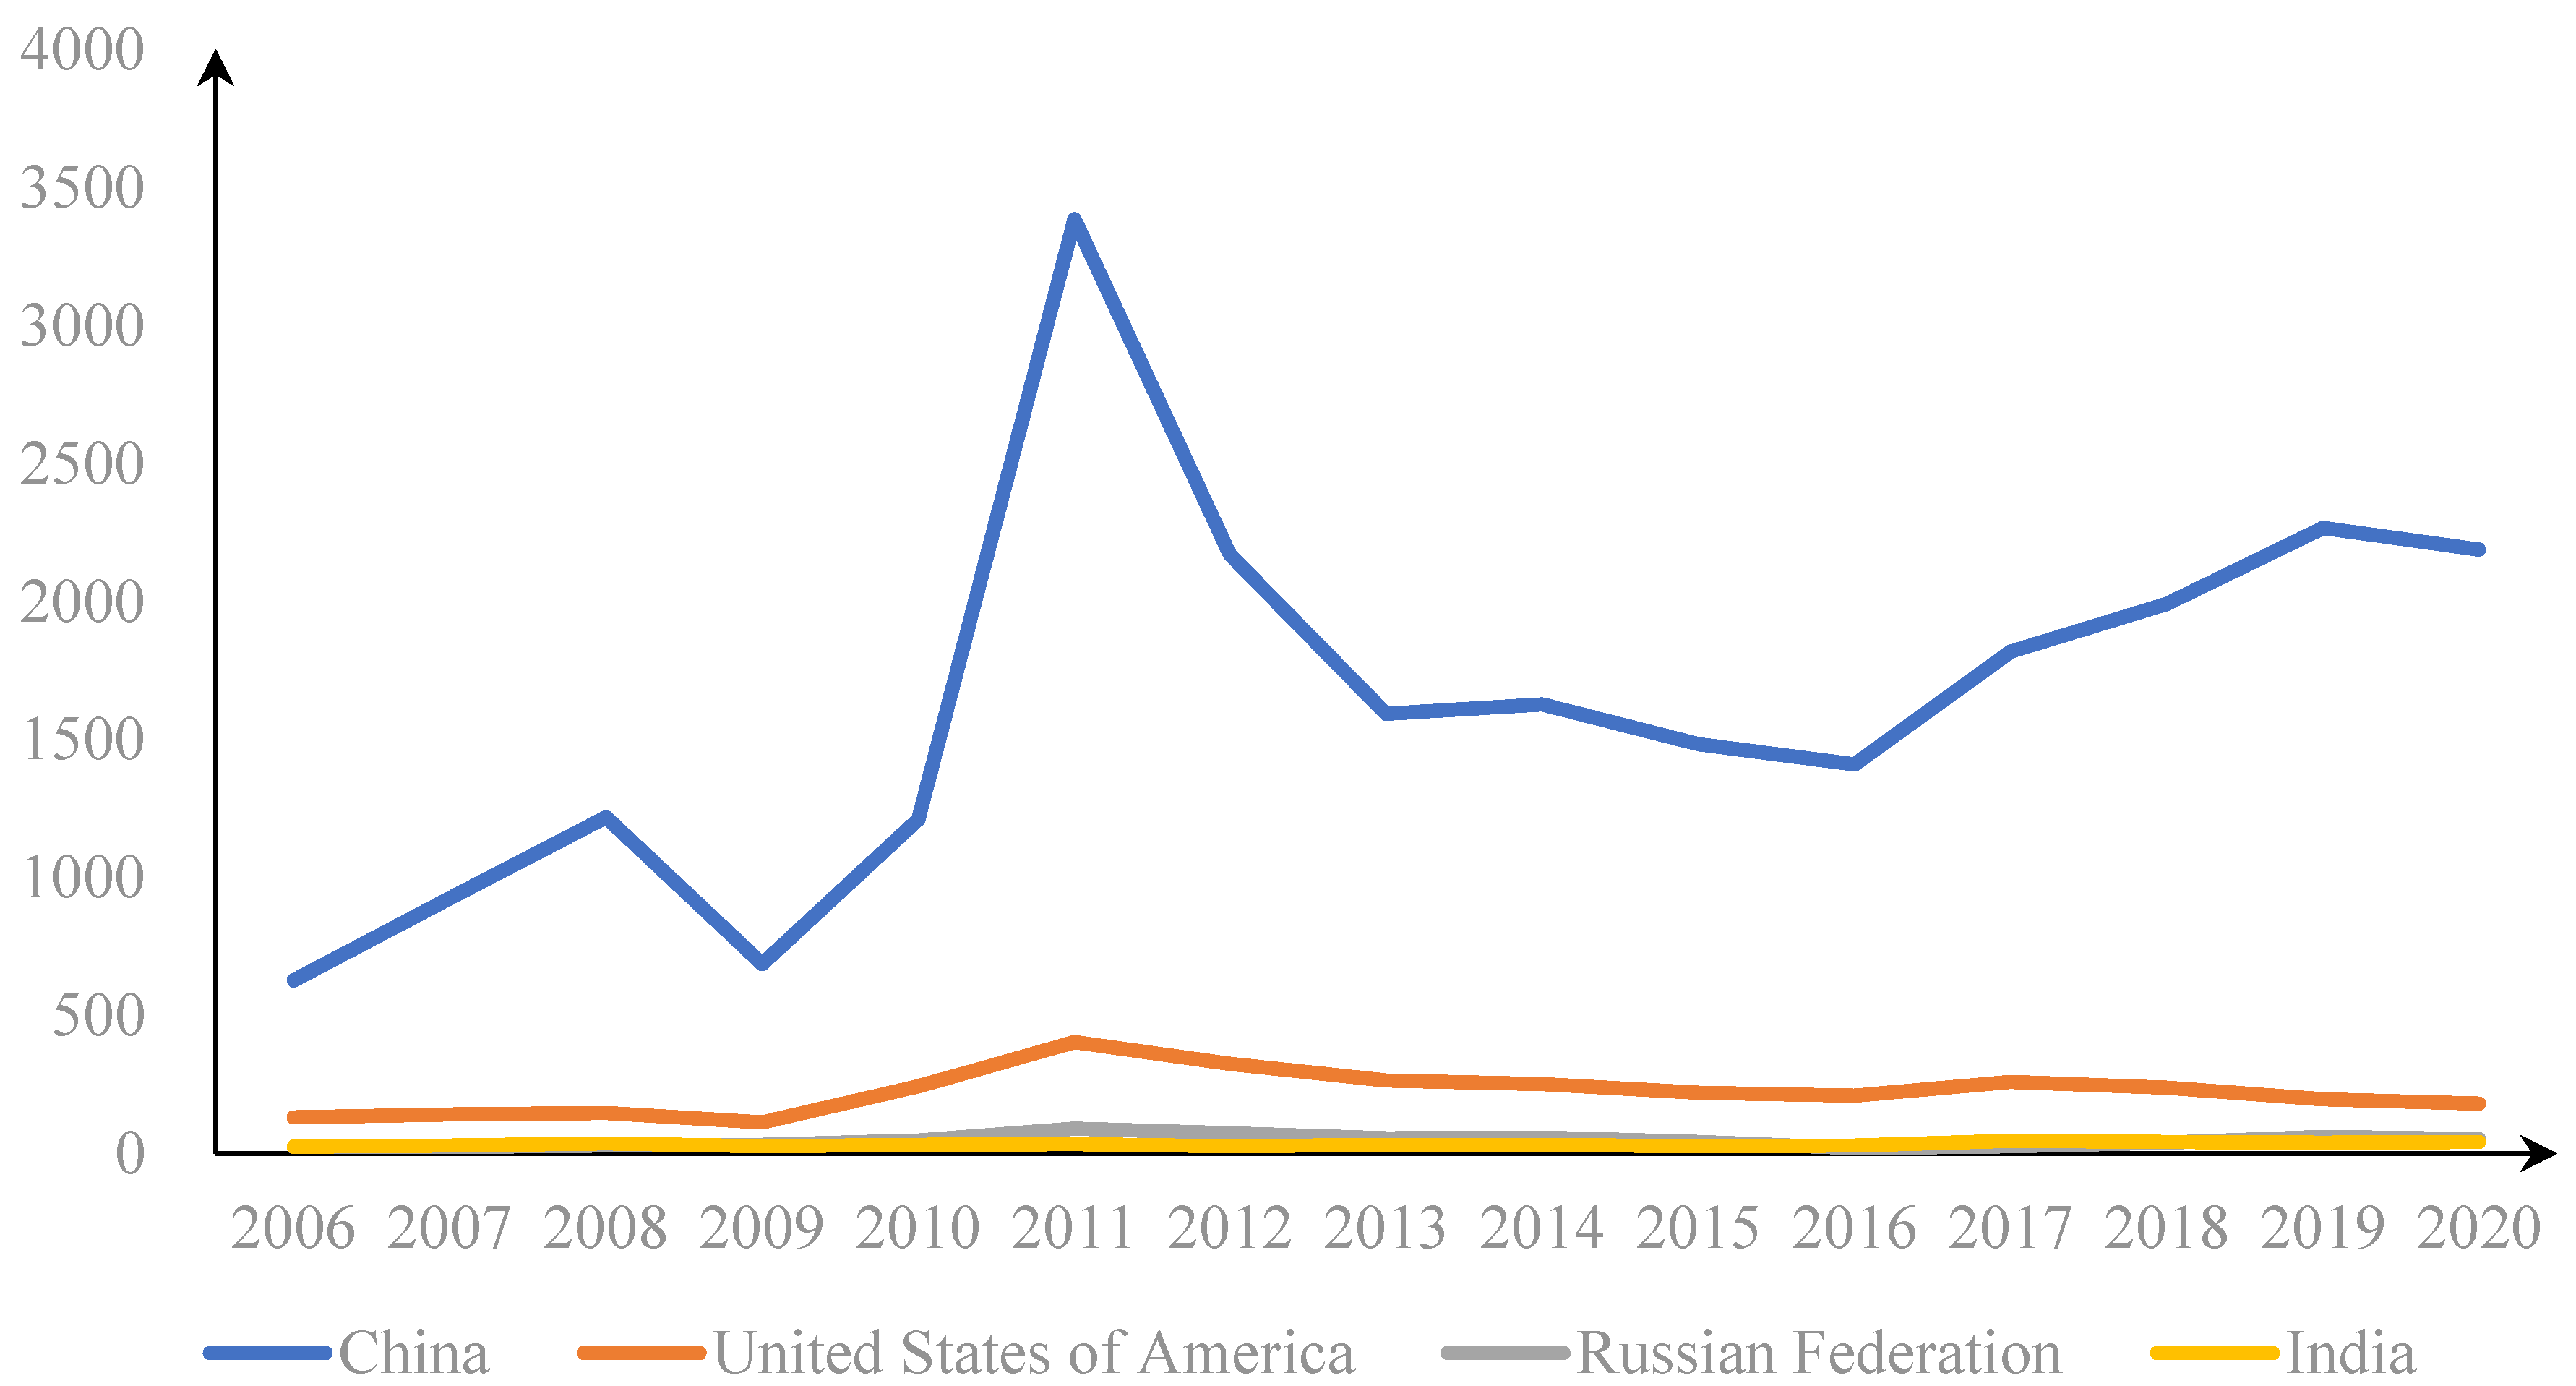
Figure 1 illustrates the value of rare-earth exports by country for the period 2006–2020.
Overall, China has been the world’s largest exporter of rare earths and has a much higher export value than other countries. China’s exports averaged USD 1.64 billion over the study period and the USA had some rare-earth exports, with an average value of USD 221.79 million, slightly higher than Russia and India. Russia and India had relatively small exports, with an average value of USD 44.33 million and USD 32.76 million, respectively.
From a dynamic perspective, it can be seen that.
(1) China’s exports of rare-earth products fluctuated considerably until 2013, after which they gradually levelled off. The development of China’s exports of rare-earth products can be divided into five periods, based on the criteria of whether they share the same development trend. The first period was 2006–2008, when China’s rare-earth exports grew rapidly from USD 627.25 million at the beginning of the period to USD 1.22 billion in 2008, an increase of 194%, despite the Chinese government’s shrinking rare-earth export quotas. The second period was from 2008 to 2009—hit by the international financial crisis, China’s rare-earth exports fell rapidly to USD 685.29 million, almost back to the level of exports in 2006. The third period was 2009–2011. In the first half of the period, 2009–2010, China’s rare-earth exports recovered rapidly as the world industry gradually moved away from the effects of the financial crisis, reaching US$1.21 billion in 2010, returning to pre-financial-crisis levels. In the second half of the period, from 2010 to 2011, against the backdrop of the Diaoyu Islands incident and the Sino–US dispute over the South China Sea, China issued an embargo on rare earths to the US and Japan, which, on the one hand, heightened concerns about the security of rare-earth supplies and, on the other, caused a sharp rise in international rare-earth prices. This represents a 280% increase compared to 2010. The fourth phase, from 2011 to 2016, saw a rapid decline in China’s rare-earth exports in the first half of the period, before slowing down and levelling off in the second half. During this period, exports declined from their peak to USD 1.41 billion at the end of the period. The fifth period, 2016–2020, saw a steady and relatively rapid development in the value of China’s rare-earth exports, which peaked at USD 2.27 billion in 2019 before declining by 3.5% to reach USD 2.19 billion in 2020, although the slight decline did not affect the overall upward trend.
(2) US rare-earth exports followed a similar “flat–rapidly rising–falling” course to that of China. Based on the same division, US rare-earth exports can be divided into six periods. The first period, 2006–2008, saw a slight increase in the value of US rare-earth exports from USD 131.38 million at the beginning of the period to USD 147.78 million. The second period, from 2008 to 2009, saw a rapid decline in US rare-earth exports to USD 112.3 million as a result of the economic crisis. The third period was from 2009 to 2011. Against the backdrop of the international economic recovery and the Chinese rare-earth embargo, US rare-earth exports were significantly exported, reaching USD 403.42 million at the end of the period, an increase of 360%. In the fourth period, 2011–2016, rare-earth exports declined rapidly to USD 209.53 million, a 50% decrease from the beginning of the period. During the fifth period, 2016–2017, US rare-earth exports increased somewhat, reaching USD 259.97 million in 2017. The sixth period, from 2017 to 2020, saw a continued decrease in the value of US rare-earth exports during this period, shrinking to USD 181.62 million in 2020.
(3) The export value of Russian rare-earth products has gone through a process of “up–down–up again–down again” and can be divided into four periods overall. The first period was from 2006 to 2011. During this period, Russia’s exports of rare-earth products grew relatively slowly from 2006 to 2009, from USD 22.01 million to USD 32.28 million, and then rapidly from 2009 to 2011, to USD 89.81 million in two years, an increase of 279%. In the second period, from 2011 to 2016, exports of rare earths were on a rapid downward trend, except for a small increase from 2013 to 2014, and fell to USD 19.3 million at the end of the period, reaching the lowest point in the study period, and in the third period, from 2016 to 2019, exports of Russian rare-earth products began to grow again, rapidly increasing from USD 19.3 million at the beginning of the period to USD 60 million in 2019, an increase of 300%. In the fourth period, from 2019 to 2020, exports contracted to USD 51.04 million at the end of the period.
(4) India’s exports of rare-earth products fluctuated most dramatically and can be divided into three periods overall. India’s exports of rare-earth products showed an almost sawtooth waveform between 2006 and 2015, rising from USD 24.32 million to USD 35.44 million between 2006 and 2008, then falling rapidly to USD 24.83 million in 2009 before rebounding to USD 34.90 million in 2011, and falling to USD 26.95 million in 2012 before rebounding to USD 32.35 million in 2014 and then falling again to USD 25.53 million in 2015. This paper divides the above volatile years into one period. The second period is from 2015 to 2017, during which India’s rare-earth exports grew rapidly to USD 45.79 million at the end of the period, an increase of 179%. The third period is from 2017 to 2020, when India’s rare-earth exports decline overall, with only a small increase from 2019 to 2020. Exports contracted to USD 41.11 million at the end of the period.

3.2. Market Structure of Rare-Earth Exports by Country

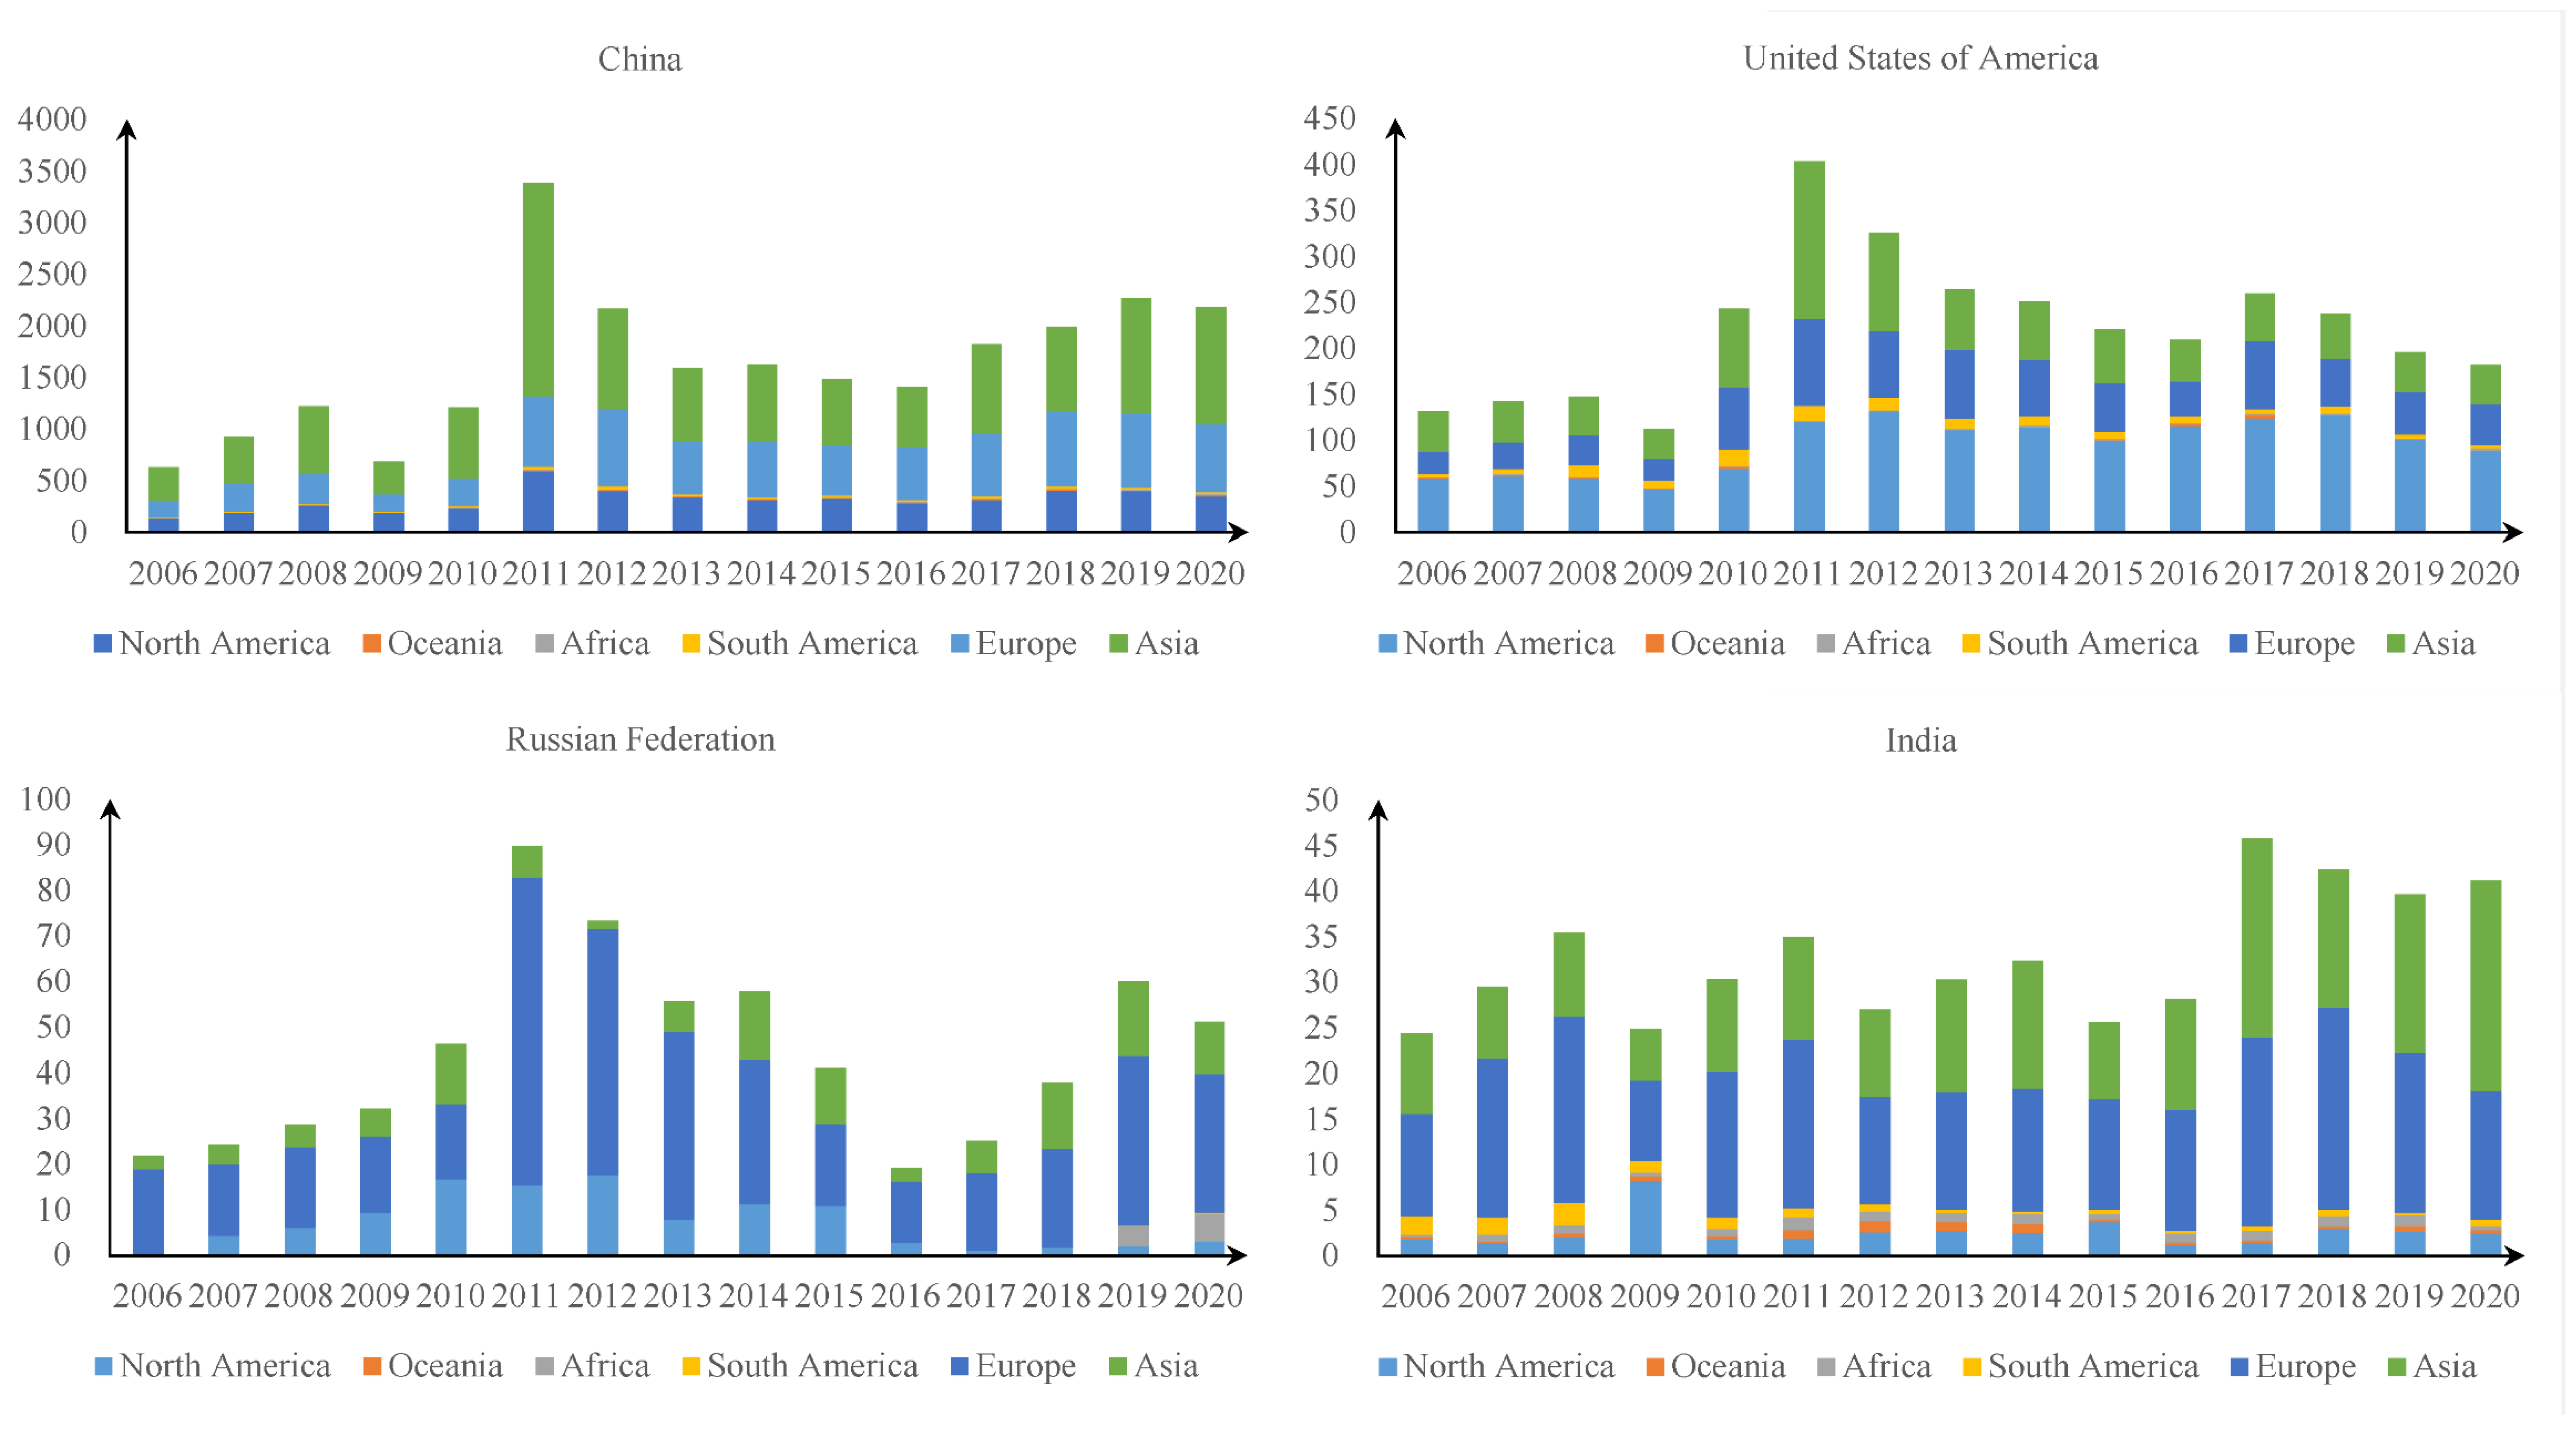
Figure 2 illustrates the market structure of rare-earth exports by country, and an analysis of the period breakdown described in 3.1 shows the following.
(1)
China
Overall, Asia, Europe, and North America are the main export markets, with the three markets accounting for an average of 48.40%, 29.94%, and 19.98% of exports, respectively. South America, Africa, and Oceania account for a smaller share, with an overall average share of only 1.69% for the three markets. In a dynamic perspective, during the first period of growth, among the major markets, Asia contributed the most to the growth (USD 334.54 million), followed by Europe (USD 124.56 million) and then North America (USD 121.06 million). At the same time, the African, Oceanian, and South American markets also grew to some extent. In the second period, the share of exports shrank in all three main markets, with the largest decrease being in Asia (USD −338.26 million), with a decrease of almost 50%. This was followed by Europe, with a decrease of USD −116.74 million. The North American market had a smaller share of the decrease, at –USD 74.06 million. In addition, the African, Oceanian, and South American markets were also negatively affected to some extent. In the third period, three of the main export markets, particularly Asia, experienced very significant growth. Compared to the beginning of the period, exports to the Asian market increased by USD 1.38 billion in 2011, or 300%. The European market contributed the second highest growth (USD 507.12 million), with a 400% increase, the highest of the three main markets. The North American market also grew rapidly, with a growth of USD 405.27 million, or 320%. Other secondary markets also saw some growth. In the fourth period, exports to Asia declined significantly, with exports to this market falling by 73% to USD 588.09 million at the end of the period. Exports to Europe, on the other hand, were more stable, decreasing by 25% to USD 170.87 million, the smallest of the major markets. The North American market decreased by 52% to USD 306.68 million. In the final period, Asia continued to contribute the largest growth (USD 545.7 million), with Europe also showing some growth (USD 154.86 million). The North American market was more stable, with a growth of USD 70.53 million. Other markets also remained stable. There are two possible reasons for the state of China’s market structure. One is that China is the largest rare-earth exporter in Asia, and the lower transaction costs brought about by the closer distance make the Asian rare-earth market more favoured from China. Second, China is also the largest exporter of rare-earth products, and the strong demand for rare-earth products in the high-end manufacturing industries in North America and Europe has promoted North America and Europe to occupy a more important position in China’s export-market structure.
(2)
United States
Overall, the main export markets for the USA are North America (43.84%), followed by Europe and Asia with similar shares (23.20% and 27.79%). Oceania, Africa, and South America account for a smaller share (5.18% in total). In the first period, exports to the North American market remained stable (+USD 0.3 million), exports to the Asian market decreased slightly (−USD 1.16 million), whereas growth in exports to the European (USD 7.67 million) and South American markets (USD 9.04 million) were the main sources of growth in exports during the period. In the second period, US exports to all markets declined. The Asian market contributed the largest increase in exports in the third period, followed by the European market and then the North American market. In the subsequent periods, exports to North America fluctuated around USD 100 million and remained relatively stable. The European and Asian markets, on the other hand, were more volatile and went through a process of “down–up slightly–down again” in the last three periods. Meanwhile, exports to other markets generally showed a downward trend over the last three periods. For the North American rare-earth market, importing rare earths from the closer US can provide significant cost savings, and European and Asian manufacturing demand for rare earths may shape the structure of the US market for rare-earth products.
(3)
Russia
The European market is the main export market for Russia, with an average share of 62.28% of Russian rare-earth exports. The Asian and North American markets have similar export values (20.26% vs. 16.10%), whereas Africa (1.32%), Oceania (0.00%), and South America (0.05%) have lower market shares. From a dynamic point of view, within the four periods of change in Russian rare-earth exports, exports to the European market rose significantly in the first period, reaching USD 67.39 million in 2011, an increase of USD 44.8 million compared to the beginning of the period. In the second period, exports to the European market declined slowly, reaching a low of USD 13.58 million in 2016 before rising again and declining again in the fourth period. Exports to North America rose slowly in the first period, fluctuated in the second period, and remained stable at a lower level in the third and fourth periods. Exports to the Asian market were more volatile, with a low of USD 1.76 million in 2012 and a high of USD 16.28 million in 2019, and notably in Africa, where the share of exports in total exports jumped to 7.65% in 2019 and 2020 and grew rapidly to 11.95% in 2020. Russia has a long-term resource-cooperation relationship with Europe. The maturity of this trade has made the European market occupy a major position in Russia’s export structure. In addition, Russia also has certain geographical advantages to promote exports to Asia.
(4)
India
The European (46.89%) market is India’s main export market, and Asia (36.80%) comes next. The North American market (8.80%) holds some size, with other markets accounting for a smaller share. Dynamically, exports to the European market are more volatile and fluctuate significantly, except for 2012 to 2016, when they remained stable at around USD 13 million. Exports to the Asian market, on the other hand, showed a fluctuating upward trend, reaching USD 22.97 million after 2019, surpassing the European market as India’s main export market. Exports to North America have remained stable at around USD 2.5 million, except for 2009, when they jumped to USD 8.28 million, making it India’s second-largest export market. Exports to Africa, Oceania, and South America have been less volatile and have remained stable at lower levels. Located in the Asian subcontinent, India has more convenient shipping conditions and a better geographical location, which enables it to save more costs in exporting rare earths to Asia and Europe. This factor may be the reason for the formation of its market structure.
Figure 2. Export-market structure of rare-earth products from China, the US, Russia, and India.
Sustainability 14 12358 g002

3.3. Commodity Structure of Rare-Earth Exports by Country

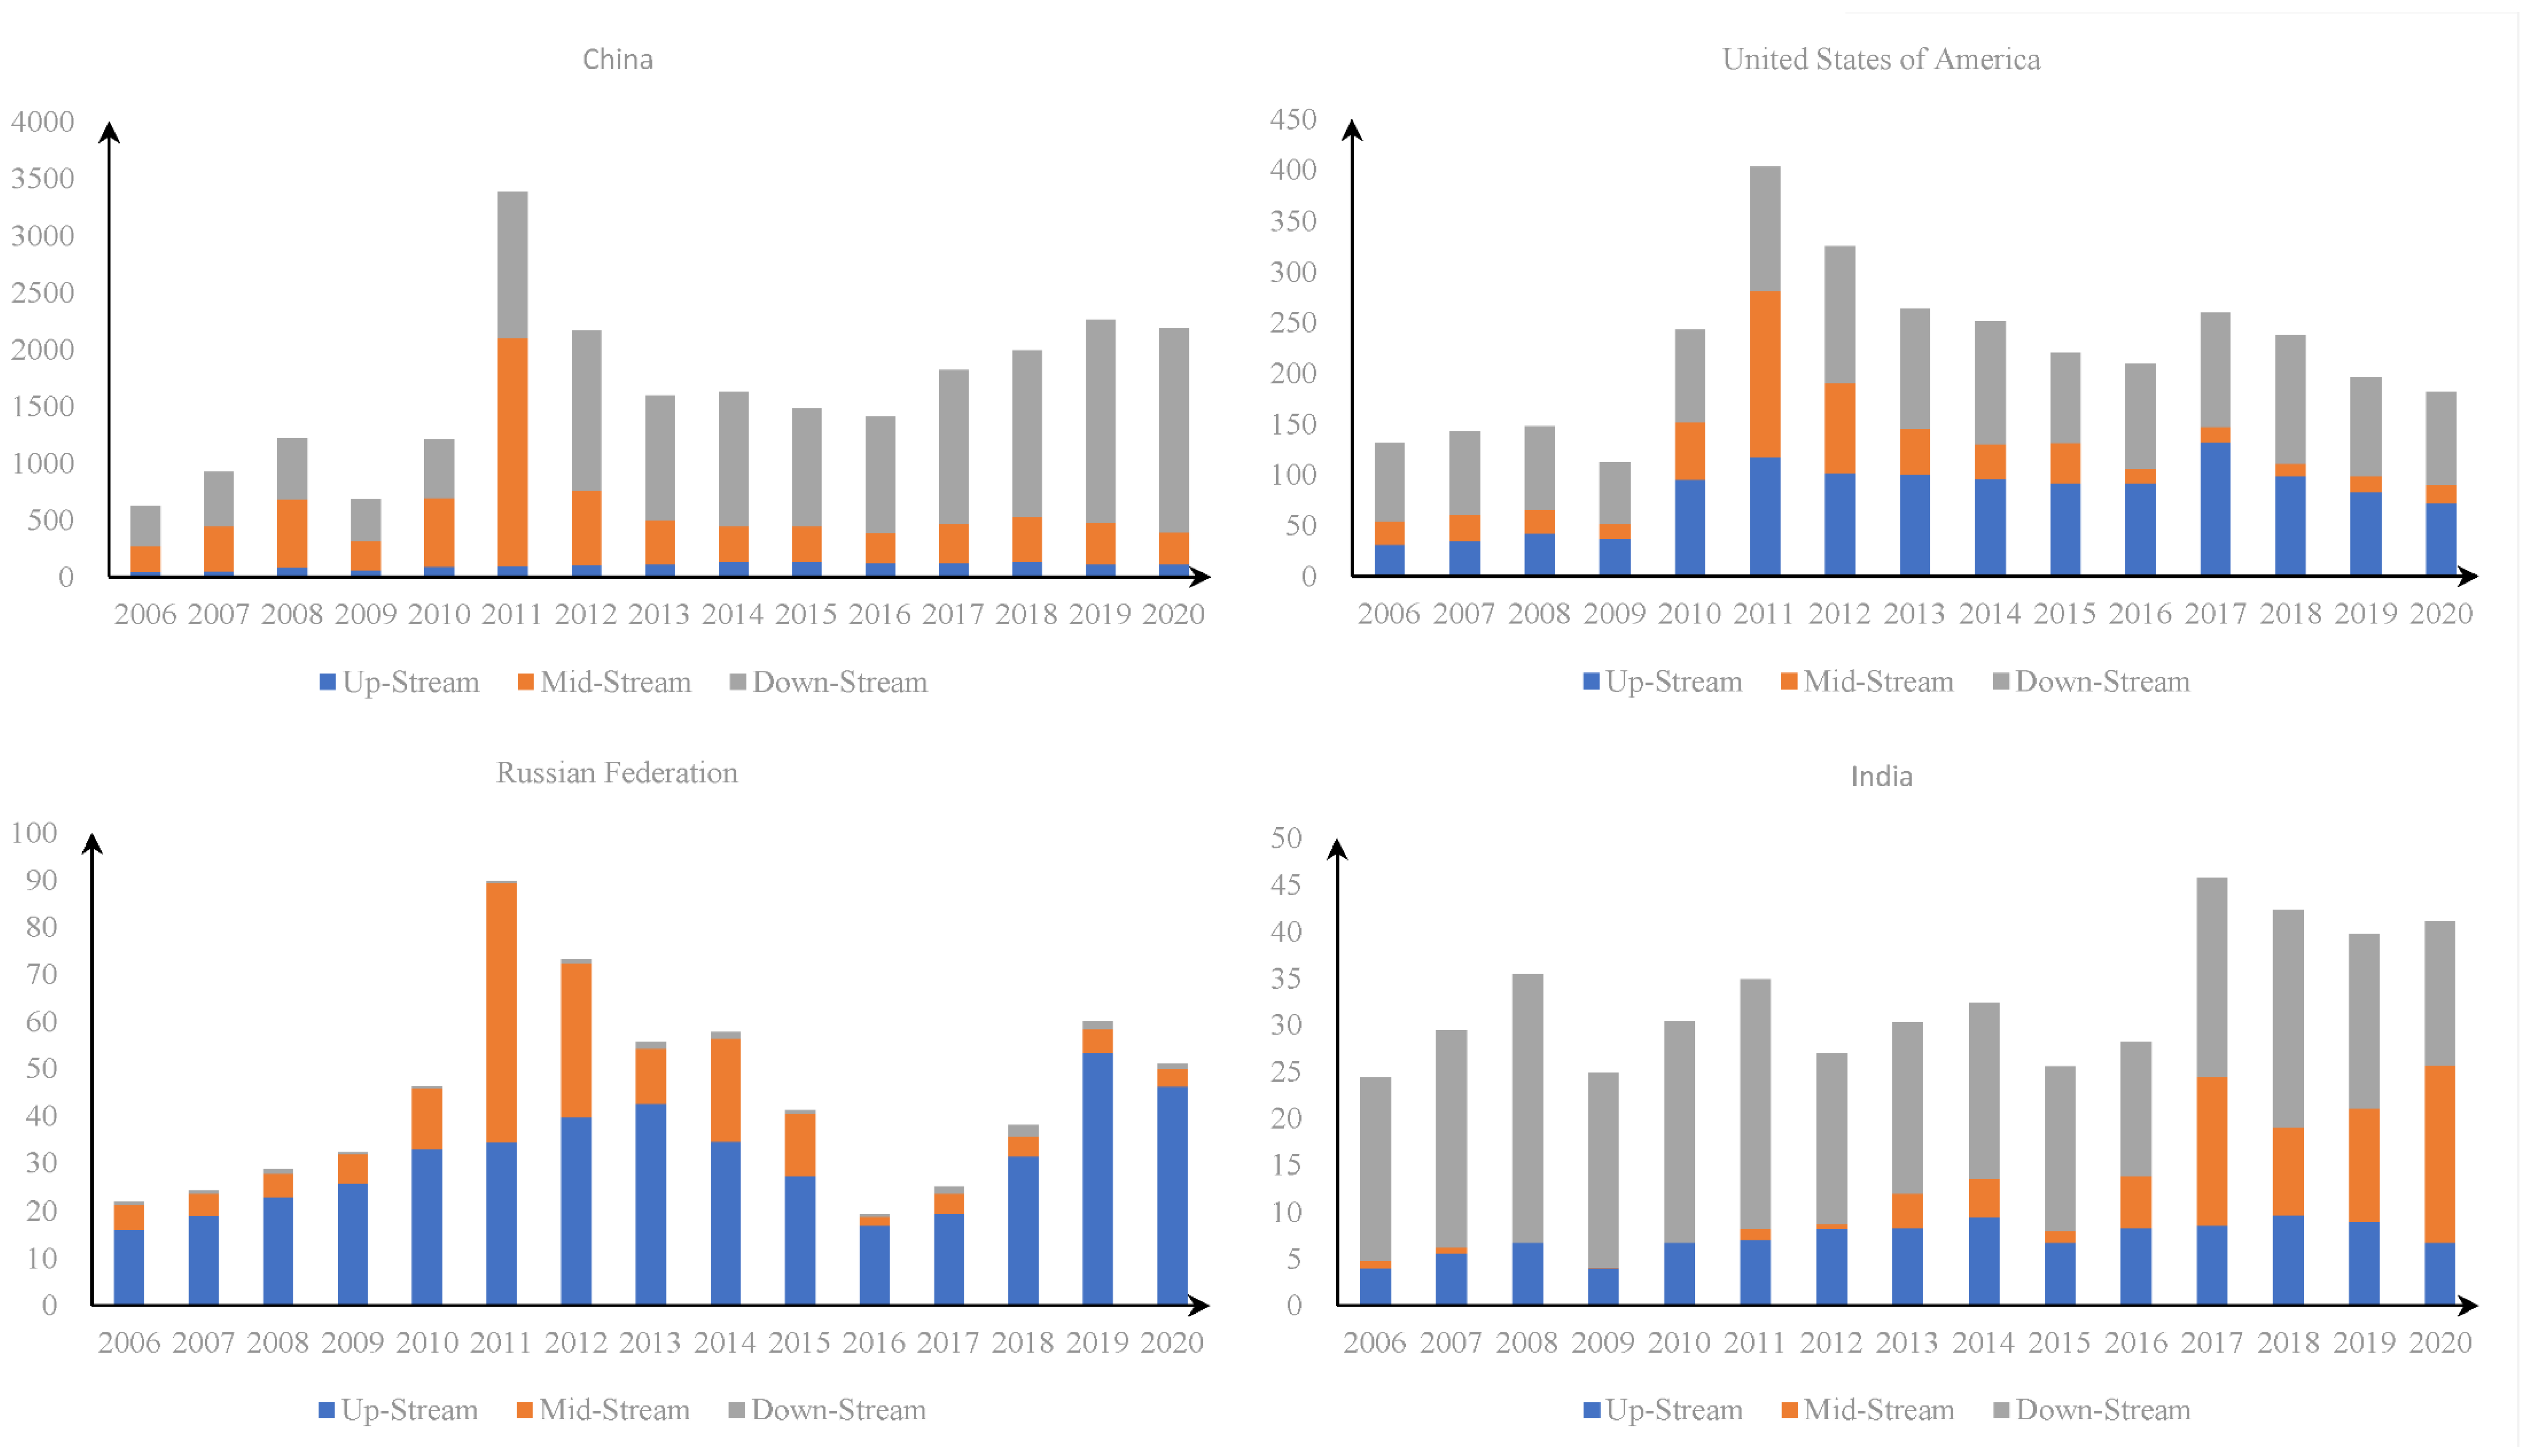
Figure 3 illustrates the commodity structure of rare-earth exports by country, from which the following can be seen.
(1) China: The most important export products are downstream products, with some exports in the midstream and to a lesser extent in the upstream.
From a dynamic point of view, downstream products generally showed an upward trend during the study period, with a stable growth rate in all years except for the second period, when exports fell due to the economic crisis, and the fourth period, when the rare-earth trade market became less hot. China’s exports of midstream products fluctuated more between the first and third periods, growing more rapidly in the first period, then declining in the second period due to the economic crisis, growing very rapidly in the third period, and finally declining and stabilising at around USD 270 million in the fourth period, but overall, midstream products were in a less important position in China’s exports of rare-earth products. Upstream exports accounted for a smaller proportion of total exports, but they still showed a slow upward trend until 2018 and then slowly declined. The maximum value of upstream rare-earth-product exports was USD 135.02 million in 2018, an increase of USD 86.18 million from USD 48.84 million in 2006. Overall, the main commodity driving the growth of China’s rare-earth-product exports was downstream rare-earth products. The formation of China’s commodity structure may come from two factors: First, China has relatively advanced rare-earth-processing and -refining technologies, which gives China a relatively strong comparative advantage in midstream and downstream rare-earth products. Second, China has strict restrictions on rare-earth mining, which makes it impossible for Chinese rare-earth production enterprises to mine unrefined rare-earth mines as the main source of profit.
(2) US: Upstream and downstream products are its main export commodities.
US upstream rare-earth products saw modest growth overall in phases I and II, accelerated significantly in phase III, and reached USD 122.41 million in 2011 before trending slowly downward and returning to a downward trajectory in 2017 after regaining growth. US downstream exports follow a similar path to upstream exports, growing slowly in the first period and increasing significantly in the third period, before maintaining a volatile and declining trend after 2012. US midstream rare-earth products, on the other hand, have remained low in all years except for the third period, when they grew rapidly, and then declined rapidly in the fourth period. Overall, the growth of US rare-earth-product exports relied heavily on upstream and downstream products, with midstream products also playing a role in specific years. The possible reasons for the U.S. commodity structure are as follows. The U.S. has a relatively advanced high-end manufacturing industry, which gives the owners of products such as rare-earth permanent magnets a strong comparative advantage. However, the U.S. lacks better rare-earth extraction and separation technologies. This makes the US’s midstream and downstream products also occupy a larger part of its export structure.
Figure 3. Commodity structure of rare-earth exports from China, the US, Russia, and India (in USD million).
Sustainability 14 12358 g003
(3) Russia: Upstream products are the mainstay, complemented by midstream products, whereas downstream products account for a very small proportion of exports.
Russia’s upstream rare-earth products maintained an upward trend from 2006 to 2013, with exports of upstream products increasing from USD 16.12 million at the beginning of the period to USD 42.60 million at the end of the period, then declining to USD 16.92 million in 2016 before rising again and declining after 2019. Midstream products accounted for a relatively small proportion of exports but contributed significantly to export growth over a given period. Between 2010 and 2011, Russian exports of midstream rare-earth products increased by USD 42 million, or 424%. After that, exports of midstream products slowly declined and stabilised after 2017 at around USD 4.5 million. Downstream rare-earth products, on the other hand, remained stable at around USD 1.0 million. Overall, the growth of Russian rare-earth exports was largely dependent on upstream products. The possible cause of Russia’s export-commodity structure is that Russia lacks advanced manufacturing or processing technology, which places Russia’s export-commodity structure mainly in the middle and upstream rare-earth products, whereas the downstream rare earth products only account for a small part.
(4) India: Downstream products are its main export products.
With the exception of a steady decline from 2012 to 2015, India’s downstream rare-earth products generally showed a fluctuating downward trend during the study period, with exports of downstream products at USD 15.41 million in 2020, a decrease of USD 4.12 million from USD 19.53 million in 2006. India’s midstream rare-earth products remained steady at a low level until 2012, and began a fluctuating in an upward trend after 2012 and replaced downstream products as the most important export commodity in 2020. India’s upstream rare-earth products were the next-most-important export commodity until 2016 and maintained a slow upward trend until 2018, but after 2018 exports of this commodity began to slowly decline and fall to USD 6.72 million in 2020. Overall, India’s rare-earth-product export growth is largely dependent on midstream products. India is a country with growing scientific and technological strength. Its higher export of downstream products may be due to the continuous progress of its manufacturing industry, and its rare-earth extraction and separation technology may also be the reason for the continuous increase in the export value of its midstream products in recent years.
This section analyses the changes in the export value and market structure of rare-earth products from China, the US, Russia, and India, and the commodity structure, as a response to research question one.

4. CMS Model and WRCA Index Analysis Results

4.1. CMS Decomposition Results and Analysis

4.1.1. Overall Decomposition Results of the 1CMS Model

Table 3, Table 4, Table 5 and Table 6 show the breakdown of rare-earth-product exports from China, the US, Russia, and India, and this paper will focus on the competitiveness component. The following can be seen.
(1) The competitiveness effect had a limited role in the value of China’s rare-earth exports.
During the period of export growth from 2006 to 2008, the factors driving export growth were mainly second-order effects, whereas the competitiveness effect contributed 23.42% to export growth, which was less than the second-order and structural effects, and played a limited role in driving export growth, with the overall-competitiveness effect contributing 34.33% and the product competitiveness effect (−6.10%) and the market competitiveness (−7.93%) having a negative contribution rate. This indicates that the overall competitiveness of China’s rare-earth products improved over the period, but that this improvement was the result of faster growth in the competitiveness of a few commodities rather than a balanced growth in the competitiveness of all commodities. The growth rate of competitiveness for most commodities was lower than the overall growth rate, and the growth rate of competitiveness in specific markets was lower than the overall growth rate, i.e., the uneven development of competitiveness across products and markets inhibited further improvement in the competitiveness of China’s rare-earth products. In the second period, the factor that had the greatest impact on the decrease in exports was the structural effect (87.96%). The competitiveness effect (19.62%) was the next most important. In terms of breakdown, the overall-competitiveness effect (21.41%) accounted for the largest share of the overall-competitiveness effect, followed by the market-competitiveness effect (8.83%), whereas the product-competitiveness effect hedged the loss by −10.62%, indicating that the decline in overall commodity competitiveness in the overall market was one of the important reasons for the decline in export value during this period, whereas the increase in product-specific competitiveness prevented the further decline in export value to some extent. The increase in the competitiveness of specific products somewhat prevented a further decline in exports. In the third period, the competitiveness effect was more limited, contributing only 0.05% to the export value, of which the overall competitiveness effect contributed 12.62%, indicating that the increase in China’s market share in the world’s total rare-earth imports to some extent led to an increase in export value, but due to the negative effect of product competitiveness (−8.72%) and market competitiveness (−3.85%), the competitiveness effect was somewhat weakened. The low competitiveness effect in this period is the result of the uneven development of the competitiveness of different goods in different markets. In the fourth period, the competitiveness effect declined further, contributing 32.74% to the value of exports, with the overall-competitiveness effect making the highest contribution at 37.11% and the product-competitiveness effect the next highest at 14.57%. The market-competitiveness effect, on the other hand, prevented a further fall in exports, with a contribution of −18.94%. The competitiveness effect picked up in the final fifth period, with a contribution of 13.17%, with the overall-competitiveness effect having the greatest impact (46.77%), but the product-competitiveness effect (−14.30%) and the market-competitiveness effect (−19.30%) inhibiting further growth in exports. Overall, the overall-competitiveness effect on export value is mainly related to the direction of export-value growth in the current period, whereas product competitiveness and market competitiveness mainly played a hindering role on rare-earth exports. In the CMS model, changes in export competitiveness are mainly measured through changes in market share. The reason why the competitiveness effect had a limited impact on the value of China’s rare-earth-product exports is that the Chinese rare-earth industry has developed over many years and the market has become saturated. Unless new sources of competitiveness such as technological innovation emerge, it is difficult to further increase its market share, and the infrequency of events that can significantly increase competitiveness may be the main reason for the limited role of the competitiveness effect on China’s rare earths.
Table 3. Decomposition results of China’s exports of rare-earth products (in USD million).
Periods Export GrowthGrowth EffectsCommodity EffectsMarket EffectsOverall-Competitiveness EffectProduct-Competitiveness EffectMarket-Competitiveness EffectSecond-Order Effects
2006–2008Absolute values591.37342.6613.01−188.39203.00−36.05−46.87304.02
Contribution rate100.00%57.94%2.20%−31.86%34.33%−6.10%−7.93%51.41%
2008–2009Absolute values−533.33−462.49−42.10−4.66−114.1856.65−47.1080.55
Contribution rate100.00%86.72%7.89%0.87%21.41%−10.62%8.83%−15.10%
2009–2011Absolute values2700.631863.29753.38−140.20422.91−300.34−145.09246.68
Contribution rate100.00%68.99%27.90%−5.19%15.66%−11.12%−5.37%9.13%
2011–2016Absolute values−1976.66−1351.17−85.39−409.18−744.32−58.92−27.91700.21
Contribution rate100.00%68.36%4.32%20.70%37.66%2.98%1.41%−35.42%
2016–2020Absolute values778.23340.62129.54−509.92404.86−122.13−406.46941.72
Contribution rate100.00%43.77%16.65%−65.52%52.02%−15.69%−52.23%121.01%
Source: author’s calculations.
(2) The competitiveness effect had a certain amount impact on fluctuations in the value of US exports.
In the first period, the competitiveness effect had a 24.39% impact on export value, with an overall-competitiveness contribution of −176.58%, product competitiveness of 48.41%, and market competitiveness of 103.78%, indicating that although the decline in the overall competitiveness of US rare-earth products led to a significant drop in export value during the period, the balance of competitiveness between products, and especially between markets, offset the decline and brought the overall contribution of competitiveness to a positive value. This decline was offset by the development of a balance between products, particularly between markets, and the overall contribution of the competitiveness effect was positive. In the second period, the competitiveness effect recovered USD 14.52 million in exports, with the overall competitiveness contribution reaching −85.86%, but product competitiveness and market competitiveness contributing 26.05% and 18.89%, respectively, to the decline in exports. This indicates that the overall competitiveness of US rare-earth products improved during this period, but the competitiveness effect was less effective in offsetting the decline in exports due to a decline in the competitiveness of specific commodities and markets. In the third period, the competitiveness effect had a positive effect on export value, but the contribution was low at 8.50%, with the overall-competitiveness effect contributing −4.25%, the product-competitiveness effect 10.93%, and the market-competitiveness effect 1.82%. The competitiveness of US rare-earth products declined overall during the period, but the development of product-specific and market-specific competitiveness resulted in a positive competitiveness effect on export values. In period four, the competitiveness effect caused a 19.14% decline in competitiveness, with the overall-competitiveness effect (−1.79%) having a somewhat dampening effect on the decline in export value, whereas the market-competitiveness effect (17.29%) contributed the largest decline in export value. In period 5, the competitiveness effect made a more significant contribution to export value at 49.06%, with the overall-competitiveness effect reaching 54.75%, the largest of the three competitiveness effects, followed by the market competitiveness (14.11%), whereas the product-competitiveness effect (−19.80%) had a dampening effect on export value. In the sixth period, the competitiveness effect had a significant impact in reducing the export value with a contribution of 68.41%, of which the overall-competitiveness effect reached 112.44% and was an important factor in the decrease in the export value, the product-competitiveness effect was 0.15% and affected the export value to some extent, and the market competitiveness had a positive effect on the export value with a contribution of −44.18%. It can be seen that the competitiveness of rare-earth products in the United States was not always rising. In some periods, product competitiveness brought considerable losses to the export of rare earths in the United States. The reason for this phenomenon may be that the rare-earth industry in the United States is still in the development stage. Compared with China, which has a relatively mature industrial chain, it lacks stability when it is impacted by the external market or internal environment. Even in the face of strong external shocks such as the 2008 economic crisis, the changes in competitiveness effects were less dramatic.
Table 4. Decomposition results of US exports of rare-earth products (in USD million).
Periods Export GrowthGrowth EffectsCommodity EffectsMarket EffectsOverall-Competitiveness EffectProduct-Competitiveness EffectMarket-Competitiveness EffectSecond-Order Effects
2006–2008Absolute values16.4054.84−7.07−9.33−31.689.8618.03−18.25
Contribution rate100.00%334.37%−43.12%−56.88%−193.15%60.12%109.93%−111.26%
2008–2009Absolute values−35.48−54.676.267.7330.46−9.24−6.70−9.32
Contribution rate100.00%154.10%−17.66%−21.79%−85.86%26.05%18.89%26.26%
2009–2011Absolute values291.12357.77−42.31−26.13−12.3731.825.30−22.97
Contribution rate100.00%122.90%−14.53%−8.98%−4.25%10.93%1.82%−7.89%
2011–2016Absolute values−193.89−191.2411.8568.453.47−7.06−33.52−45.84
Contribution rate100.00%98.63%−6.11%−35.30%−1.79%3.64%17.29%23.64%
2016–2017Absolute values50.4420.169.39−7.2927.62−10.017.123.44
Contribution rate100.00%39.98%18.62%−14.45%54.75%−19.8%14.11%6.82%
2017–2020Absolute values−78.3414.004.24−33.24−88.09−0.1234.61−9.75
Contribution rate100.00%−17.87%−5.41%42.43%112.44%0.15%−44.18%12.44%
Source: author’s calculations.
(3) The competitiveness effect was more significant on the value of Russian exports.
In the first period, the contribution of the overall-competitiveness effect reached 18.11%, with the overall-competitiveness effect (19.16%) and the product-competitiveness effect (10.25%) having a more significant impact, whereas the market-competitiveness effect (−11.30%) reduced the export value. In the second period, the competitiveness effect contributed −25.03%, with the most significant negative effect being the overall competitiveness effect (−27.95%), followed by the market-competitiveness effect (−14.41%) and the product-competitiveness effect (17.33%) mitigating the decline in exports. In the third period, the competitiveness effect was the main reason for the increase in exports, with the overall-competitiveness effect (85.55%) having the most significant impact and the product-competitiveness effect also having some impact. The market-competitiveness effect (−8.94%) had a dampening effect on export growth. In the fourth period, the competitiveness effect was the main factor behind the fall in exports, with the market-competitiveness effect (70.94%) being the most significant, followed by the overall-competitiveness effect (60.96%), and the product-competitiveness effect (−39.05%) contributing to the increase in exports. Russia’s rare-earth export volume is relatively small, which may make its export value more sensitive to competitiveness effects. At the same time, Russia also needs to compete with major rare-earth-producing countries such as China and the United States, which makes it more difficult to occupy more market share and export Russian rare-earth products, which is probably why the competitiveness effect has a more pronounced effect on Russian exports.
Table 5. Decomposition results of Russian exports of rare-earth products (in USD million).
Periods Export GrowthGrowth EffectsCommodity EffectsMarket EffectsOverall-Competitiveness EffectProduct-Competitiveness EffectMarket-Competitiveness EffectSecond-Order Effects
2006–2011Absolute values67.8072.18−17.560.9512.996.95−7.66−0.06
Contribution rate100.00%106.47%−25.91%1.41%19.16%10.25%−11.30%−0.08%
2011–2016Absolute values−70.51−43.06−14.25−10.04−27.9517.33−14.4121.88
Contribution rate100.00%61.08%20.22%14.24%39.64%−24.58%20.44%−31.03%
2016–2019Absolute values40.694.51−0.21−2.4134.811.95−3.645.67
Contribution rate100.00%11.09%−0.51%−5.92%85.55%4.79%−8.95%13.94%
2019–2020Absolute values−8.96−3.85−3.253.25−5.463.50−6.363.21
Contribution rate100.00%42.95%36.27%−36.21%60.96%−39.05%70.94%−35.85%
Source: author’s calculations.
(4) Competitiveness effects were a major factor in the change in the value of India’s exports.
In the first period of turbulence, the competitiveness effect (−1180.25%) dampened export growth overall, with the product-competitiveness effect (−493.04%) having the most significant dampening, followed by the market competitiveness (−402.22%), and the overall-competitiveness effect (−284.99%) having a non-negligible impact. In the second period, the competitiveness effect contributed 60.20%, with the overall-competitiveness effect (78.90%) having the most significant impact, followed by the product-competitiveness effect (8.95%), and the market-competitiveness effect (−27.65%) contributing to the growth in market competitiveness. In the third period, the competitiveness effect contributed 134.43% to the decline in exports, with the overall-competitiveness effect (124.59%) being the main cause, followed by the market-competitiveness effect (62.35%), whereas the product-competitiveness effect (62.35%) contributed to the increase in exports. The reason for the important role of the competitiveness effect in India’s exports may be similar to that of Russia. India faces competition from rare-earth countries such as China and the United States, and the smaller export value makes India’s rare-earth exports more sensitive to competitiveness effects.
Table 6. Decomposition results of India’s exports of rare-earth products (in USD million).
Periods Export GrowthGrowth EffectsCommodity EffectsMarket EffectsOverall-Competitiveness EffectProduct-Competitiveness effectMarket-Competitiveness EffectSecond-Order Effects
2006–2015Absolute values1.2129.77−3.348.41−3.45−5.96−4.86−19.36
Contribution rate100.00%2462%−276.30%695.75%−284.99%−493.04%−402.22%−1601%
2015–2017Absolute values20.262.94−0.244.2315.981.81−5.601.13
Contribution rate100.00%14.53%−1.18%20.89%78.90%8.95%−27.65%5.57%
2017–2020Absolute values−4.672.14−3.02−0.07−5.822.45−2.912.57
Contribution rate100.00%−45.83%64.69%1.60%124.59%−52.51%62.35%−54.88%
Source: author’s calculations.

4.1.2. Breakdown of Product Results

For upstream and downstream rare-earth products, the commodity effect in the structure effect and the product-competitiveness effect in the competitiveness effect can be discarded, as there is only a single commodity within this commodity group. Table 7, Table 8, Table 9 and Table 10 reflect the CMS decomposition results for each upstream, midstream, and downstream rare-earth product for each country.
(1) For Chinese rare-earth products, the competitiveness effect was more pronounced in upstream and downstream products.
In the five periods for upstream products, the contribution of the competitiveness effect in the change in export value reached 77.70%, 33.28%, −21.18%, 233.15%, and 332.64%, and only in the first period did the competitiveness effect have a positive contribution to the export value of upstream products. The competitiveness effect had the greatest inhibitory effect on the export value in the fifth period, reaching 332.64%, in which, except for the first and fifth periods, the market competitiveness effect had a suppressive effect on the export value and the degree of influence was greater. Among the midstream products, the effect of competitiveness on the change in export value was limited except in the fourth and fifth periods, and in the second, third, and fourth periods, the effect of competitiveness on the export value of midstream products had a suppressing effect. In the fifth period, the competitiveness effect contributed more significantly to the rise in export value, with the product-competitiveness effect having a dampening effect on export value in periods one to three and the market-competitiveness effect having a dampening effect in periods two, three, and five, indicating a decline in the competitiveness of specific goods or specific markets during these periods. In the case of downstream products, the competitiveness effect was positively boosted, indicating that the competitiveness of China’s downstream rare-earth products had been increasing over the study period. However, of these, the market-competitiveness effect had a dampening effect on export values in all but the second period, indicating that there was some uneven development in the competitiveness of downstream rare-earth products in different markets, but to a lesser extent.
Table 7. Decomposition results of CMS in China’s upstream, midstream, and downstream products (in USD million).
Commodity GroupsEffect2006–20082008–20092009–20112011–20162016–2020
UpstreamExport growth45.74−25.9234.9521.59−10.20
Growth effects20.19−26.6628.52−45.1120.91
Contribution rate44.14%102.84%81.61%−208.96%−205.06%
Market effects−9.999.3713.8316.362.81
Contribution rate−21.84%−36.13%39.57%75.80%−27.58%
Overall competitiveness effect19.531.056.4672.85−26.58
Contribution rate42.70%−4.07%18.50%337.45%260.59%
Market competitiveness effect12.22−12.54−10.66−31.022.32
Contribution rate26.72%48.39%−30.50%−143.69%−22.77%
Second order effects3.792.86−3.218.51−9.67
Contribution rate8.28%−11.04%−9.18%39.40%94.83%
MidstreamExport growth366.26−343.191751.70−1735.4814.68
Growth effects282.76−322.341883.86−1238.69−87.77
Contribution rate77.20%93.92%107.54%71.37%−598.01%
Commodity effects0.562.4612.6011.41−15.06
Contribution rate0.15%−0.72%0.72%−0.66%−102.63%
Market effects−129.72−0.34−75.64−130.1881.58
Contribution rate−35.42%0.10%−4.32%7.50%555.80%
Overall-competitiveness effect60.95−45.4311.57−835.80103.55
Contribution rate16.64%13.24%0.66%48.16%705.49%
Product-competitiveness effect−31.00−4.40−2.192.7911.79
Contribution rate−8.46%1.28%−0.12%−0.16%80.33%
Market-competitiveness effect10.98−39.25−51.33129.81−81.36
Contribution rate3.00%11.44%−2.93%−7.48%−554.27%
Second-order effects171.7366.11−27.16325.181.95
Contribution rate46.89%−19.26%−1.55%−18.74%13.29%
DownstreamExport growth179.37−164.22913.98−262.78773.75
Growth effects52.15−158.05691.69−164.17552.09
Contribution rate29.07%96.25%75.68%62.47%71.35%
Market effects−48.68−13.68−78.39−295.37−594.31
Contribution rate−27.14%8.33%−8.58%112.40%−76.81%
Overall-competitiveness effect117.47−8.75106.73−43.07193.96
Contribution rate65.49%5.33%11.68%16.39%25.07%
Market-competitiveness effect−70.074.69−83.10−126.70−327.43
Contribution rate−39.07%−2.86%−9.09%48.22%−42.32%
Second-order effects128.5011.58277.05366.53949.44
Contribution rate71.64%−7.05%30.31%−139.49%122.71%
Source: author’s calculations.
(2) For US rare-earth products, the competitiveness effect played a more important role in the export value of the whole chain of products.
For upstream products, the competitiveness effect had a boosting effect on exports in the first five periods and a more pronounced dampening effect in the sixth period. The overall-competitiveness effect had a more significant contribution to export value in periods 2 to 5, whereas the market-competitiveness effect had a dampening effect on export value in periods 2 and 3. Among the midstream products, competitiveness had a dampening effect on export value in the first, fourth, and sixth periods, with the most pronounced dampening in the first period, where the competitiveness contribution rate reached −5018.41%, with the overall competitiveness effect significantly dampening export value in the first period and having a smaller impact on export value in the fourth period. The product-competitiveness effect had a dampening effect on export value in periods 2 to 4, but the effect was more limited. Market competitiveness had a positive effect on export-value growth in periods 1 and 3—particularly in period 1, with a contribution of 2967.66%—but had a more limited effect in period 4. In downstream products, the competitiveness effect contributed to export growth in periods 2 and 5, with the overall-competitiveness effect contributing to export value in periods of declining export value, and market competitiveness contributing to export value in periods 2 and 4.
Table 8. Decomposition results of CMS in the US’s upstream, midstream, and downstream products (in USD million).
Commodity GroupsEffect2006–20082008–20092009–20112011–20162016–20172017–2020
UpstreamExport growth11.13−5.5180.60−25.7640.64−60.75
Growth effects14.63−12.8525.51−36.8417.944.58
Contribution rate131.35%233.49%31.65%143.01%44.15%−7.53%
Market effects−4.713.176.148.51−4.41−11.04
Contribution rate−42.29%−57.55%7.62%−33.03%−10.86%18.18%
Overall-competitiveness effect−2.5410.5548.1312.4818.98−59.21
Contribution rate−22.79%−191.58%59.72%−48.43%46.71%97.48%
Market-competitiveness effect6.04−3.22−12.3311.412.3511.62
Contribution rate54.25%58.51%−15.30%−44.29%5.79%−19.14%
Second-order effects−2.28−3.1513.15−21.315.77−6.69
Contribution rate−20.52%57.13%16.32%82.74%14.21%11.01%
MidstreamExport growth0.08−8.28148.89−149.000.153.51
Growth effects15.47−12.45171.41−119.57−0.53−3.13
Contribution rate20603.36%150.26%115.13%80.25%−361.00%−89.42%
Commodity effects−2.600.462.532.92−0.38−0.57
Contribution rate−3460.77%−5.53%1.70%−1.96%−259.15%−16.23%
Market effects−2.064.11−8.2119.632.220.21
Contribution rate−2740.96%−49.67%−5.52%−13.18%1515.56%6.06%
Overall-competitiveness effect−11.109.111.84−24.880.707.42
Contribution rate−14782.76%−109.95%1.24%16.69%478.41%211.60%
Product-competitiveness effect5.10−1.06−1.44−1.380.480.68
Contribution rate6796.70%12.78%−0.97%0.92%330.06%19.32%
Market-competitiveness effect2.23−2.183.62−14.98−0.53−0.30
Contribution rate2967.66%26.33%2.43%10.05%−365.13%−8.45%
Second-order effects−6.97−6.28−20.86−10.75−1.81−0.80
Contribution rate−9283.21%75.77%−14.01%7.21%−1238.74%−22.87%
DownstreamExport growth5.19−21.6961.64−19.139.65−21.10
Growth effects20.28−23.56116.02−25.9012.5217.37
Contribution rate390.49%108.64%188.24%135.39%129.70%−82.28%
Market effects−2.560.45−24.0640.31−5.09−22.41
Contribution rate−49.36%−2.06%−39.03%−210.70%−52.75%106.17%
Overall-competitiveness effect−13.292.62−29.0910.19−2.56−37.09
Contribution rate−255.88%−12.10%−47.19%−53.25%−26.49%175.74%
Market-competitiveness effect9.76−1.3014.02−29.955.3023.28
Contribution rate187.99%6.00%22.74%156.54%54.91%−110.33%
Second-order effects−9.000.11−15.26−13.78−0.52−2.26
Contribution rate−173.24%−0.49%−24.76%72.02%−5.37%10.71%
Source: author’s calculations.
(3) For Russian rare-earth products, their upstream products were more affected by the competitiveness effect.
Of these, the overall-competitiveness effect had a more pronounced contribution to export value in the first and third periods, whereas the market-competition effect played a part in the first and second periods. For midstream products, the competitiveness effect had a smaller impact. The overall-competitiveness effect dampened the rise in export value in periods 2 and 4, whereas product competitiveness consistently contributed to export-value growth but with a more limited impact, and the market competitiveness effect dampened export value in all periods except period 4. Amongst the downstream products, the overall-competitiveness effect was more pronounced, contributing to export growth in periods 2 and 3, whereas the market competitiveness effect contributed to export growth in all periods except 3.
Table 9. Decomposition results of CMS in Russia’s upstream, midstream, and downstream products (in USD million).
Commodity GroupsEffect2006–20112011–20162016–20192019–2020
UpstreamExport growth18.29−17.4936.45−7.10
Growth effects11.35−12.624.59−6.46
Contribution rate62.08%72.16%12.59%90.97%
Market effects−1.82−5.12−5.094.23
Contribution rate−9.97%29.30%−13.97%-59.68%
Overall-competitiveness effect12.11−5.8832.23−0.73
Contribution rate66.24%33.64%88.42%10.27%
Market-competitiveness effect5.543.20−2.07−6.71
Contribution rate30.30%−18.28%−5.68%94.58%
Second-order effects−8.902.946.792.57
Contribution rate−48.65%−16.82%18.64%−36.15%
MidstreamExport growth49.70−53.163.21−1.31
Growth effects42.72−42.72−0.42−0.65
Contribution rate85.96%80.35%−13.20%49.43%
Commodity effects0.12−1.68−0.230.05
Contribution rate0.24%3.16%−7.31%−3.48%
Market effects2.93−4.961.74−0.58
Contribution rate5.89%9.33%54.23%44.57%
Overall-competitiveness effect8.20−10.023.79−0.76
Contribution rate16.50%18.84%117.83%58.04%
Product-competitiveness effect0.144.730.230.05
Contribution rate0.28%−8.90%7.18%−4.10%
Market-competitiveness effect−13.45−18.03−0.480.12
Contribution rate−27.07%33.91%−14.80%−9.19%
Second-order effects9.0519.51−1.410.46
Contribution rate18.21%−36.69%−43.94%−35.27%
DownstreamExport growth−0.200.141.02−0.56
Growth effects0.42−0.300.38−0.04
Contribution rate−212.27%−205.24%36.72%7.77%
Market effects−0.150.050.94−0.41
Contribution rate75.43%31.20%91.88%72.91%
Overall-competitiveness effect−0.510.550.51−0.53
Contribution rate256.98%378.75%49.86%94.80%
Market-competitiveness effect0.250.42−1.090.23
Contribution rate−125.17%289.32%−106.84%−42.06%
Second-order effects−0.21−0.570.290.19
Contribution rate105.03%−394.02%28.38%−33.42%
Source: author’s calculations.
(4) For Indian rare-earth products, the competitiveness effect was more significant for products across the chain.
Among upstream products, the overall-competitiveness effect had a boosting effect on export volumes in periods other than phase III and the contribution was high. Market competitiveness, on the other hand, had a dampening effect on export value in periods 1 and 2, but the effect was more limited. In medium-sized products, the competitiveness effect increased exports more significantly, whereas the product-competitiveness effect also had an impact on the increase in export value and the market competitiveness effect had a dampening effect on export value in all three periods. In downstream products, the overall-competitiveness effect dampened export growth in periods 1 and 3, whereas the market-competitiveness effect dampened export growth in period 1 only.
Table 10. Decomposition results of CMS in India’s upstream, midstream, and downstream products (in USD million).
Commodity GroupsEffect2006–20152015–20172017–2020
UpstreamExport growth2.741.83−1.86
Growth effects−0.301.12−0.31
Contribution rate−10.89%61.32%16.62%
Market effects0.921.46−1.20
Contribution rate33.39%80.03%64.60%
Overall-competitiveness effect2.791.10−1.70
Contribution rate101.68%60.11%90.95%
Market-competitiveness effect−1.04−0.281.26
Contribution rate−38.07%−15.56%−67.44%
Second-order effects0.38−1.570.09
Contribution rate13.88%−85.91%−4.73%
MidstreamExport growth0.4914.553.17
Growth effects−0.73−0.08−2.58
Contribution rate−148.43%−0.53%−81.40%
Commodity effects−0.27−0.15−1.25
Contribution rate−55.52%−1.06%−39.37%
Market effects1.781.674.04
Contribution rate363.33%11.51%127.76%
Overall-competitiveness effect2.6914.676.94
Contribution rate548.45%100.80%219.17%
Product-competitiveness effect0.370.530.37
Contribution rate75.01%3.62%11.84%
Market-competitiveness effect−3.60−7.99−7.32
Contribution rate−734.92%−54.88%−231.23%
Second-order effects0.265.902.95
Contribution rate52.09%40.55%93.23%
DownstreamExport growth−2.033.88−5.97
Growth effects27.731.823.25
Contribution rate−1368.91%46.78%−54.43%
Market effects5.721.10−2.91
Contribution rate−282.23%28.23%48.78%
Overall-competitiveness effect−15.251.50−8.98
Contribution rate753.05%38.75%150.39%
Market-competitiveness effect−0.222.673.15
Contribution rate10.78%68.76%−52.68%
Second-order effects−20.00−3.20−0.47
Contribution rate987.30%−82.53%7.93%
Source: author’s calculations.

4.1.3. Contribution of Competitiveness by Country

To further explore the drivers and constraints of export growth in each country, the decomposition of CMS is further analysed in this paper. Table 11 shows the contribution of each effect to the export-value growth of the four countries, China, the US, Russia, and India, over the period 2006–2020. It can be seen that the export value of rare-earth products increased to some extent in all four countries in the 15 years from 2006 to 2020. In terms of the competitiveness effect, the following can be seen.
(1) The factor driving the export value of Chinese rare-earth products was the second-order effect, and the competitiveness effect had a negative effect on the export value. Among the competitiveness effects, the overall-competitiveness effect (11.04%) played a role in the growth in export value, but the product-competitiveness effect (−29.53%) and the market-competitiveness effect (−43.16%) had a significant inhibiting effect on export value.
(2) The main factor driving the growth in the export value of US rare-earth products was the structural effect, whereas the competitiveness effect had a more significant negative effect on the growth of US rare-earth-product exports. The overall-competitiveness effect (−140.50%) was the main cause of the negative competitiveness effect, whereas the product-competitiveness effect (30.35%) and the market-competitiveness effect (49.45%) had a more significant contribution to the export-value growth.
(3) The factors driving the growth in the export value of Russian rare-earth products were second-order effects, with the competitiveness effect contributing to the growth in export value. The overall-competitiveness effect (49.60%) and the product-competitiveness effect (102.44%) contributed to the increase in export value, whereas the market-competitiveness effect (−110.51%) had a significant dampening effect on export value.
(4) The factors driving the growth of exports of rare-earth products from India were structural effects, and competitiveness effects had a dampening effect on the growth of exports. The overall-competitiveness effect (39.98%) boosted exports, whereas the product-competitiveness effect (−10.09%) and the market-competitiveness effect (−79.66) had a dampening effect on exports.
Table 12 reflects the contribution of upstream, midstream, and downstream rare-earth products to the growth in the value of exports.
(1) The competitiveness effect of China’s upstream products contributed marginally to export growth, whereas the midstream products had the greatest dampening effect on export value. Among the competitiveness effects, the overall-competitiveness effects of upstream and downstream products contributed to a certain degree to the export value, the product-competitiveness effects of midstream products moderately suppressed the export value growth, and the market-competitiveness effects of all three categories of products suppressed the export value to different degrees.
(2) The competitiveness effect of upstream products in the US contributed to export-value growth, whereas the other two categories had a dampening effect. The overall competitiveness of upstream products had a positive effect on export value, the market-competitiveness effect of upstream and downstream products also contributed to export-value growth, and the product-competitiveness effect of midstream products made a small contribution to export-value growth.
(3) The competitiveness effect of Russia’s upstream products contributed significantly to the increase in export value, whereas the competitiveness effect of the other products had a dampening effect of varying magnitude. The overall-competitiveness effect was boosted to varying degrees for all three products, the market-competitiveness effect was dampened to varying degrees, and the product-competitiveness effect was boosted to some extent.
(4) The competitiveness effect of upstream and midstream products in India promoted exports. The overall-competitiveness effect of the downstream products inhibited exports, the competitiveness effect of product markets other than downstream products all inhibited exports to some extent, and the product-competitiveness effect had a certain promotion effect. In general, the competitiveness of middle and downstream products in China, the United States, and Russia grew at a slower rate, whereas the competitiveness of downstream products in India grew at a slower rate.
This subsection uses the CMS model to analyse the impact of competitiveness factors on changes in the export value of rare-earth products by country, in response to research question two.

4.2. WRCA Index Analysis

To find the WRCA indices for each commodity group in each year, this study used a real-number-coded accelerated genetic algorithm (RAGA) to optimise the projection-tracing method, setting the initial population size to 100, the maximum number of genetic generations to 3000, the crossover probability to 0.8, and the variation probability to 0.05, and the solution process was carried out via MATLAB. The weights of each indicator were W = {0.3645, 0.0060, 0.3648, 0.2792, 0.0077, 0.3148, 0.2374, 0.2611, 0.1670, 0.2434, 0.1838, 0.2388, 0.3825, 0.2299, 0.2343, 0.0047, 0.0177, 0.0087}; the convergence process is shown in Figure 4. The variable weights were substituted back, i.e., the projection values for each year of the study period, i.e., the weights for each year, and the weights for each year were multiplied by the RCA index to obtain the WRCA index, and the results are shown in Figure 5.
The weights W obtained in this study are in a mathematical sense a correction based on a technological-innovation perspective for a country’s exports of a commodity Ei, i.e., having a lower combined level, i.e., a year with a lower weight would be considered as having exported fewer commodities for the same quantity of goods exported. Therefore, this study follows the traditional RCA index classification of competitiveness levels.
The results of the analysis show the following.
Overall, Chinese rare-earth products have always been extremely competitive, whereas the United States’ rare-earth-product exports are less competitive but slightly more competitive compared to India and Russia, which have lower competitiveness. However, Russia’s competitiveness has risen in recent years.
Dynamic perspective on:
(1) The WRCA Index for Chinese rare-earth products achieved a “stable–rising–stable process. The WRCA index for Chinese rare-earth products was stable at around 6 until 2009, then rose sharply to a peak of 17.7 between 2009 and 2011 before dropping to 12.6 in 2012 and maintaining a low declining trend between 2012 and 2015, and after 2015, the WRCA index for Chinese rare-earth products was slightly unstable, oscillating at around 12, and slowly declining after 2018. A slow downward trend was seen after 2018. A possible reason for this trend in the WRCA index of Chinese rare-earth products is that China’s 2010 Chinese rare-earth embargo policy provided an opportunity to improve competitiveness to some extent. During the period when the rare-earth embargo policy took effect, rare-earth prices rose sharply, and the capital market responded quickly. The stock prices of various rare-earth enterprises in China rose sharply. The government took the opportunity to integrate the industrial chain and strengthened control over the supply chain and pricing power.
Comparative Advantage.
(2) The WRCA Index for US rare-earth products also followed a “stable–rising–stable” process. The US WRCA index for rare-earth products remained stable at 1 until 2009, i.e., around its average comparative advantage. From 2009 to 2011, the WRCA index increased rapidly to a peak of 2.98 in 2011 with a strong comparative advantage before falling back to 2.52 in 2012 and then stabilising around 2.5 between 2012 and 2019. After 2019, there was a more pronounced upward trend in its WRCA index, with the WRCA index for US rare-earth products rising to 2.86 in 2020. It is worth noting that the rising competitiveness of the United States also started in 2010 and ended in 2011, which may also be related to China’s rare-earth embargo policy. The United States is an important source of rare earths in the world. During the embargo period, the United States may have become a source of substitutes for countries restricted by China’s rare-earth exports or indirectly affected by the policy. Since China’s rare-earth embargo policy was mainly aimed at Japan, the United States, and Europe countries, this explanation also echoes the implementation of the substantial increase in U.S. rare-earth exports to Asia and Europe in 2010 and 2011 in Section 3.2.
(3) The WRCA index for Russian rare-earth products showed a slow upward trend. The WRCA index for Russian rare-earth products did not have a comparative advantage until 2020, but showed a slow increase between 2006 and 2019, especially between 2010 and 2011, and 2016 and 2017. This represents an increase of 522% compared to 0.23 in 2006. The gradual improvement of the competitiveness of Russia’s rare-earth products may have been due to the continuous improvement in factors such as its technological level and trade conditions. These factors seldom cause great changes in the competitiveness of rare earth products but will gradually promote the continuous development of Russia’s rare-earth competitiveness.
(4) The WRCA index for Indian rare-earth products stabilised at a low level. In 2006, the WRCA index for Indian rare-earth products was 0.17, which slowly decreased to 0.1 between 2006 and 2010 and remained stable between 2010 and 2012, after which its WRCA index slowly increased to 0.271 in 2018. After 2018 its WRCA decreased and in 2020 its WRCA decreased to 0.184. One possible reason for the stagnation of India’s rare-earth export competitiveness is the strong squeeze from foreign competitors. At the same time, factors such as infrastructure and trade environment may also limit the development of India’s rare-earth export competitiveness.
This subsection analyses the dynamic evolution of the competitiveness of rare-earth products in China, the United States, Russia, and India, using the WRCA index, in response to research question 3.

5. Discussion

This paper uses the CMS model and the WRCA method to discuss the role and changing process of the competitiveness of rare-earth products in the export trade of China, the United States, Russia, and India. However, the disadvantage is that the research idea of this paper is based on the traditional theory of comparative advantage. Although the international trade of rare earths is mainly based on inter-industry trade, and rare-earth products can be freely traded under the WTO framework, the trade also depends on many other factors, such as the argument that the main drivers of China’s rare-earth trade-policy formulation are domestic attention to resource conservation and environmental protection, as well as the development of competitive downstream industries. Kilby [27] believes that China’s rare-earth trade policy encourages the illegal mining and smuggling of rare-earth resources. The trade data currently used based on traditional statistical methods have a large number of double-counting problems, and trade methods such as processing export and processing import are also included in the trade volume. Although we used the WRCA model that considers a wider range of factors, the interpretation of the comparative advantage theory still has certain limitations. Therefore, it is highly feasible to extend the results of this research through other trade theories such as industry-chain theory. In addition, given the strategic nature of rare-earth products, it is also necessary to include the supply-security motives of exporting countries in the study of trade in rare-earth products. In this regard, it is of profound significance to analyse the trade in rare earths from the perspective of pricing power, as the pricing power of strategic resources can determine the pattern of sovereign states in the distribution of power in international-trade relations. For example, Song et al. [28] discuss the theoretical and institutional explanations for the lack of pricing power in China, arguing that the key reason for the lack of pricing power in China is that the rare-earth export market is characterised by a buyer-monopoly market structure. Zhou et al. [29] argued from an industrial perspective that the lack of R&D capability at the back end of the industry chain, over-exploitation of resources, and low industrial concentration have contributed to the lack of pricing power in China’s rare-earth industry. In conclusion, with the COVID-19 pandemic and the increasingly volatile political situation in the world, the issue of rare-earth trade will become more complicated due to more political factors, and therefore, it is possible to take into account the characteristics of the industrial chain and the supply-security motive. Trade theory and measurement methods that take into account factors such as chain characteristics and supply-security motives could be a focus for future research.

6. Conclusions and Policy Recommendations

The results of the analysis of the CMS model and the WRCA index lead to the following conclusions in this paper.
(1) Changes in the competitiveness of rare-earth products in China, the US, Russia, and India differed. The competitiveness of rare-earth products in China, the US, and India generally decreased over the study period and led to a decline in the export value of rare-earth products, whereas the competitiveness of rare-earth products in Russia increased and promoted the export of rare-earth products.
(2) The factors inhibiting the further development of the competitiveness of rare-earth products in China, the US, Russia, and India were different. The factors inhibiting the development of the competitiveness of China’s and India’s rare-earth product exports were the concentration of exports in midstream and downstream products with low growth rates and the concentration of export markets in markets with low growth rates. For the US, the inhibiting factor for the competitiveness of rare-earth exports was the overall reduction in market share for rare-earth products. In the case of Russia, the inhibiting factor was the concentration of exports in markets with low growth rates of competitiveness.
(3) The overall competitiveness of rare-earth products varied greatly among the four countries. China always had the highest rare-earth export competitiveness among the four countries, whereas the US rare-earth product-export competitiveness was significantly lower than that of China, but higher than that of Russia, India. Russia and India were, on the whole, less competitive and did not have comparative advantages.
(4) China, the United States, Russia, and India had different trends in the evolution of the competitiveness of their rare-earth products. The export competitiveness of rare-earth products from China and India tended to decline in recent years, whereas the competitiveness of rare-earth products from the US and Russia tended to rise.
With these findings, this paper makes the following policy recommendations.
(1) For China, which already occupies a major position in rare-earth exports, the next goal should be to pursue high-quality development of the rare-earth industry. The first is to maintain the balance between rare-earth production and ecological maintenance. By improving the environmental-protection law, we will promote a circular economy of rare-earth resource conservation and recycling, and improve the utilization efficiency of rare-earth resources. The second is to strengthen technological-innovation capabilities, increase the added value of rare-earth products through industry–university–research cooperation and other methods, and stimulate the competitiveness of the rare-earth industry through innovation. Finally, it is recommended to extend the industrial chain, expand industrial clusters, improve the scale and quality of each industry, and enhance the overall industrial-chain competitiveness.
(2) For the United States, strengthening its leading position in high-end manufacturing can lead to better playing its role in the division of labour in the international rare-earth industry. By increasing R&D investment and enhancing the concentration of the rare-earth industry, it may be possible to create a comparative advantage in the downstream of the U.S. rare-earth industry chain.
(3) For Russia and India, the main factors that limit the competitiveness of their rare-earth products are non-resource factors such as technological constraints. Ways to improve the competitiveness of rare-earth products can include improving technological capabilities and increasing investment in scientific research systems and education; partial opening up on the premise of ensuring the security of strategic mineral supply, such as restrictions on foreign investment in the rare-earth industry; strengthening investment in infrastructure; curbing corruption and creating a better business environment; etc.
(4) Considering the volatile political situation in the world and the impact of the new COVID-19 pandemic, security and political factors may greatly affect the rare-earth trade in the future. Countries around the world have an obligation to maintain the original intention of maximising the welfare of world trade, and it is necessary to strengthen the economic dependence of countries around the world, increase the degree of cooperation among countries, and promote the healthy development of rare-earth trade and the sustainable development of countries by constructing a broader framework of cooperation, formulating fairer trade agreements, and creating a broader global trade-cooperation organisation.

Author Contributions

Conceptualization, Q.G.; methodology, Q.G.; software and formal analysis, Z.M.; writing—original draft preparation, Q.G. and Z.M.; writing—review and editing, Q.G. and Z.M.; supervision and funding acquisition, Q.G. All authors have read and agreed to the published version of the manuscript.

Funding

This research is supported by the National Social Science Foundation of China (21CJL007), the Humanities and Social Science Project of China’s Ministry of Education (20YJC790036), the Natural Science Foundation of Guangdong (2020A1515010629), the Basic and Applied Basic Research Project of Guangzhou (202102021185), Guangzhou Research Center for Public Opinion Governance and International Image Communication Project (2021-YB-01), Guangdong University of Foreign Studies, Guangdong-Hong Kong-Macao Greater Bay Area Accounting and Economic Development Research Center Project (YGA002), Guangzhou International Trade Centre Research Base Project (JDZB202104), Guangdong University of Foreign Studies, Pacific Island Countries Strategy Research Centre Project (2021PIC003), Guangdong University of Foreign Studies, African Research Institute Project (HX-FZ2022-2), Guangdong University of Foreign Studies, Asia-Pacific Security and Economic and Political Cooperation Research Centre Project (YT2022001), Guangdong Postgraduate Education Innovation Project (2022XSLT027).

Institutional Review Board Statement

Not applicable.

Informed Consent Statement

Informed consent was obtained from all the subjects involved in the study.

Data Availability Statement

The data and estimation commands that support the findings of this paper are available on request from the first and corresponding authors.

Conflicts of Interest

The authors declare no conflict of interest.

References

  1. Sanyal, P.; Brady, P.V.; Vugrin, E.D. The Impact of Trade Costs on Rare Earth Exports: A Stochastic Frontier Estimation Approach; Sandia National Lab.: Albuquerque, NM, USA, 2013. [Google Scholar]
  2. Zhang, L.; Qing, G.U.O.; Zhang, J.; Huang, Y.; Xiong, T. Did China’s rare earth export policies work?—Empirical evidence from USA and Japan. Resour. Policy 2015, 43, 82–90. [Google Scholar] [CrossRef]
  3. Zhao, S.Y.; Yang, S.; Liang, C.; Gu, D. Where is the way for rare earth industry of China: An analysis via ANP-SWOT approach. Resour. Policy 2016, 49, 349–357. [Google Scholar] [CrossRef]
  4. Pan, A.; Feng, S.; Hu, X.; Li, Y. How environmental regulation affects China’s rare earth export? PLoS ONE 2021, 16, e0250407. [Google Scholar] [CrossRef] [PubMed]
  5. Pingpeng, N.; Yunbing, M.; Bin, Y. The current situation and protective development strategy of rare earth resources exploitation and utilization in my country. Macroecon. Res. 2010, 13–20. [Google Scholar] [CrossRef]
  6. Wenlong, L. Research on the sustainable development of my country’s rare earth industry. Sci. Manag. Res. 2011, 29, 102–105. [Google Scholar]
  7. Goldman, J.A. The US rare earth industry: Its growth and decline. J. Policy Hist. 2014, 26, 139–166. [Google Scholar] [CrossRef]
  8. Vekasi, K. The Geoeconomics of Critical Rare Earth Minerals. Georget. J. Int. Aff. 2021, 22, 271–279. [Google Scholar] [CrossRef]
  9. Islam, M.A.; Barakos, G.; Mischo, H. Assessment of the Real Economic Feasibility of Potential Critical Raw Materials Mining Projects in the U.S.; Implementation of a Newly Developed Computational Tool; SME Annual Meeting: Salt Lake City, UT, USA, 2022. [Google Scholar]
  10. Buynovskiy, A.S.; Zhiganov, A.N.; Sofronov, V.L.; Sachkov, V.I.; Daneikina, N.V. Current State of the Rare Earth Industry in Russia and Siberia. Procedia Chem. 2014, 11, 126–132. [Google Scholar] [CrossRef]
  11. Kryukov, I.V.; Samsonov, N.I.; Iatsenko, V.A. The Russian Rare-Earth Industry: Should China’s Experience Be Adopted? Probl. Econ. Transit. 2020, 62, 95–107. [Google Scholar] [CrossRef]
  12. Gasanov, A.A.; Naumov, A.V.; Yurasova, O.V.; Petrov, I.M.; Litvinova, T.E. Certain Tendencies in the Rare-Earth-Element World Market and Prospects of Russia. Russ. J. Non-Ferr. Met. 2018, 59, 502–511. [Google Scholar] [CrossRef]
  13. Cherepovitsyn, A.; Solovyova, V. Prospects for the Development of the Russian Rare-Earth Metal Industry in View of the Global Energy Transition—A Review. Energies 2022, 15, 387. [Google Scholar] [CrossRef]
  14. Kryukov, V.; Yatsenko, V.; Kryukov, Y. Rare Earth Industry–How to Take Advantage of Opportunities. Min. Ind. J. (Gorn. Promishlennost) 2020, 5, 68–84. [Google Scholar] [CrossRef]
  15. Chandrashekar, S.; Sundaresan, L. India’s Rare Earths Industry: A Case of Missed Opportunities. Econ. Political Wkly. 2016, 51, 27–33. [Google Scholar]
  16. Ilankoon, I.M.S.K.; Dushyantha, N.P.; Mancheri, N.; Edirisinghe, P.M.; Neethling, S.J.; Ratnayake, N.P.; Rohitha, L.P.S.; Dissanayake, D.M.D.O.K.; Premasiri, H.M.R.; Abeysinghe, A.M.K.B.; et al. Constraints to rare earth elements supply diversification: Evidence from an industry survey. J. Clean. Prod. 2022, 331, 129932. [Google Scholar] [CrossRef]
  17. Qiao, C.; Cheng, J.; Zutao, D. Structural characteristics and path evolution of global rare earth trade network. Geogr. Geogr. Inf. Sci. 2022, 38, 58–65. [Google Scholar]
  18. Hau, L.; Zhu, H.; Yu, Y.; Yu, D. Time-frequency coherence and quantile causality between trade policy uncertainty and rare earth prices: Evidence from China and the US. Resour. Policy 2022, 75, 102529. [Google Scholar] [CrossRef]
  19. Baolu, Z.; Zhongxue, L.; Yiqing, Z. The world rare earth market dynamics and industry countermeasures. Chin. J. Rare Earth 2016, 34, 257–264. [Google Scholar]
  20. An, P.; Long, W. The Influence of Institutional Distance on China’s Rare Earth Export Trade—Analysis of Gravity Model Based on Trade Data of 18 Countries and Regions. Int. Trade Issues 2013, 96–104. [Google Scholar] [CrossRef]
  21. Jepma, C.J. Extensions of the constant-market-shares analysis with an application to long-term export data of developing countries. In The Balance between Industry and Agriculture in Economic Development; Palgrave Macmillan: London, UK, 1989; pp. 129–143. [Google Scholar]
  22. Xiaodan, S. Research on the Dynamic Structure and Growth of International Agricultural Trade; Chinese Academy of Agricultural Sciences: Beijing, China, 2007. [Google Scholar]
  23. Koopman, R.; Wang, Z.; Wei, S.J. Tracing Value-added and Double Counting in Gross Exports. Am. Econ. Rev. 2014, 104, 459–494. [Google Scholar] [CrossRef]
  24. Wübbeke, J. Rare earth elements in China: Policies and narratives of reinventing an industry. Resour. Policy 2013, 38, 384–394. [Google Scholar] [CrossRef]
  25. Yu, S. Research on the International Competitiveness of China’s Rare Earth Industry; China University of Geosciences: Beijing, China, 2011. [Google Scholar]
  26. Guo, C. Construction and Dynamic Evaluation of the Competitiveness Index System of Rare Earth Resources Industry; China University of Geosciences: Beijing, China, 2012. [Google Scholar]
  27. Kilby, C. China’s rare earth trade: Health and the environment. China Q. 2014, 218, 540–550. [Google Scholar] [CrossRef]
  28. Song, W.F.; Li, G.P.; Han, X.F. The lack of pricing power of rare earths, theoretical mechanism and institutional explanation. China Ind. Econ. 2011, 46–55. [Google Scholar] [CrossRef]
  29. Zhou, D.S.; Li, X.F.; Wang, S.G. Research on the Development of China’s Rare Earth Industry from the Perspective of International Pricing Power. Ind. Technol. Econ. 2011, 30, 73–77. [Google Scholar]
Figure 1. China, US, Russia, and India rare-earth exports, 2006–2020 (in USD million).
Sustainability 14 12358 g001
Figure 4. Genetic-algorithm convergence process.
Sustainability 14 12358 g004
Figure 5. China, US, Russia, and India WRCA index.
Sustainability 14 12358 g005
Table 1. CMS model decomposition.
First-Order DecompositionSecond-Order DecompositionMeaning
Export changes Change in a country’s exports of a specific commodity group in a given period
Structural effects1. Growth effectsChange in the value of exports due to an expansion/decrease in world imports, assuming that a country’s commodity competitiveness remains constant
2. Market effectsChange in export value due to concentration of a country’s export markets in regions with fast-/slow-growing demand, assuming no change in the competitiveness of a country’s exports
3. Commodity effectThe increase/decrease in export value due to the concentration of a country’s export market on goods with fast-/slow-growing demand, assuming that the competitiveness of a country’s exports remains constant
Competitive effects1. General-competitiveness effectsThe increase/decrease in the value of exports due to an increase/decrease in a country’s overall export competitiveness, assuming a constant size of total market imports
2. Product-competitiveness effectIncrease/decrease in the value of exports due to an increase/decrease in the competitiveness of the goods exported by a country in a given market, assuming that the total import size of the market remains constant
3. Market-competitiveness effectIncrease/decrease in the value of exports due to an increase/decrease in the competitiveness of a particular commodity exported by a country, assuming that the total import size of the market remains constant
Second-order effects1. Second-order effectsAn increase/decrease in the value of a country’s merchandise exports caused by the combined effect of changes in the competitiveness of a country’s exports and changes in the size of world imports
Source: compiled by the author from Sun (2007).
Table 2. Rare-earth international-competitiveness evaluation-index system.
Competitiveness weightsDomestic EconomyGDPGDP (constant 2015 USD)
GDP growth (annual %)
Industrial value addedIndustry (including construction), value added (constant 2015 USD)
Industry (including construction), value added per worker (constant 2015 USD)
Factors of productionHuman resourcesIndustrial employment (% of total employment) (modelled ILO estimates)
Total labour-force participation rate (% of total population aged 15+) (modelled ILO estimates)
Infrastructure developmentRailway lines (total route—km)
Railways, freight transport (million tonne kilometres)
Container port traffic (TEU: 20-foot-equivalent units)
Rare-earth resourcesRare-earth production (tonnes)
Rare-earth reserves (tonnes)
Technology DevelopmentR&D resourcesR&D expenditure (% of GDP)
R&D personnel (per million people)
R&D outputScientific and technical journal articles
Patent applications, non-residents
Trade environmentTrade-tax ratesTariff rate, applied, simple average, all products (%)
Export taxes (% of tax revenue)
Terms of tradeNet barter terms-of-trade index (2000 = 100)
Source: WDI and US Geological Survey.
Table 11. Total export growth and the contribution of each effect in the US, China, Russia, and India (in USD million).
EffectChinaUnited StatesRussiaIndia
Amount of ContributionContribution RateAmount of ContributionContribution RateAmount of ContributionContribution RateAmount of ContributionContribution Rate
Export growth1560.23100.00%50.25100.00%29.02100.00%16.79100.00%
Structural effects249.0015.96%183.43365.07%−13.74−47.35%40.82243.05%
Growth effects732.9146.97%200.88399.79%29.78102.62%34.85207.53%
Commodity effects768.4449.25%−17.64−35.11%−35.27−121.55%−6.60−39.32%
Market effects−1252.36−80.27%0.190.39%−8.25−28.42%12.5774.84%
Competitive effects−961.95−61.65%−30.50−60.70%12.0541.53%−8.36−49.77%
Overall-competitiveness effect172.2611.04%−70.60−140.50%14.3949.60%6.7239.98%
Product-competitiveness effect−460.78−29.53%15.2530.35%29.73102.44%−1.69−10.09%
Market-competitiveness effect−673.43−43.16%24.8549.45%−32.07−110.51%−13.38−79.66%
Second-order effects2273.18145.70%−102.68−204.36%30.71105.82%−15.67−93.28%
Source: author’s calculations.
Table 12. Contribution of China, the US, Russia, and India to rare-earth exports by product (in USD million).
Commodity GroupsEffectChinaUnited StatesRussiaIndia
Amount of ContributionContribution RateAmount of ContributionContribution RateAmount of ContributionContribution RateAmount of ContributionContribution Rate
Total export-value growth1560.23100.00%50.25100.00%29.02100.00%16.79100.00%
Upstream productsExportgrowth66.164.24%40.3680.33%30.16103.92%2.7116.12%
Growtheffects−2.14−0.14%12.9625.79%−3.13−10.79%0.513.05%
Marketeffects32.382.08%−2.35−4.68%−7.81−26.89%1.176.99%
Competitiveeffects33.642.16%44.2688.09%37.69129.88%2.1212.63%
Overall-competitivenesseffect73.324.70%28.3856.49%37.74130.03%2.1913.06%
Market-competitivenesseffect−39.68−2.54%15.8831.60%−0.04−0.15%−0.07−0.43%
Second-ordereffects2.270.15%−14.51−28.87%3.4011.73%−1.10−6.55%
Midstream productsExportgrowth53.963.46%−4.67−9.30%−1.55−5.35%18.21108.41%
Growtheffects517.8233.19%51.20101.90%−1.06−3.66%−3.38−20.13%
Commodityeffects11.970.77%2.354.68%−1.75−6.04%−1.67−9.96%
Marketeffects−254.31−16.30%15.9131.66%−0.87−3.01%7.5044.65%
Competitiveeffects−759.32−48.67%−26.67−53.07%−25.47−87.76%6.6639.63%
Overall-competitivenesseffect−705.17−45.20%−16.91−33.65%1.214.17%24.29144.64%
Product-competitivenesseffect−23.01−1.47%2.384.74%5.1517.76%1.277.55%
Market-competitivenesseffect−31.14−2.00%−12.14−24.17%−31.83−109.69%−18.90−112.56%
Second-ordereffects537.8034.47%−47.47−94.47%27.6195.12%9.1154.22%
Downstream productsExportgrowth1440.1192.30%14.5628.98%0.411.43%−4.12−24.52%
Growtheffects973.7162.41%116.72232.30%0.451.57%32.79195.25%
Marketeffects−1030.43−66.04%−13.36−26.59%0.431.48%3.9023.21%
Competitiveeffects−236.27−15.14%−48.09−95.72%−0.17−0.59%−17.14−102.03%
Overall-competitivenesseffect366.3423.48%−69.21−137.74%0.020.08%−22.73−135.35%
Market-competitivenesseffect−602.61−38.62%21.1142.02%−0.19−0.67%5.6033.33%
Second-order effects1733.11111.08%−40.71−81.02%−0.30−1.03%−23.67−140.96%
Source: author’s calculations.
Publisher’s Note: MDPI stays neutral with regard to jurisdictional claims in published maps and institutional affiliations.

