
Comprehensive Techno-Economic Analysis of a Multi-Feedstock Biorefinery Plant in Oil-Rich Country: A Case Study of Iran

 , , ,
, , ,
Abstract
:1. Introduction
2. Methodology
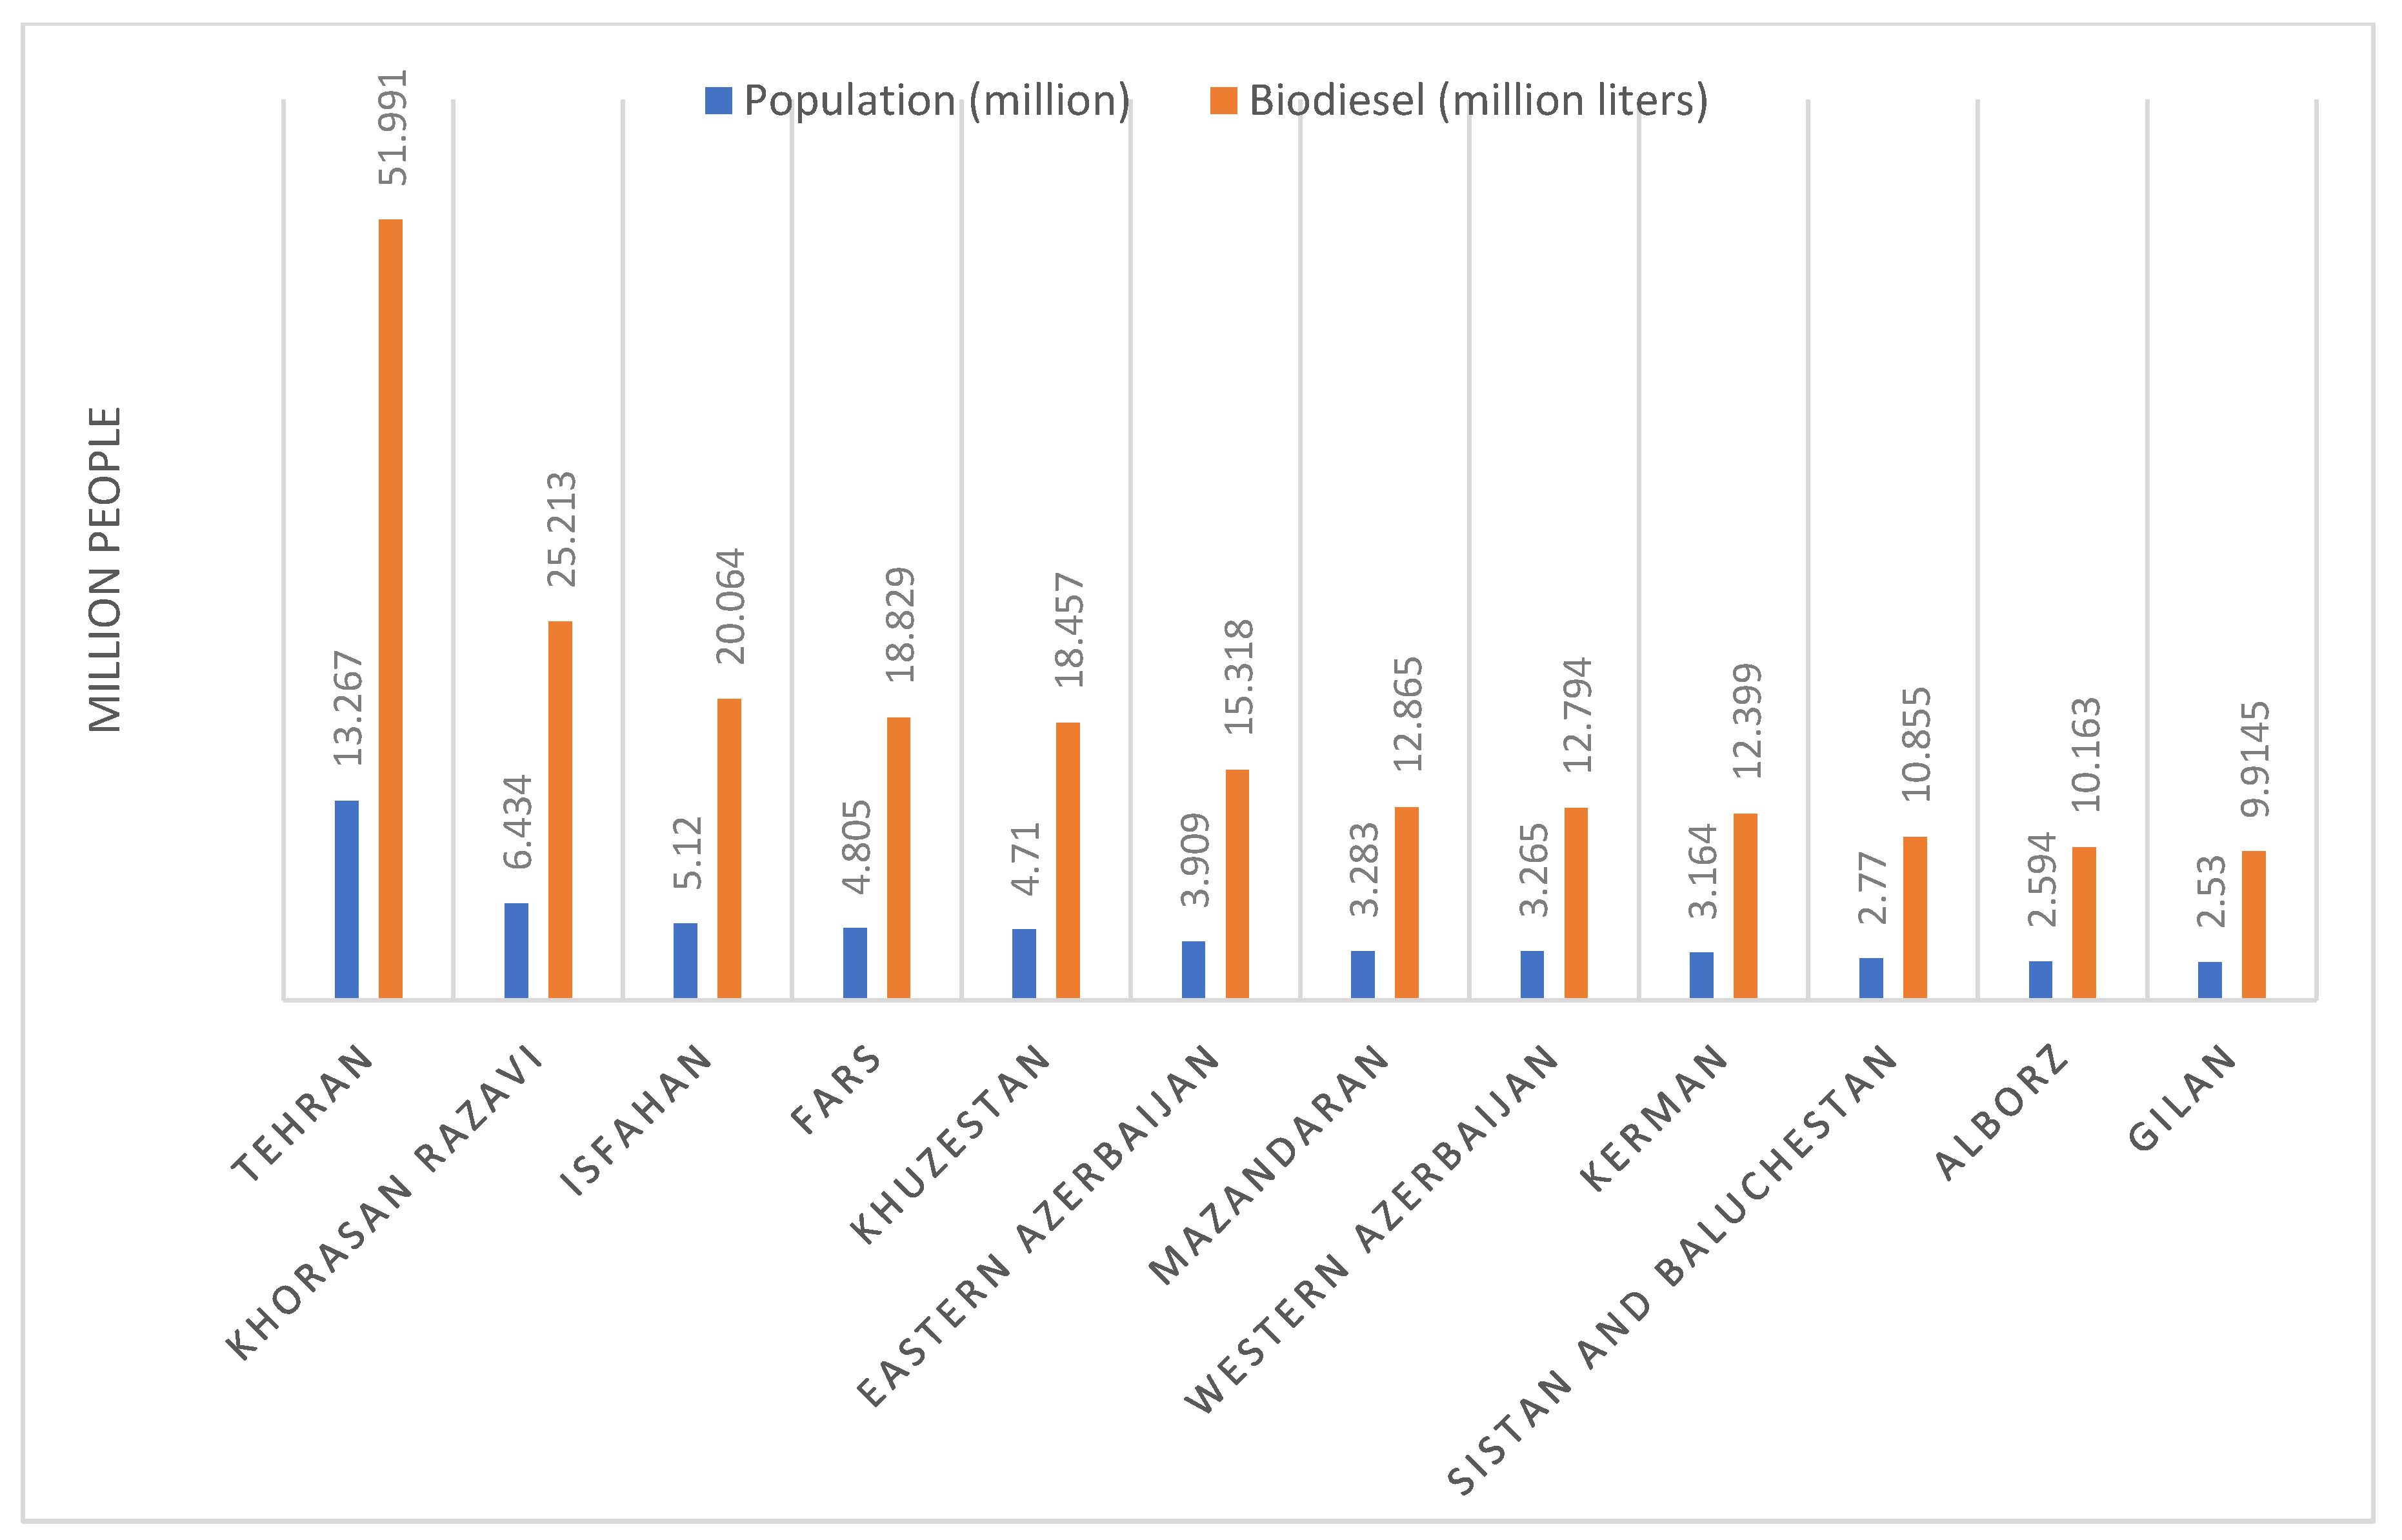
2.1. Data Gathering of Various Types of Waste in Iran
2.2. Selecting the Best Place to Build a Multi-Feed Biodiesel Production Plant in Iran by AHP Method
2.3. Techno-Economic Assessment
3. Result and Discussion
3.1. Potential Waste Sources for Biodiesel in Iran
3.1.1. The Potential of Biodiesel Production from Municipal and Industrial Sewage Sludge in Iran
3.1.2. The Potential of Biodiesel Production from Waste Cooking Oils in Iran
3.1.3. The Potential of Biodiesel Production from Poultry Waste in Iran
3.1.4. The Potential of Biodiesel Production from Animal Waste in Iran
3.1.5. The Potential of Biodiesel Production from Fish Waste in Iran
3.1.6. The Potential of Biodiesel Production from Microalgae
3.1.7. The Potential of Biodiesel Production from Macroalgae
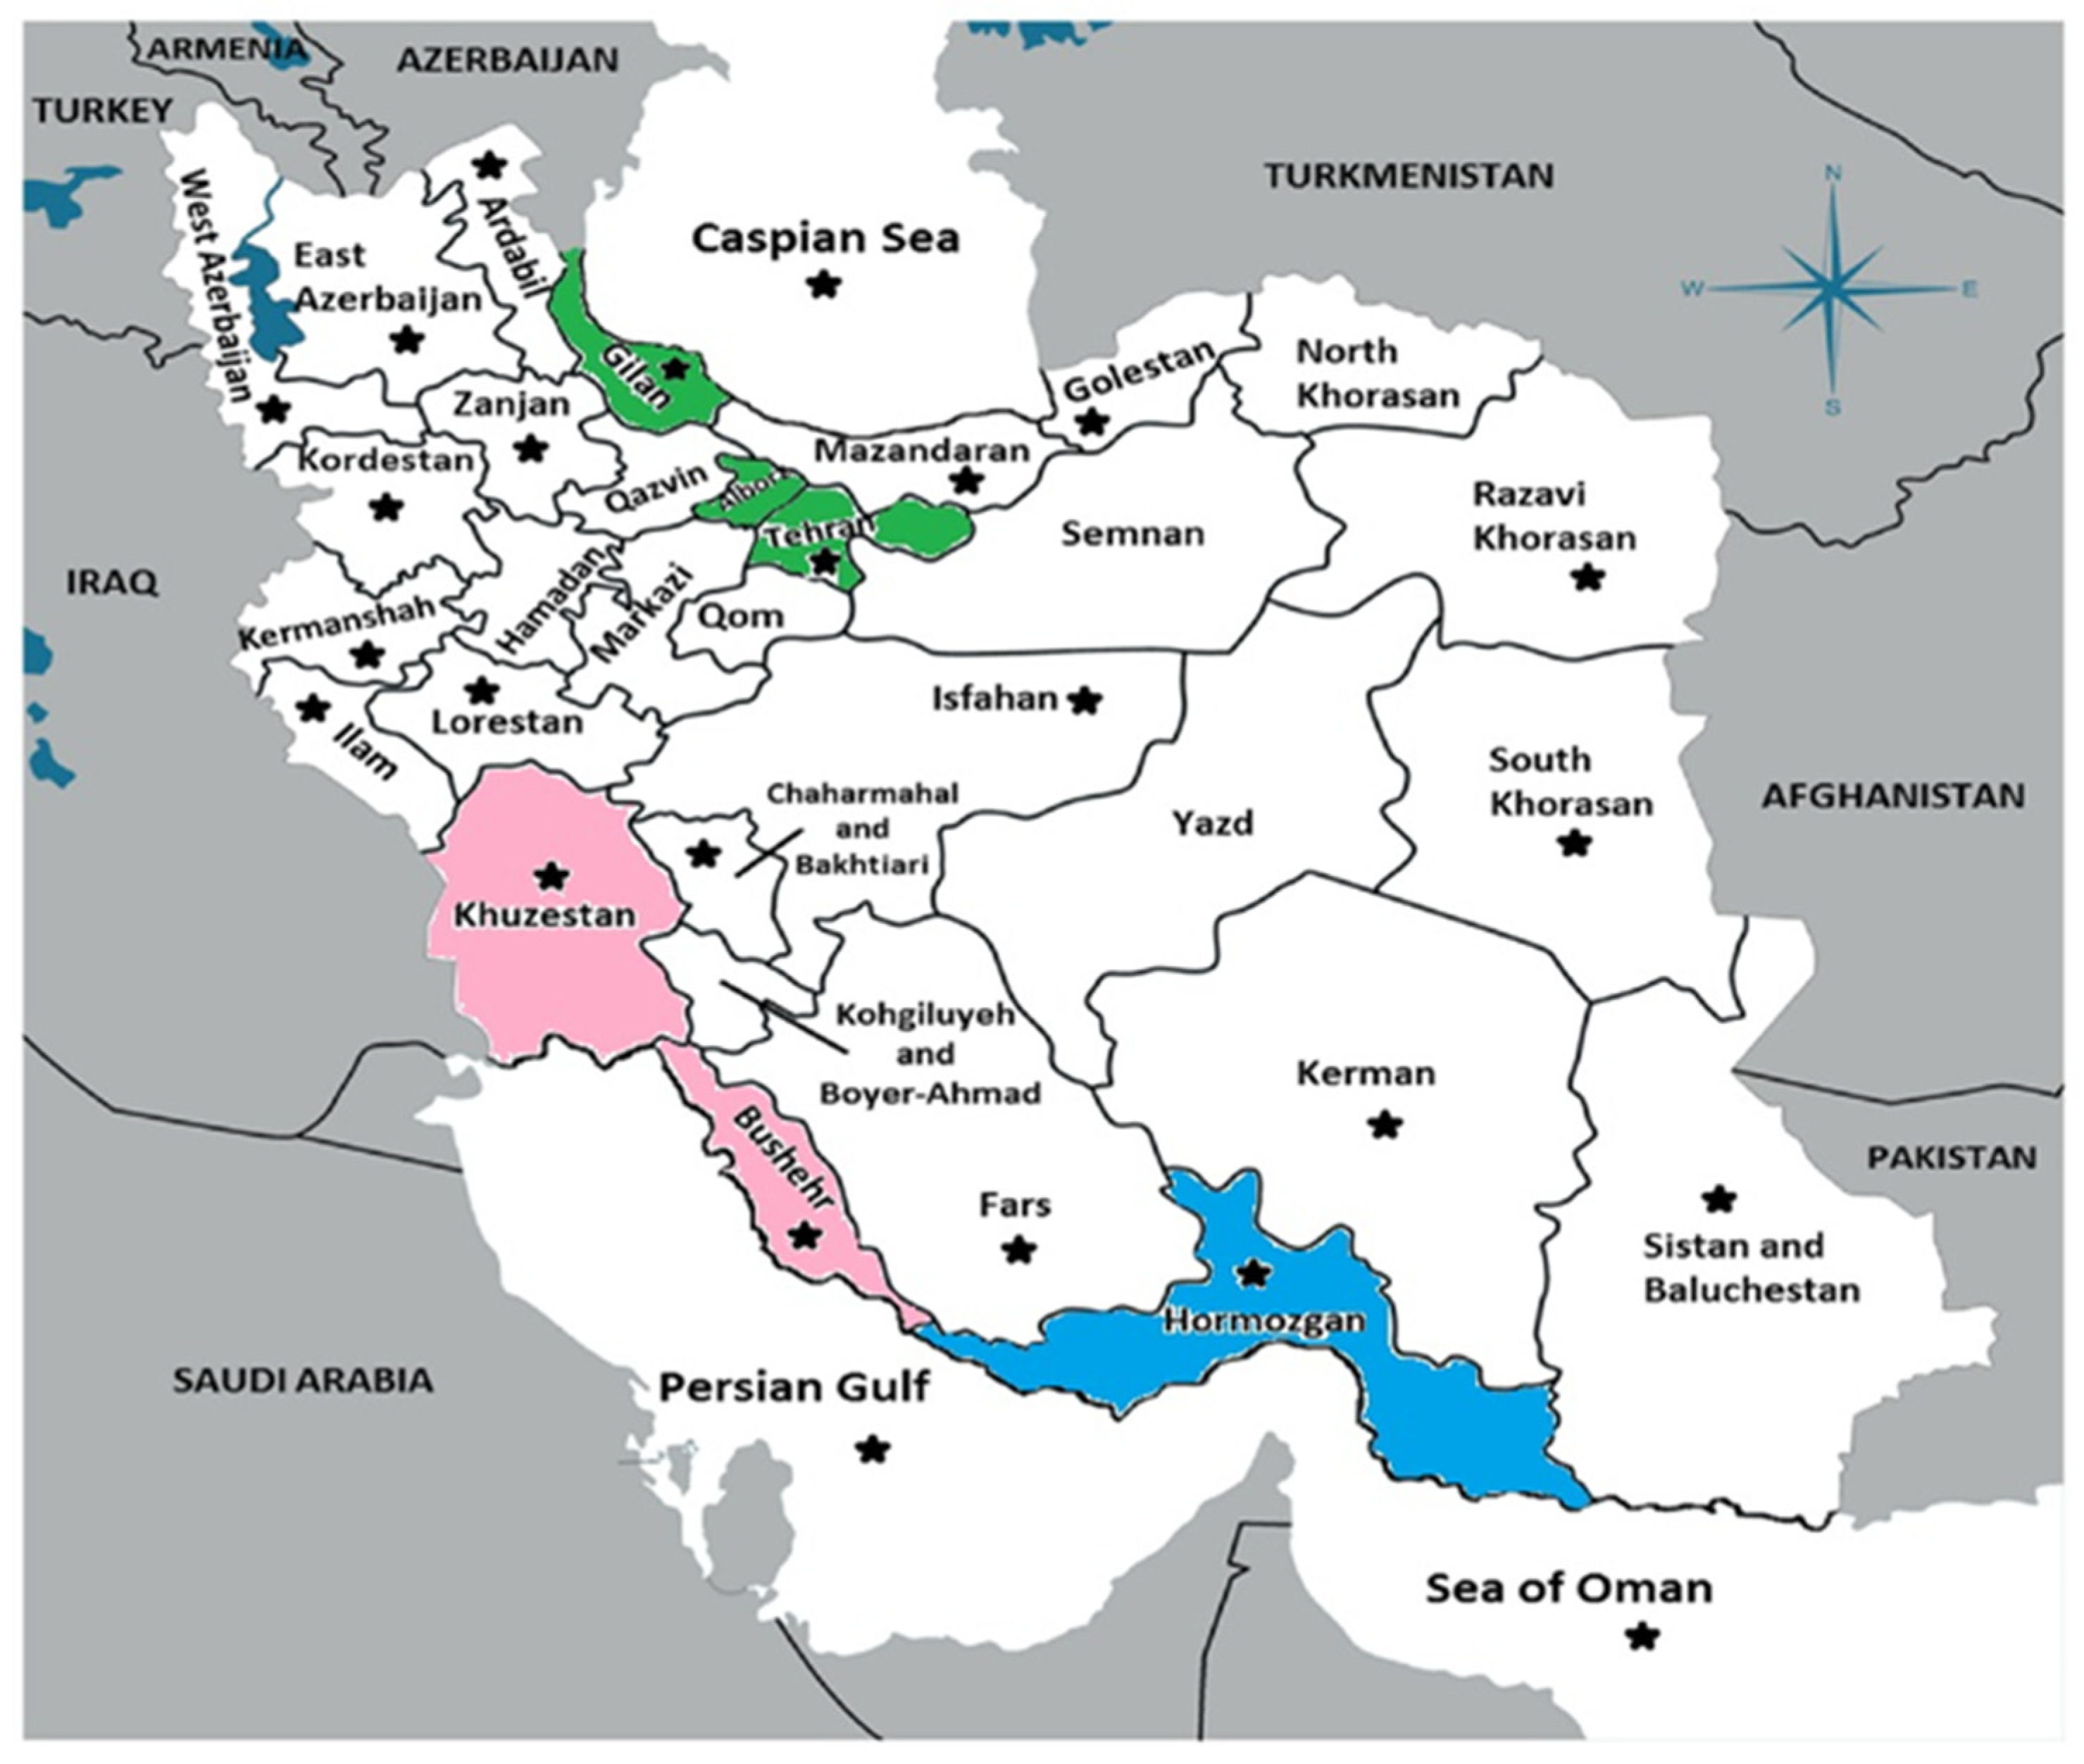
3.2. Selecting the Best Location for Establishing the Biodiesel Factory
3.2.1. Pair Comparison between Parameters and Targets
3.2.2. Pair Comparison between Options and Indicators
3.3. Processes Description
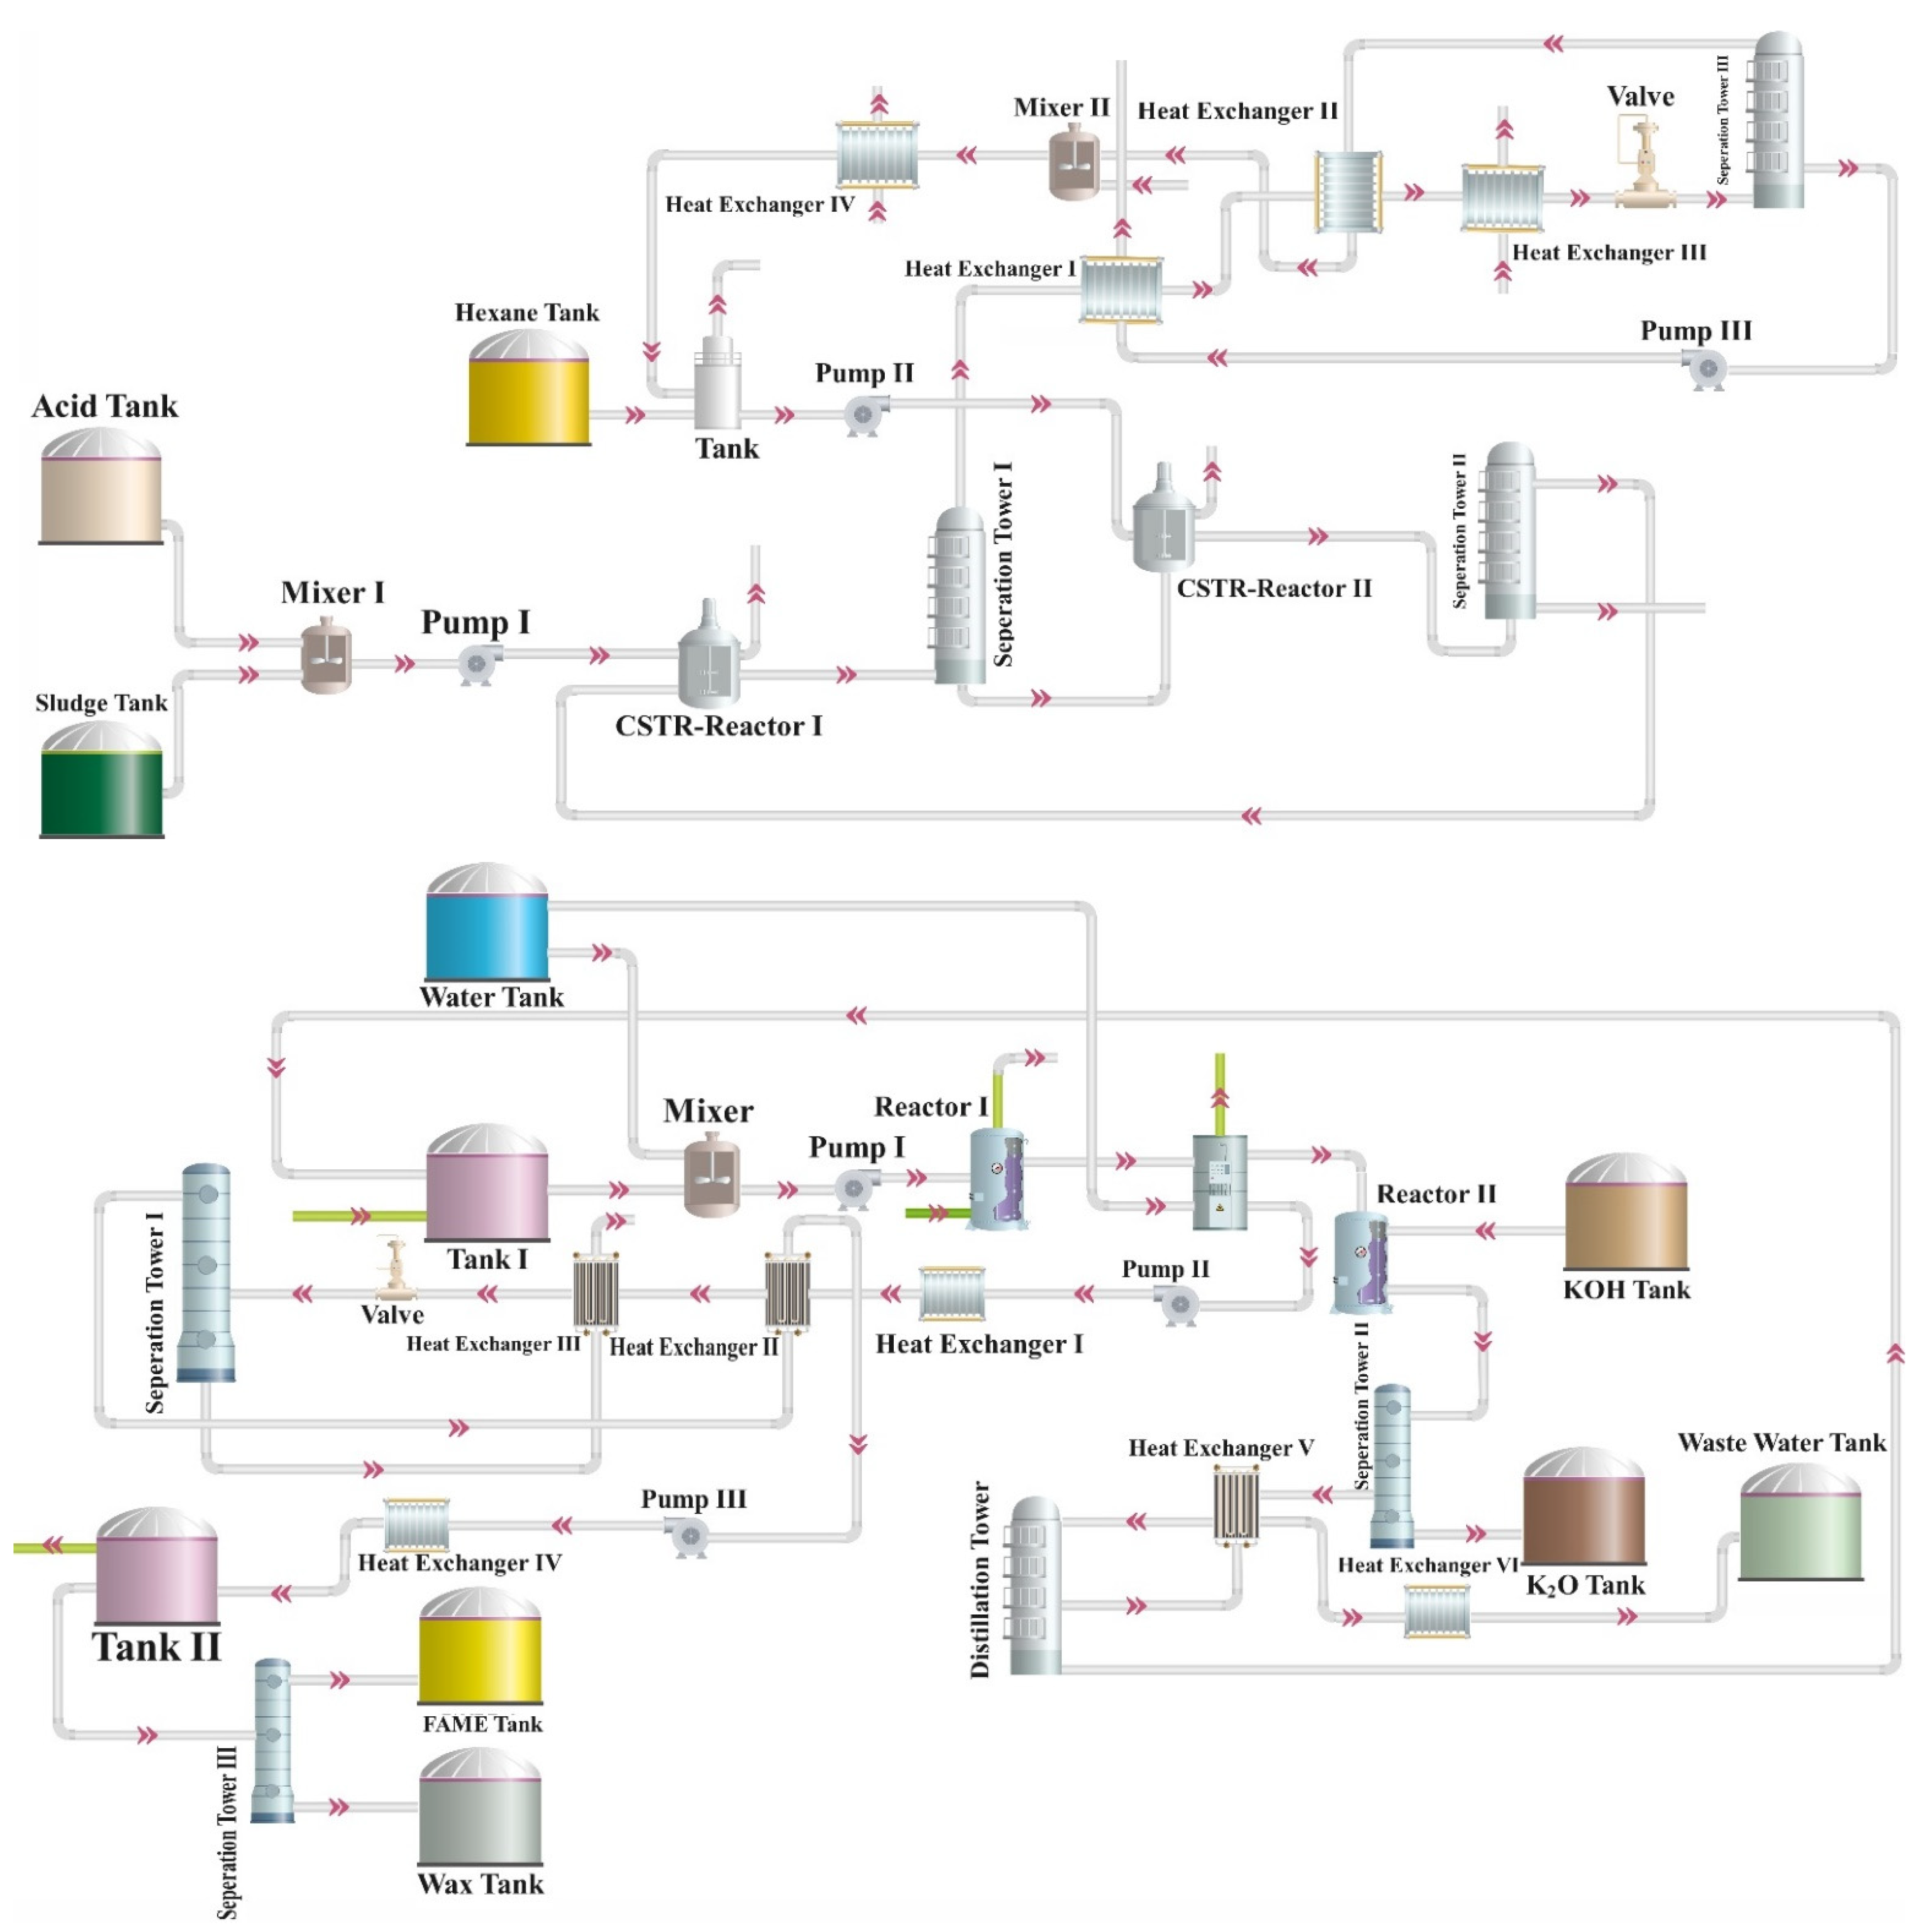
3.3.1. Biodiesel Production Process from Sewage Sludge
Lipid Extraction from Liquid Primary Sludge
Biodiesel Production
3.3.2. Biodiesel Production Process from Edible Oil Waste and Animal Fat
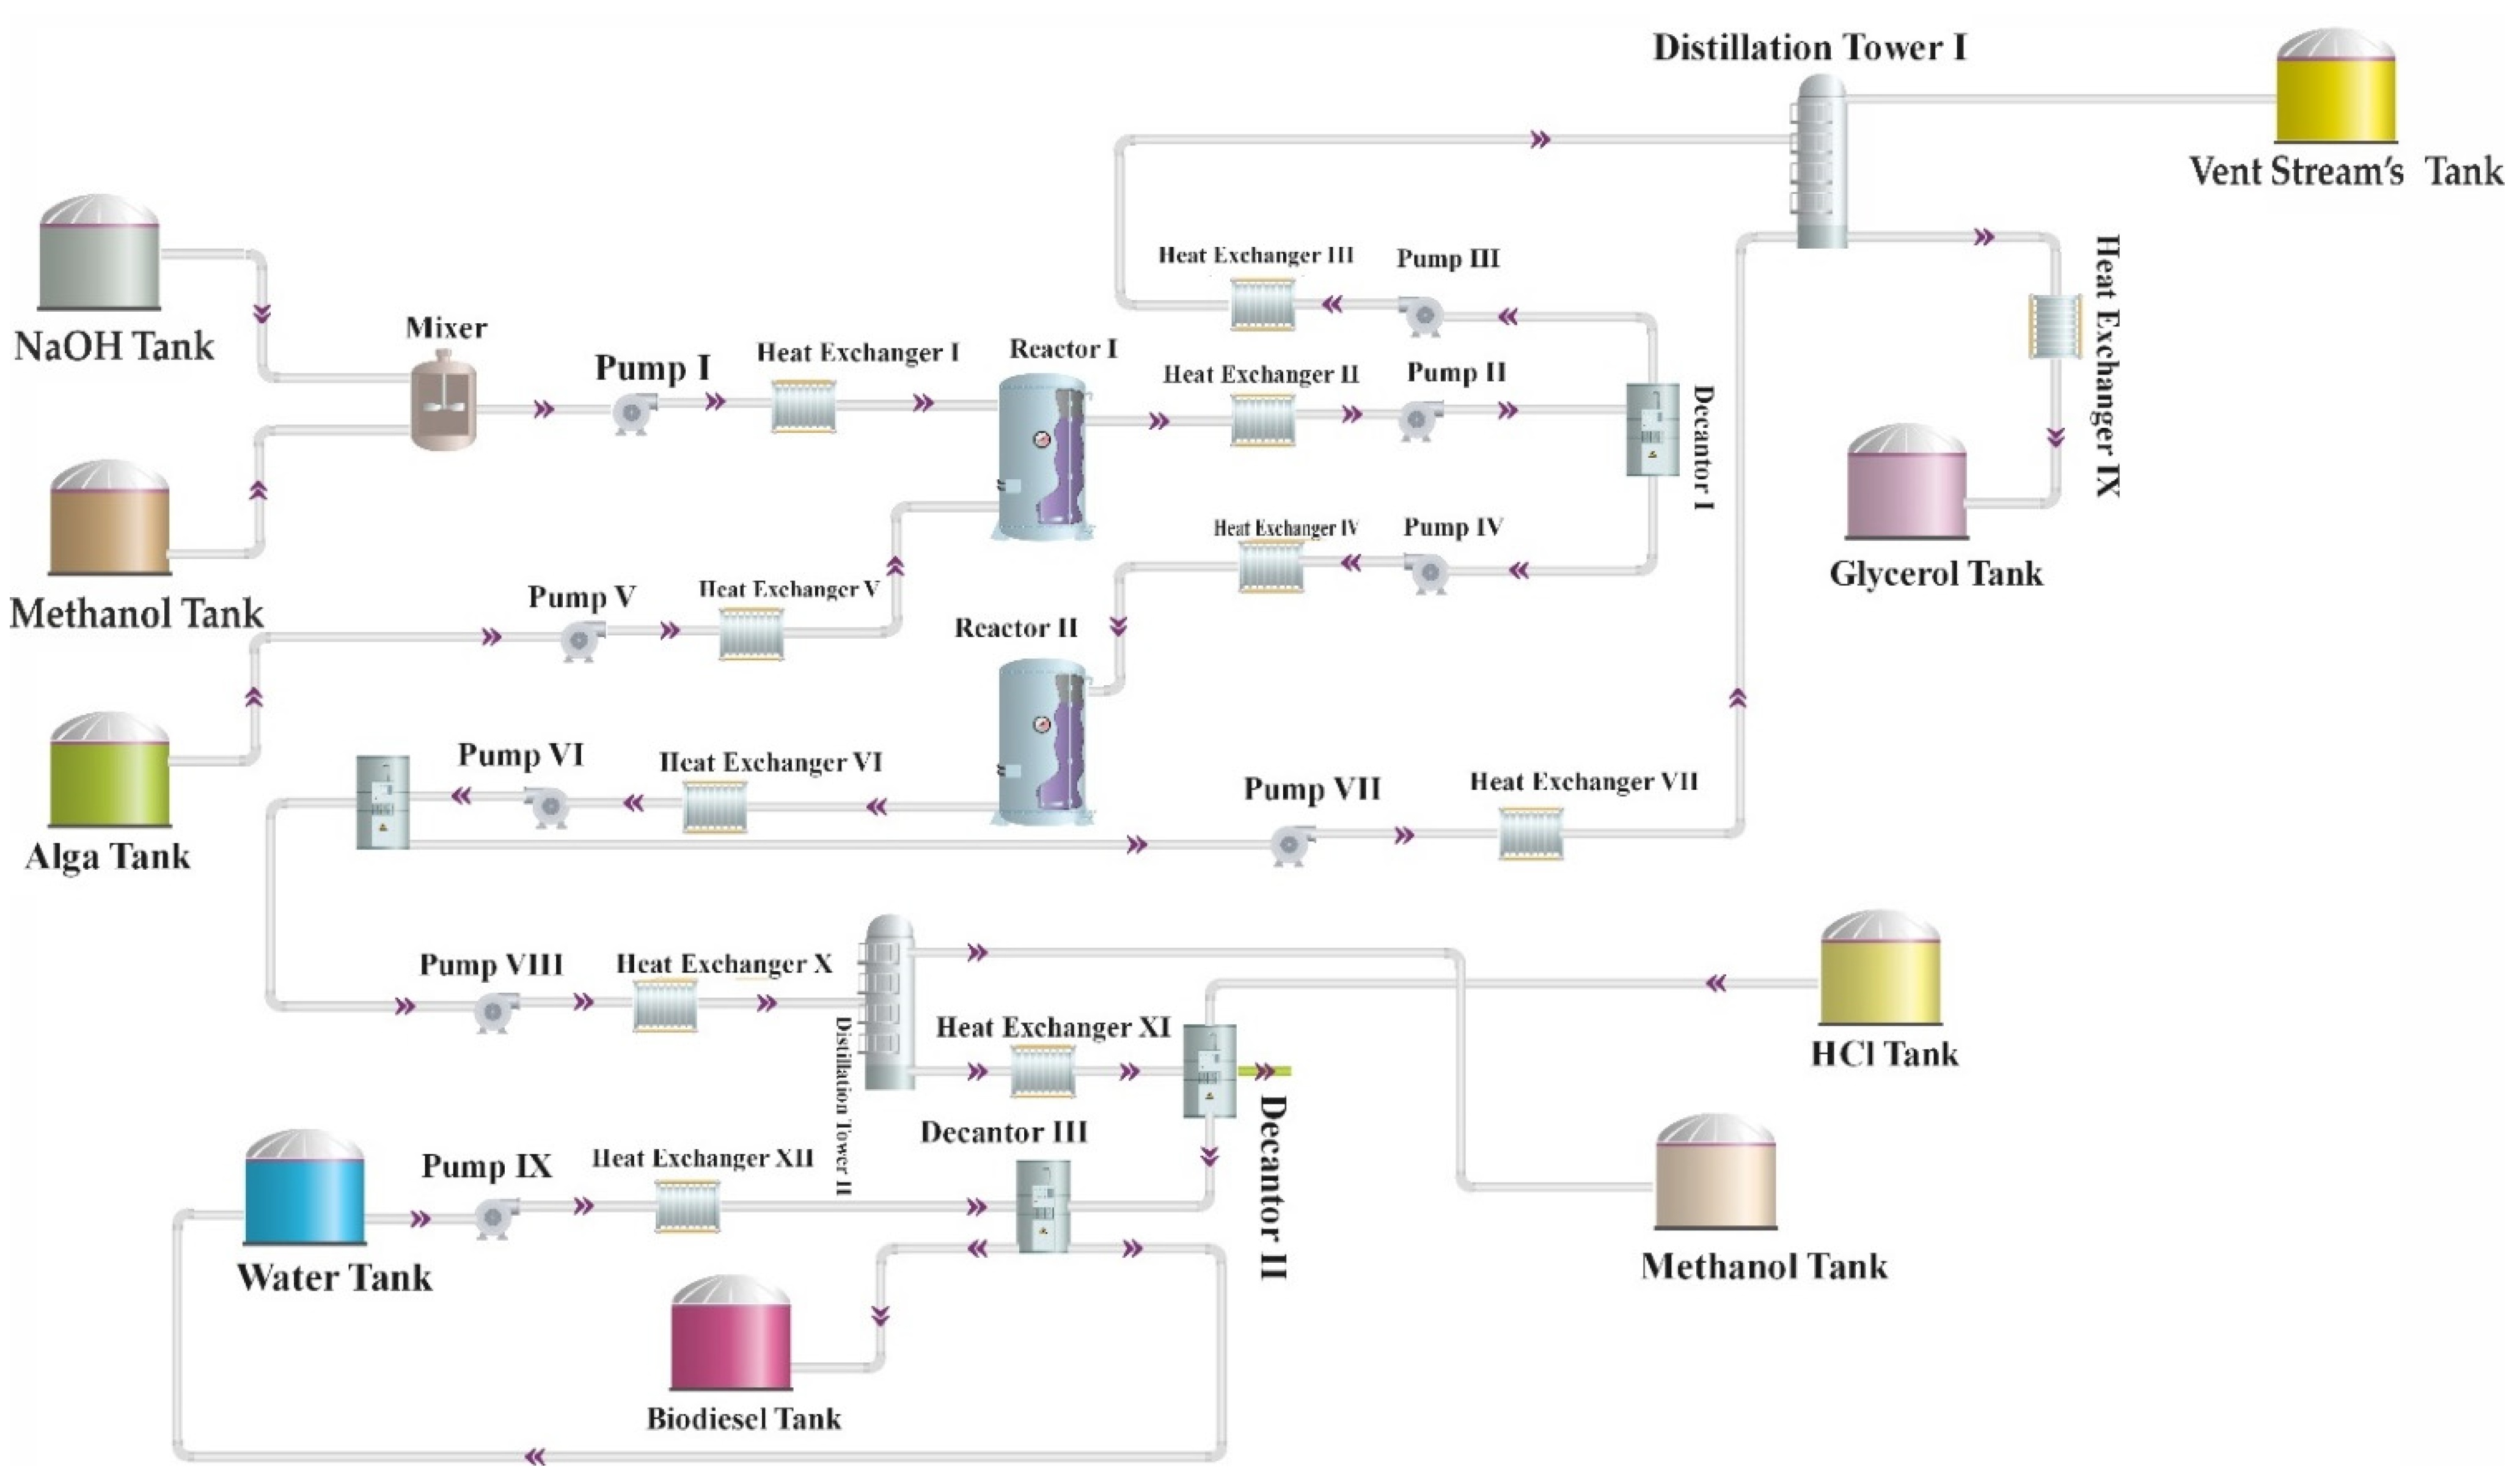
3.3.3. Biodiesel Production Process from Microalgae
Feedstock Composition
FAME and Glycerol Separation
Methanol Recovery
Alkali Removal
Water Washing (FAME Purification)
Glycerol Purification
3.4. Economic Evaluation of the Construction of a Biodiesel Production Plant from Various Types of Waste
3.4.1. Economic Evaluation of Biodiesel Production from Sludge
Fixed Investment Costs
Total Manufacturing Cost
3.4.2. Economic Evaluation of Biodiesel Production from Edible Waste Oil
Fixed Investment Costs
Total Manufacturing Cost
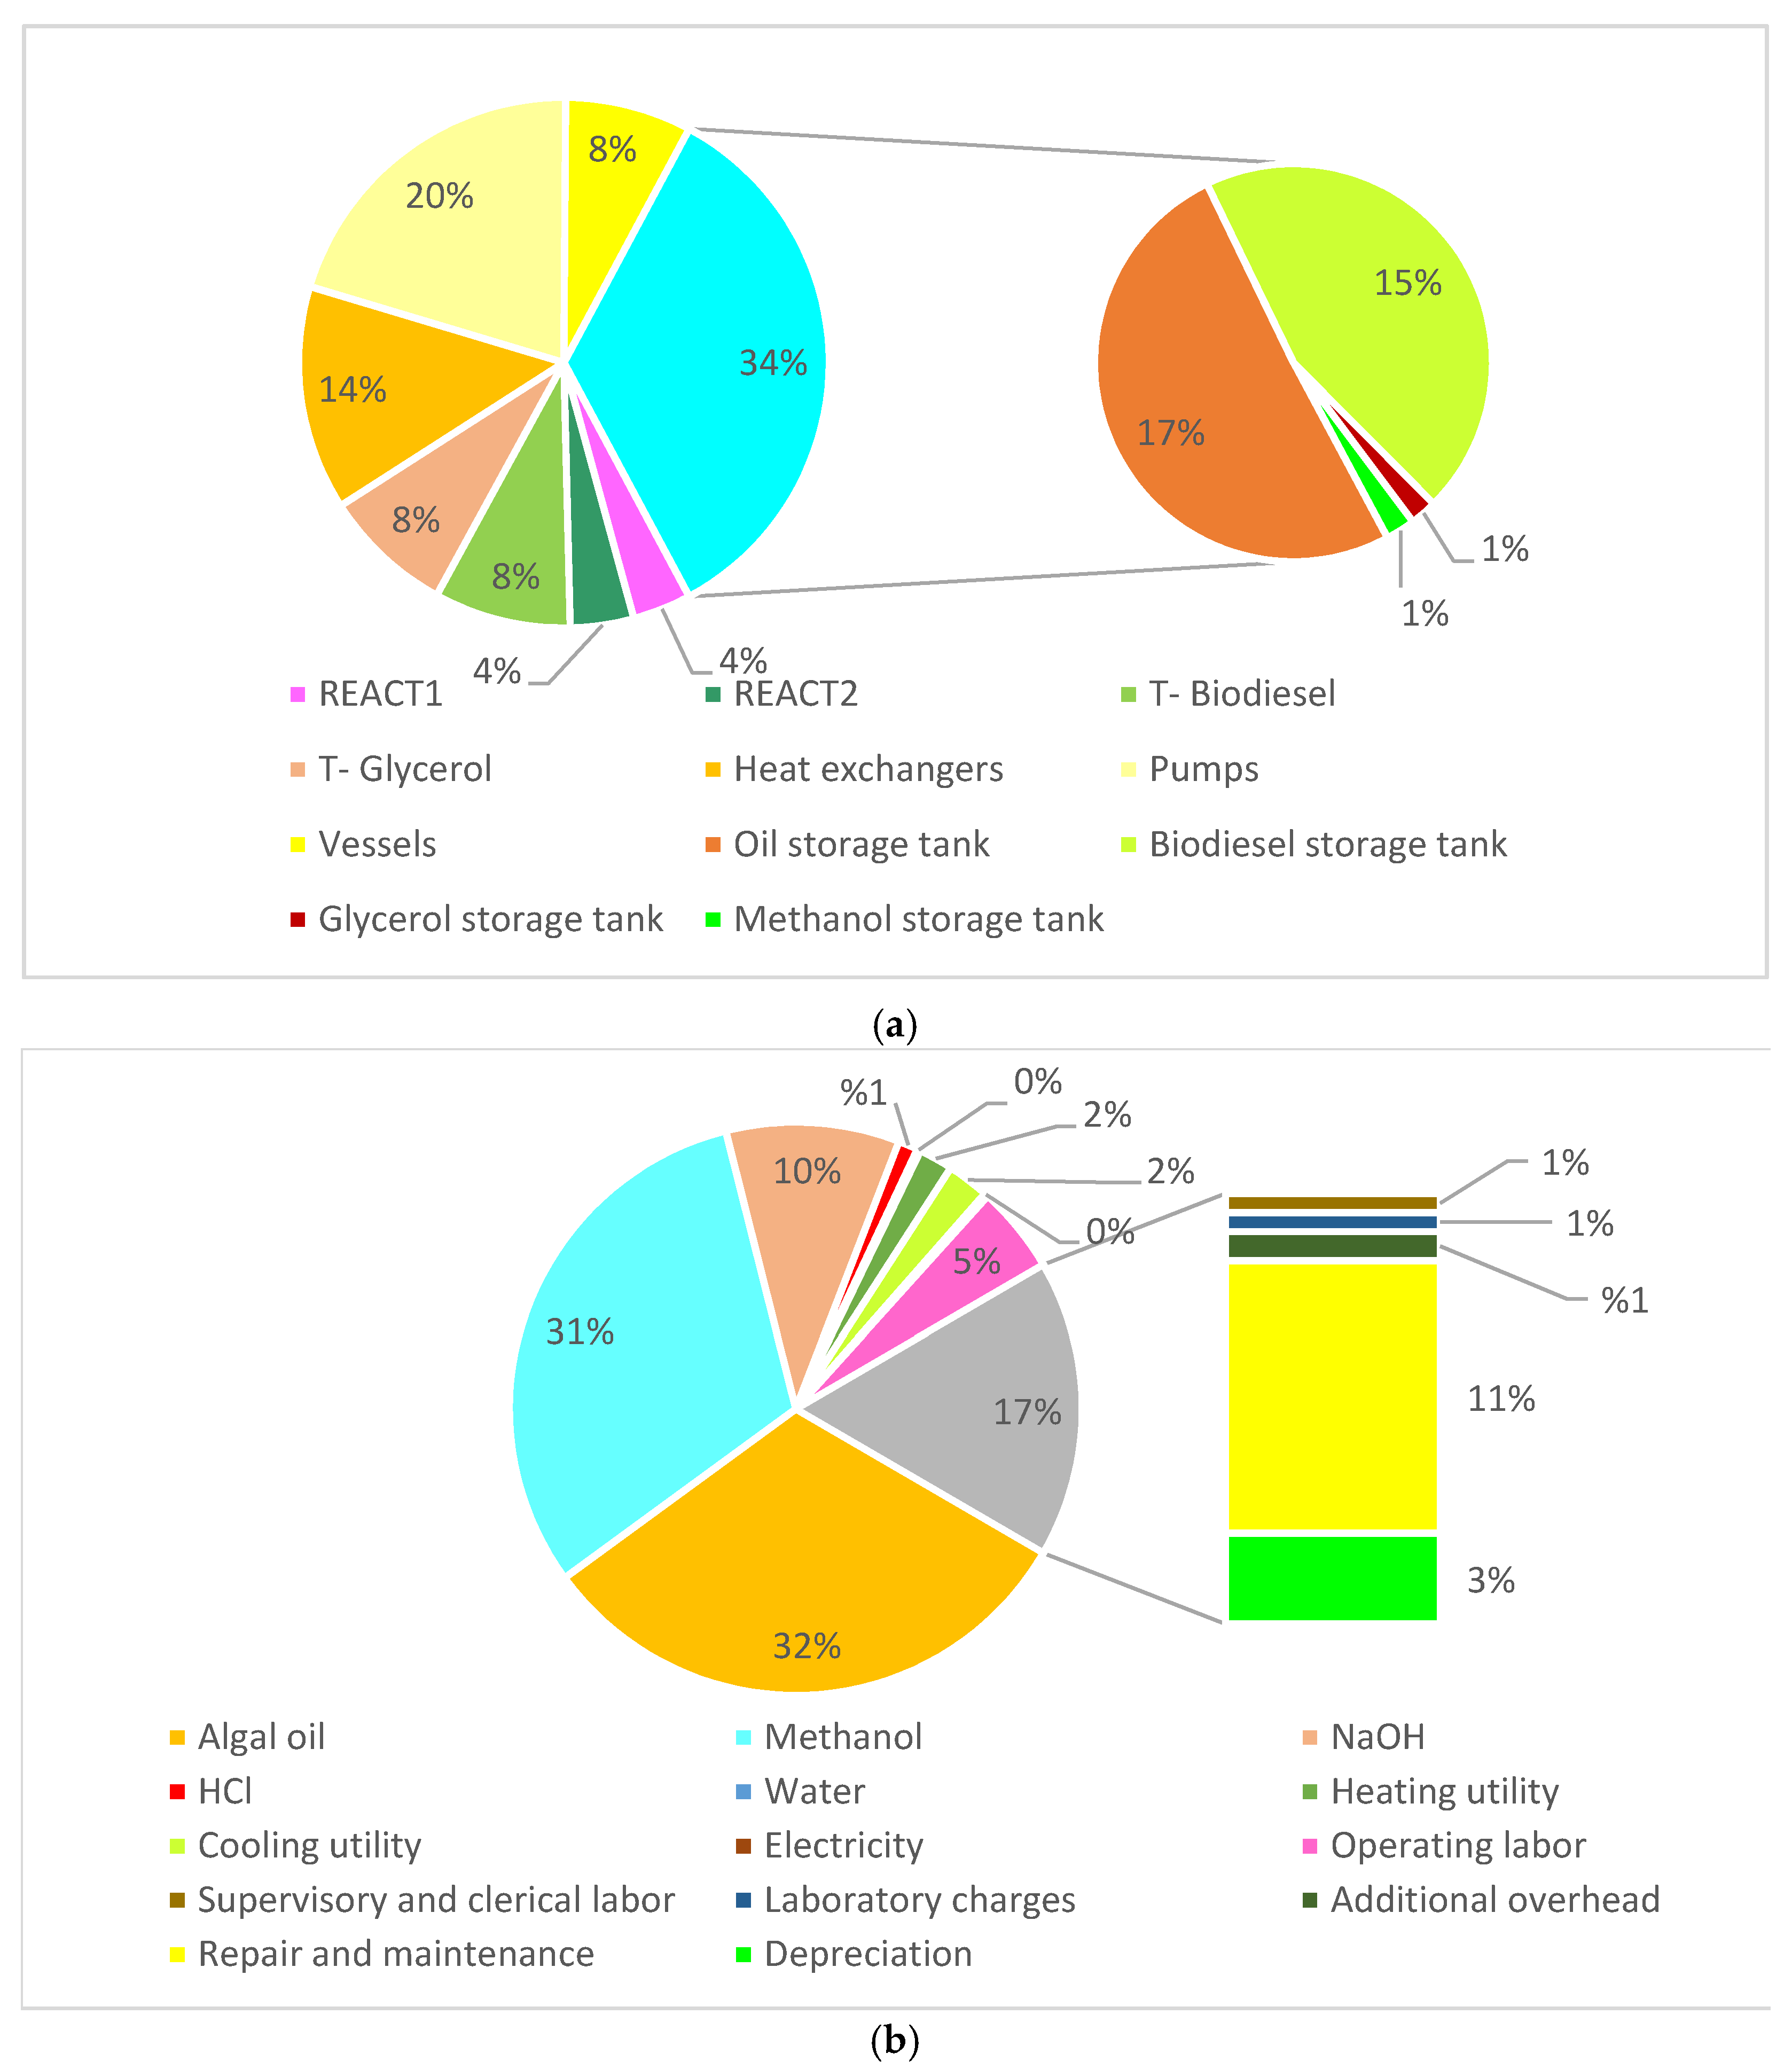
3.4.3. Economic Evaluation of Biodiesel Production from Microalgae
Fixed Investment Costs
Total Manufacturing Cost
3.5. Break-Even Prices
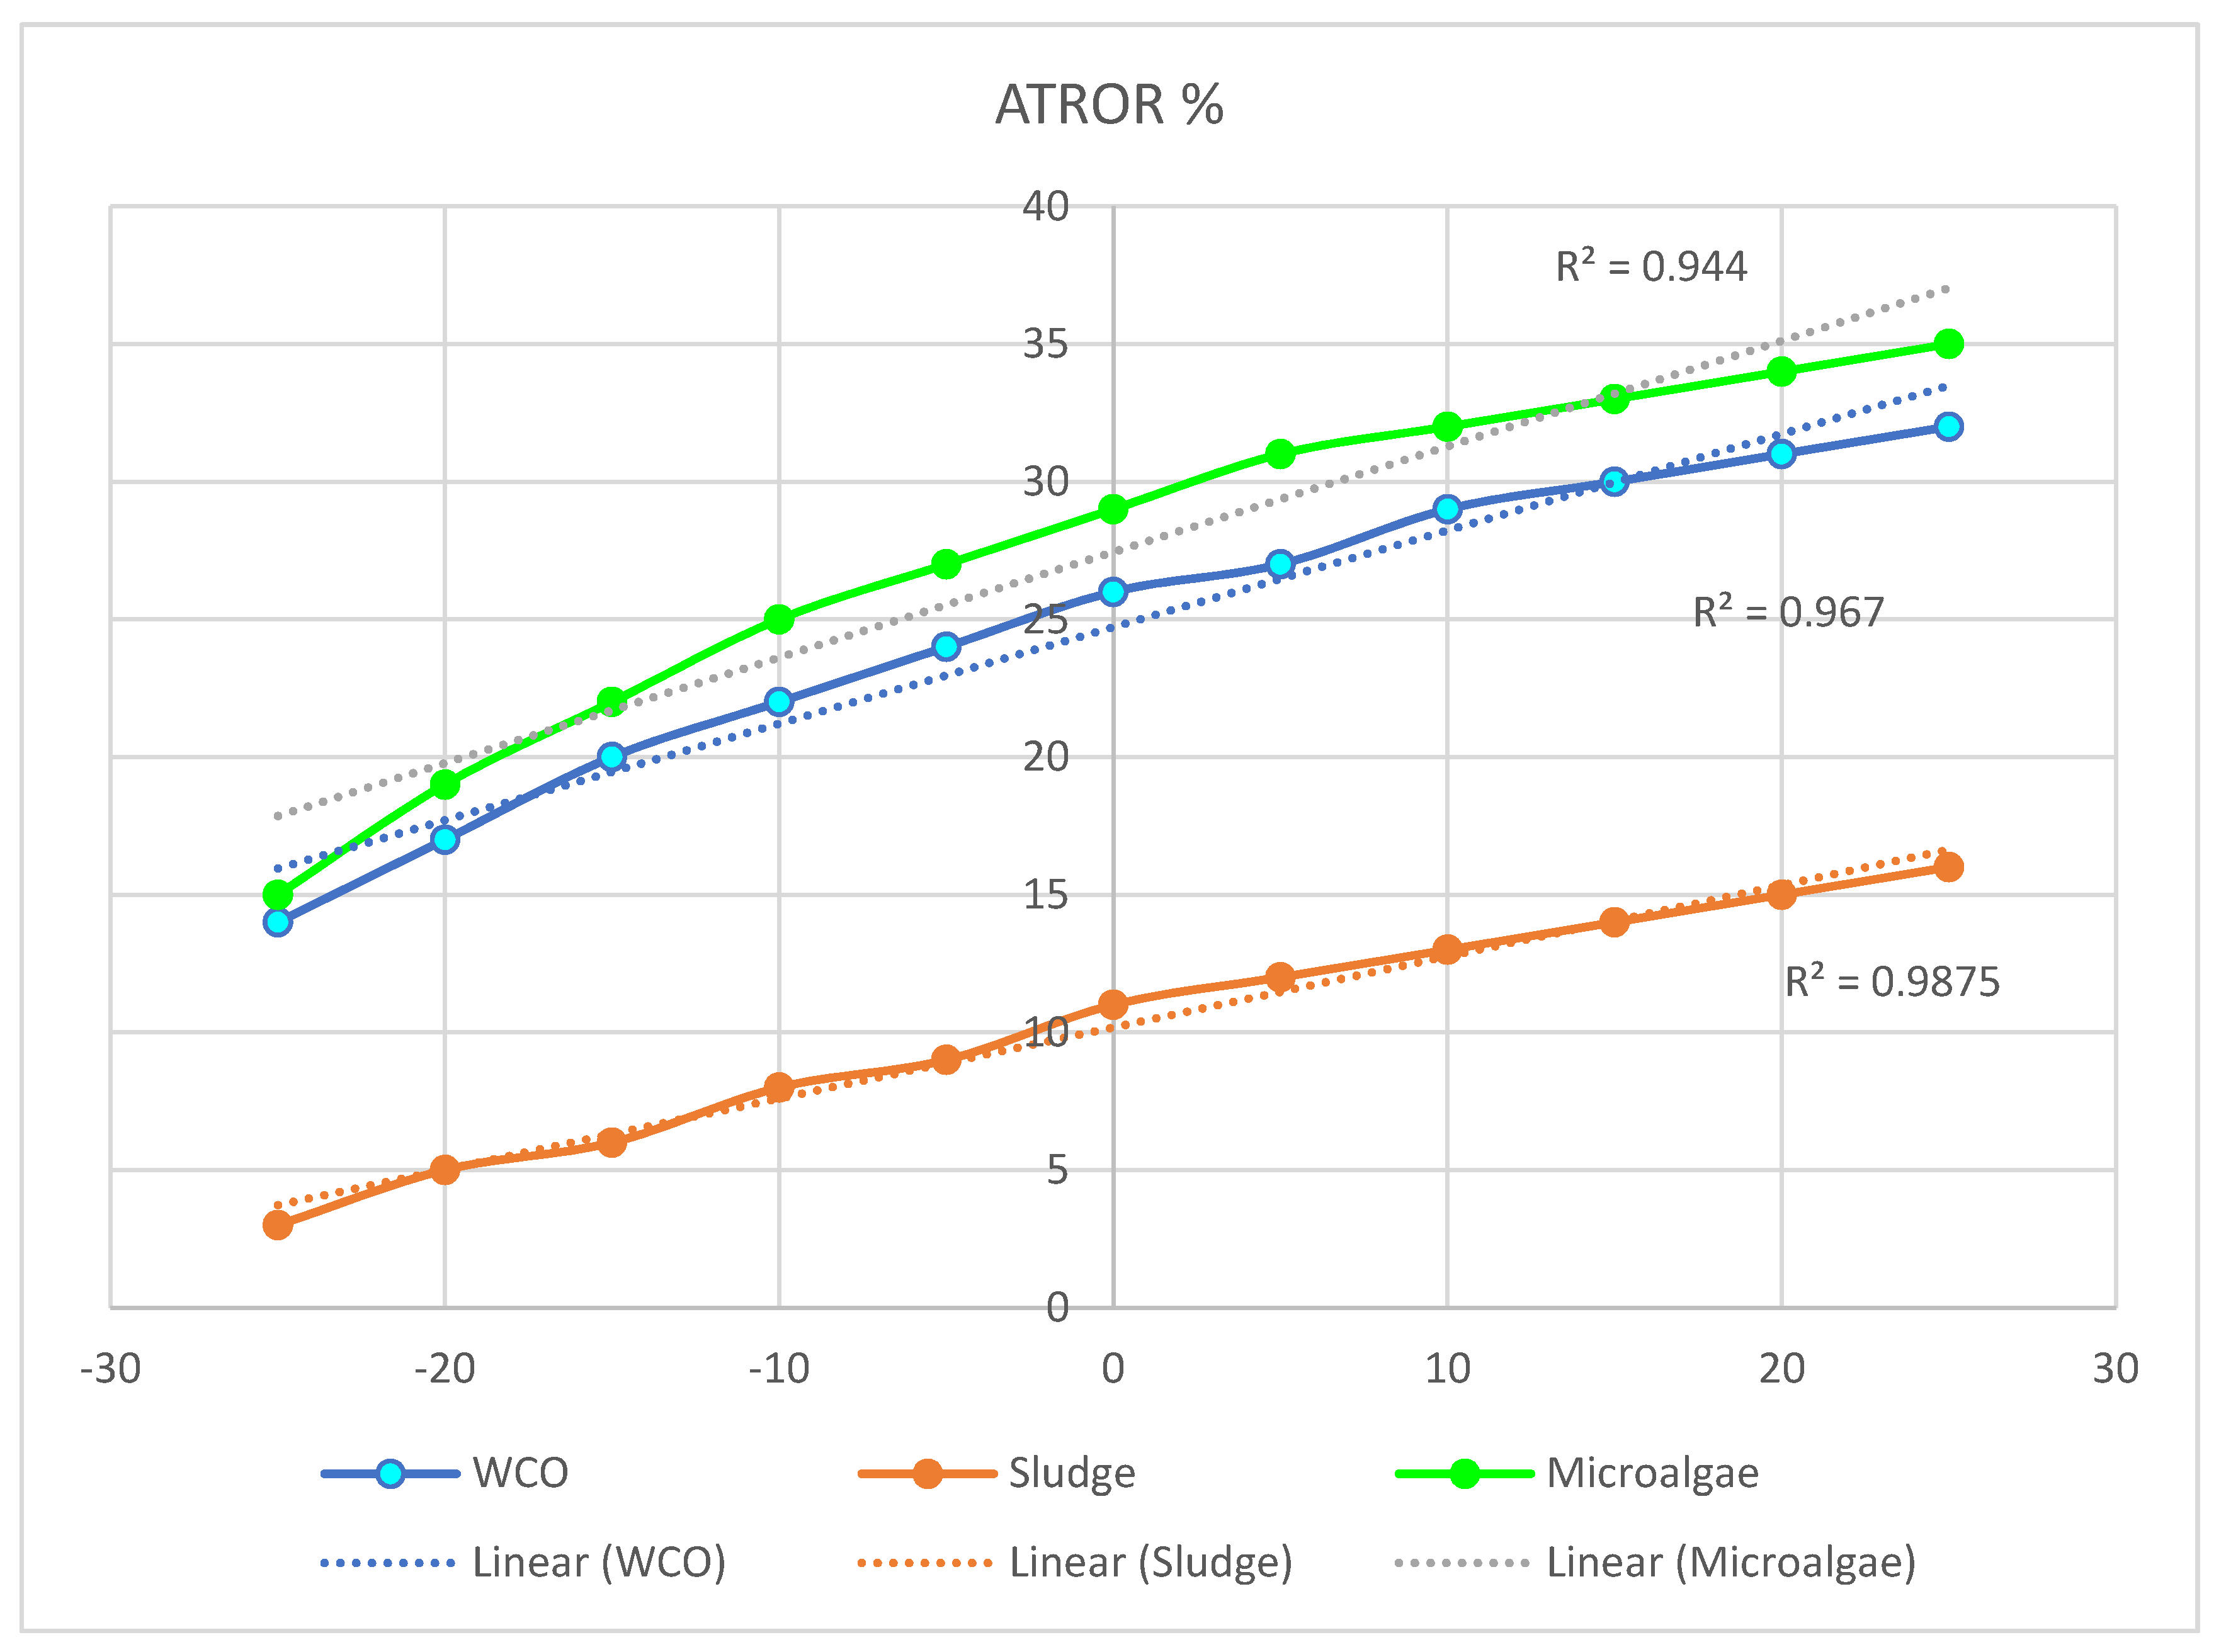
3.6. ATROR
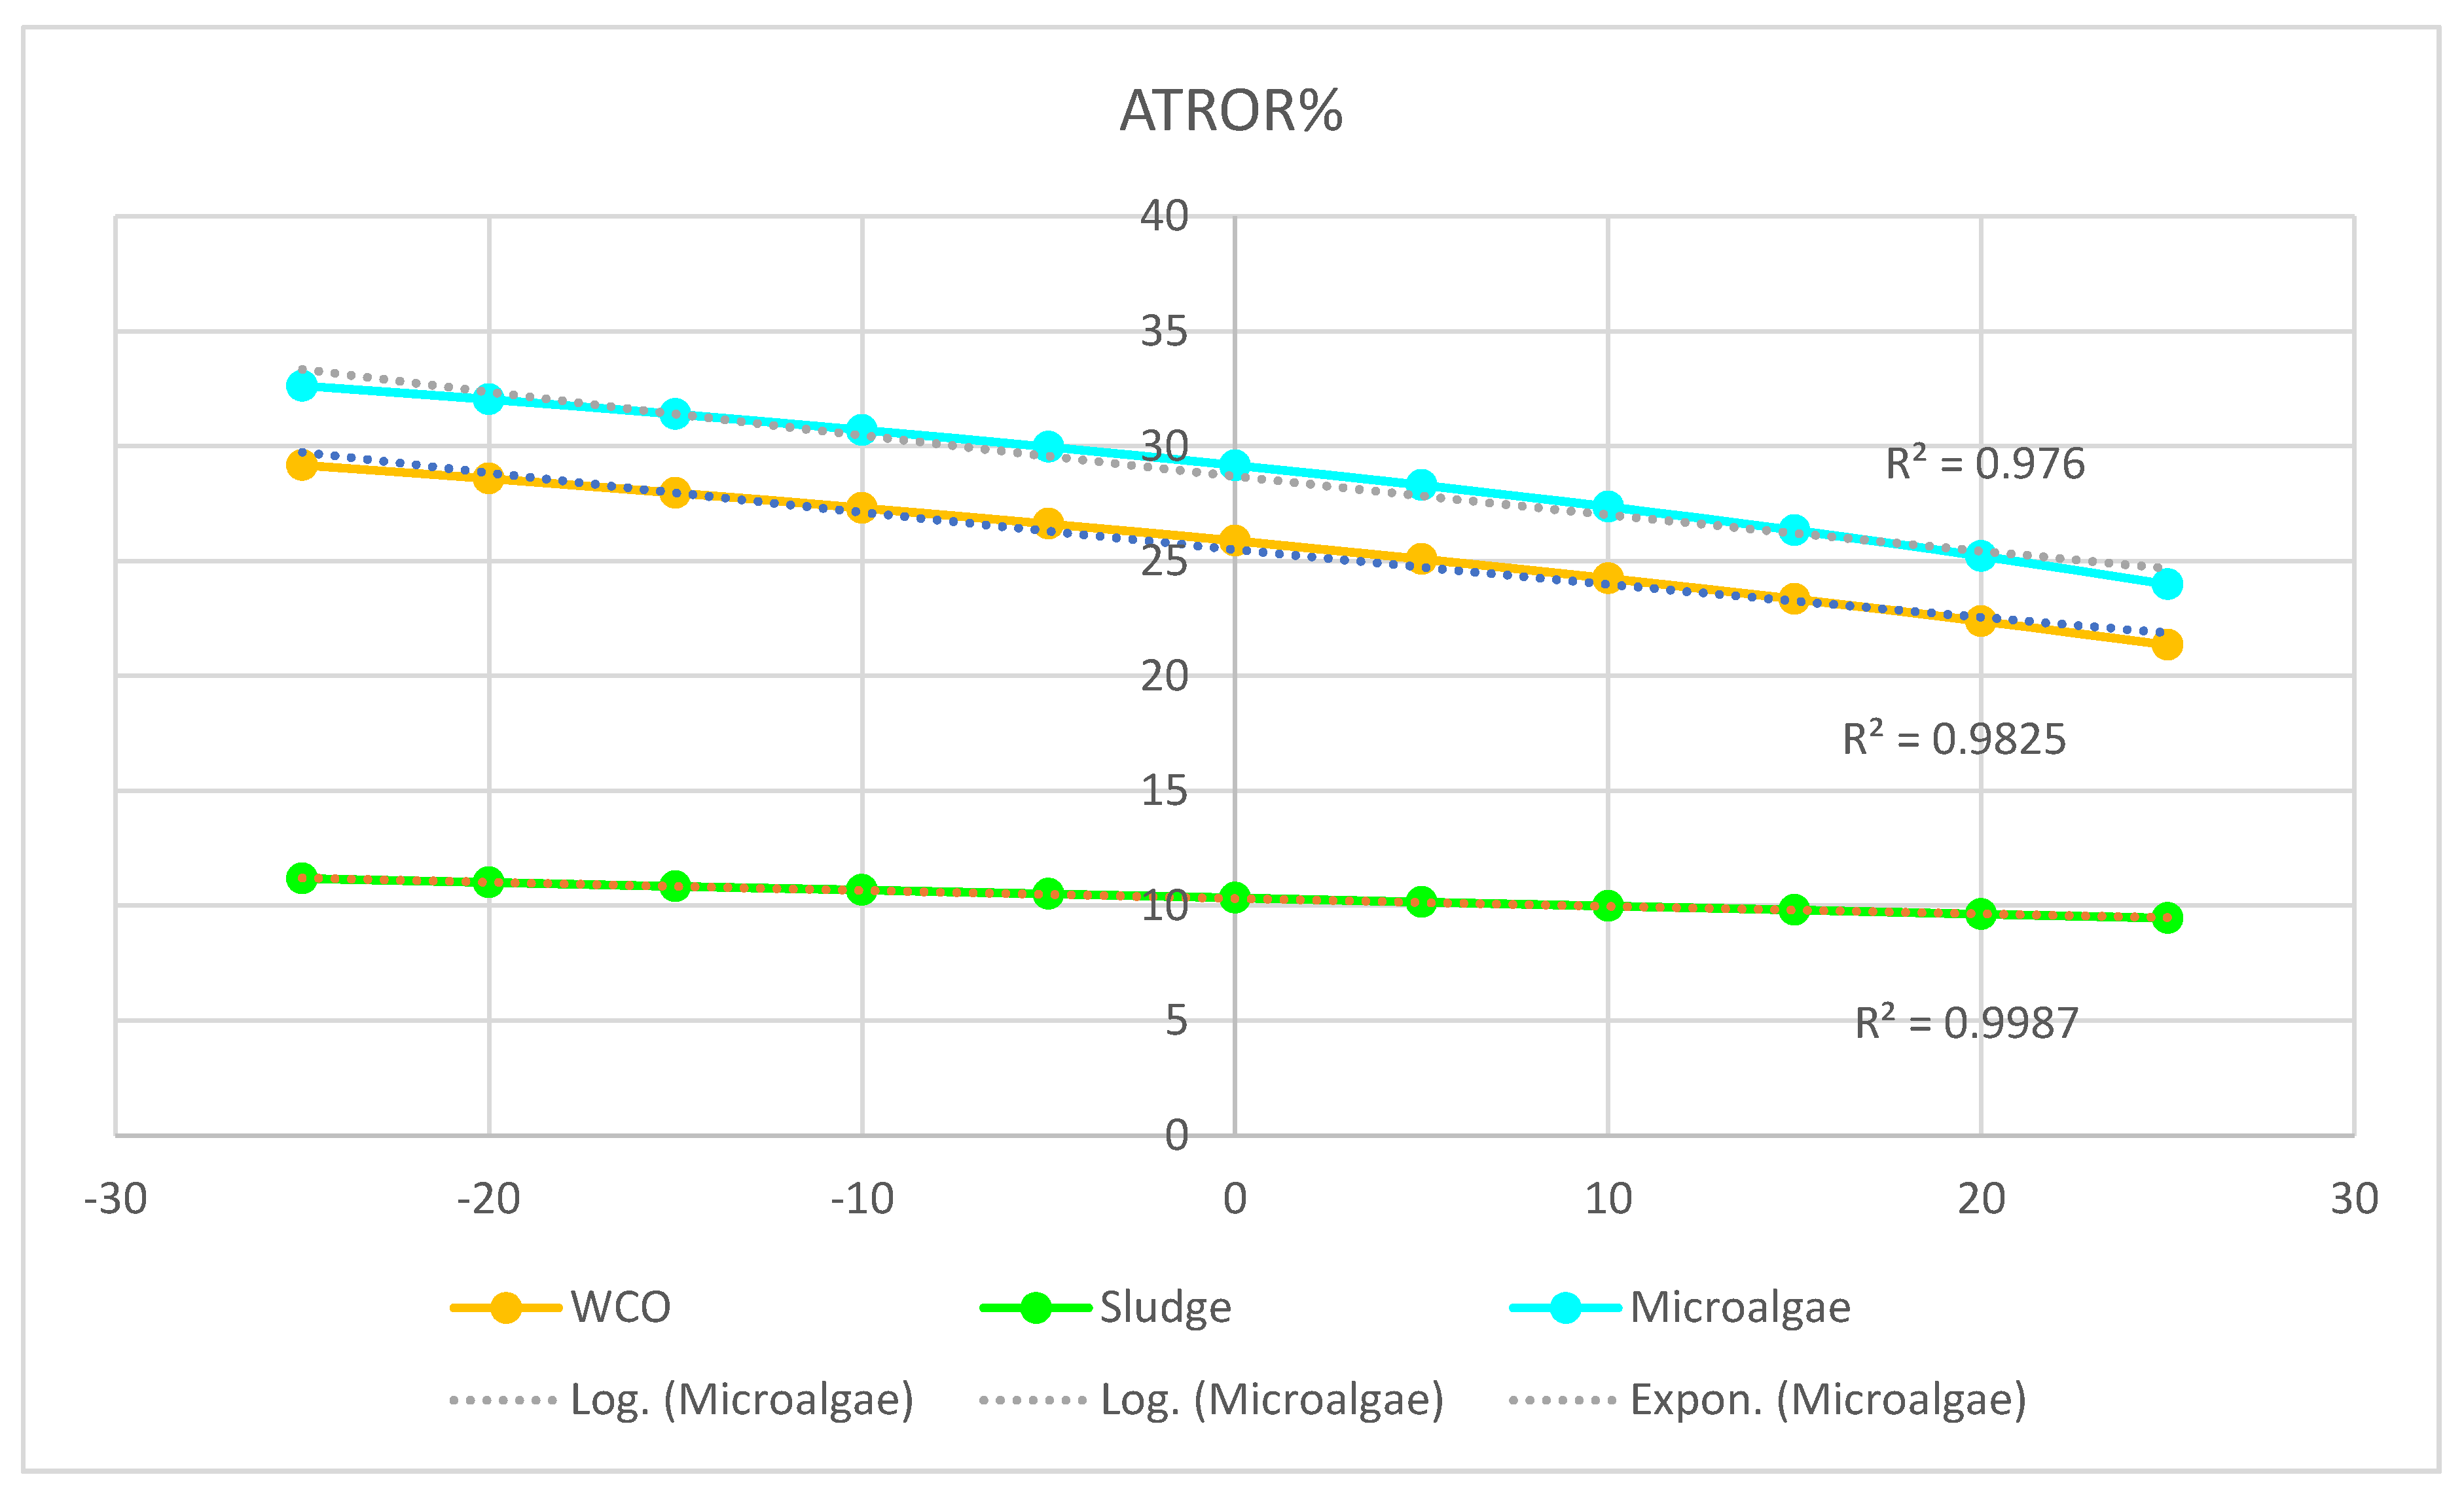
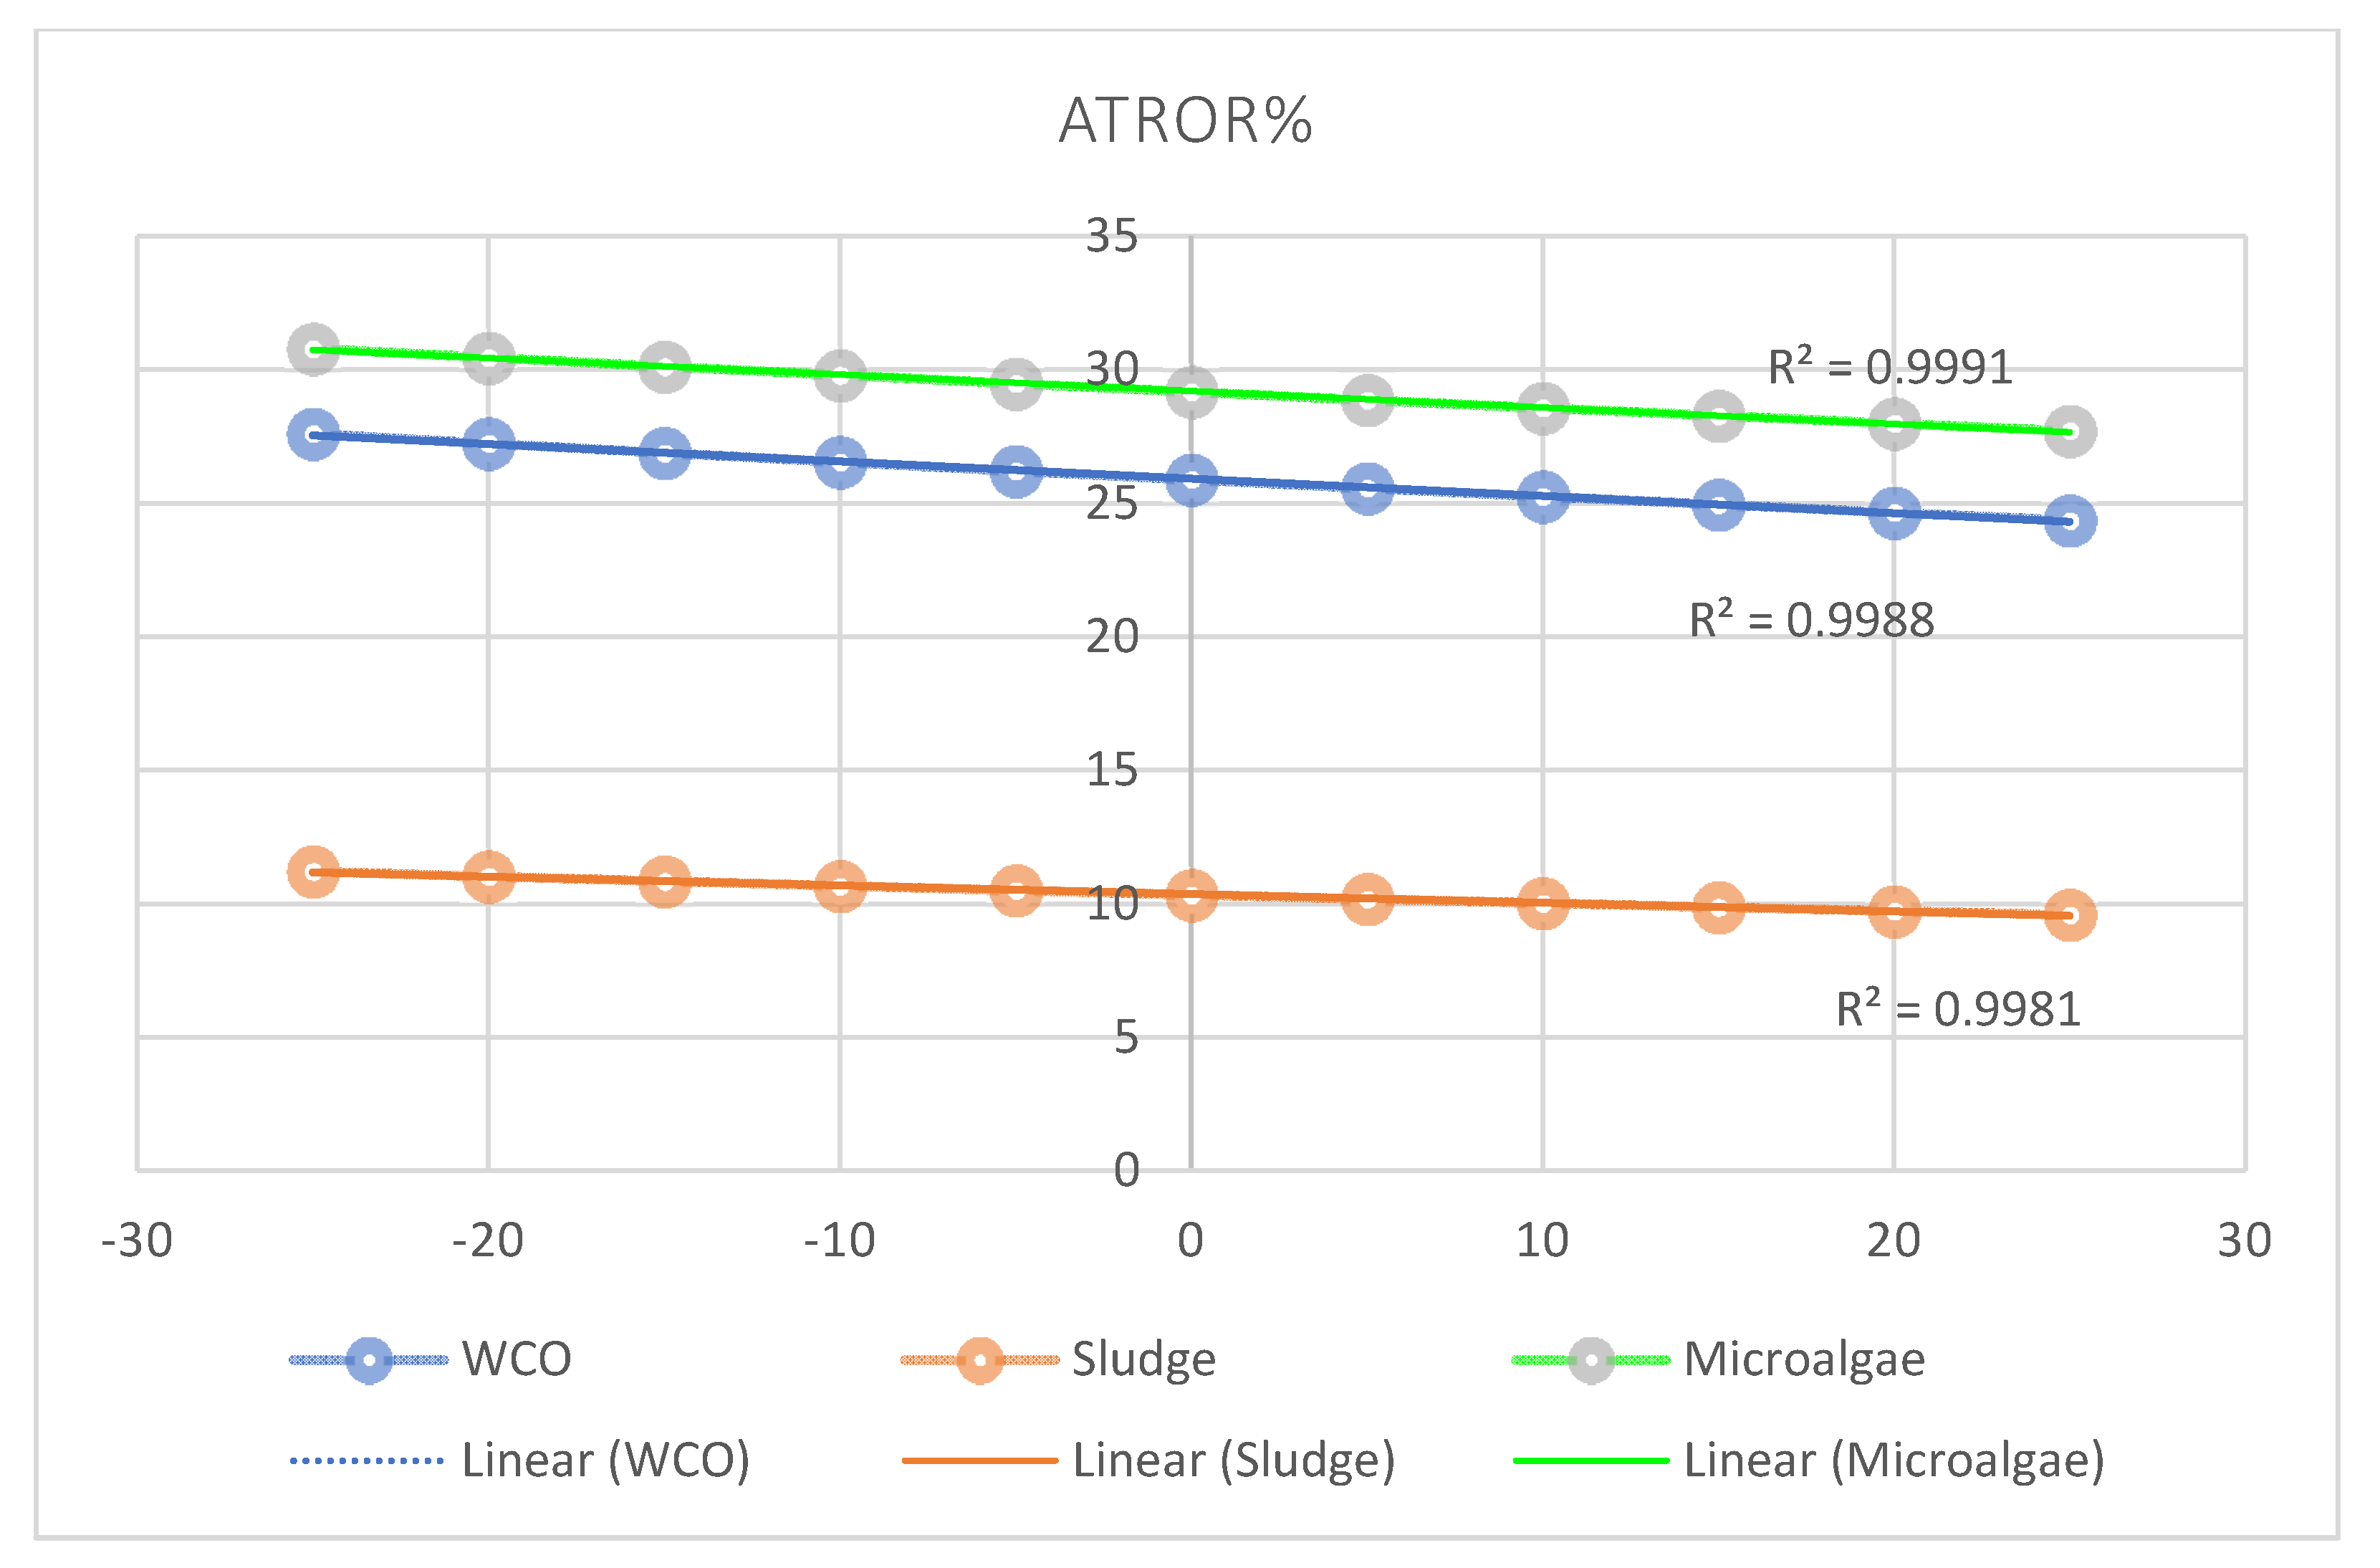
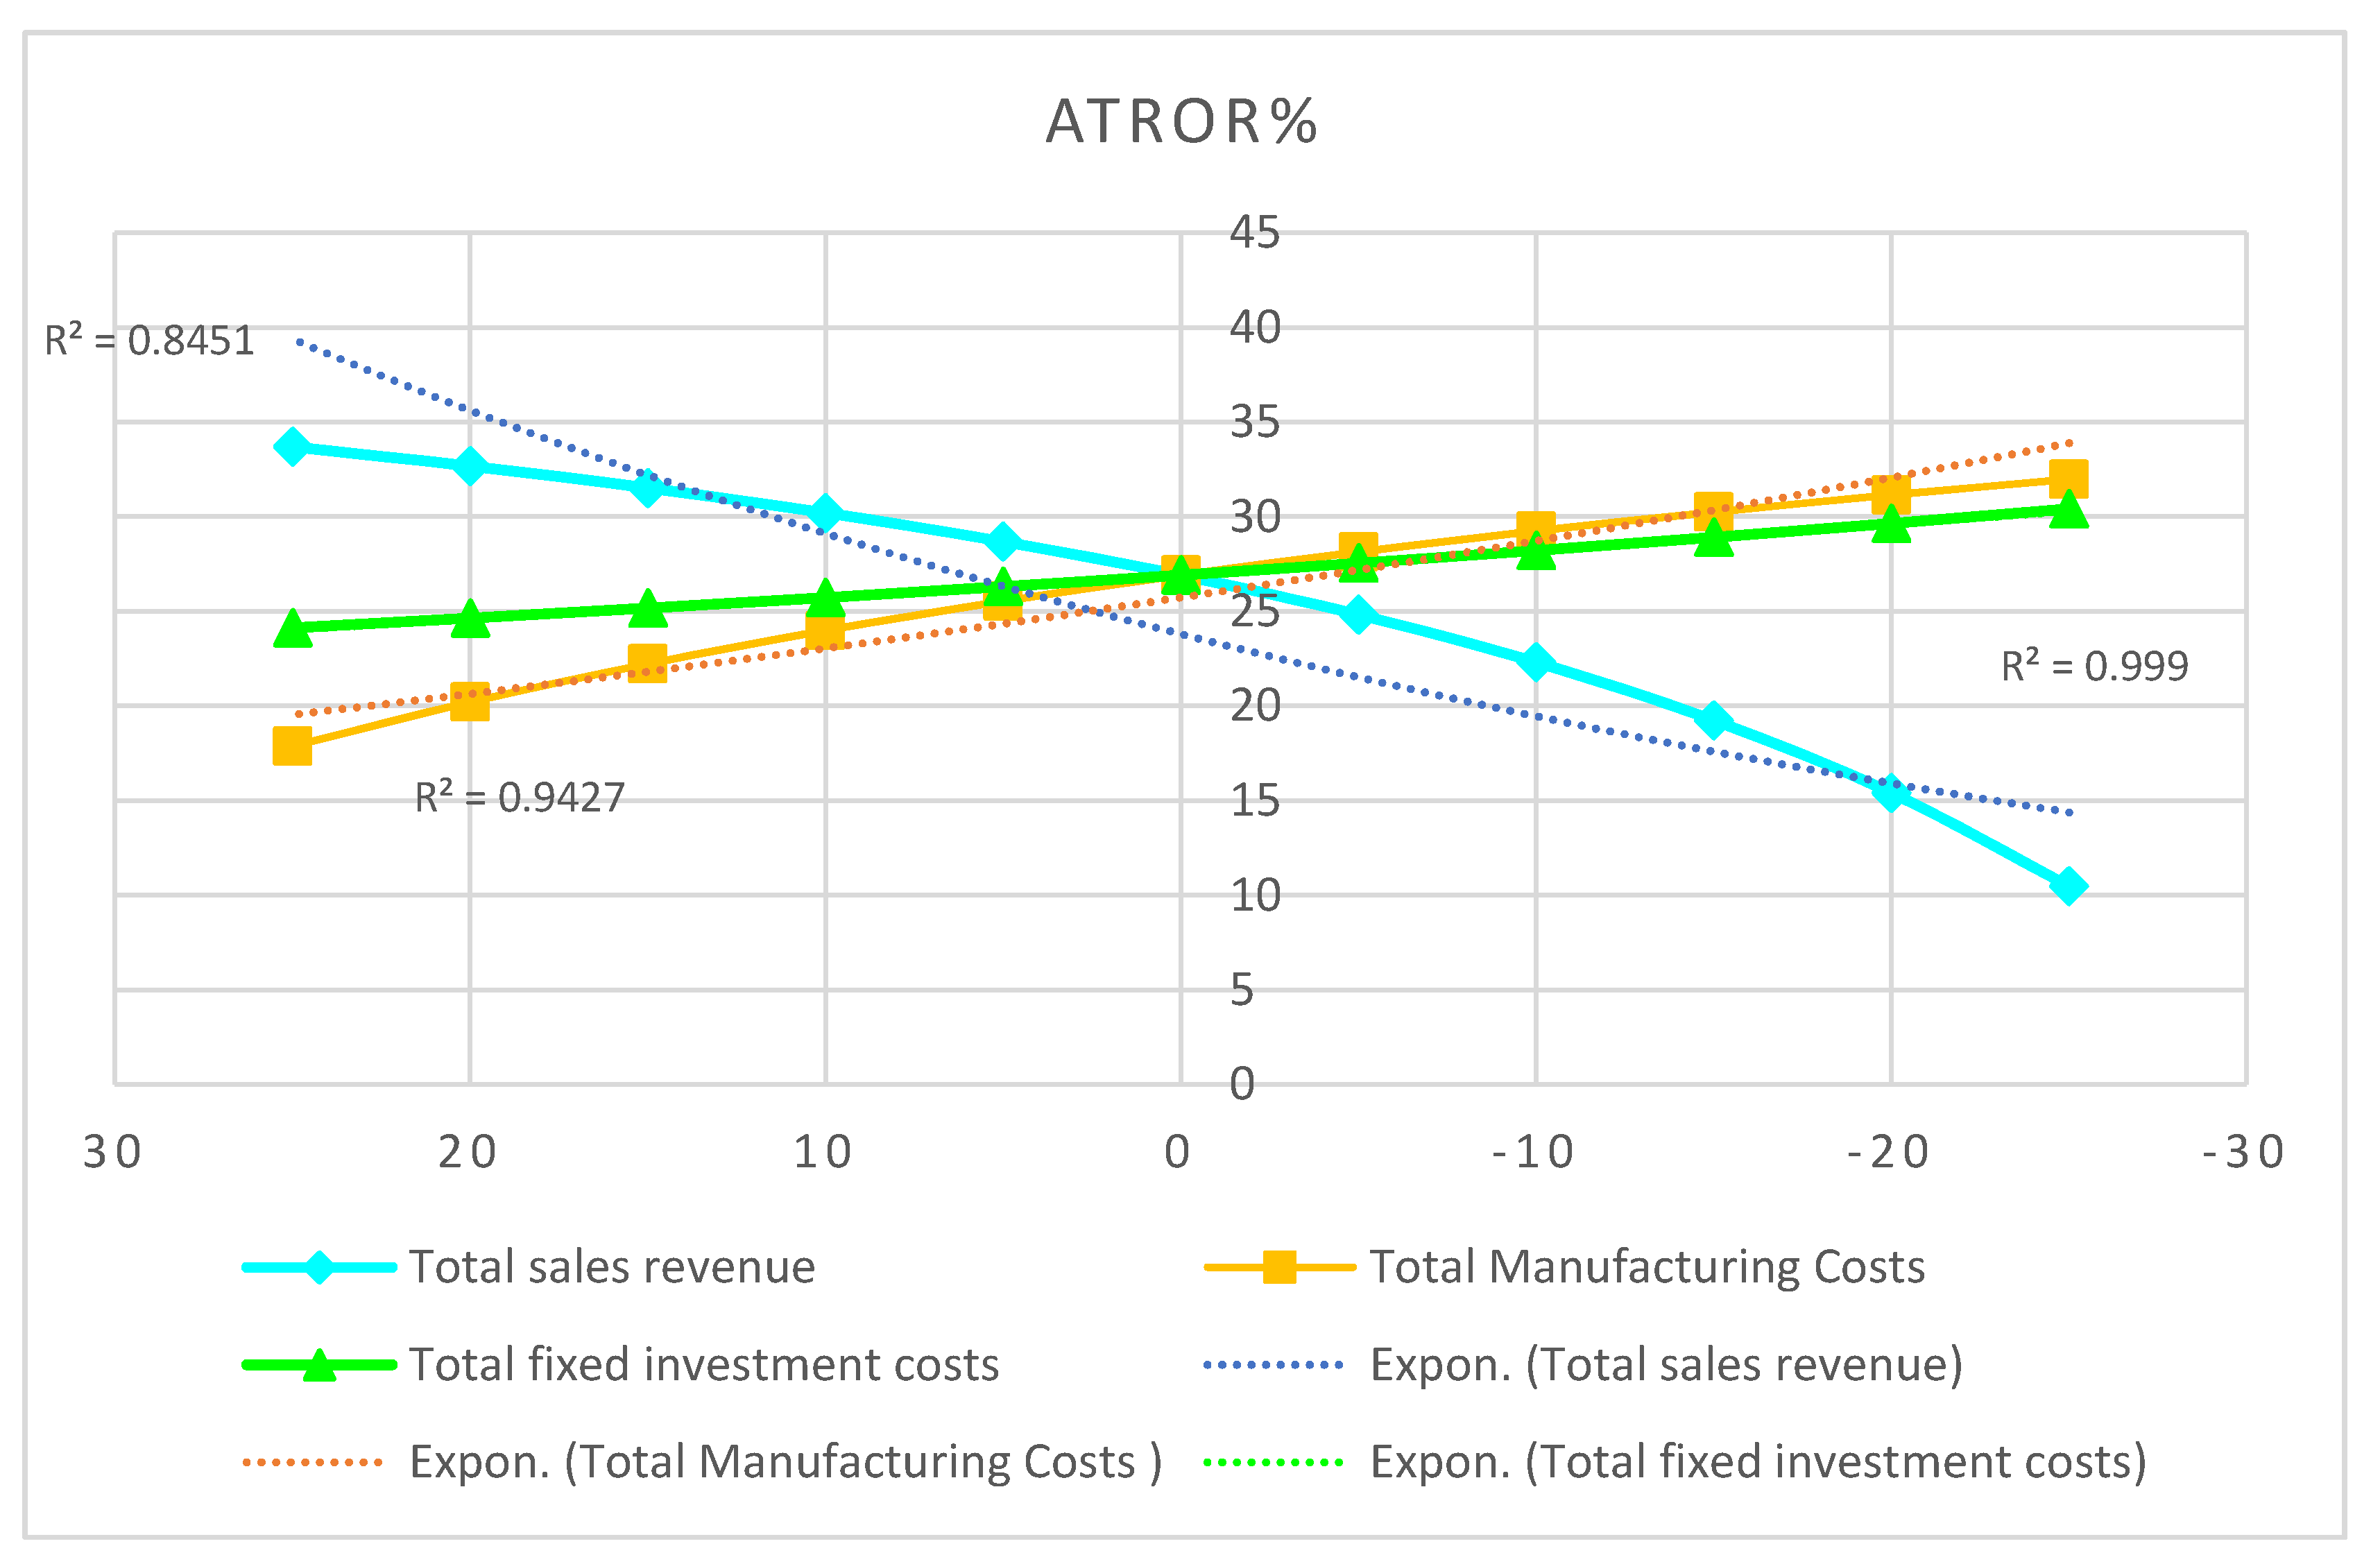
3.7. Sensitivity Analysis
3.7.1. Sensitivity Analysis of the Effect of Sales Revenue on ATROR
3.7.2. Sensitivity Analysis of the Effect of Biodiesel Production Cost on ATROR
3.7.3. Sensitivity Analysis of the Effect of Fixed Investment Cost on ATROR
3.7.4. Sensitivity Analysis of the Effects of Sales Revenue and Fixed Production and Investment Costs on ATROR
4. Conclusions
- Among all types of waste, municipal and industrial wastewater sludge (687.29 million liters) has the highest potential of biodiesel production in terms of quantity, ease of gathering and collection, and cost. waste cooking oil (565.51 million liters) and animal fat (472.72 million liters) are in the next rankings. Generally, Iran can produce 2515.27 million liters of biodiesel annually from different types of fats derived from wastes.
- The analytic hierarchy process (AHP) method was utilized to determine the best location for establishing the biodiesel production plant. From various criteria, four which are biomass resource availability, investment cost, land use and job creation were chosen. Moreover, three areas of Iran (southern, southwest and northern areas,) were nominated. After considering all options and indicators and based on the AHP method’s findings, the southern area of Iran is selected for establishing the biodiesel plant in Iran.
- Fixed investment value: The highest and lowest investment costs per unit of production belong to the units of sewage sludge ($1.735/kg) and microalgae ($0.375/kg), respectively.
- Production costs: The highest and lowest production costs are related to wastewater sludge units ($0.567/kg) and edible waste oil ($0.530/kg), respectively.
- The highest and lowest break even prices of biodiesel production belong to sewage sludge units ($5.957/kg) and microalgae ($1.168/kg), respectively, indicating that the microalgae unit is more profitable than other units.
- The highest and lowest ATROR belong to microalgae units (29.16%) and sewage sludge (10.33%), respectively. In other words, the microalgae unit is more profitable than other units and the invested cost is returned to the investor in a shorter period of time (3.43 years). On the other hand, due to having ATROR lower than the discount rate (18% in Iran), the sewage sludge unit has no economic justification for investment.
- The results of sensitivity analysis show that the highest and lowest impact of biodiesel price on ATROR belongs to microalgae and sludge units, respectively. Also, the highest and lowest impact of raw material cost on ATROR belongs to microalgae and sludge units, respectively. On the other hand, the highest and lowest impact of equipment purchase cost on ATROR is related to sludge and edible waste oil units, respectively.
- The results of the sensitivity analysis of total sales revenue, total production costs and fixed investment on ATROR Biorefinery indicate that the highest and lowest impact on ATROR belong to sales revenue items and fixed investment costs, respectively.
Author Contributions
Funding
Institutional Review Board Statement
Informed Consent Statement
Data Availability Statement
Conflicts of Interest
Nomenclature
| AHP | Analytic Hierarchy Process |
| UHC | Unburned hydrocarbons |
| WCO | Waste Cooking Oil |
| MCDM | Multiple-Criteria Decision Making |
| FIC | Fixed Investment Costs |
| TMC | Total Manufacturing Costs |
| CEPCI | Chemical Engineering Plant Cost Index |
| ATROR | After Tax Rate of Return |
| BEP | Break-Even Point |
| UNIDO | United Nation Industrial Development Organization |
| FAME | Fatty Acid Methyl Esters |
| WOF | Waste Oil Fats |
| HTL | Hydro Thermal Liquefaction |
| AHT | Analytic Hierarchy Tree |
| I.I | Inconsistency Index |
| IR | Inconsistency Ratio |
| IIR | Inconsistency Index of Random |
| WWTP | Waste Water Treatment Plant |
| FFA | Free Fatty acid |
| PRSV | Peng–Robinson Soave |
References
- Ghasemi, A.; Moghaddam, M. Thermodynamic and Environmental Comparative Investigation and Optimization of Landfill vs. Incineration for Municipal Solid Waste: A Case Study in Varamin, Iran. J. Therm. Eng. 2020, 6, 226–246. [Google Scholar] [CrossRef]
- Kumar, M.; Sharma, M.P. Selection of potential oils for biodiesel production. Renew. Sustain. Energy Rev. 2016, 56, 1129–1138. [Google Scholar] [CrossRef]
- Demirbas, A.; Rehan, M.; Al-Sasi, B.O.; Nizami, A.S. Evaluation of natural gas hydrates as a future methane source. Pet. Sci. Technol. 2016, 34, 1204–1210. [Google Scholar] [CrossRef]
- Ouda, O.K.M.; Raza, S.A.; Nizami, A.S.; Rehan, M.; Al-Waked, R.; Korres, N.E. Waste to energy potential: A case study of Saudi Arabia. Renew. Sustain. Energy Rev. 2016, 61, 328–340. [Google Scholar] [CrossRef]
- Aghbashlo, M.; Shamshirband, S.; Tabatabaei, M.; Yee, P.L.; Larimi, Y.N. The use of ELM-WT (extreme learning machine with wavelet transform algorithm) to predict exergetic performance of a DI diesel engine running on diesel/biodiesel blends containing polymer waste. Energy 2016, 94, 443–456. [Google Scholar] [CrossRef]
- Shamshirband, S.; Tabatabaei, M.; Aghbashlo, M.; Yee, P.L.; Petković, D. Support vector machine-based exergetic modelling of a di diesel engine running on biodiesel-diesel blends containing expanded polystyrene. Appl. Eng. 2016, 94, 727–747. [Google Scholar] [CrossRef]
- Hajjari, M.; Tabatabaei, M.; Aghbashlo, M.; Ghanavati, H. A review on the prospects of sustainable biodiesel production: A global scenario with an emphasis on waste-oil biodiesel utilization. Renew. Sustain. Energy Rev. 2017, 72, 445–464. [Google Scholar] [CrossRef]
- Huang, G.H.; Chen, F.; Wei, D.; Zhang, X.W.; Chen, G. Biodiesel production by microalgal biotechnology. Appl. Energy 2010, 87, 38–46. [Google Scholar] [CrossRef]
- Demirbas, A. Biofuels securing the planet’s future energy needs. Energy Convers. Manag. 2009, 50, 2239–2249. [Google Scholar] [CrossRef]
- Sajjadi, B.; Raman, A.A.A.; Arandiyan, H. A comprehensive review on properties of edible and non-edible vegetable oil-based biodiesel: Composition, specifications and prediction models. Renew. Sustain. Energy 2016, 63, 62–92. [Google Scholar] [CrossRef]
- Panichelli, L.; Dauriat, A.; Gnansounou, E. Life cycle assessment of soybean-based biodiesel in Argentina for export. Int. J. Life Cycle Assess. 2009, 14, 144–159. [Google Scholar] [CrossRef] [Green Version]
- Martín, M.; Grossmann, I.E. Design of an optimal process for enhanced production of bioethanol and biodiesel from algae oil via glycerol fermentation. Appl. Energy 2014, 209, 409–425. [Google Scholar] [CrossRef]
- Borges, M.E.; Díaz, L. Recent developments on heterogeneous catalysts for biodiesel production by oil esterification and transesterification reactions: A review. Renew. Sustain. Energy Rev. 2012, 16, 2839–2849. [Google Scholar] [CrossRef]
- Atabani, A.E.; Silitonga, A.S.; Ong, H.C.; Mahlia, T.M.I.; Masjuki, H.H.; Badruddin, I.A.; Fayaz, H. Non-edible vegetable oils: A critical evaluation of oil extraction, fatty acid compositions, biodiesel production, characteristics, engine performance and emissions production. Renew. Sustain. Energy Rev. 2013, 18, 211–245. [Google Scholar] [CrossRef]
- Rathore, D.; Nizami, A.S.; Singh, A.; Pant, D. Key issues in estimating energy and greenhouse gas savings of biofuels: Challenges and perspectives. Biofuel Res. J. 2016, 3, 380–393. [Google Scholar] [CrossRef] [Green Version]
- Ministry I Energy. Energy Balance Sheet, Deputy of Electricity and Energy Planning. Available online: http://news.moe.gov.ir/Home (accessed on 10 September 2021).
- Hosseini, S.E.; Andwari, A.M.; Wahid, M.A.; Bagheri, G. A review on green energy potentials in Iran. Renew. Sustain. Energy Rev. 2013, 27, 533–545. [Google Scholar] [CrossRef]
- Moshiri, S.; Atabi, F.; Panjehshahi, M.H.; Lechtenböehmer, S. Long run energy demand in Iran: A scenario analysis. Int. J. Energy Sect. Manag. 2012, 6, 120–144. [Google Scholar] [CrossRef] [Green Version]
- Ho, W. Integrated analytic hierarchy process and its applications–A literature review. Eur. J. Oper. Res. 2008, 186, 211–228. [Google Scholar] [CrossRef]
- Turton, R.; Bailie, R.C.; Whiting, W.B.; Shaeiwitz, J.A. Analysis, Synthesis and Design of Chemical Processes, 2nd ed.; Prentice Hall: Hoboken, NJ, USA, 2003. [Google Scholar]
- United Nations. COMFAR Software. Available online: https://www.unido.org/resources-publications-publications-type/comfar-software (accessed on 10 September 2021).
- Mesdaghinia, A.; Nasseri, S.; Mahvi, A.H.; Tashauoei, H.R.; Hadi, M. The estimation of per capita loadings of domestic wastewater in Tehran. J. Environ. Health Sci. Eng. 2015, 13, 25. [Google Scholar] [CrossRef] [PubMed] [Green Version]
- Siddiquee, M.N.; Rohani, S. Experimental analysis of lipid extraction and biodiesel production from wastewater sludge. Fuel Process Technol. 2011, 92, 2241–2251. [Google Scholar] [CrossRef]
- Chen, W.; Wu, F.; Zhang, J. Potential production of non-food biofuels in China. Renew. Energy 2016, 85, 939–944. [Google Scholar] [CrossRef]
- Salehi, A.; Karbassi, A.; Ghobadian, B.; Ghasemi, A.; Doustgani, A. Simulation process of biodiesel production plant. Environ. Prog. Sustain. Energy 2019, 38, 1–12. [Google Scholar] [CrossRef]
- Alptekin, E.; Canakci, M.; Sanli, H. Biodiesel production from vegetable oil and waste animal fats in a pilot plant. Waste Manag. 2014, 34, 2146–2154. [Google Scholar] [CrossRef] [PubMed]
- Martinez, E.; Marcos, A.; Al-Kassir, A.; Jaramillo, M.A.; Mohamad, A.A. Mathematical model of a laboratory-scale plant for slaughterhouse effluents biodigestion for biogas production. Appl. Energy 2012, 95, 210–219. [Google Scholar] [CrossRef]
- Yahyaee, R.; Ghobadian, B.; Najafi, G. Waste fish oil biodiesel as a source of renewable fuel in Iran. Renew. Sustain. Energy Rev. 2013, 17, 312–319. [Google Scholar] [CrossRef]
- Shahzad, K.; Nizami, A.S.; Sagir, M.; Rehan, M.; Maier, S.; Khan, M.Z.; Ouda, O.K.M.; Ismail, I.M.I.; BaFail, A.O. Biodiesel production potential from fat fraction of municipal waste in Makkah. PLoS ONE 2017, 12, e0171297. [Google Scholar] [CrossRef] [PubMed]
- Najafi, G.; Ghobadian, B.; Yusaf, T.F. Algae as a sustainable energy source for biofuel production in Iran: A case study. Renew. Sustain. Energy Rev. 2011, 15, 3870–3876. [Google Scholar] [CrossRef] [Green Version]
- Sohrabipour, J.; Rabiei, R. Algal vegetation in southern coastline of Iran. Iran Nat. 2017, 2, 62–68. [Google Scholar] [CrossRef]
- Chhetri, A.; Watts, K.; Islam, M. Waste Cooking Oil as an Alternate Feedstock for Biodiesel Production. Energies 2008, 1, 3–18. [Google Scholar] [CrossRef] [Green Version]
- Frank, E.D.; Elgowainy, A.; Han, J.; Wang, Z. Life cycle comparison of hydrothermal liquefaction and lipid extraction pathways to renewable diesel from algae. Mitig. Adapt. Strateg. Glob. Chang. 2013, 18, 137–158. [Google Scholar] [CrossRef] [Green Version]
- Kalacheva, G.S.; Zhila, N.O.; Volova, T.G.; Gladyshev, M.I. The effect of temperature on the lipid composition of the green alga Botryococcus. Microbiology 2002, 71, 286–293. [Google Scholar] [CrossRef]
- Xu, H.; Miao, X.; Wu, Q. High quality biodiesel production from a microalga Chlorella protothecoides by heterotrophic growth in fermenters. J. Biotechnol. 2006, 126, 499–507. [Google Scholar] [CrossRef]
- Brouwer, P.; van der Werf, A.; Schluepmann, H.; Reichart, G.J.; Nierop, K.G.J. Lipid Yield and Composition of Azolla filiculoides and the Implications for Biodiesel Production. Bioenergy Res. 2016, 9, 369–377. [Google Scholar] [CrossRef] [Green Version]
- Amer, M.; Daim, T.U. Selection of renewable energy technologies for a developing county: A case of Pakistan. Energy Sustain. Dev. 2011, 15, 420–435. [Google Scholar] [CrossRef]
- Cutz, L.; Haro, P.; Santana, D.; Johnsson, F. Assessment of biomass energy sources and technologies: The case of Central America. Renew. Sustain. Energy Rev. 2016, 58, 1411–1431. [Google Scholar] [CrossRef]
- Onar, S.C.; Oztaysi, B.; Otay, I.; Kahraman, C. Multi-expert wind energy technology selection using interval-valued intuitionistic fuzzy sets. Energy 2015, 90, 274–285. [Google Scholar] [CrossRef]
- Bayazit, O. Use of AHP in decision-making for flexible manufacturing systems. J. Manuf. Technol. Manag. 2005, 16, 808–819. [Google Scholar] [CrossRef] [Green Version]
- Braglia, M.; Carmignani, G.; Frosolini, M.; Grassi, A. AHP-based evaluation of CMMS software. J. Manuf. Technol. Manag. 2006, 17, 585–602. [Google Scholar] [CrossRef]
- Liang, X.; Wang, X.; Shu, G.; Wei, H.; Tian, H.; Wang, X. A review and selection of engine waste heat recovery technologies using analytic hierarchy process and grey relational analysis. Int. J. Energy Res. 2015, 39, 453–471. [Google Scholar] [CrossRef]
- Ren, J.; Fedele, A.; Mason, M.; Manzardo, A.; Scipioni, A. Fuzzy Multi-Actor Multi-Criteria Decision Making for sustainability assessment of biomass-based technologies for hydrogen production. Int. J. Hydrog. Energy 2013, 38, 9111–9120. [Google Scholar] [CrossRef]
- Tan, K.H.; Noble, J.; Sato, Y.; Tse, Y.K. A marginal analysis guided technology evaluation and selection. Int. J. Prod. Econ. 2011, 131, 15–21. [Google Scholar] [CrossRef]
- Khishtandar, S.; Zandieh, M.; Dorri, B. A multi criteria decision making framework for sustainability assessment of bioenergy production technologies with hesitant fuzzy linguistic term sets: The case of Iran. Renew. Sustain. Energy Rev. 2017, 77, 1130–1145. [Google Scholar] [CrossRef]
- La Rovere, E.L.; Soares, J.B.; Oliveira, L.B.; Lauria, T. Sustainable expansion of electricity sector: Sustainability indicators as an instrument to support decision making. Renew. Sustain. Energy Rev. 2010, 14, 422–429. [Google Scholar] [CrossRef]
- Troldborg, M.; Heslop, S.; Hough, R.L. Assessing the sustainability of renewable energy technologies using multi-criteria analysis: Suitability of approach for national-scale assessments and associated uncertainties. Renew. Sustain. Energy Rev. 2014, 39, 1173–1184. [Google Scholar] [CrossRef]
- Farooq, S.; O’Brien, C. An action research methodology for manufacturing technology selection: A supply chain perspective. Prod. Plan. Control 2015, 26, 467–488. [Google Scholar] [CrossRef]
- Saaty, T.L. The Analytic Hierarchy Process: Planning, Priority Setting, Resource Allocation; McGraw-Hill International Book Co.: New York, NY, USA, 1980. [Google Scholar]
- Saaty, T.L. Fundamentals of Decision Making and Priority Theory, 2nd ed.; McGraw Hill Publishers: New York, NY, USA, 2000. [Google Scholar]
- Olkiewicz, M.; Caporgno, M.P.; Fortuny, A.; Stüber, F.; Fabregat, A.; Font, J.; Bengoa, C. Direct liquid-liquid extraction of lipid from municipal sewage sludge for biodiesel production. Fuel Process Technol. 2014, 128, 331–338. [Google Scholar] [CrossRef] [Green Version]
- Olkiewicz, M.; Fortuny, A.; Stüber, F.; Fabregat, A.; Font, J.; Bengoa, C. Effects of pre-treatments on the lipid extraction and biodiesel production from municipal WWTP sludge. Fuel 2015, 141, 250–257. [Google Scholar] [CrossRef] [Green Version]
- Ghosh, P. Prediction of vapor-liquid equilibria using Peng-Robinson and Soave-Redlich-Kwong equations of state. Chem. Ing. Technol. 1999, 22, 379–399. [Google Scholar] [CrossRef]
- Olkiewicz, M.; Torres, C.M.; Jiménez, L.; Font, J.; Bengoa, C. Scale-up and economic analysis of biodiesel production from municipal primary sewage sludge. Bioresour. Technol. 2016, 214, 122–131. [Google Scholar] [CrossRef]
- Chisti, Y. Biodiesel from microalgae beats bioethanol. Trends Biotechnol. 2008, 26, 126–131. [Google Scholar] [CrossRef] [PubMed]
- Miao, X.; Wu, Q. Biodiesel production from heterotrophic microalgal oil. Bioresour. Technol. 2006, 97, 841–846. [Google Scholar] [CrossRef] [PubMed]
- Pokoo-Aikins, G.; Nadim, A.; El-Halwagi, M.M.; Mahalec, V. Design and analysis of biodiesel production from algae grown through carbon sequestration. Clean Technol. Environ. Policy 2010, 12, 239–254. [Google Scholar] [CrossRef]
- Martinovic, F.L.; Kiss, F.E.; Micic, R.D.; Simikic, M.; Tomic, M.D. Comparative technoeconomic analysis of single-step and two-step biodiesel production with supercritical methanol based on process simulation. Chem. Eng. Res. Des. 2018, 132, 751–765. [Google Scholar] [CrossRef]
- Cao, Y.; Doustgani, A.; Salehi, A.; Nemati, M.; Ghasemi, A.; Koohshekan, O. The economic evaluation of establishing a plant for producing biodiesel from edible oil wastes in oil-rich countries: Case study Iran. Energy 2020, 213, 118760. [Google Scholar] [CrossRef]
- Eurostat Statistics Explained. Available online: http://ec.europa.eu/eurostat/statistics-explained/index.php/Energy_price_statistics (accessed on 10 September 2021).


| Biodiesel Classification/Generation | Features/Aspect/Examples |
|---|---|
| Fossil fuel | Petroleum based:
|
| First generation | Editable oil-crops biodiesel:
|
| Second generation | Non-edible crops biodiesel:
|
| Third generation | Waste based biodiesel:
|
| Fourth generation | Algae biodiesel:
|
| Fifth generation | Genetically engineered crops-based biodiesel:
|
| Province | Broiler Chicken (Ton) | Biodiesel (Million Liters) |
|---|---|---|
| Mazandaran | 317,234 | 17.55 |
| Golestan | 230,485 | 12.75 |
| Khorasan Razavi | 200,238 | 11.07 |
| Gilan | 190,818 | 10.55 |
| Isfahan | 176,246 | 9.75 |
| Fars | 167,201 | 9.25 |
| Kurdistan | 99,665 | 5.51 |
| Eastern Azerbaijan | 953,321 | 5.27 |
| Khuzestan | 92,654 | 5.12 |
| Western Azerbaijan | 91,980 | 5.09 |
| Province | Section | Fishery and Aquaculture Rates (Ton) | Biodiesel (Million Liters) |
|---|---|---|---|
| Sistan and Baluchestan | Fishery | 250,044 | 55.69 |
| Aquaculture | 12,702 | 2.829 | |
| Total | 262,746 | 58.52 | |
| Hormozgan | Fishery | 241,972 | 53.89 |
| Aquaculture | 13,148 | 2.92 | |
| Total | 255,120 | 56.82 | |
| Khuzestan | Fishery | 47,788 | 10.64 |
| Aquaculture | 75,919 | 16.90 | |
| Total | 123,707 | 27.55 | |
| Mazandaran | Fishery | 19,357 | 4.31 |
| Aquaculture | 76,703 | 17.08 | |
| Total | 96,060 | 21.39 | |
| Gilan | Fishery | 13,288 | 2.95 |
| Aquaculture | 51,939 | 11.56 | |
| Total | 65,227 | 14.52 | |
| Bushehr | Fishery | 60,988 | 13.58 |
| Aquaculture | 11,217 | 2.49 | |
| Total | 72,205 | 16.08 | |
| Lorestan | Fishery | 0 | 0 |
| Aquaculture | 27,178 | 6.05 | |
| Total | 27,178 | 6.05 | |
| Golestan | Fishery | 751 | 0.16 |
| Aquaculture | 20,946 | 4.66 | |
| Total | 21,697 | 4.83 | |
| Kermanshah | Fishery | 0 | 0 |
| Aquaculture | 16,148 | 3.59 | |
| Total | 16,148 | 3.59 | |
| Western Azerbaijan | Fishery | 0 | 0 |
| Aquaculture | 14,319 | 3.19 | |
| Total | 14,319 | 3.19 |
| Category | Criteria | Definition | Reference |
|---|---|---|---|
| Technical | Biomass resource availability | The number of required biomass sources for each technology | [37,38,39] |
| Economic | Investment cost | The cost of the initial investment such as buying equipment | [38,39,40,41,42,43,44] |
| Environmental | Land use | Land used for biomass production | [45,46,47] |
| Social | Job creation | The manpower required for the use of technology | [37,42,48] |
| Absolute Importance | Very High Importance | High Importance | Weak Importance | Same Importance |
|---|---|---|---|---|
| 9 | 7 | 5 | 3 | 1 |
| 2, 4, 6 and 8 are the fundamental values | ||||
| Biomass Resource Availability | Land Use | Investment Cost | Job Creation | |
|---|---|---|---|---|
| Biomass resource availability | 1 | 5 | 3 | 7 |
| Land use | 0.2 | 1 | 1 | 3 |
| Investment cost | 0.333 | 1 | 1 | 3 |
| Job creation | 0.143 | 0.333 | 0.333 | 1 |
| Biomass Resource Availability | Land Use | Investment Cost | Job Creation | |
|---|---|---|---|---|
| Biomass resource availability | 0.5966587 | 0.6818492 | 0.5625352 | 0.5 |
| Land use | 0.1193317 | 0.1363698 | 0.1875117 | 0.2142857 |
| Investment cost | 0.1986874 | 0.1363698 | 0.1875117 | 0.2142857 |
| Job creation | 0.0853222 | 0.0454112 | 0.0624414 | 0.0714286 |
| Indicator | |
|---|---|
| Biomass resource availability | 0.5852608 |
| Land use | 0.1643748 |
| Investment cost | 0.1842137 |
| Job creation | 0.0661508 |
| Indicator | CV | |
|---|---|---|
| Biomass resource availability | 2.42 | 4.13 |
| Land use | 0.663 | 4.04 |
| Investment cost | 0.741 | 4.02 |
| Job creation | 0.265 | 4.01 |
| n | 1 | 2 | 3 | 4 | 5 | 6 | 7 | 8 | 9 | 10 |
|---|---|---|---|---|---|---|---|---|---|---|
| IIR | 0 | 0 | 0.58 | 0.9 | 1.12 | 1.24 | 1.32 | 1.41 | 1.45 | 1.51 |
| Pair Comparison for Biomass Resource Availability Indicator | ||||
|---|---|---|---|---|
| Southern area | South west area | Northern area | ) | |
| Southern area | 1 | 3 | 2 | 0.549 |
| South west area | .033 | 1 | 1 | 0.210 |
| Northern area | 0.50 | 1 | 1 | 0.241 |
| IR | 0.017 | |||
| Pair Comparison forLand UseIndicator | ||||
| Southern area | South west area | Northern area | ) | |
| Southern area | 1 | 5 | 9 | 0.748 |
| South west area | 0.2 | 1 | 3 | 0.180 |
| Northern area | 0.11 | 0.33 | 1 | 0.071 |
| IR | 0.027 | |||
| Pair Comparison forInvestment CostIndicator | ||||
| Southern area | South west area | Northern area | ) | |
| Southern area | 1 | 7 | 7 | 0.767 |
| South west area | 0.143 | 1 | 2 | 0.143 |
| Northern area | 0.143 | 0.5 | 1 | 0.090 |
| IR | 0.051 | |||
| Pair Comparison forJob CreationIndicator | ||||
| Southern area | South west area | Northern area | ) | |
| Southern area | 1 | 0.33 | 4 | 0.274 |
| South west area | 3 | 1 | 6 | 0.639 |
| Northern area | 0.25 | 0.17 | 1 | 0.087 |
| IR | 0.051 | |||
| Item | Extraction | Recovery | Reaction | Purification | Total |
|---|---|---|---|---|---|
| Land purchase | 60,480 | 8960 | 8960 | 33,600 | 112,000 |
| Site preparation and development | 12,096 | 1792 | 1792 | 6720 | 22,400 |
| Civil works, structures and building | 84,672 | 12,544 | 12,544 | 47,040 | 156,800 |
| total land purchase and civil works | 156,816 | 23,232 | 23,232 | 87,120 | 290,400 |
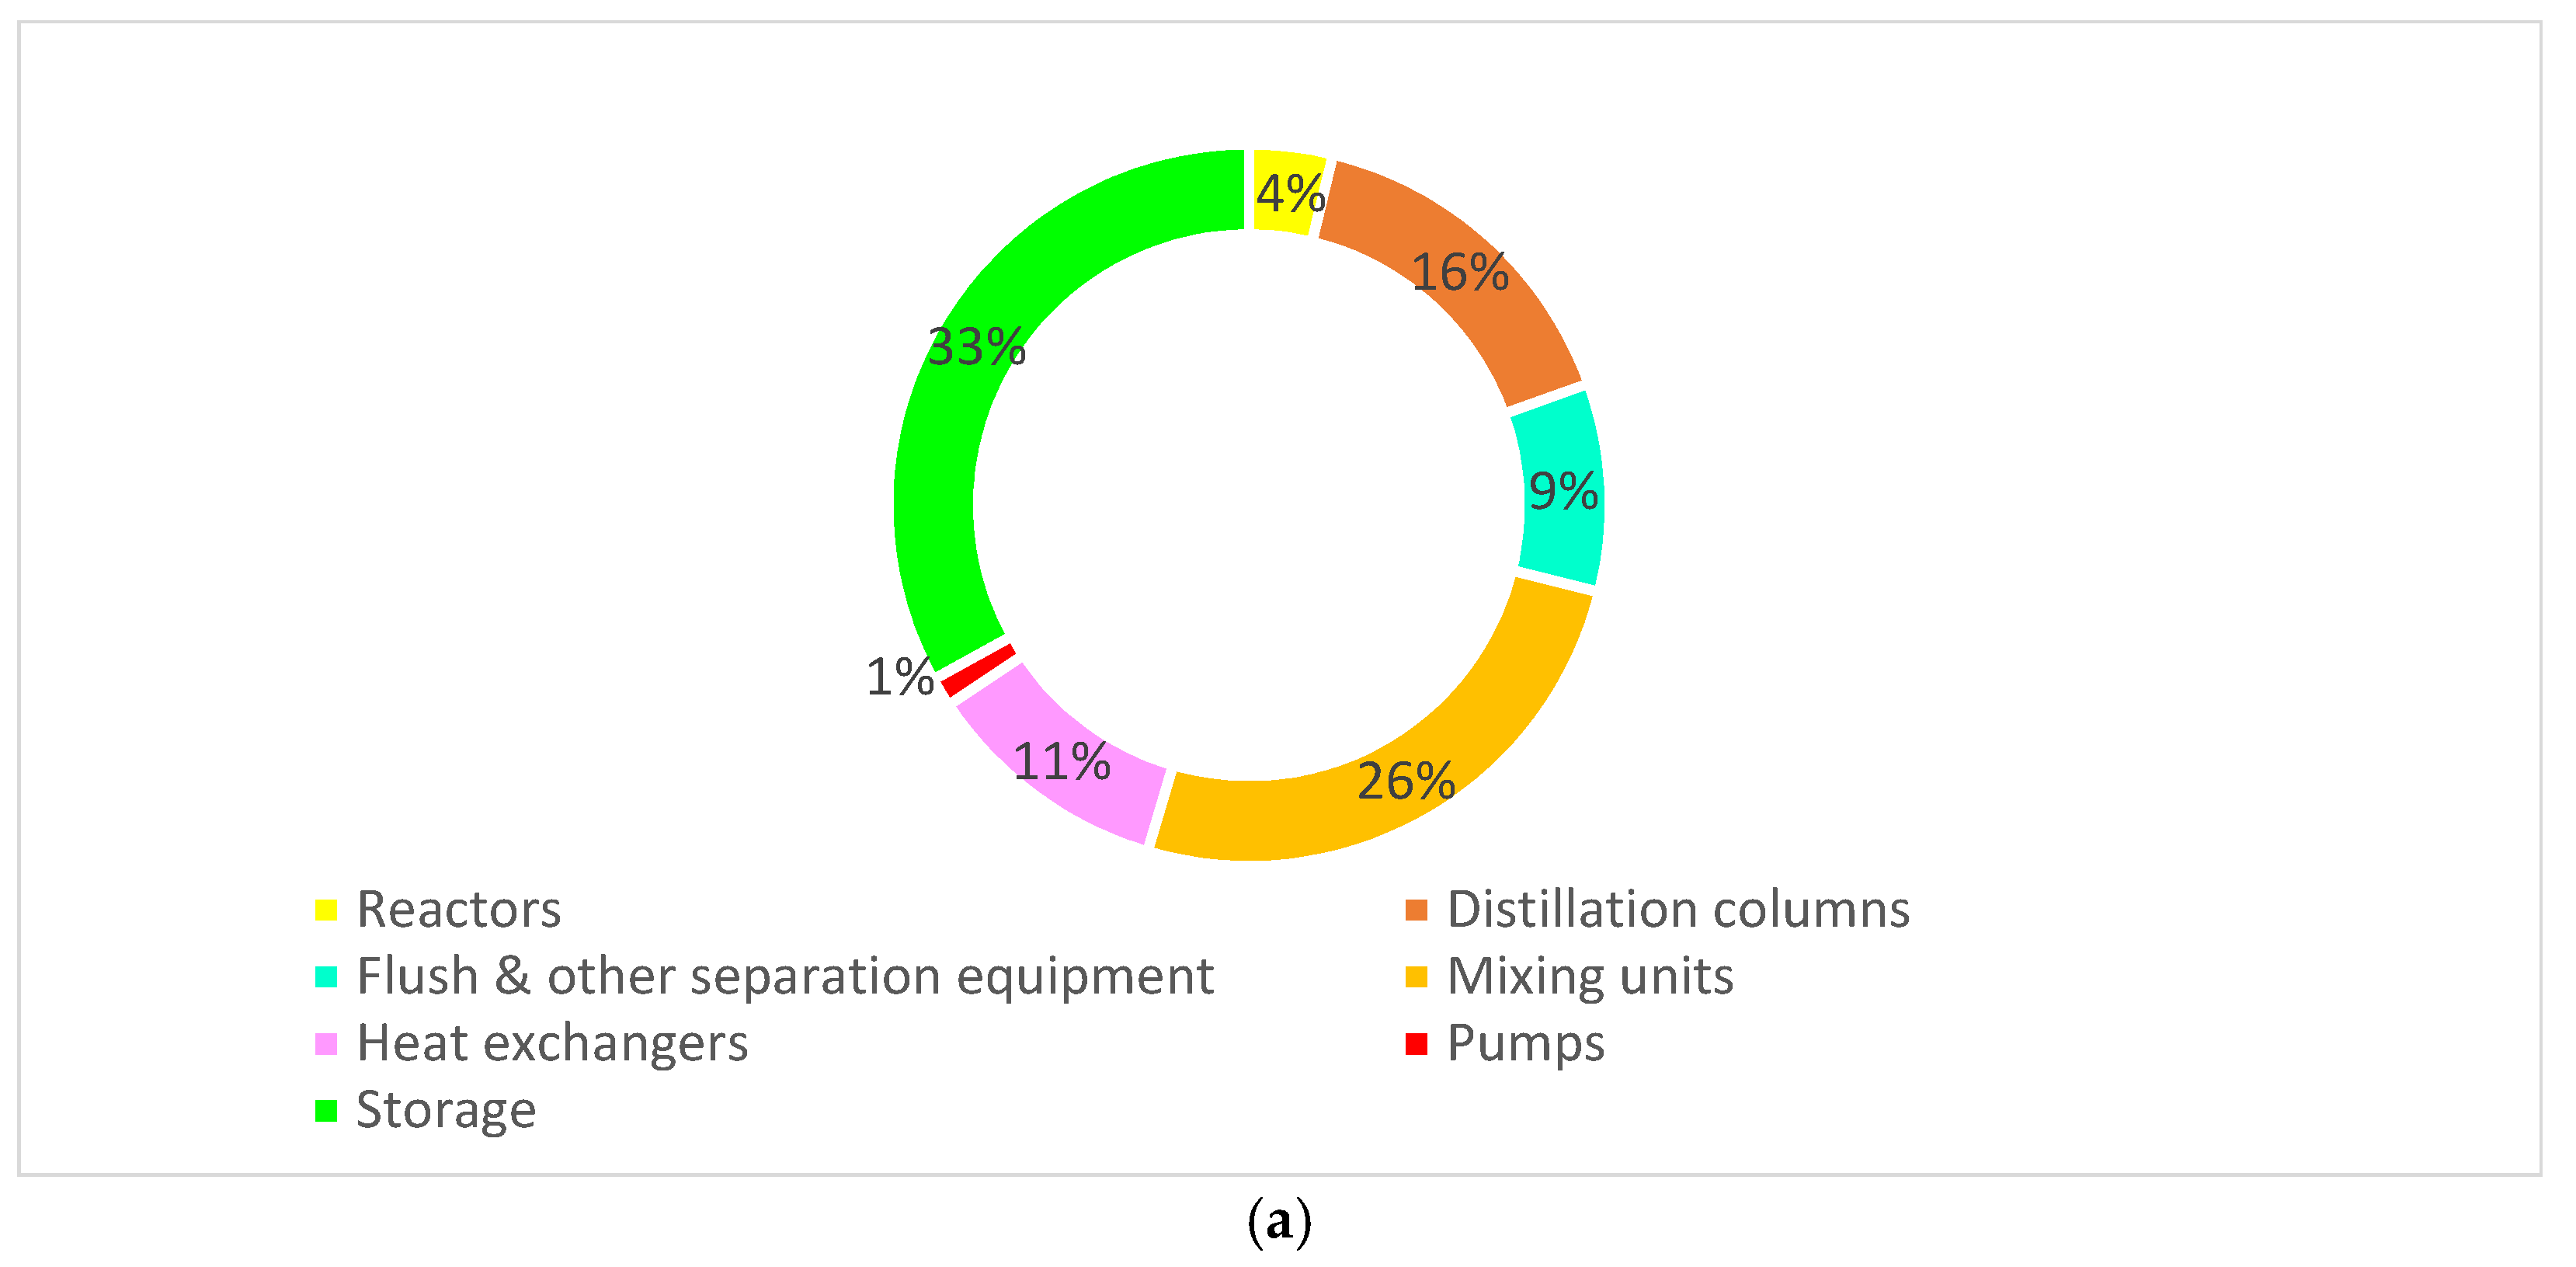
| Total equipment cost (TEC) | 2,113,998 | 182,918 | 287,587 | 1,110,686 | 3,895,407 |
| Reactors | 0 | 0 | 115,569 | 30,269 | 145,838 |
| Distillation columns | 0 | 0 | 0 | 614,734 | 614,734 |
| Flush & other separation equipment | 234,521 | 59,690 | 0 | 69,752 | 363,962 |
| Mixing units | 887,070 | 90,752 | 8996 | 12,860 | 999,679 |
| Heat exchangers | 0 | 222,612 | 0 | 210,984 | 433,596 |
| Pumps | 24,209 | 9864 | 3735 | 12,800 | 50,608 |
| Storage | 968,198 | 0 | 159,287 | 159,287 | 1,286,992 |
| Fix. cap. costs (bare, cont. aux.) | 3,295,301 | 595,407 | 458,672 | 1,784,313 | 6,133,693 |
| Auxiliary and service plant, 30% TEC | 634,200 | 54,876 | 86,277 | 333,207 | 1,168,622 |
| Project implementation, 10% TEC | 211,400 | 18,292 | 28,759 | 111,069 | 389,541 |
| Contingencies,18% Civil works, TEC and Auxiliary | 522,902 | 46,985 | 71,477 | 275,582 | 963,797 |
| Working capital | 491,505 | 88,807 | 68,414 | 266,136 | 914,862 |
| Total investment costs | 5,312,124 | 827,599 | 736,831 | 2,857,427 | 9,860,995 |
| Extraction | Recovery | Reaction | Purification | Total | |
|---|---|---|---|---|---|
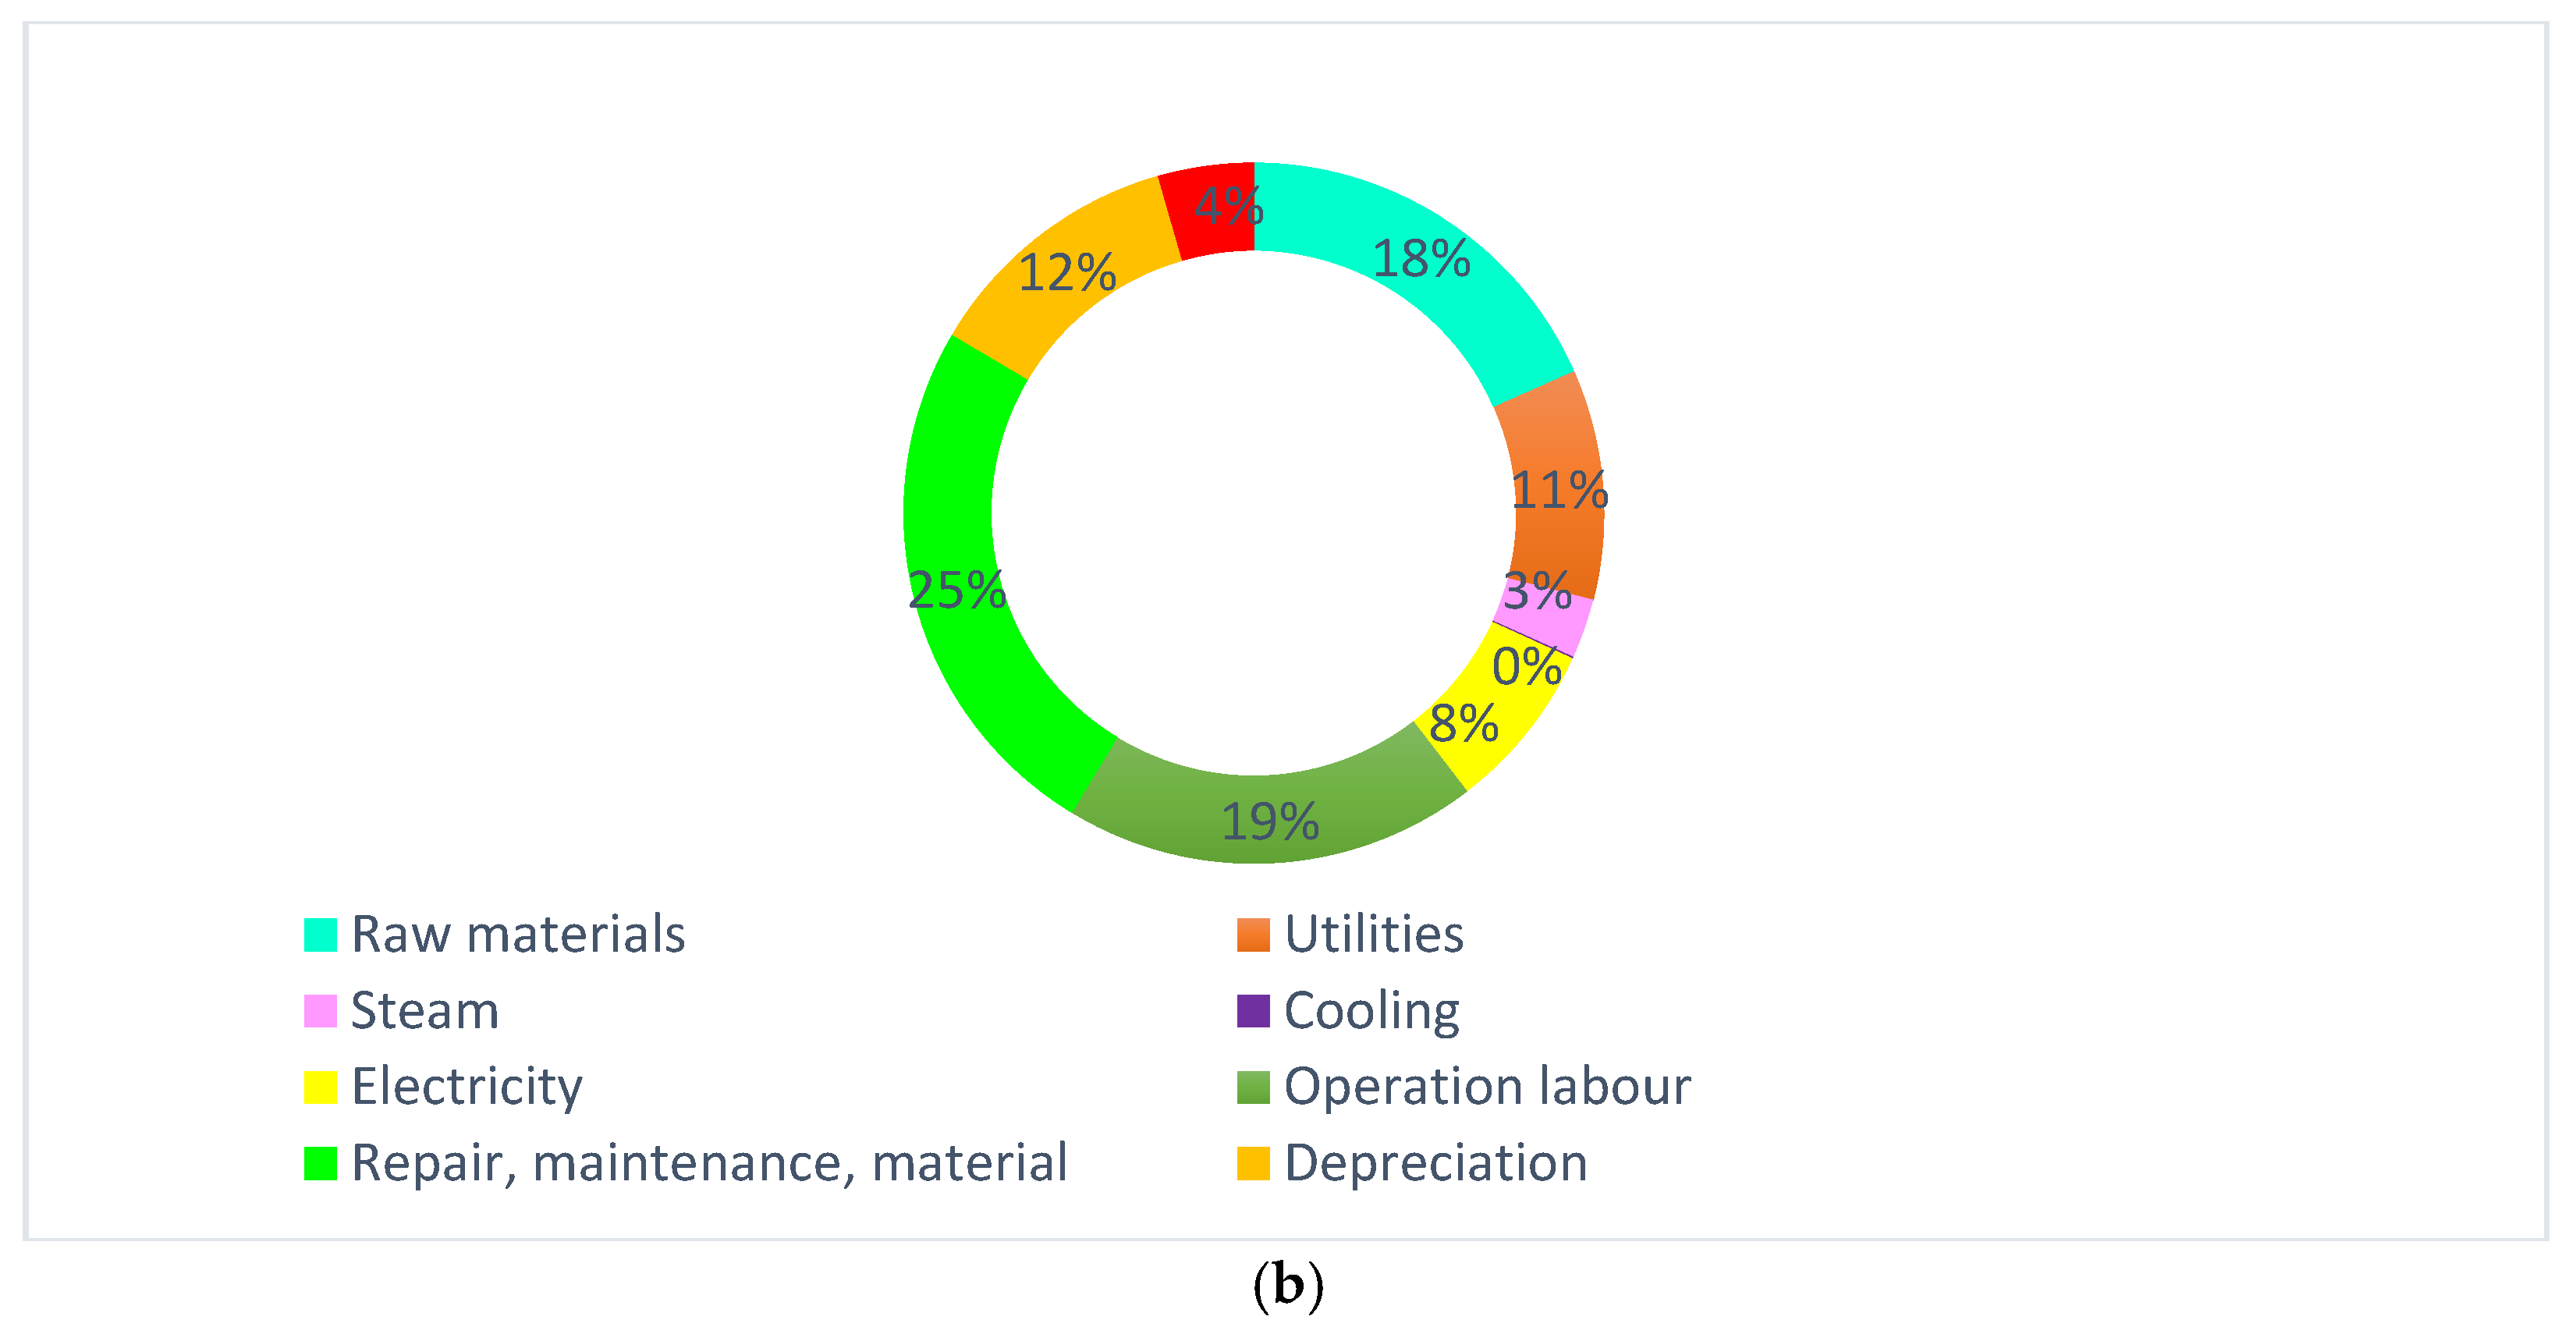
| Raw materials | 251,932 | 0 | 290,519 | 49,557 | 592,008 |
| Utilities | 250,835 | 41,245 | 0 | 49,810 | 341,890 |
| Steam | 0 | 41,196 | 0 | 47,424 | 88,620 |
| Cooling | 0 | 0 | 0 | 2266 | 2266 |
| Electricity | 250,841 | 0 | 0 | 0 | 250,841 |
| Operation labour | 251,101 | 37,665 | 144,382 | 182,047 | 615,195 |
| Repair, maintenance, material | 402,737 | 56,735 | 152,625 | 186,985 | 799,082 |
| Depreciation | 196,329 | 27,657 | 74,402 | 91,153 | 389,541 |
| Direct manufacturing cost | 1,603,775 | 204,500 | 661,928 | 609,242 | 3,079,443 |
| Overhead | 57,753 | 8663 | 33,208 | 41,871 | 141,495 |
| Total manufacturing costs | 1,661,528 | 213,163 | 695,136 | 651,113 | 3,220,938 |
| Unit cost of production biodiesel ($/kg) | 0.567 |
| Item | Cost |
|---|---|
| Land purchase | 112,000 |
| Site preparation and development | 22,400 |
| Civil works, structures and building | 156,800 |
| Total Land purchase, Site preparation and Civil works | 290,400 |
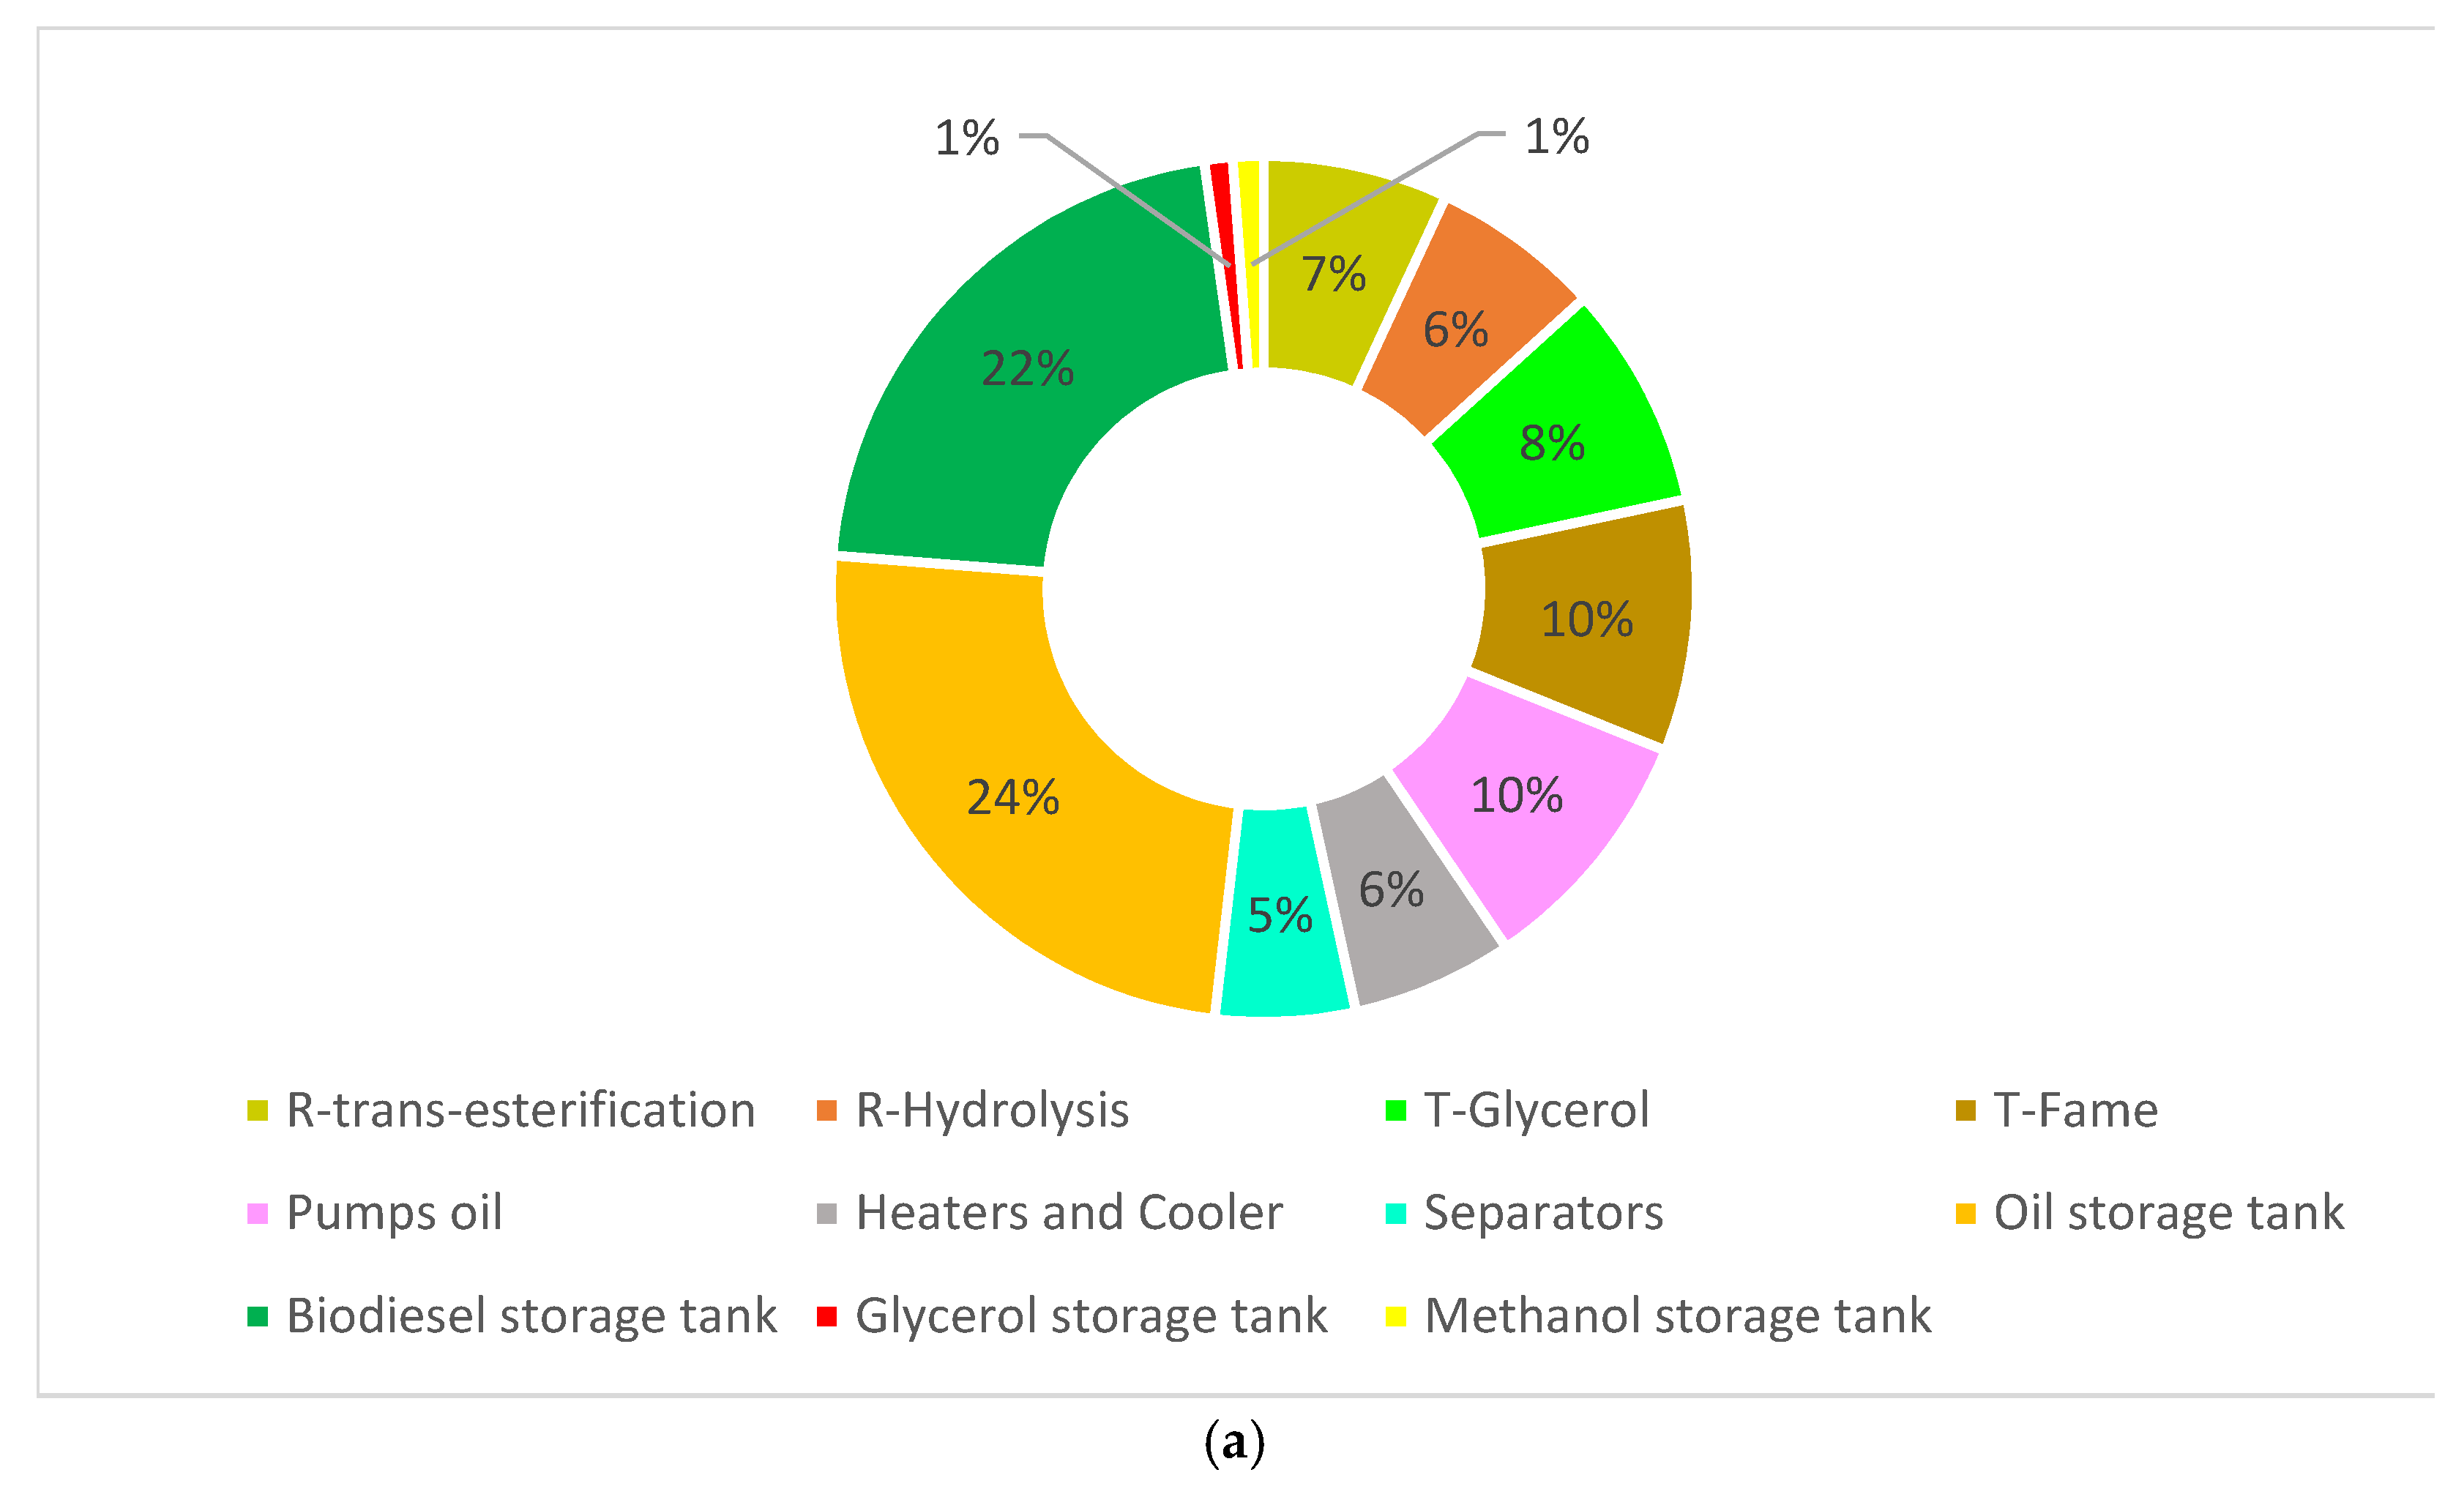
| Plant machinery and equipment | |
| Reactors | 319,331 |
| R-trans-esterification | 166,036 |
| R-Hydrolysis | 153,264 |
| Distillation towers | 472,164 |
| T-Glycerol | 201,986 |
| T-Fame | 226,638 |
| Pumps oil | 227,095 |
| Heaters and Cooler | 145,433 |
| Separators | 126,112 |
| Tanks | 1,158,787 |
| Oil storage tank | 587,265 |
| Biodiesel storage tank | 518,195 |
| Glycerol storage tank | 25,504 |
| Methanol storage tank | 27,823 |
| Total equipment cost (TEC) | 2,739,291 |
| Auxiliary and service plant, 30% TEC | 821,787 |
| Project implementation, 10% TEC | 273,929 |
| Contingencies,18% Site preparation, Civil works, TEC and Auxiliary | 693,266 |
| Working capital, 15% TEC | 410,894 |
| Total fixed investment costs (FIC) | 5,299,567 |
| Item | Cost |
|---|---|
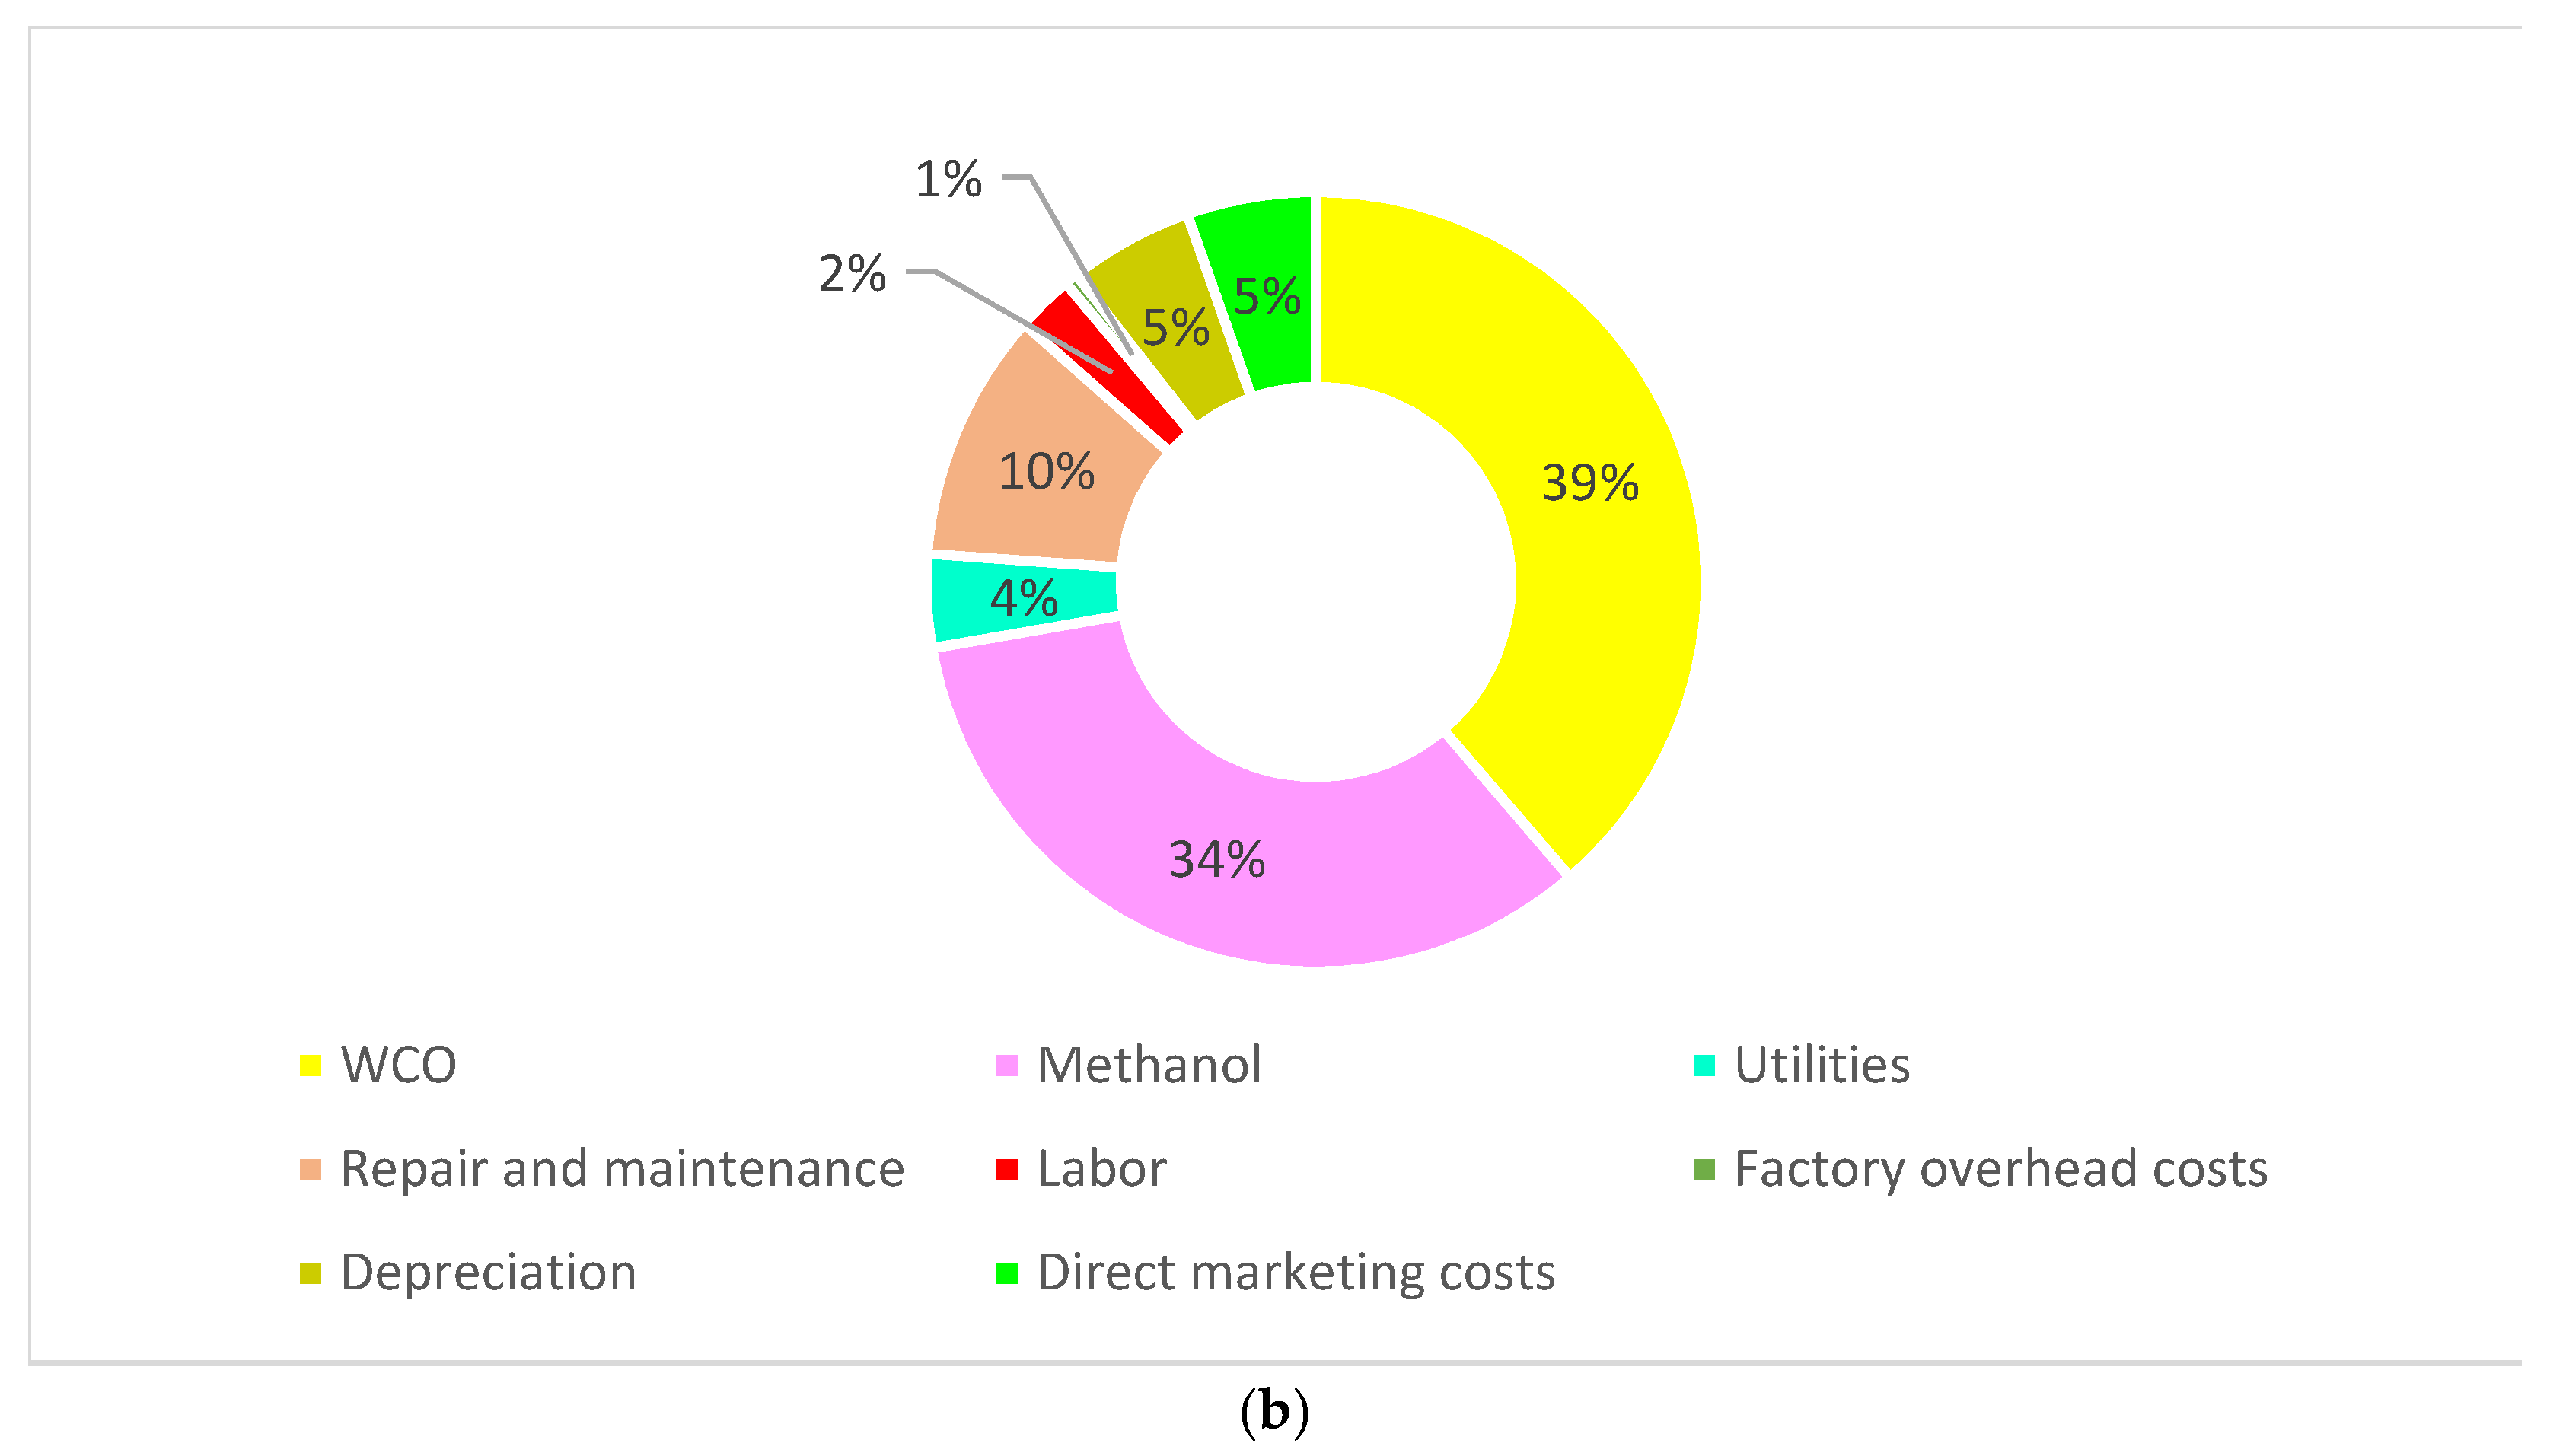
| WCO a | 2,043,956 |
| Methanol b | 1,772,837 |
| H2O c | 555 (347.7 kg/h [43]) |
| Utilities d | 204,692 (1,860,838.6 KW) |
| Repair and maintenance | 547,858 |
| Labor e | 125,738 (9 Person/d (in 3 shift)) |
| Factory overhead costs (insurance) | 28,920 |
| OPERATING COSTS | 4,724,001 |
| Depreciation | 273,929 |
| TOTAL PRODUCTION COSTS | 4,997,930 |
| Direct marketing costs | 283,180 |
| Total Manufacturing Costs (TMC) | 5,281,110 |
| Unit cost of production biodiesel ($/kg) | 0.53 |
| Item | Cost |
|---|---|
| Land purchase | 2,240,000 |
| Site preparation and development | 440,800 |
| Civil works, structures and building | 3,211,600 |
| Total land purchase and civil works | 5,800,800 |
| Equipment | |
| REACT1 | 1,248,051 |
| REACT2 | 1,341,318 |
| T-Biodiesel | 2,901,212 |
| T-Glycerol | 2,769,119 |
| Heat exchangers | 4,768,350 |
| Pumps | 7,112,922 |
| Vessels | 2,689,245 |
| Oil storage tank | 6,044,349 |
| Biodiesel storage tank | 5,339,745 |
| Glycerol storage tank | 262,805 |
| Methanol storage tank | 286,699 |
| Total equipment cost (TEC) | 34,799,815 |
| Auxiliary and service plant, 30% TEC | 10,439,944 |
| Project implementation, 10% TEC | 3,479,981 |
| Contingencies,18% Civil works, TEC and Auxiliary | 9,187,301 |
| Working capital, 15% TEC | 5,219,972 |
| Total investment costs | 68,927,812 |
| Item | Amount | Cost per Unit ($/unit) | Cost ($) |
|---|---|---|---|
| Algal oil | 184,144,433 kg | 0.168 | 31,061,115 |
| Methanol | 102,027,219 kg | 0.3 | 30,608,166 |
| NaOH | 2,222,659 kg | 4.34 | 9,646,340 |
| HCl | 717,987 kg | 1.519 | 1,090,622 |
| Water | 64,577m3 | 2.891 | 186,692 |
| Total raw material costs | 72,592,935 | ||
| Heating utility | 17,376,480 kwh | 1,911,413 | |
| Cooling utility | 21,170,160 kwh | 2,328,718 | |
| Electricity | 201,454 | ||
| Total Energy costs | 4,441,585 | ||
| Operating labor | 4,856,008 | ||
| Supervisory and clerical labor | 728,401 | ||
| Laboratory charges | 728,401 | ||
| Additional overhead | 1,116,882 | ||
| Repair and maintenance | 10,439,944 | ||
| Depreciation | 3,479,981 | ||
| Distribution and selling costs | 1,258,144 | ||
| Total Manufacturing Costs | 99,669,281 | ||
| Unit cost of biodiesel ($/kg) | 0.543 |
| Microalgae | Sludge | WCO | |
|---|---|---|---|
| Total fixed investment costs | 68,927,812 | 9,860,995 | 5,299,567 |
| Gross unit price ($/kg) | 0.8 | 0.8 | 0.8 |
| unit cost of production biodiesel ($/kg) | 0.543 | 0.567 | 0.53 |
| Plant capacity (kg) | 183,592,000 | 5,683,296 | 9,959,375 |
| Break-even sales ($/kg) | 1.168 | 5.957 | 1.576 |
| Microalgae | Sludge | WCO | Biorefinery | |
|---|---|---|---|---|
| Total fixed investment costs | 68,927,812 | 9,860,995 | 5,299,567 | 80,770,739 |
| Biodiesel | 146,873,600 | 4,546,637 | 7,967,500 | 159,387,737 |
| Glycerin | 5,801,507 | 6508 | 436,611 | 443,119 |
| K2SO4 | 0 | 79,566 | 0 | 79,566 |
| Total sales revenue | 152,675,107 | 4,632,711 | 8,404,111 | 159,910,422 |
| Total manufacturing costs | 99,669,281 | 3,220,938 | 5,281,110 | 108,171,329 |
| Tax (9%) | 4,770,524 | 127,059 | 281,071 | 4,656,518 |
| Net profit | 48,235,302 | 1,284,714 | 2,841,930 | 51,082,575 |
| Ratios | ||||
| ATROR (%) | 29.16 | 10.33 | 25.87 | 27.92 |
| Normal payback (years) | 3.43 | 9.67 | 3.86 | 3.58 |
Publisher’s Note: MDPI stays neutral with regard to jurisdictional claims in published maps and institutional affiliations. |
© 2022 by the authors. Licensee MDPI, Basel, Switzerland. This article is an open access article distributed under the terms and conditions of the Creative Commons Attribution (CC BY) license (https://creativecommons.org/licenses/by/4.0/).
Share and Cite
Ruhani, B.; Movahedi, P.; Saadi, S.; Ghasemi, A.; Kheradmand, A.; Dibaj, M.; Akrami, M. Comprehensive Techno-Economic Analysis of a Multi-Feedstock Biorefinery Plant in Oil-Rich Country: A Case Study of Iran. Sustainability 2022, 14, 1017. https://doi.org/10.3390/su14021017
Ruhani B, Movahedi P, Saadi S, Ghasemi A, Kheradmand A, Dibaj M, Akrami M. Comprehensive Techno-Economic Analysis of a Multi-Feedstock Biorefinery Plant in Oil-Rich Country: A Case Study of Iran. Sustainability. 2022; 14(2):1017. https://doi.org/10.3390/su14021017
Chicago/Turabian StyleRuhani, Behrooz, Parsa Movahedi, Sajad Saadi, Amir Ghasemi, Amanj Kheradmand, Mahdieh Dibaj, and Mohammad Akrami. 2022. "Comprehensive Techno-Economic Analysis of a Multi-Feedstock Biorefinery Plant in Oil-Rich Country: A Case Study of Iran" Sustainability 14, no. 2: 1017. https://doi.org/10.3390/su14021017