Article

A Pathway for the German Energy Sector Compatible with a 1.5 °C Carbon Budget

1
Institute of Networked Energy Systems, German Aerospace Center (DLR), 70563 Stuttgart, Germany
2
Institute of Environmental Sciences (CML), Leiden University, 2333 CC Leiden, The Netherlands
*
Author to whom correspondence should be addressed.
Sustainability 2022, 14(2), 1025; https://doi.org/10.3390/su14021025
Submission received: 8 December 2021 / Revised: 31 December 2021 / Accepted: 2 January 2022 / Published: 17 January 2022
(This article belongs to the Special Issue Analyzing Development Paths of Emerging Energy Technologies)

Abstract

:
We present an energy transition pathway constrained by a total CO2 budget of 7 Gt allocated to the German energy system after 2020, the Budget Scenario (BS). We apply a normative backcasting approach for scenario building based on historical data and assumptions from existing scenario studies. The modeling approach combines a comprehensive energy system model (ESM) with REMix—a cost optimization model for power and heat that explicitly incorporates sector coupling. To achieve the necessary CO2 reduction, the scenario focuses on electrifying all end use sectors until 2030, adding 1.5–2 million electric vehicles to the road per year. In buildings, 400,000–500,000 heat pumps would be installed annually by 2030, and the share of district heating would double until 2050. In the scenario, coal needs to be phased out by 2030. Wind and Photovoltaic (PV) capacities would need to more than double to 290 GW by 2030 and reach 500 GW by 2050. The BS results indicate that a significant acceleration of the energy transition is necessary before 2030 and that this higher pace must be maintained thereafter until 2050.

Graphical Abstract

1. Introduction

The Nationally Determined Contributions (NDCs) of the Paris agreement submitted by countries are far from sufficient to prevent temperature increase beyond 1.5 °C [1]. One reason is that even though we are comparatively certain about the limitations of the remaining global carbon budget [2], no agreement has been reached how to share the burden among nations. This is not only due to a large uncertainty of the carbon budget [3], but also due to unsolved issues on equity and responsibility [4,5]. A few things, however, are certain if climate change is to be avoided: Each country will have to face a limited carbon budget and will require resolute and fast mitigation actions in all economic sectors.
The energy system is responsible for 65% of today’s total Greenhouse Gas (GHG) emissions [6] and, thus, has to contribute the main share of avoiding emissions. This is even more important in strongly industrialized countries, such as Germany, where the consumption of fossil energy accounts for more than 90% of CO2 emissions [7]. This is in general acknowledged by society and policy, e.g., in Europe with the Green deal [8] or by China’s plan to achieve carbon neutrality before 2060 [9]. It is clear that far-reaching technological transformations are required that will fundamentally change the way we generate and use energy. There are different views on key options and development paths for this, which have been and are being presented in numerous scenario-based studies and modeling (see, e.g., [10]).
The choice of emission reduction strategies determines the requirements of specific infrastructural developments to enable a transition in the next decades. According to [5], policy plans for net-zero all over the world are lacking in detail and consistency when proposing their net-zero targets. Moreover, [5] claims that, beyond long-term targets, shorter perspectives are necessary to adequately adapt transformation to emission reduction requirements.
While the carbon budget as a reference point has been addressed by climate research for the energy sector for a considerable time [11], energy system research has not adopted this concept as a general guideline yet. Previous energy scenarios for Germany focused on reaching a share of 100% renewable energy (RE) or net-zero by 2050 or 2045; so far, they have not considered cumulative emissions compared to the carbon budget on a national level. The Wuppertal Institute presented a rough sketch of what would be necessary in various sectors including the energy sector to comply with the Paris Agreement. They set a German carbon budget of 4.2 Gt from 2020–2050 [12] with a resulting system configuration for 2035; however, they did not present the necessary steps in between.
Up to now, no study presented a detailed long-term energy scenario for Germany, which consistently linked a transition pathway to a nationally fixed carbon budget. Thus, in our study, we elaborate on what would be necessary to comply with a carbon budget specifically for the energy sector in Germany in line with the 1.5 °C target. This can help overcome the shortcomings of most existing studies that focus only on carbon limits for target years and currently still underestimate the burden of past emissions and the necessary speed with which net-zero technologies must be implemented.
We explore one exemplary transition pathway that stays within this carbon budget and thus represents an upper bound of the required technology switch. We follow a deterministic approach on the one hand and a complementary cost optimization of supply infrastructures on the other without claiming that this leads to an optimal or particularly probable scenario. Our modeling approach particularly addresses interactions between the different energy sectors, which appear to be particularly necessary for an effective transition. In detail, we focus on the following research questions:
What kind of technology transition is necessary to supply German energy demand in transport and heat sectors under a strict carbon budget restraint? How does this translate into installation of new technologies and the transformation of the energy supply? From recent scenarios, it is already clear that electrification will play a major role in the energy transition. Our study, therefore, addresses how fast the power sector has to change to renewables beyond the current political targets to accommodate not only electricity demand but also a transport and heat transition.
In the following Section 2, we focus on scenario development and our approach to couple an energy accounting framework with an economic linear optimization model. We provide details of the underlying technology data, the assumptions and the storyline for the net-zero Budget Scenario in Section 3. In Section 4, we present the results of the scenario quantification with regard to energy supply and CO2 emissions. The potential implications of the technology transition are given in the discussion and conclusion (Section 5 and Section 6).

2. Materials and Methods

We develop a normative scenario by applying a backcasting approach and following the steps proposed by [13]. The target is to achieve a net-zero energy system in Germany by 2050 while also remaining within the carbon budget of a 1.5 °C climate target. With regard to greenhouse gases, we limit our modeling to CO2 emissions (see Section 2.1 and Section 2.2). We first define the current structure of energy consumption and production in Germany within our energy system model approach (Section 2.3, Section 2.4, Section 2.5 and Section 2.6).
Then, we define the scenario limitations by assumptions about (1) socio-economic developments (see Section 3.1), such as future Gross domestic product (GDP) and population, (2) future energy demand per sector (see Section 3.2), and (3) technological limitations and targets for energy supply in 2050 (see Section 3.3). Based on the system setup for 2050, we identify the necessary technology transitions in the industry, transport, residential, as well as services and other commercial sectors in order to achieve the target. The outcome is a transition pathway of energy supply for all sectors.

2.1. Target and Storyline: Assessing the Limits of a Carbon Budget for the Energy System

The overall storyline focuses on a society that succeeds in limiting CO2 emissions as a vital step towards climate neutrality. As elaborated in the introduction, the 1.5 °C target depends on limiting cumulative emissions, not only net-zero emissions in a far future.
Thus, our scenario aims at technology change that is guided by a CO2 budget for the German energy system, which may not be exceeded in the future. The net-zero Budget Scenario (BS) focuses on additional efficiency improvements and on achieving an almost 100% renewable energy system by 2050 for Germany by replacing all fossil fuels in the power, heat and transport sector either by renewable electricity, heat or green synthetic fuels.
We specifically exclude the option of an overshoot scenario, which would have to rely on carbon dioxide removal (CDR) technologies for storage, in order to assess an upper limit of a necessary energy transition and its included costs. This is guided by the premise of the energy sector’s own responsibility to avoid existing emissions, reserving CDR options for emissions harder to avoid than in the energy sector. Moreover, many CDR technologies feature additional energy demand and, thus, put an additional burden on the renewable energy potential, which, at least for Germany, faces physical, technical, and societal limits.

2.2. Definition of a Carbon Budget for the German Energy Sector

To date, national carbon budgets have neither been agreed upon nor is there a consensus on how they will be calculated. If the equal per capita or the grandfathering approaches are applied, carbon budgets for Germany range from 3.5–13.3 Gt CO2 [14].
Here, we assume the contraction and convergence approach (C&C) [15], as it is considered “the best possible solution to the twin problems of climate change and inequity” [16]. Under the C&C approach, the total carbon budget for Germany ranges from 7 to 8 Gt CO2 for the time period of 2020 to 2050 as calculated by [14]. The C&C approach consists of two phases (see Figure 1) [17]. In the first phase, the convergence phase, current national emissions per capita decrease (or increase) until they reach a globally unified value of equal per capita emissions in 2035.
This provides time for nations for systemic transformations. Then, all nations are supposed to adhere to this globally unified equal per capita emission rate, which reaches net-zero by 2050. The range of the carbon budget results from different assumptions about the starting year for the C&C approach.
Our Energy System Model (see Section 2.3) accounts for all CO2 emissions emitted in the energy system, including the industrial emissions in the steel sector. In 2019, this combined system emitted 96% of Germany’s CO2 emissions [7]. Based on these current shares and the total budget from [14], we allocate a range of 6.5 to 7.5 Gt of CO2 to the extended energy sector, that serves as a constraint to future demand and supply developments.
We start the backcasting approach from 2050 and develop the scenario backward to 2020 in five-year steps. The technical background for the scenario development, i.e., our energy system models and technology data, is described in the next sections. Beyond that, a large variety of underlying assumptions is made, based on statistical data, literature and expert judgement (see Section 3).

2.3. Modeling Approach: Energy System Modeling, Cost Optimization and Model Coupling

In order to identify the transformation pathways for an energy system, while also characterizing fluctuating, variable renewable energy (VRE) sources, we couple the Energy System Model (ESM)—an accounting framework for energy balances on annual basis, and a linear system optimization model (REMix) with hourly resolution.

2.3.1. Energy System Model (ESM)

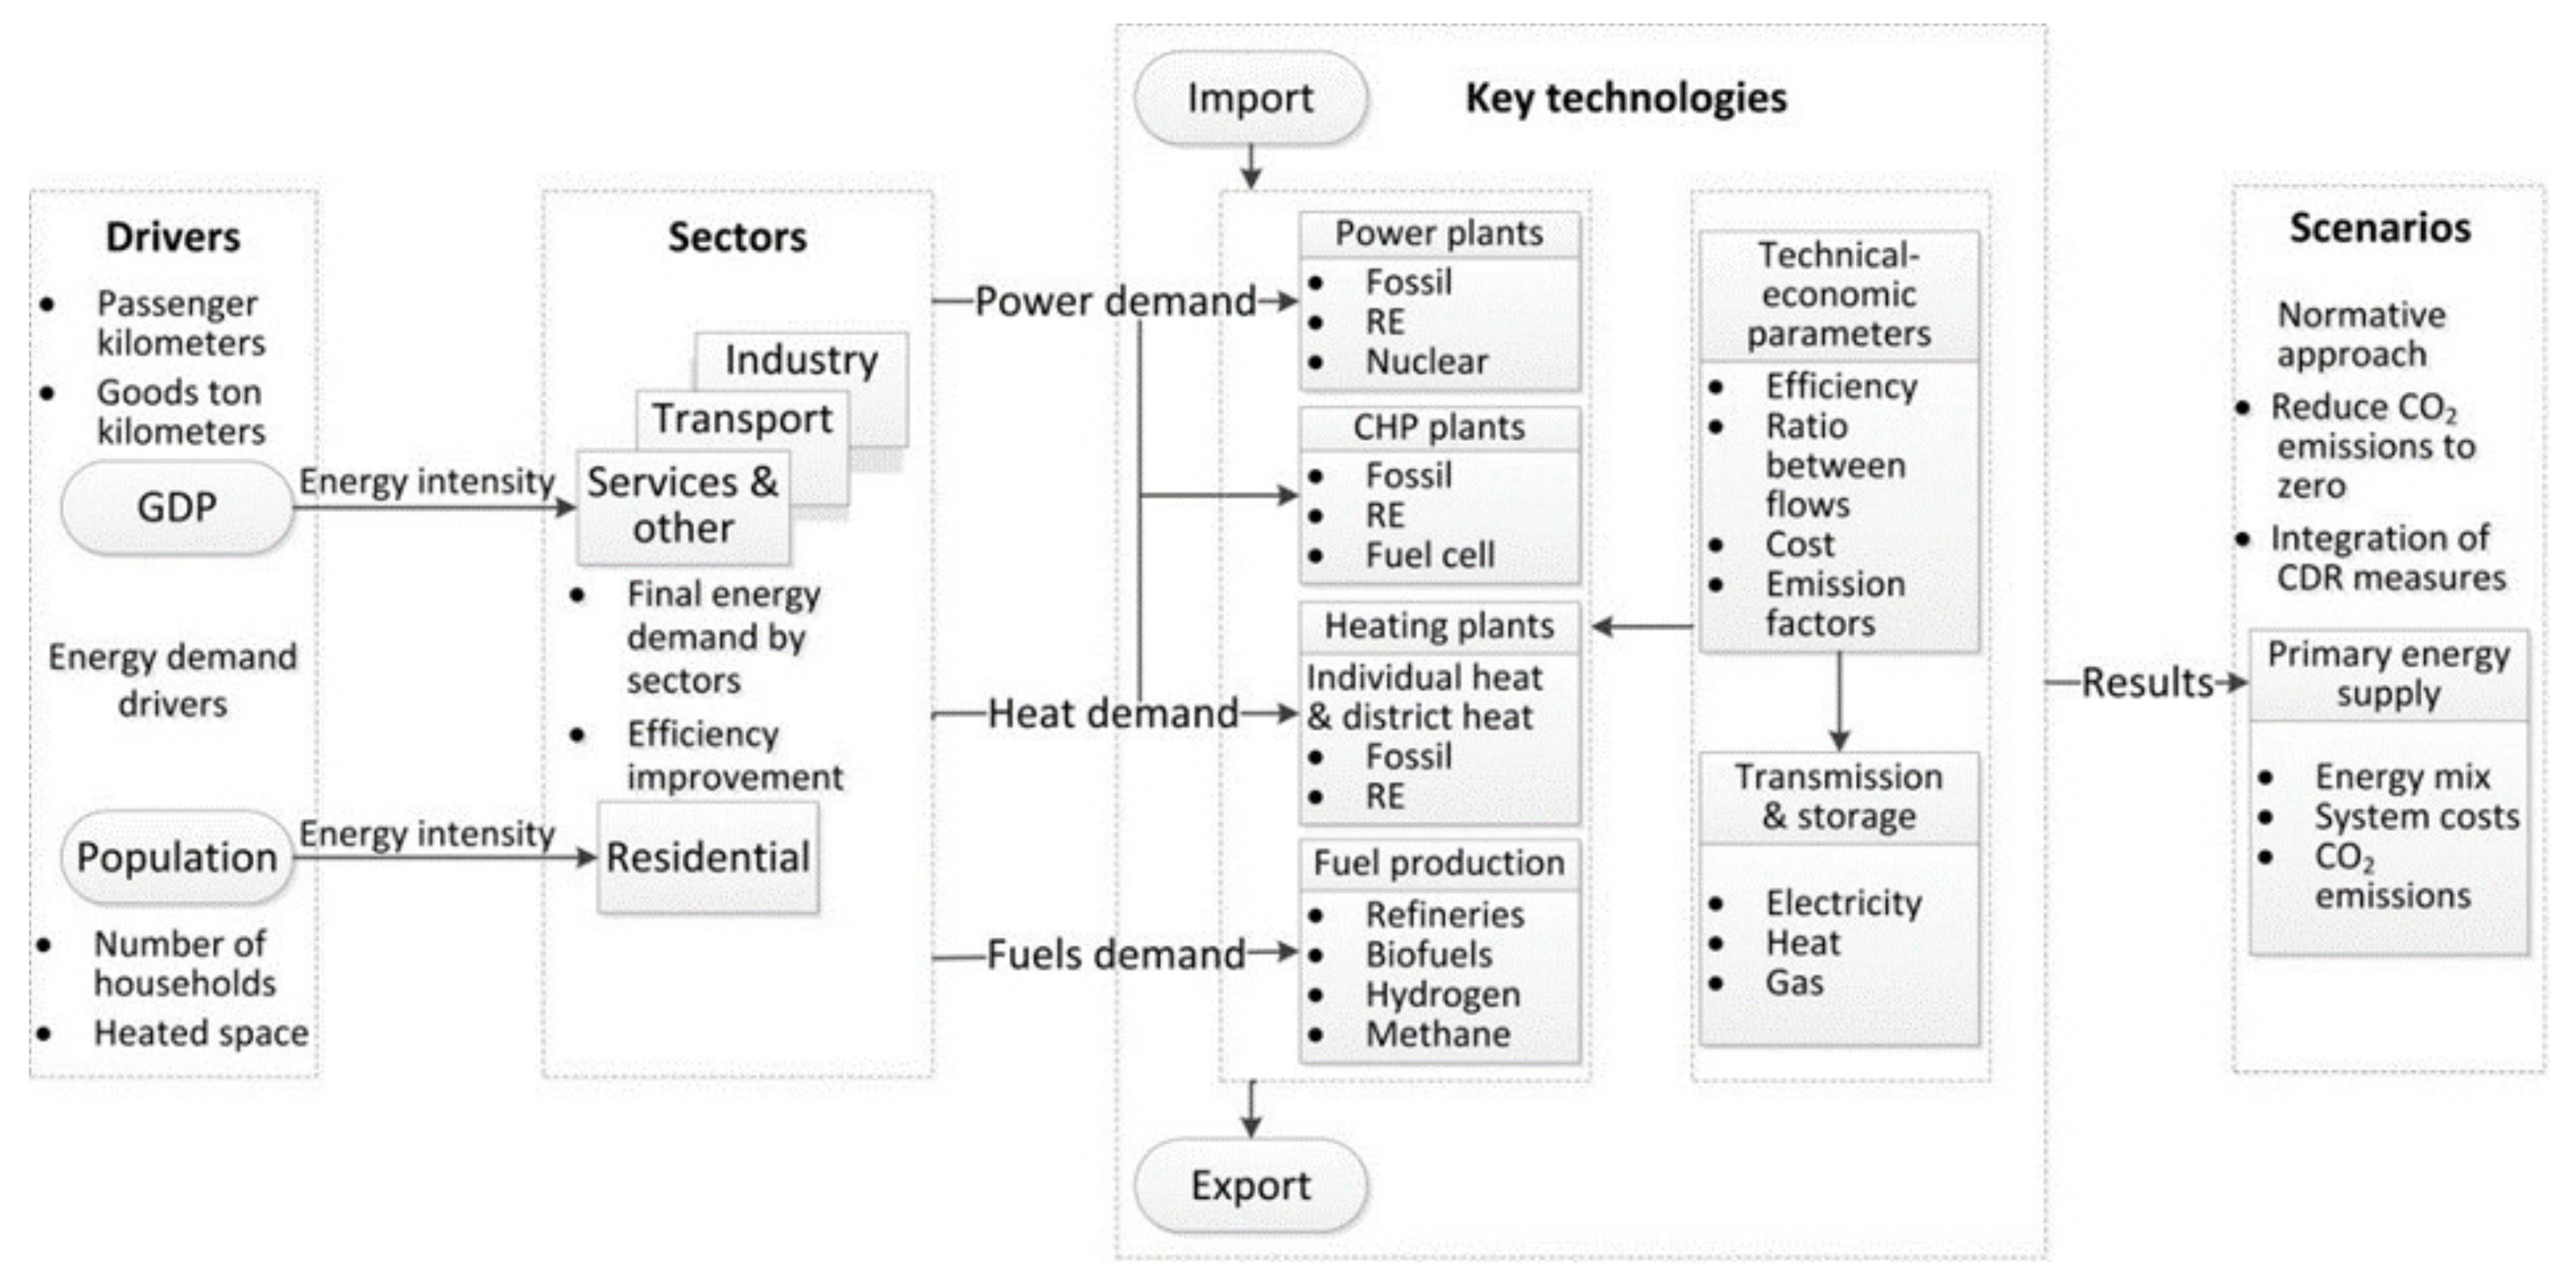
Our ESM is a framework for balancing energy demand and supply of a given region over a given time period. In this study, it is applied to develop the transformation scenario for the overall energy system, including the residential, industry, transport and services and other sectors, as well as the transformation sector, including power, combined heat and power (CHP), fuel and heat production etc. Figure 2 gives an overview about the sectoral disaggregation and the range of primary energy carriers and supply technologies covered by the ESM.
The ESM quantifies energy demand development pathways (see assumptions in Section 3), driven by GDP and population from the below defined framing scenario, assessing and projecting the energy intensity. Additional sectoral drivers are considered for transportation in terms of passenger kilometers and ton kilometers. The model assesses the required energy supply structure: namely, power and heat installed capacities and their costs, as well as CO2 emissions from a broad range of technologies in the above-mentioned end-use sectors.
The model is calibrated with statistical data for the years 2001–2019. The main inputs are the German energy balances 2019 and previous years [18,19] as well as official energy statistics from the Federal Ministry of Economy and Energy for 2019 [20,21] and previous years. The model represents a time frame up to 2050, divided by five-year intervals. The model calculates annual primary energy, summing up useful energy in each sector disaggregated by technology and multiplied by efficiency factors as represented by the following equations, previously published in [22]:
TFD ( s , t ) = s S t T s UED s MS s ,   t η t
TPE ( f ) = f F FED f η tt
where
TFD = total final energy demand,
s = a specific energy sector,
t = a specific technology of a sector,
MS = market share of a technology in a sector,
UED = total useful energy demand of a sector,
η = efficiency of a technology,
TPE = total primary energy demand of a country,
f = fuel type, and
tt = transformation technology.
Refer to [22,23] for a more detailed description of the model structure.
The technologies are characterized by efficiencies and ratios that disaggregate energy flows (see Section 2.6) for technologies with more than one energy input or output—e.g., for CHP plants and hybrid vehicles. Additionally, it applies specific CO2 emission factors for fossil energy carriers.
However, the transmission and storage of electricity, heat, and gas is only roughly represented due to the limitation of the temporal resolution on a yearly basis. This also limits the representation of VRE. For these reasons, we couple the optimization model REMix to allow for a system cost optimized deployment of renewables, specifically VRE, including a detailed assessment of grid and storage infrastructures required for the developed pathway.

2.3.2. REMix

The energy system optimization model REMix combines two models (see Figure 3): EnDAT, which provides the temporal load and the feed-in renewable energy (RE) profiles for each model region; and REMix-Optimo, which optimizes the expansion and operation of the energy system. REMix minimizes the total system cost from a central economic planner’s point of view with perfect foresight. The total system cost includes not only operation, fuel and CO2 certificate costs but also investment costs for model endogenously built capacities. The proportional capital costs of the installed capacities are calculated from technology investment costs and fixed operation and maintenance (O&M) costs, amortization times and interest rates. A detailed model description can be found in [24,25,26], including all relevant equations of the optimization algorithm.
In our study, we consider the power sector, which is coupled to the heating, transport, industry, and gas sector. The gas sector consists of gas production, usage, storage, imports and transmission. Among these, synthetic gas can be produced through electrolysis and methanation powered by renewable energy. Additionally, we included two model constraints to the optimization: upper limits for CO2 emissions, and a minimum of remaining CHP capacities for biomass. Considering the input data for the technological and economical parameters, the weather and load profiles from EnDAT and the additional model constraints, REMix optimizes the energy system and provides the optimized expansion and dispatch of the infrastructures, the total system costs and the annual CO2 emissions as output.

2.4. System Boundary

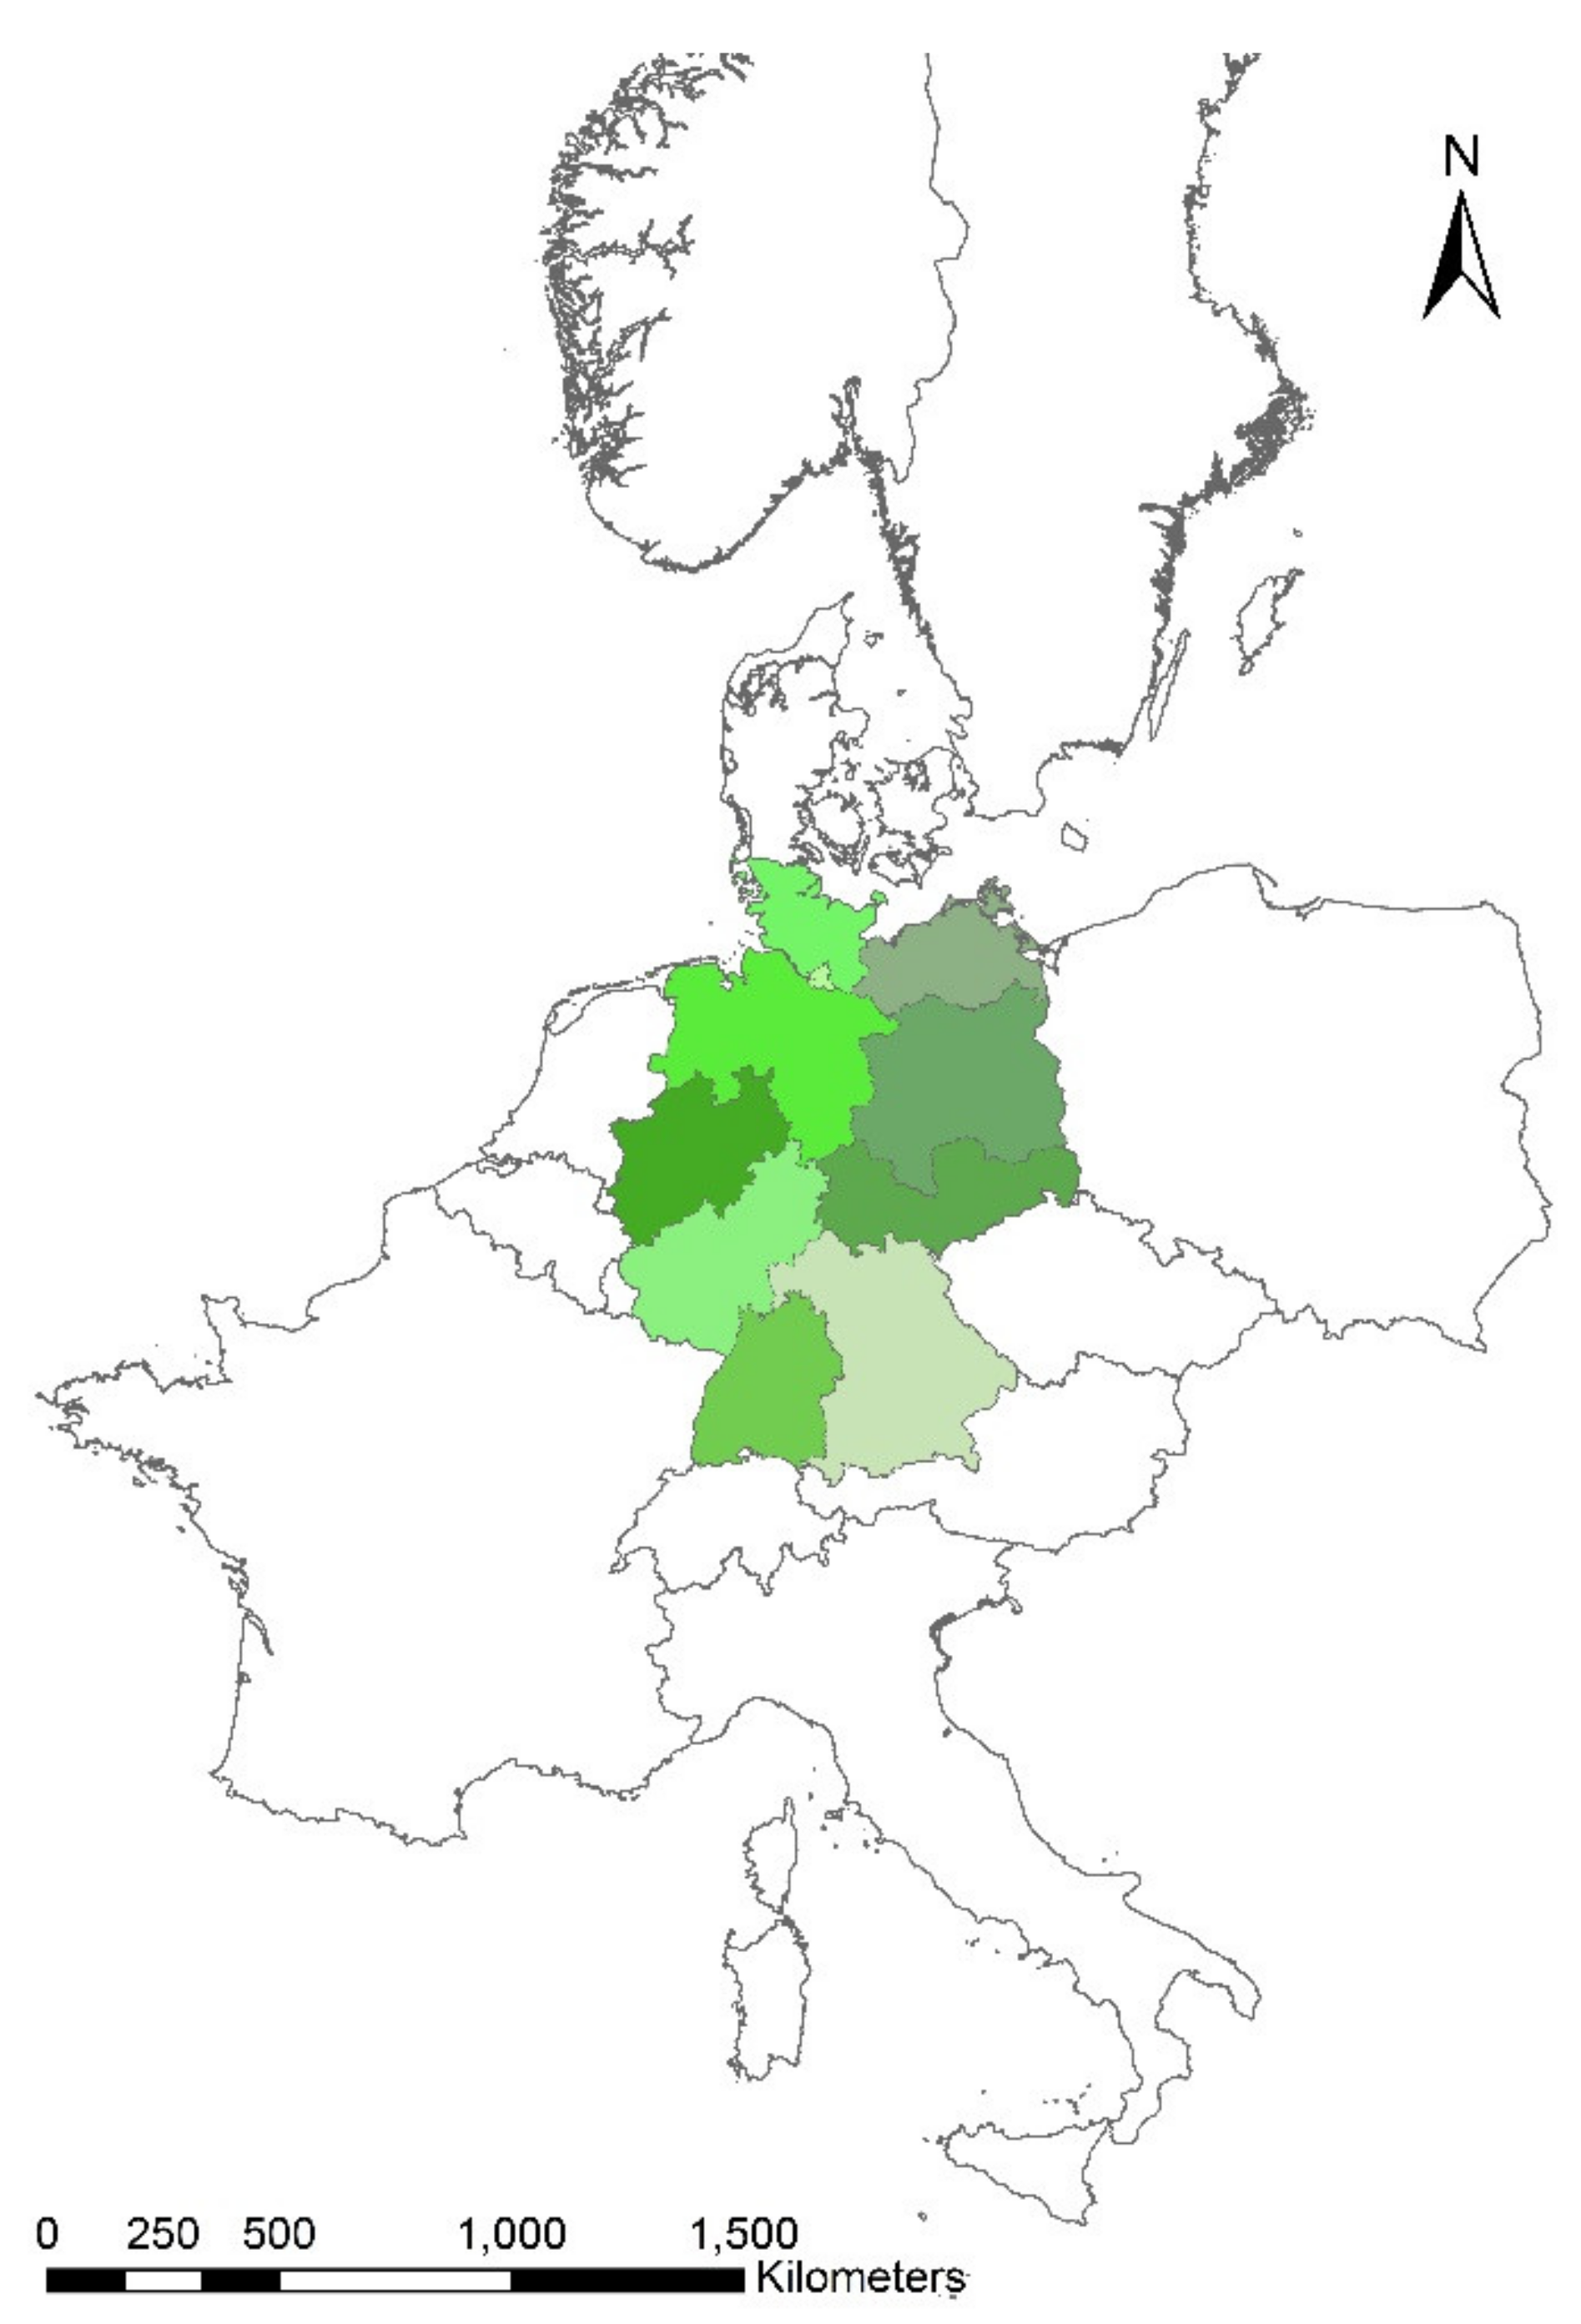
For the ESM, we limit our analysis to Germany with an assessment of net imports of synthetic fuels and power. However, for REMix, we adapt the strict system boundaries of Germany due to the requirements of the trans-European power grid. As shown in Figure 4, our REMix modelling focuses on Germany with 10 regional nodes, while 12 additional nodes model its neighboring countries. The power exchange is represented by high-voltage alternating current (HVAC) and high-voltage direct current (HVDC) lines that connect the neighboring model nodes. In our study, REMix comprises 22 regions, about 90 technologies and 8760 h for the scenario years of 2020, 2030, 2040 and 2050.
The optimization with REMix is performed with a myopic approach that optimizes the four scenario years sequentially. The optimized capacities of each model run are passed on to the next scenario year, while technology components that exceed their lifetime are decommissioned. For the sensitivity analysis, we simplified the model to a 3-h resolution, in order to reduce the calculation time.

2.5. Model Coupling

The scenario from the ESM partly serves as the exogenous input for the REMix model (see Figure 5). This applies to the demand of electricity for conventional consumption and electric mobility as well as the total heat demand and the share of electricity envisaged for heat. It also includes the demand of synthetic energy carriers, namely hydrogen and synthetic methane for transport and process heat. Technical assumptions, such as future reduction potentials linked to renewable technology investments, efficiencies or energy losses in the production of synthetic energy carriers, are consistently adhered to between the two models.
The output of REMix in turn serves as an input for the supply side of the ESM, defining the capacities for the power sector and for sector coupling. It primarily involves additionally installed capacities and the utilization in terms of full-load hours (FLH). Furthermore, the additional electrical demand for hydrogen reconversion, e.g., in backup power plants or losses due to electricity storage and long-distance transport via the power grid, are also included. The parameter exchange between the models is detailed in S1 in the Supplementary Materials.

2.6. Technology Data

Both the ESM and REMix rely on the same set of current and future techno-economic assumptions. This technology data set comprises:
  • Technical lifetime.
  • Specific investment costs.
  • Specific fixed operation and maintenance costs.
  • Specific variable operating and maintenance costs.
  • Efficiency.
Specifically, we updated data for technologies to be implemented in large capacities such as PV, wind and balancing capacities, which are crucial for the energy transition. Significant cost reductions would be expected in PV and wind power with an increasing lifetime accordingly. Thus, we adapted existing cost projections from [29] by [30,31,32] (see Table 1). Especially investment costs are expected to decrease significantly between 2020 and 2050 by 40% for PV and offshore wind and 16% for onshore wind.
Lithium-ion batteries also see significant technology development. Investment costs decline by 50% for both storage and converter units with increasing life time. For gas converting technologies, such as electrolyzers and methanation, a reduction of investment costs is projected, by 61% and 47%, respectively, from 2020 to 2050. Other techno-economic input data for REMix and the ESM refer to [33]. All relevant deviations from the original data set are documented in the SI in S2.
Table 1. Techno-economic parameters of the main technologies in REMix and ESM.
Specific Investment CostsLifetimeSpecific Fixed Operation and Maintenance CostEfficiency
Renewable Power
Technology
Scenario YearEUR2016/kWYearsEUR2016/kW%
Run of river *2020–2050427360214100
Photovoltaic *20209002515100
20307003012
20406003010
2050540309
Offshore wind *2020350020110100
203022502590
204021003085
205021003075
Onshore wind *202013102045100
203012502245
204011802540
205011002538
Gas converting technology
Electrolyzer [34]2020900251869
20305501174
2040450977
2050350780
Methanation [35]202015002537.575
203010002580
204090022.585
20508002090
Storage technologyEUR2016/kWhyearsEUR2016/kWh%
Lithium-ion battery (storage) [36,37]2020300212.793
2030225221.894
2040188231.195
2050150250.897
* own assumptions based on [29,30,31,32].

3. Scenario Assumptions for the Budget Scenario (BS)

Our approach distinguishes between the general socio-economic frame and the technology-based energy scenario. The framing scenario provides a common background for comparing the net-zero BS with other scenario work and is described in the first section. Assumptions on the development of final energy demand are also derived exogenously from the literature and described in the second section. Beyond that, we provide details on the target-driven technology development in the year 2050 from which we start the backcasting procedure.

3.1. Socio Economic Frame

The socio-economic framing data describe a likely development of the German society in an explorative approach. It is based on the German National Energy and Climate Plan (NECP) [38,39]. From the NECP, we derive projections for GDP and population until 2050, as well as fuel and CO2 prices (Table 2).
We supplement these fuel costs with own assumptions on biomass, waste and hydrogen (Table 3), which are not provided by the NECP.

3.2. Demand Assumptions by Sector

The demand structure is based on a variety of assumptions on additional efficiency potentials, reaching lower energy intensities for final energy demand. The transport sector relies on an existing transport study and the residential and services/other commercial sectors on a literature review. For industry, we develop an own specific modeling. To adapt these demand projections for the BS, final energy demand was translated to useful energy and “energy services”, such as person or ton kilometers (pkm and tkm) or production of steel.

3.2.1. Residential and Services and Other Sectors

The BS follows the “Klimaschutzplan”-Scenario from the NECP [39] until 2030 for the useful energy demand in the residential and services and other sectors. From 2030 to 2050, our demand assumptions are based on a scenario comparison, evaluating the demand range of 62 scenarios from 21 studies for Germany from [10] (for details see S3 and S4 in the SI). For the BS, we therefore select the median demand projection for 2050. The residential sector achieves an intensity of 0.33 GJ per EUR2016, which means a 53% reduction in energy intensity per GDP and 36% per capita compared to 2016. The aggregated remaining sectors, which subsume all not previously mentioned sectors such as services and commerce, agriculture, forestry etc. reach an intensity of 0.17 GJ per EUR2016 in 2050, which represents a 60% intensity reduction compared to 2016.

3.2.2. Industry

Industry is considered as a hard-to-abate sector [43,44] since many production processes currently depend on fossil fuels as raw material input for chemical reactions or as energy input to achieve high temperatures. Thus, we consider process-specific analyses and develop detailed decarbonization pathways for process heat for iron and steel as well as cement production—the two sectors with the largest energy demand for high temperatures [45,46].
For all other industrial energy demand (power, space heat and hot water etc.) as well as process heat for the remaining industry sectors, we assume a constant production and a decreasing energy intensity of 2% per year until 2050. This reduction is derived from historic trends from before 2018 calculated from [18,20] and adapted to [35].
For steel, we focus on a technology-switch from the current coal-based primary production to hydrogen- and electricity-based primary production by 2050 [47]. This means that the coal-based blast-furnace route is gradually replaced by the novel technologies of hydrogen-based direct reduction [48] and electricity-based electrowinning [49].
Similarly, for cement, our scenario describes a shift to best-available technology [50], which are firstly rotary kilns with precalciners [51] and from 2030 onwards with electrified precalciners. Additionally, we assume an energy efficiency improvement by 3% and a decreasing clinker to cement ratio from 0.75 to 0.57 from 2020 to 2050 [50,51].

3.2.3. Transport

The projection of transport demand is derived from a detailed scenario for road and rail, provided by a dedicated transport scenario study [52]. For national navigation, we use assumptions corresponding to the project work from [53] and the future fuel demand for aviation is derived from a scenario dependent forecast from [54].
We adopt the “regulated shift” road scenario, with stable passenger transport service in terms of passenger km (pkm) but a strong decrease of 25% in vehicle stocks to around 35 million vehicles. For freight transport, the “regulated shift” scenario envisages a 60% increase in ton kilometers (tkm) until 2040. Key features are a reduction of specific fuel demand for various vehicle types with smaller reductions in conventional internal combustion engines (ICE) and significant reductions in electric drive trains and for hydrogen fuel cell vehicles (EV and FCV).
For the BS, we extend the “regulated shift” scenario trends to 2050. This results in a total demand of 1,270,000 million pkm per year and 954,000 million tkm per year and a specific energy consumption reduction of 10–20% for ICE and 30–40% in EV and FCV per pkm and tkm. For aviation and navigation, we assume a reduced specific energy demand of 10–15% per tkm and 30% per pkm.

3.3. Technological Limitations and Targets for Energy Supply in 2050

The renewable energy potential serves as a major technical limit of the BS (Table 4). For wind and PV, we rely on dedicated potential analyses from EnDAT (see Section 2) on an hourly basis [26,35]. The biomass potential in Germany is derived from [55] for residues and allows for a constant agricultural area dedicated to energy crops from [56,57]. Beyond that, the German energy system is not completely restricted to national potentials, as power and biofuel or synfuel imports are considered in the models. For reasons of plausibility, we limit the net power import to Germany, setting a target of at least 90% national power production.
Additionally, we assume a variety of limitations to the deployment of energy supply technologies, presuming an almost completely renewable energy supply and strong sector coupling. Cooling and mechanical energy are completely electrified by 2050 in the BS. We consider a constant hydropower capacity of 11 GW, including 6 GW of pumped storage [60]. Offshore wind requires a minimum capacity of 20 GW in 2030 and 40 GW in 2040 according to German law [61].
For CHP technologies, we envisage a reduction of fossil applications, phasing out of coal, reduction of gas in favor of dispatchable gas power plants, resulting in a transition to biomass, based on the already existing capacity of solid biomass CHP and biogas plants. For the remaining power sector, we apply the cost optimized expansion and dispatch of power plants under CO2 limitations with REMix.
For space heat and hot water in buildings, we reinforce our previous technology targets for 95% CO2 reduction from [35] towards a CO2-free and balanced energy supply (Table 5). The scenario features a strong focus on district heat and heat pumps and only a marginal residue of gas, but a complete phase out of coal and oil.
For industrial process heat, the main supply comes from power and gas, including hydrogen, i.e., 39% and 33%. It is assumed that some production processes cannot be completely decarbonized and still rely on residual fossil fuels, e.g., in steel production, and on waste incineration as in cement production (see SI S4). Therefore, small amounts of fossil energy are still implemented for process heat in the Budget Scenario (Table 5).
Market shares for alternative drive trains in the transport sector are based on scenarios developed previously [52] for 2040, extended to 2050 by [35,62]. Due to the necessary acceleration until 2030, the transport transition focuses on electrification, both in passenger and freight transport. In 2050, the BS reaches the following market shares:
  • Individual transport is mostly based on hybrid electric vehicles (EREV: 48%), battery electric vehicles (BEV: 39%) and fuel cell vehicles (FCV: 12%).
  • Light duty traffic has similar shares with EREV (32%), BEV (52%) and FCV (16%).
  • Heavy duty traffic features a higher share of FCV (20%) and a focus on catenary electric and hybrid trucks (78%) with significant residual fuel demand.
  • Rail is assumed to be completely electric in 2050.
  • The residual fuel demand, e.g., for hybrid vehicles, navigation and aviation is assumed to come from synfuels (72%) and biofuels (28%).
We derive car numbers from assumptions on average annual mileage per car and occupancy rate based on [52,63].

4. Scenario Results: How Fast Do We Have to Change the Energy Sector?

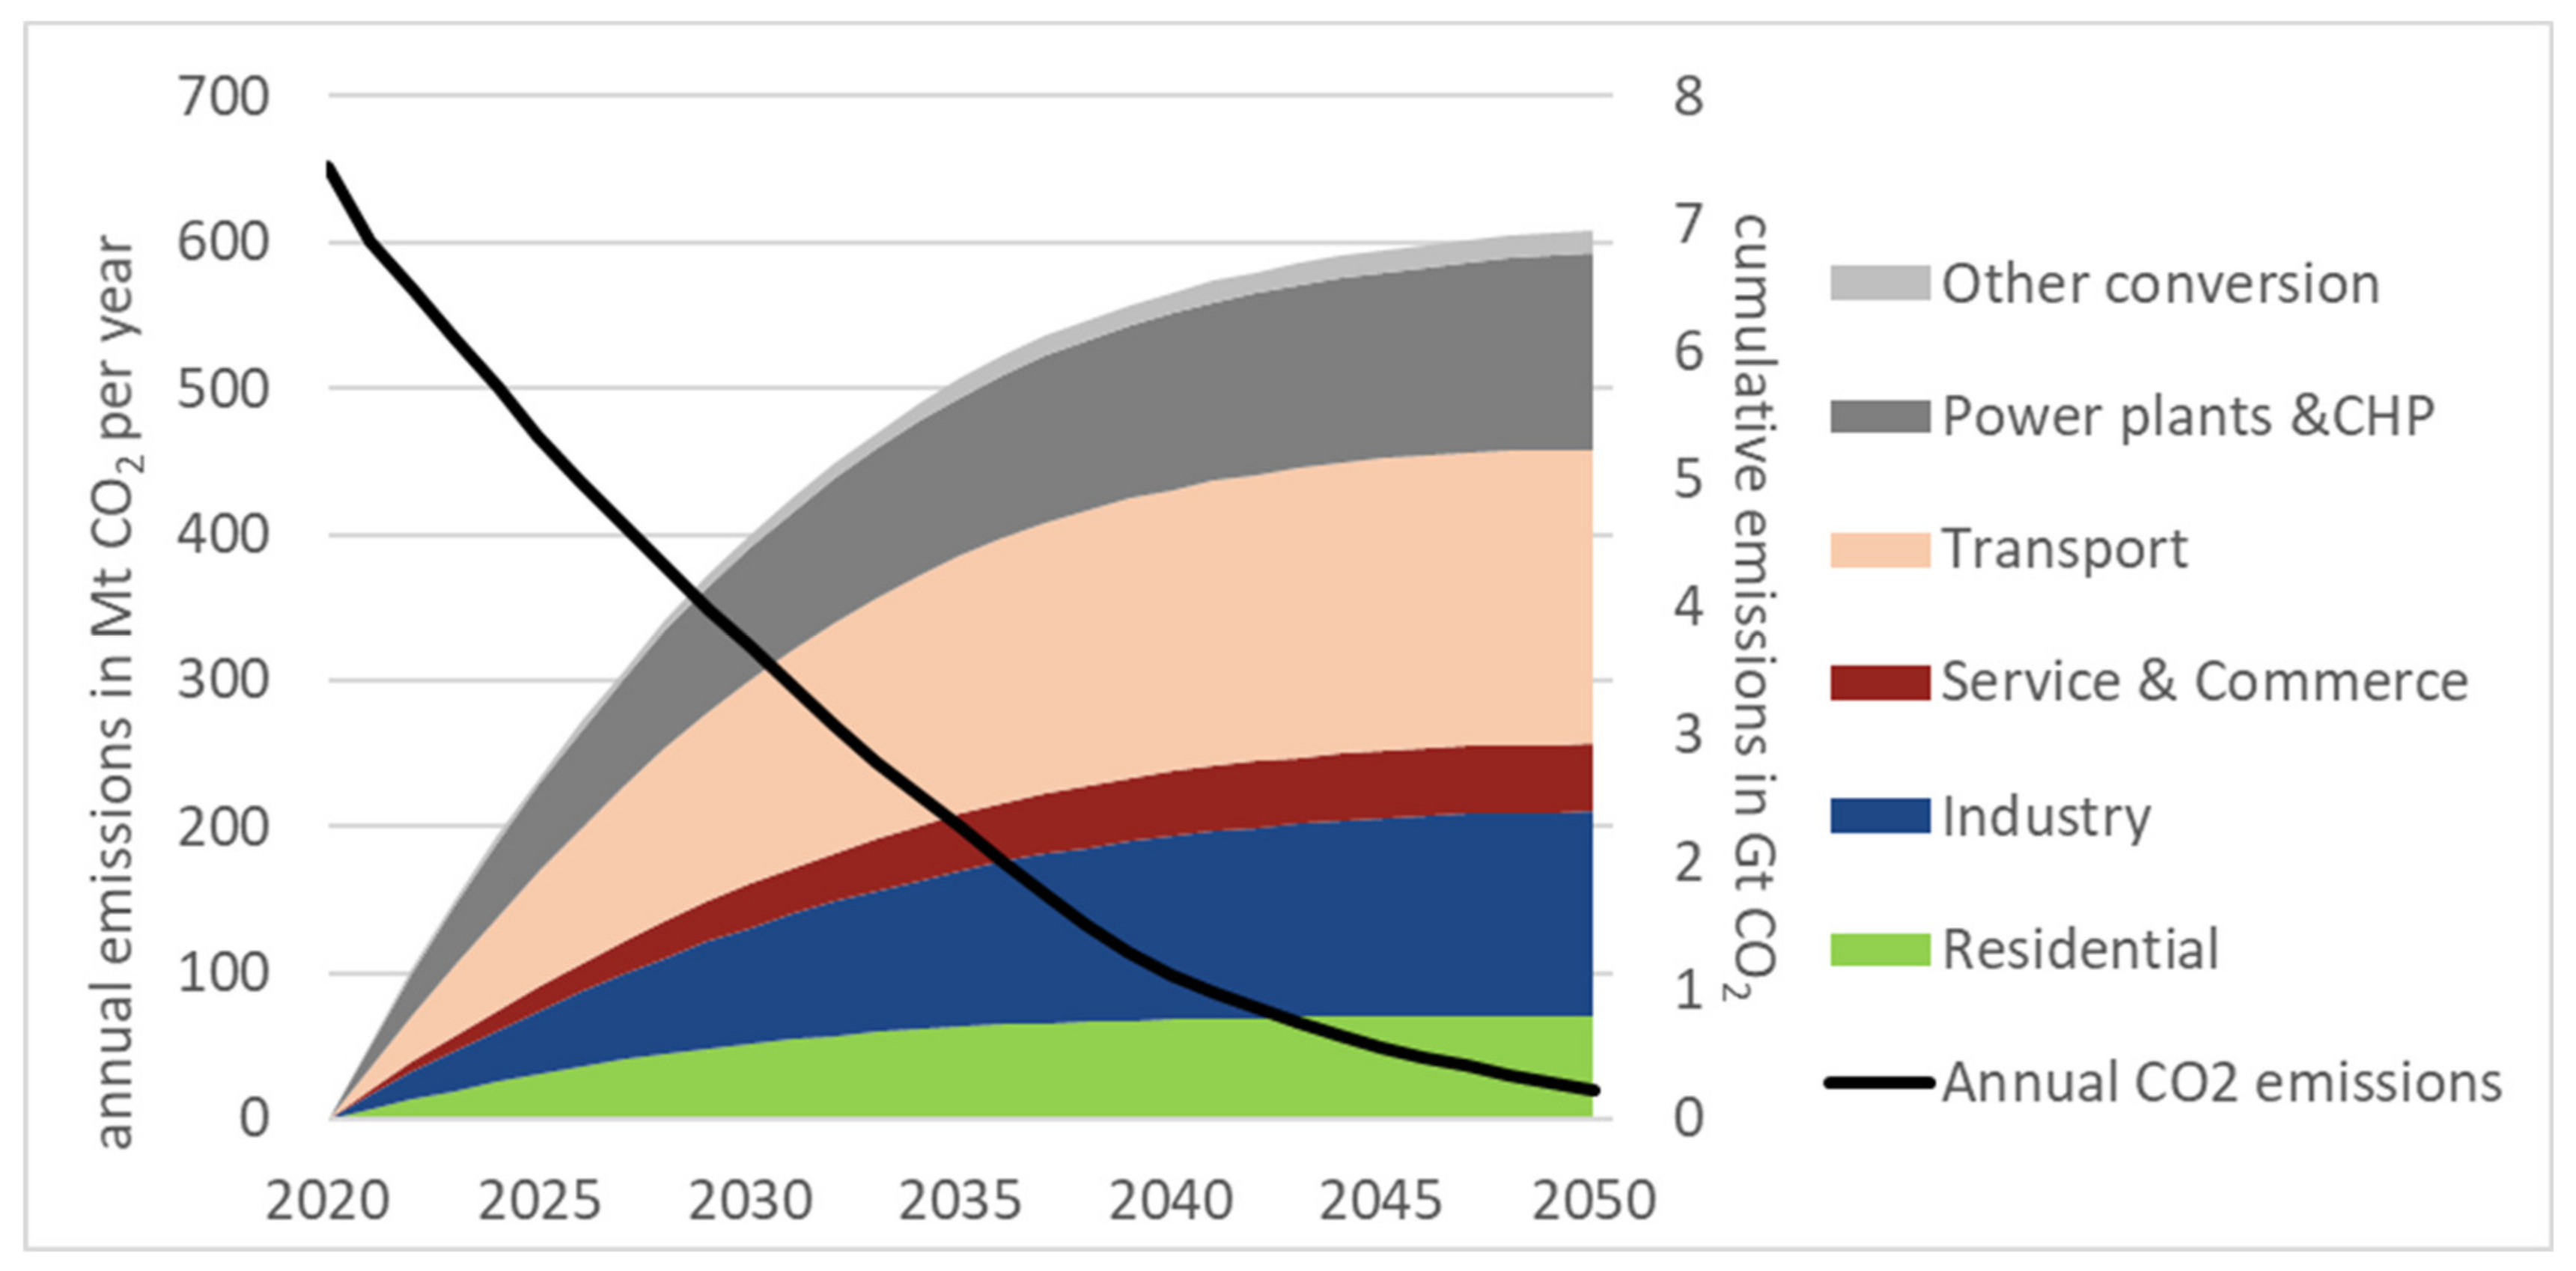
The above described assumptions set the limits for our long-term scenario for a carbon limited society. It is clear that current emissions in the German energy sector of around 650 Mt of CO2 per year would consume the budget of 6.5–7.5 Gt of CO2 in about a decade. Thus, we focus also on the speed of transition specifically until 2030. While we highlight the most relevant transition aspects in the paper, the complete result data set for all analyzed sectors and technologies can be found in S5 and S6 in the SI.

4.1. CO2 Emissions from the Energy System

In the BS, the energy system needs to half CO2 emissions already before 2030 (see Figure 6). With limited time to develop new technologies for CO2 neutral synthetic fuels within the next years, the focus of the transition is first on electrification. Consequently, a decarbonization of the power sector based on renewable technologies, which are already broadly available on the market before 2030 is a prerequisite, reducing CO2 emissions from power plants and CHP by 3/4.
Specifically, the transport (1/3) and the industry sector (1/4) will consume the largest shares of the budget. From 2030 on, hydrogen and synfuels based on renewable power will help to avoid the harder to abate emissions, leading to an overall reduction of 97% of emissions in 2050 compared to 2020. Residual energy-related CO2 emissions result from waste incineration both in the industry and transformation sectors. How this CO2 reduction is implemented over time in the various sectors is shown in the next subsections.

4.2. Energy Demand

Energy statistics show that Germany decreased its final energy demand since 2010 (Figure 7). However, the technology transition in the BS described below requires a significant acceleration in implementing efficiency measures, specifically in the next decade.
The efficiency gains are on the one hand concentrated in the transport sector due to a technology switch to electric mobility. On the other hand, large efficiency gains can be achieved in the household sector through improvements to the building envelope. The assumed efficiency gains as derived from the scenario comparison lead to an overall reduction of energy demand by 37% between 2020 and 2050. These efficiency improvements are a prerequisite for the transition in the energy supply focusing on direct or indirect electrification.

4.2.1. Heat Supply

Heat supply in the BS would rely on an integration of all available renewable energy sources. In the residential, services and other commercial sectors, ambient heat via heat pumps and solar collectors are deployed for space heat and hot water. By 2030, almost 5 million heat pumps are necessary in the BS for buildings in both sectors, increasing to more than 8 million in 2050. Power to heat is increasing already significantly until 2030 in the BS by 1/5 compared to today (services and other commercial sectors), and 1/2 (residential), also due to the electrification of process heat (Figure 8).
Oil and coal are phased out largely by 2040. Heating networks also need to be expanded and rebuilt to handle lower heat densities in the future and supply more buildings than today with a similar amount of energy. With the phase-out of fossil CHP, the heat grids rely mostly on biomass and integrate solar energy, electricity surpluses and waste heat into heat supply via seasonal storage. Synthetic gas and hydrogen play a minor role for heat in the BS, predominantly in buildings, which are difficult to refurbish.
In the industrial sector, an electrification takes place where possible to phase out fossil gas and coal (Figure 8). However, electrification is limited, and hydrogen and syngas are required especially for very high temperatures or specific chemical reactions [64]. Primary steel production, for example, needs to switch from currently coal-based processes in blast furnaces to hydrogen-based direct-reduction of iron ore starting from 2025 [47]. In the long run, other power-based processes, such as the electrowinning of iron ore, would be implemented as well [47,49].
The remaining fossil energy in industry comes from the incineration of waste. Direct and indirect electricity use (for hydrogen and syngas) will also replace district heat and CHP. Even though efficiency improvements lower the demand of final energy, the electrification will strongly increase power demand in the future even more due to the conversion losses for hydrogen and synfuel production (see Section 4.3 on power supply).

4.2.2. Transport Sector

Transport, as the largest CO2 emitting sector, specifically needs an accelerated emission reduction by 2030. Thus, electrification is also the key strategy in transport, especially for passenger cars. Even though assumptions on modal shift from [35,52] lead to an additional reduction in energy demand (at stable total passenger transport in pkm), the focus must be direct electrification, reserving synfuels and hydrogen, e.g., for trucks and planes (see Figure 9). To reduce CO2 emissions significantly in the next decade and to avoid an overproportionate increase in power demand (due to conversion losses for hydrogen and synfuels) the BS requires an additional 1.5–2 million electric and hydrogen cars per year until 2035, leading to a total of 17.5 million in 2030. By 2050, more than 2/3 of the energy demand is provided by electricity in the BS.
For goods transport, more than 50% of light duty vehicles would also be directly electrified in the BS by 2030. For heavy duty vehicles, all emission reduction options need to be integrated: hybrid and catenary electric trucks and fuel cell engines. The BS requires more than 50% of low CO2 emission fuels by 2030, if the carbon budget is to be met. As an interim solution, it is also essential to provide the remainder of the existing fleet with bio- and synfuels, which provide 1/3 of the energy in 2040. By then, 95% of the fuels are based on renewables in the BS.
As the power sector becomes increasingly coupled with transport and heat, the need for a fast transformation of the power sector to renewable energy is even more pressing.

4.3. Power Supply—Results of the REMix Modelling

Simultaneously considering the carbon budget (see Section 2.1) and additional power demand from the above described heat and transport sectors, the power capacities in the BS almost triples in Germany until 2050 (see Figure 10). About 212 GW PV, 125 GW onshore wind and 50 GW offshore wind are additionally installed in the BS, which serve as the backbone for Germany’s power supply system in 2050. Consequently, the share of renewable energy reaches 96% by then. To accelerate the power system transformation, around 310 GW (additional 180 GW) of renewable capacity need to be installed already by 2030 in the BS.
The role of CHP is uncertain in the optimization. District heating gas CHP would still play a role in covering peak loads in 2050. For the optimization algorithm, the reconversion of synthetic CH4 is preferable to biomass CHP under the given biomass price assumptions. Thus, only the predefined capacity of around 16 GW of existing biogas and waste applications (see Section 3.3) remain in the system. Other studies applying cost optimization suggest no or very low CHP in power systems with very high shares of RE [62,65]. For balancing VRE, sector coupling (e.g., via electric vehicles and electric heat supply) is an important factor in the BS, replacing the back-up gas capacity to a large extent.
However, the installation of solar and wind capacities shows significant regional disparities under the assumption of system cost optimization (see Figure 11). A total of 70% of the offshore wind would be installed along the coast of Lower Saxony (40 GW) due to the local abundant offshore wind resources. In the BS, the installation of PV would be largely distributed in the southwestern and southern part of Germany. The northern and northeastern regions are mainly supplied by wind energy, which plays a major role in all regions except Bavaria. Bavaria and Baden-Württemberg would expect an installation of the highest RE power capacities (~90 GW) among the 10 modeled regions.
The above described expansions of VRE capacities with regional heterogeneous characteristics require fundamental infrastructures for power transmission, storage and conversion. Figure 12 shows the necessary grid expansion between 2020 and 2050 with the grid development plan (in German: NEP) 2030 [66] taken into consideration.
Within Germany, total grid transfer capacity in the BS needs to triple from 61 GW in 2020 to 189 GW in 2050. Among them, the connection between Lower-Saxony and North Rhine-Westphalia region requires the strongest grid expansion of 12 GW HVAC and 8 GW HVDC. The BS sees strong grid expansion to neighboring countries, by factor 5 from 29 GW in 2020 to 153 GW in 2050. The North Rhine-Westphalia region shows the highest grid expansion to Belgium with 9 GW HVAC and 5 GW HVDC accordingly.
Other north–south connections also need expansion, each around 10 GW: between Brandenburg/Saxony-Anhalt and Mecklenburg-Western Pomerania, Hamburg and Schleswig-Holstein additional 10 GW and cross border for Baden-Württemberg and Switzerland, and Schleswig-Holstein to the western part of Denmark. Such an accelerated grid expansion under 1.5 °C carbon budget between Germany and its neighbors alone already illustrates the necessity of a joint power grid development among EU countries to deal with high share of renewable power capacities, which are envisaged for the future in the context of EU green deal [8].
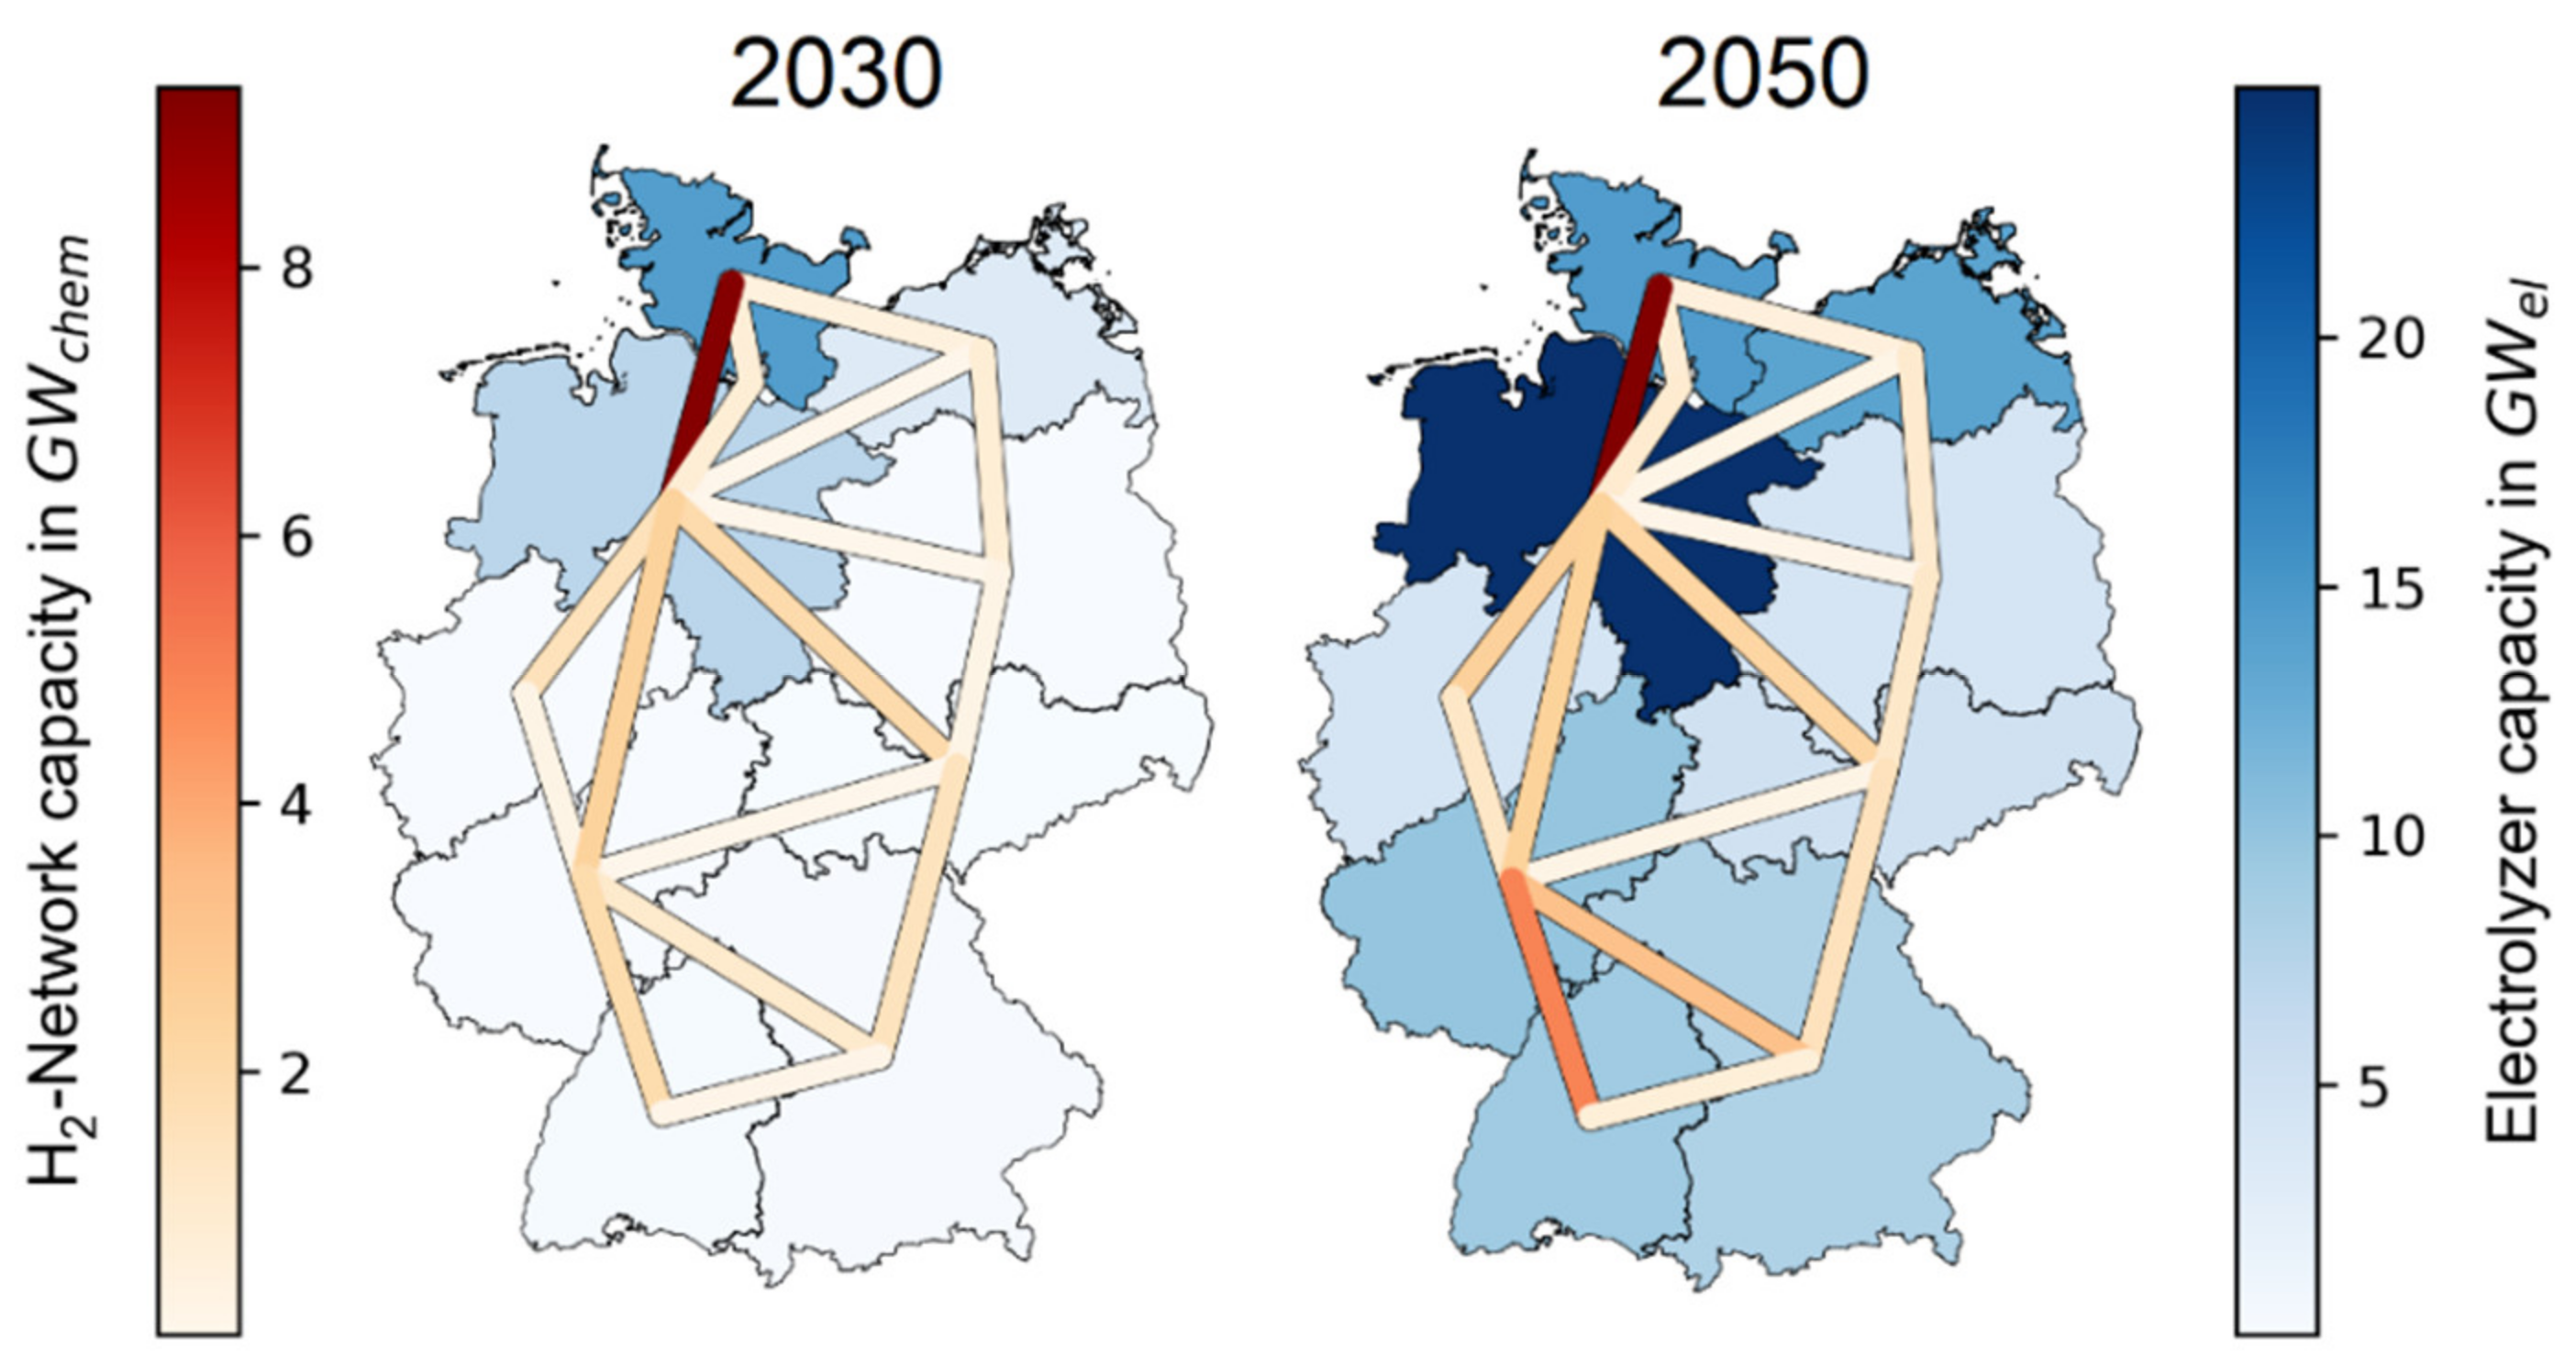
In addition to new infrastructure for power exchange, the BS also requires significant additions of both production and storage capacity for synthetic fuels. Figure 13 shows the required expansion of production, storage and transport of hydrogen in 2030 and 2050 respectively. The BS sees a massive deployment of 26 GW of electrolyzer capacity within the next decade in Germany, increasing to 96 GW in 2050. Hydrogen production is focused in the three modeled northern German regions where electrolysis could be used to balance the offshore wind fluctuations.
In contrast, the correlations between the installation of electrolysis and PV are weak. To be on track with the carbon budget, an early construction of hydrogen transport network is required reaching 23 GW in 2030 and 33 GW in 2050 in order to connect the central electrolyzer capacities and cavern storage in the north (50% or 27 GW in Lower-Saxony) to the demand centers in the south and west.
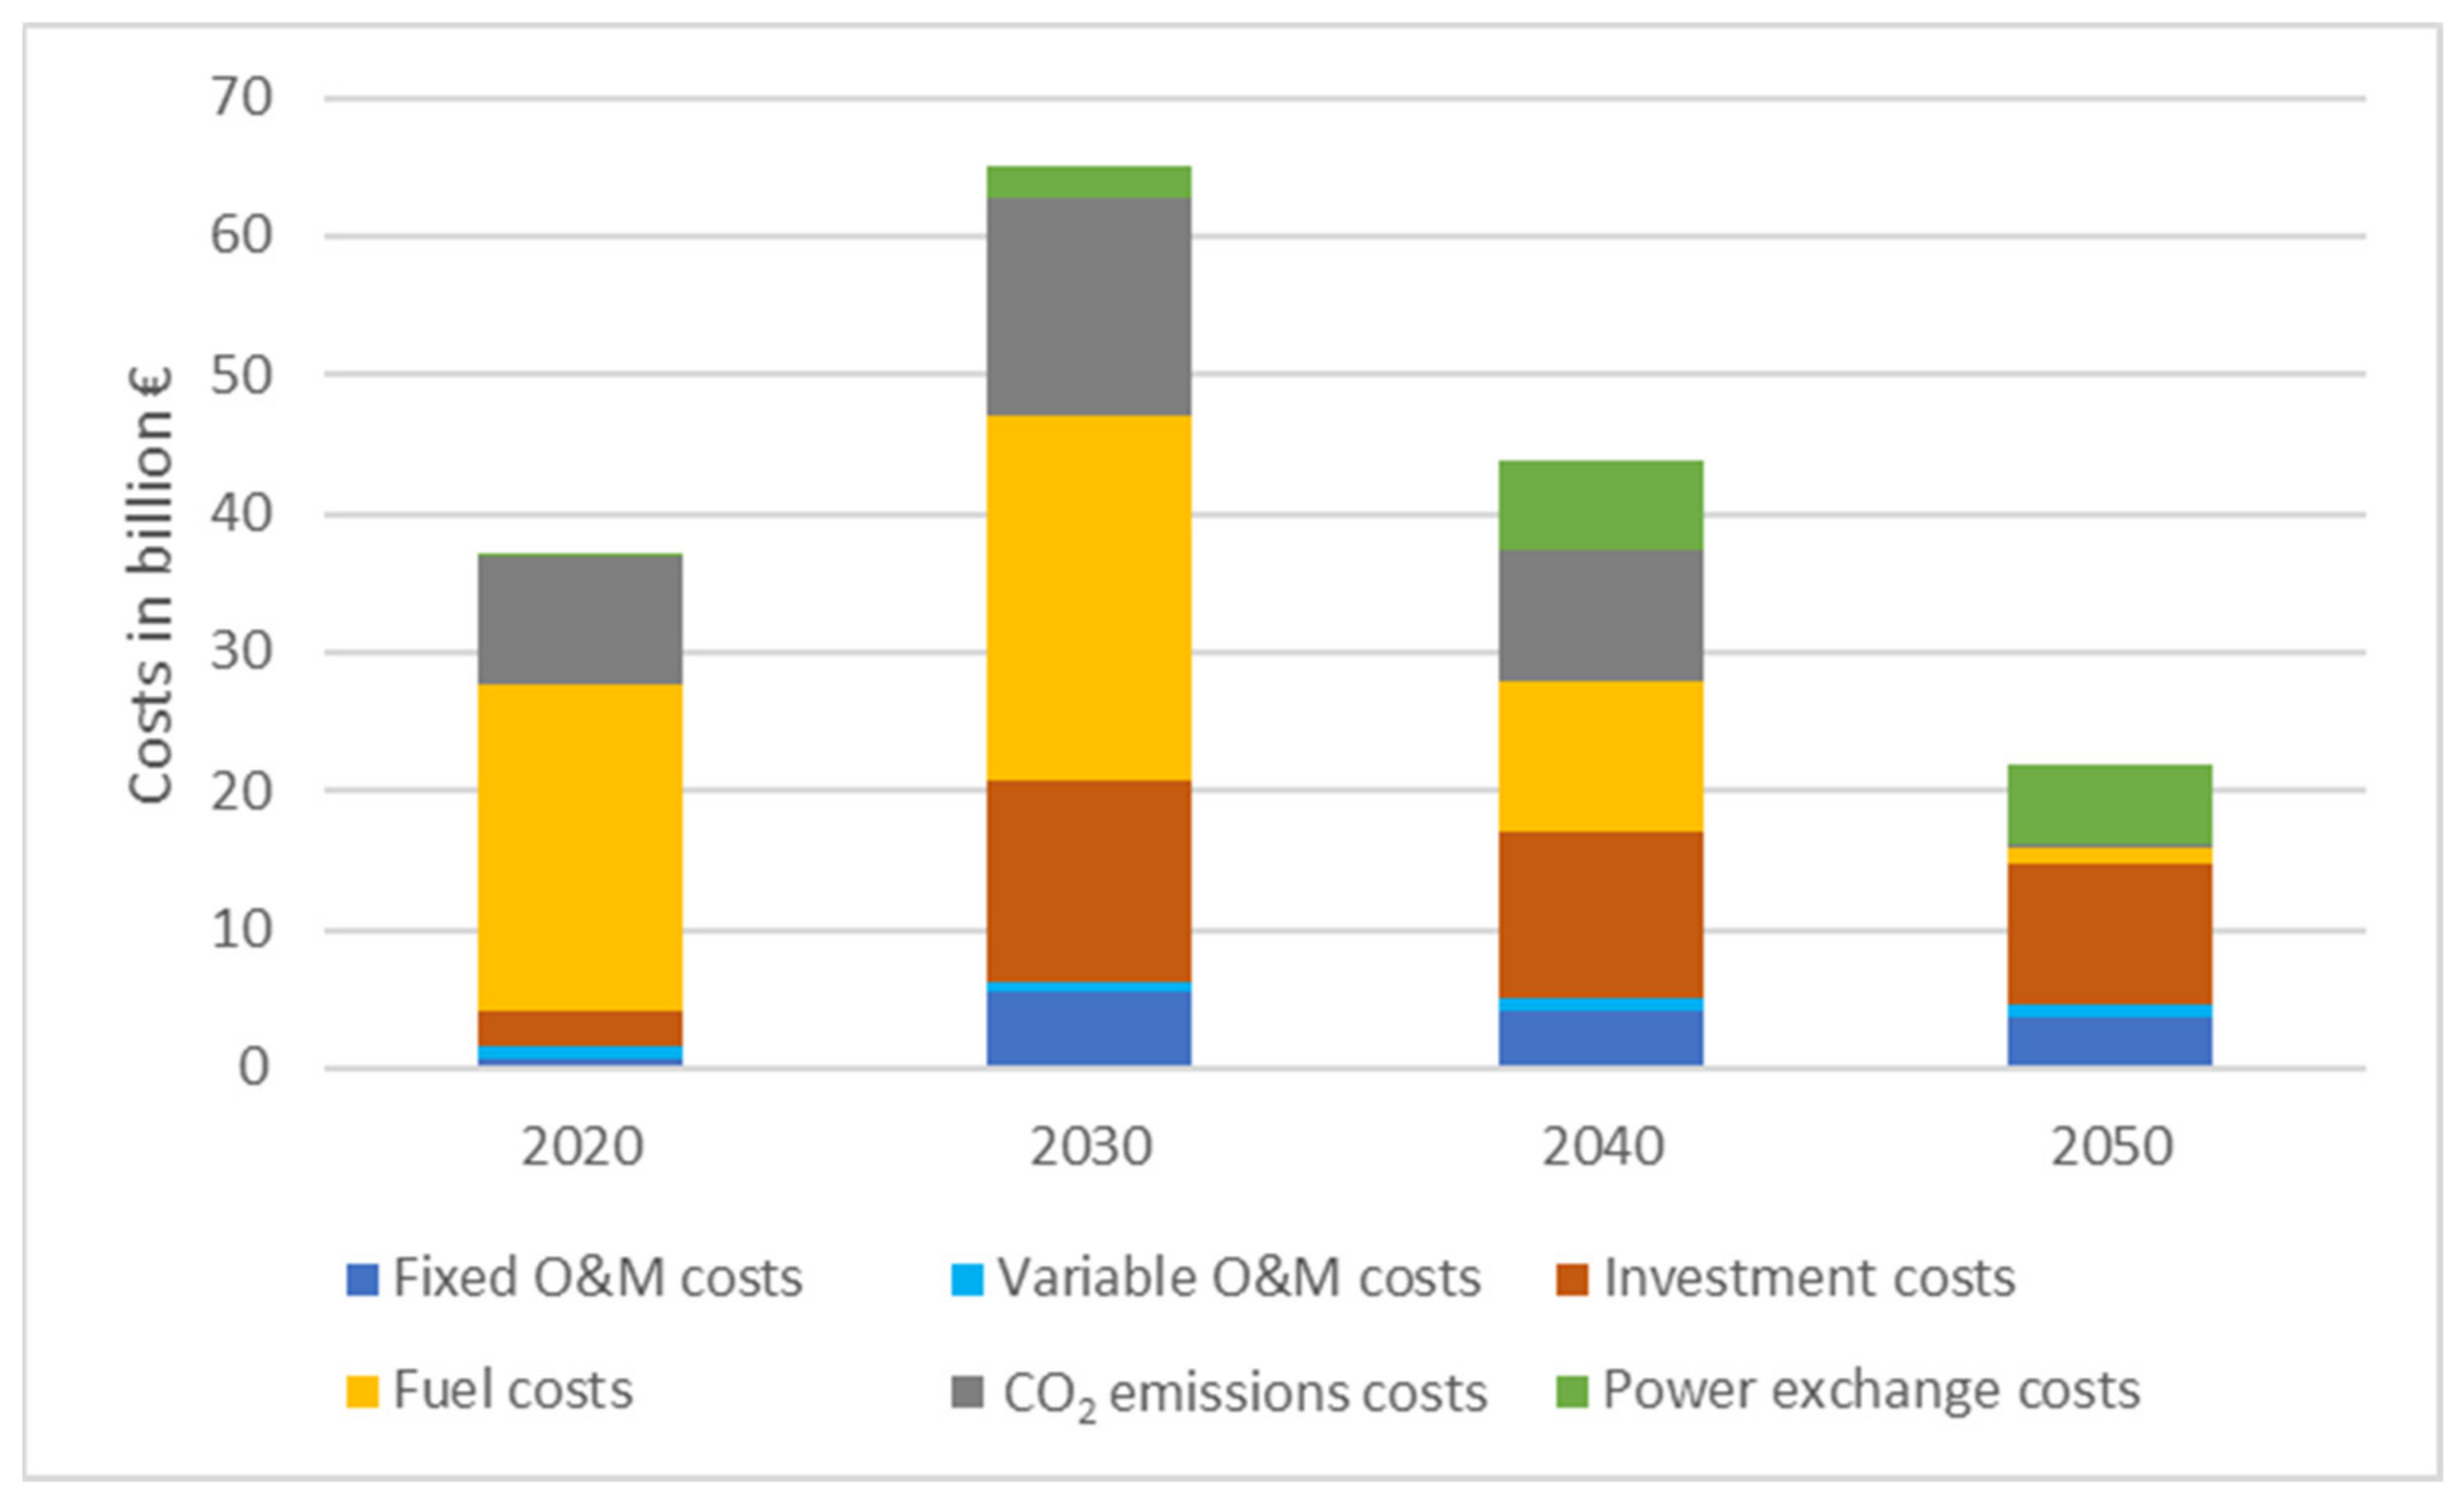
The above discussed energy system requires substantial investment in renewable energy technologies and related infrastructures. Figure 14 shows the total annual system cost components as modeled for Germany, which include the investment costs, fixed and variable O&M costs, fuel costs and CO2 emissions costs, power import costs and power export revenues for the German nodes. The highest system costs of 65 billion € occur in 2030. They decline to around one third in 2050.
This is accompanied by a shift from fuel costs as the main component in 2020 (64%) to investment costs, which represent the largest share in 2050 (46%). Replacing fossil fuels significantly reduce CO2 emissions costs, which cover 25% of total modeled costs in 2020, and only 1% in 2050. At the same time, the power import costs would account for up to 26% of system costs in 2050, replacing partially today’s fuel imports.

Sensitivity Analysis of the Power Supply

The above optimized power system highly depends on assumptions on fuels and emerging technologies. Thus, we test four sensitivity cases to illustrate the robustness of our modeled results regarding the power sector (see Table 6). The analysis focuses on variations of maximum power import shares, assumed renewable energy potentials and biomass cost assumptions. The detailed results can be found in S7 in the SI.
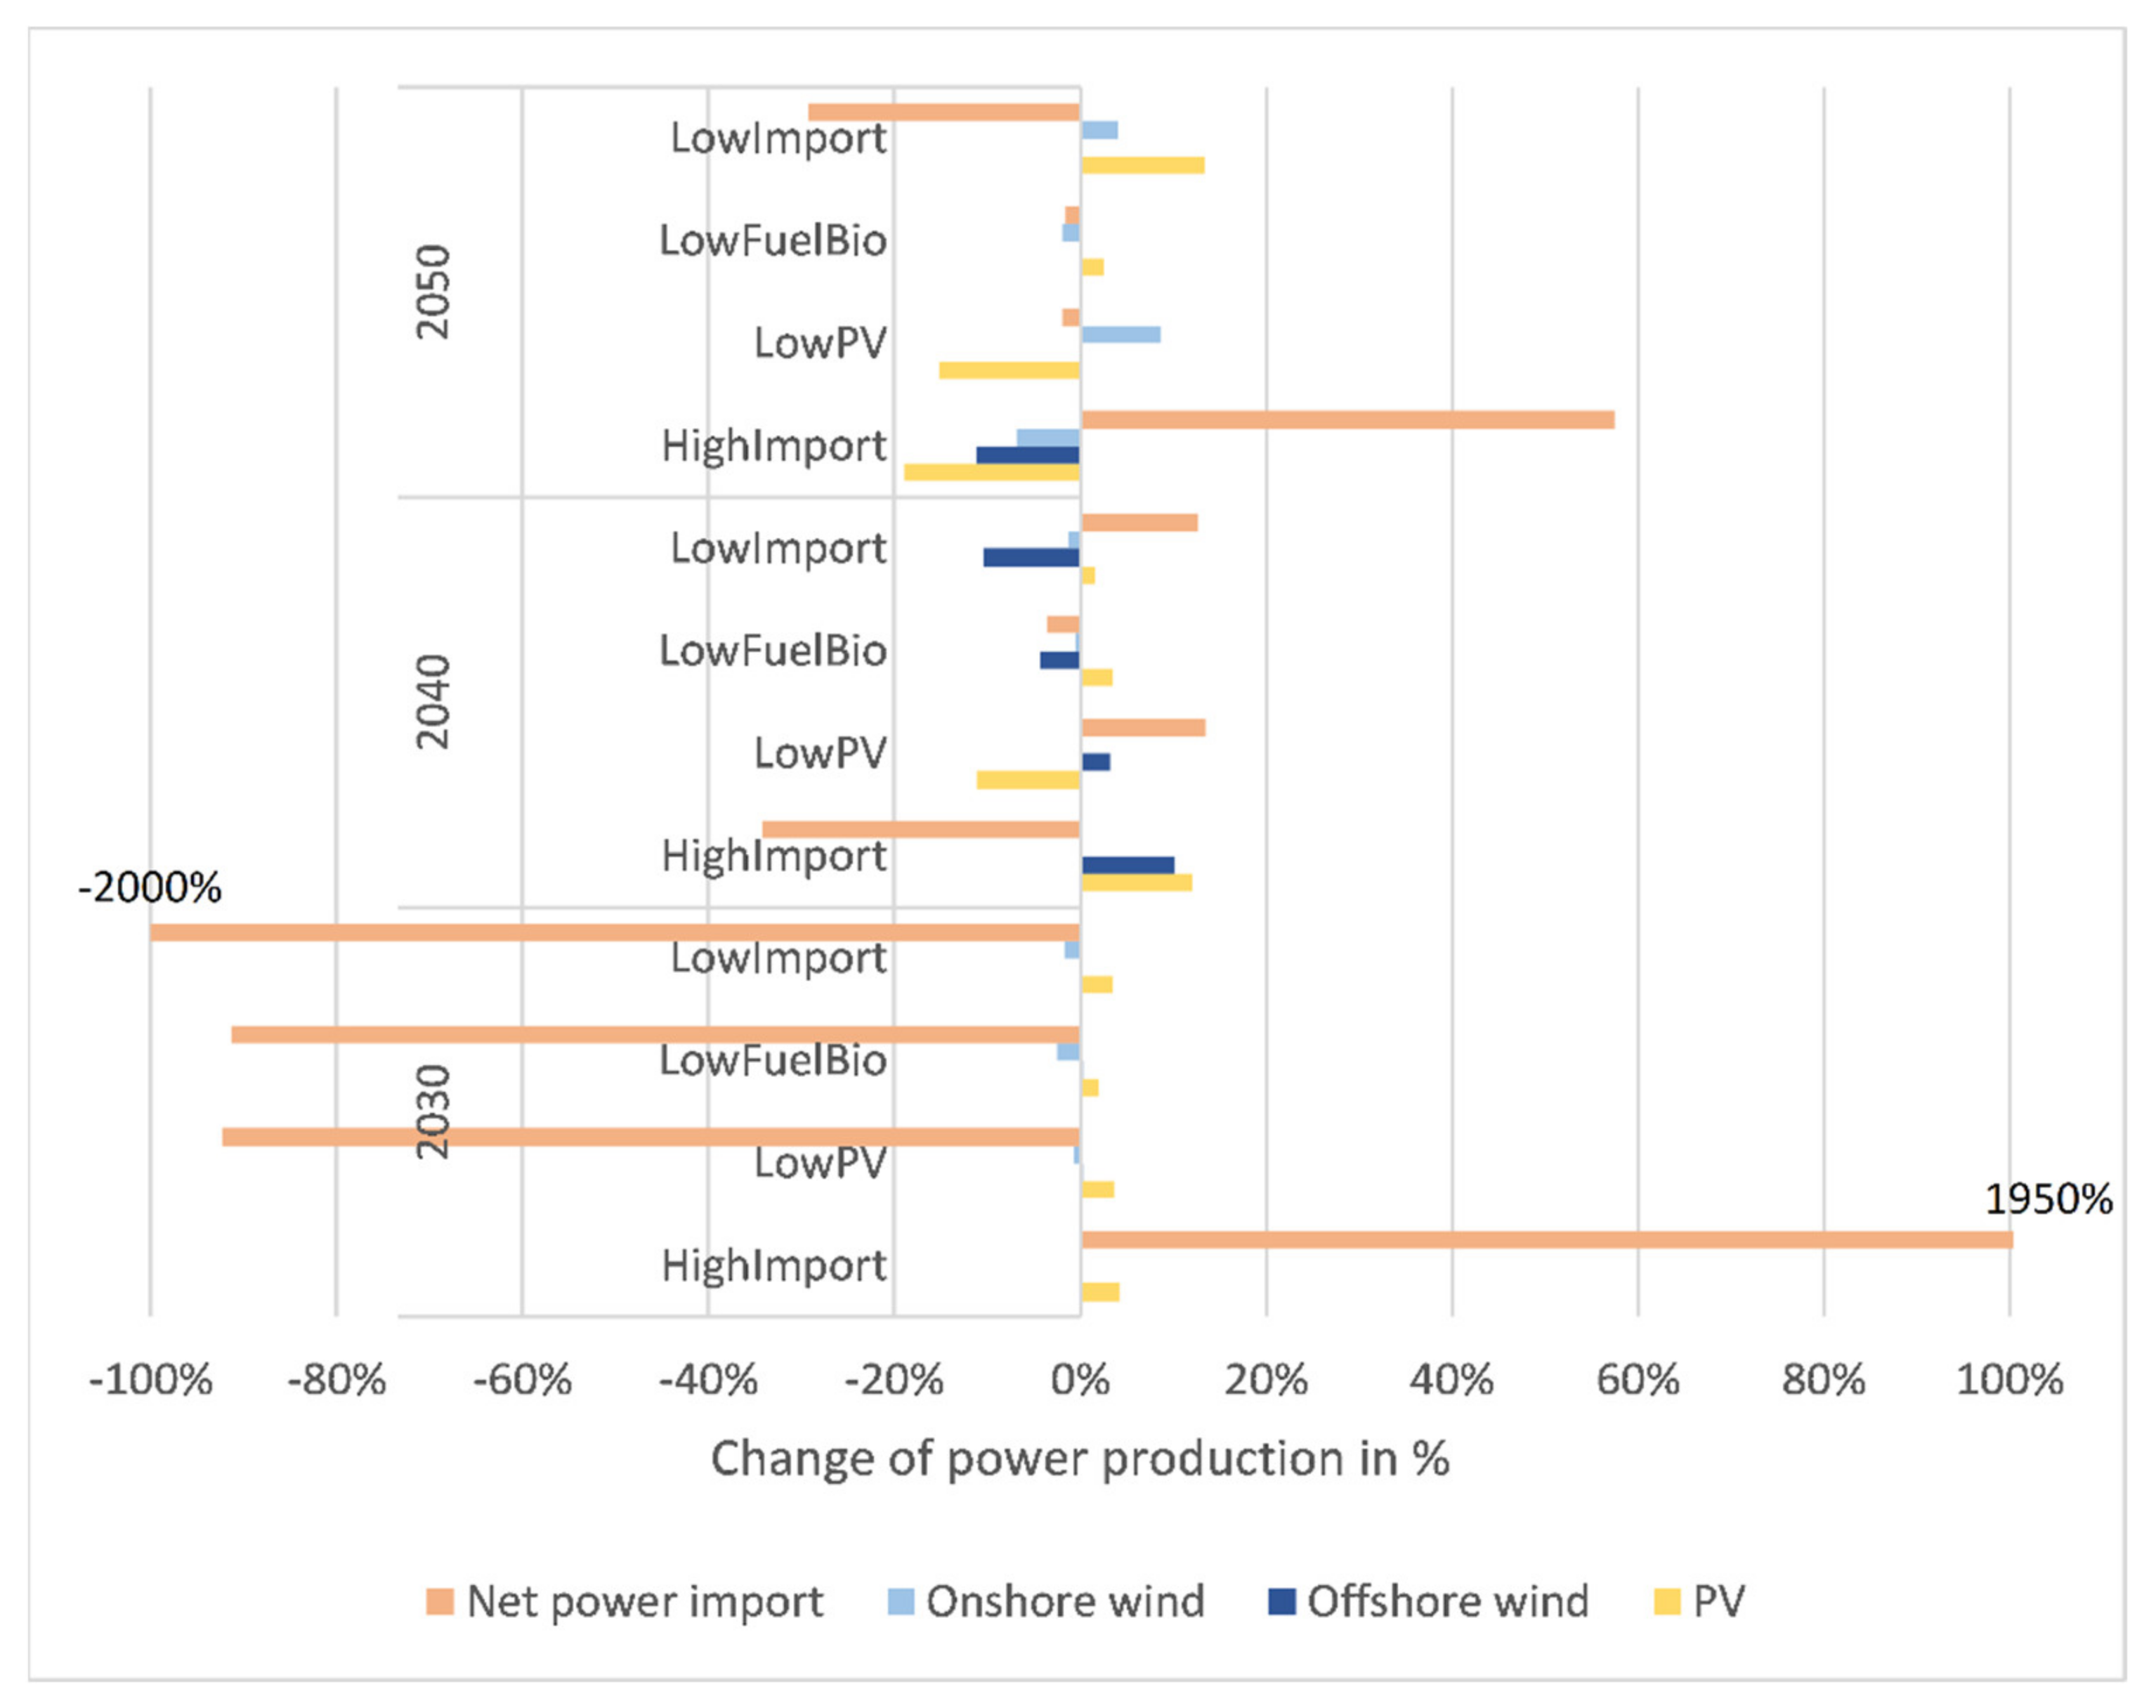
First, we compare the influence of the changed assumptions in the sensitivity scenarios on the power generation from PV and wind and on the net power imports in Germany relative to the Budget Scenario (see Figure 15). The share between PV and wind installations is highly sensitive to all changing parameters. Limiting power imports leads to an overproportioned increase of the installed PV capacity. However, we find little effect of biomass prices on the system.
Even with lower fuel cost assumptions for the biomass power plant and CHP, its role in the German power system is still quite limited under the cost optimization approach. However, setting a minimum domestic power generation share for the modeled regions significantly affects the power exchange between them. This may result in a maximum annual net power export from Germany of up to 56 TWh (95% domestic generation) or to maximum net power imports to Germany of up to 111 TWh in 2050 (80% domestic generation).
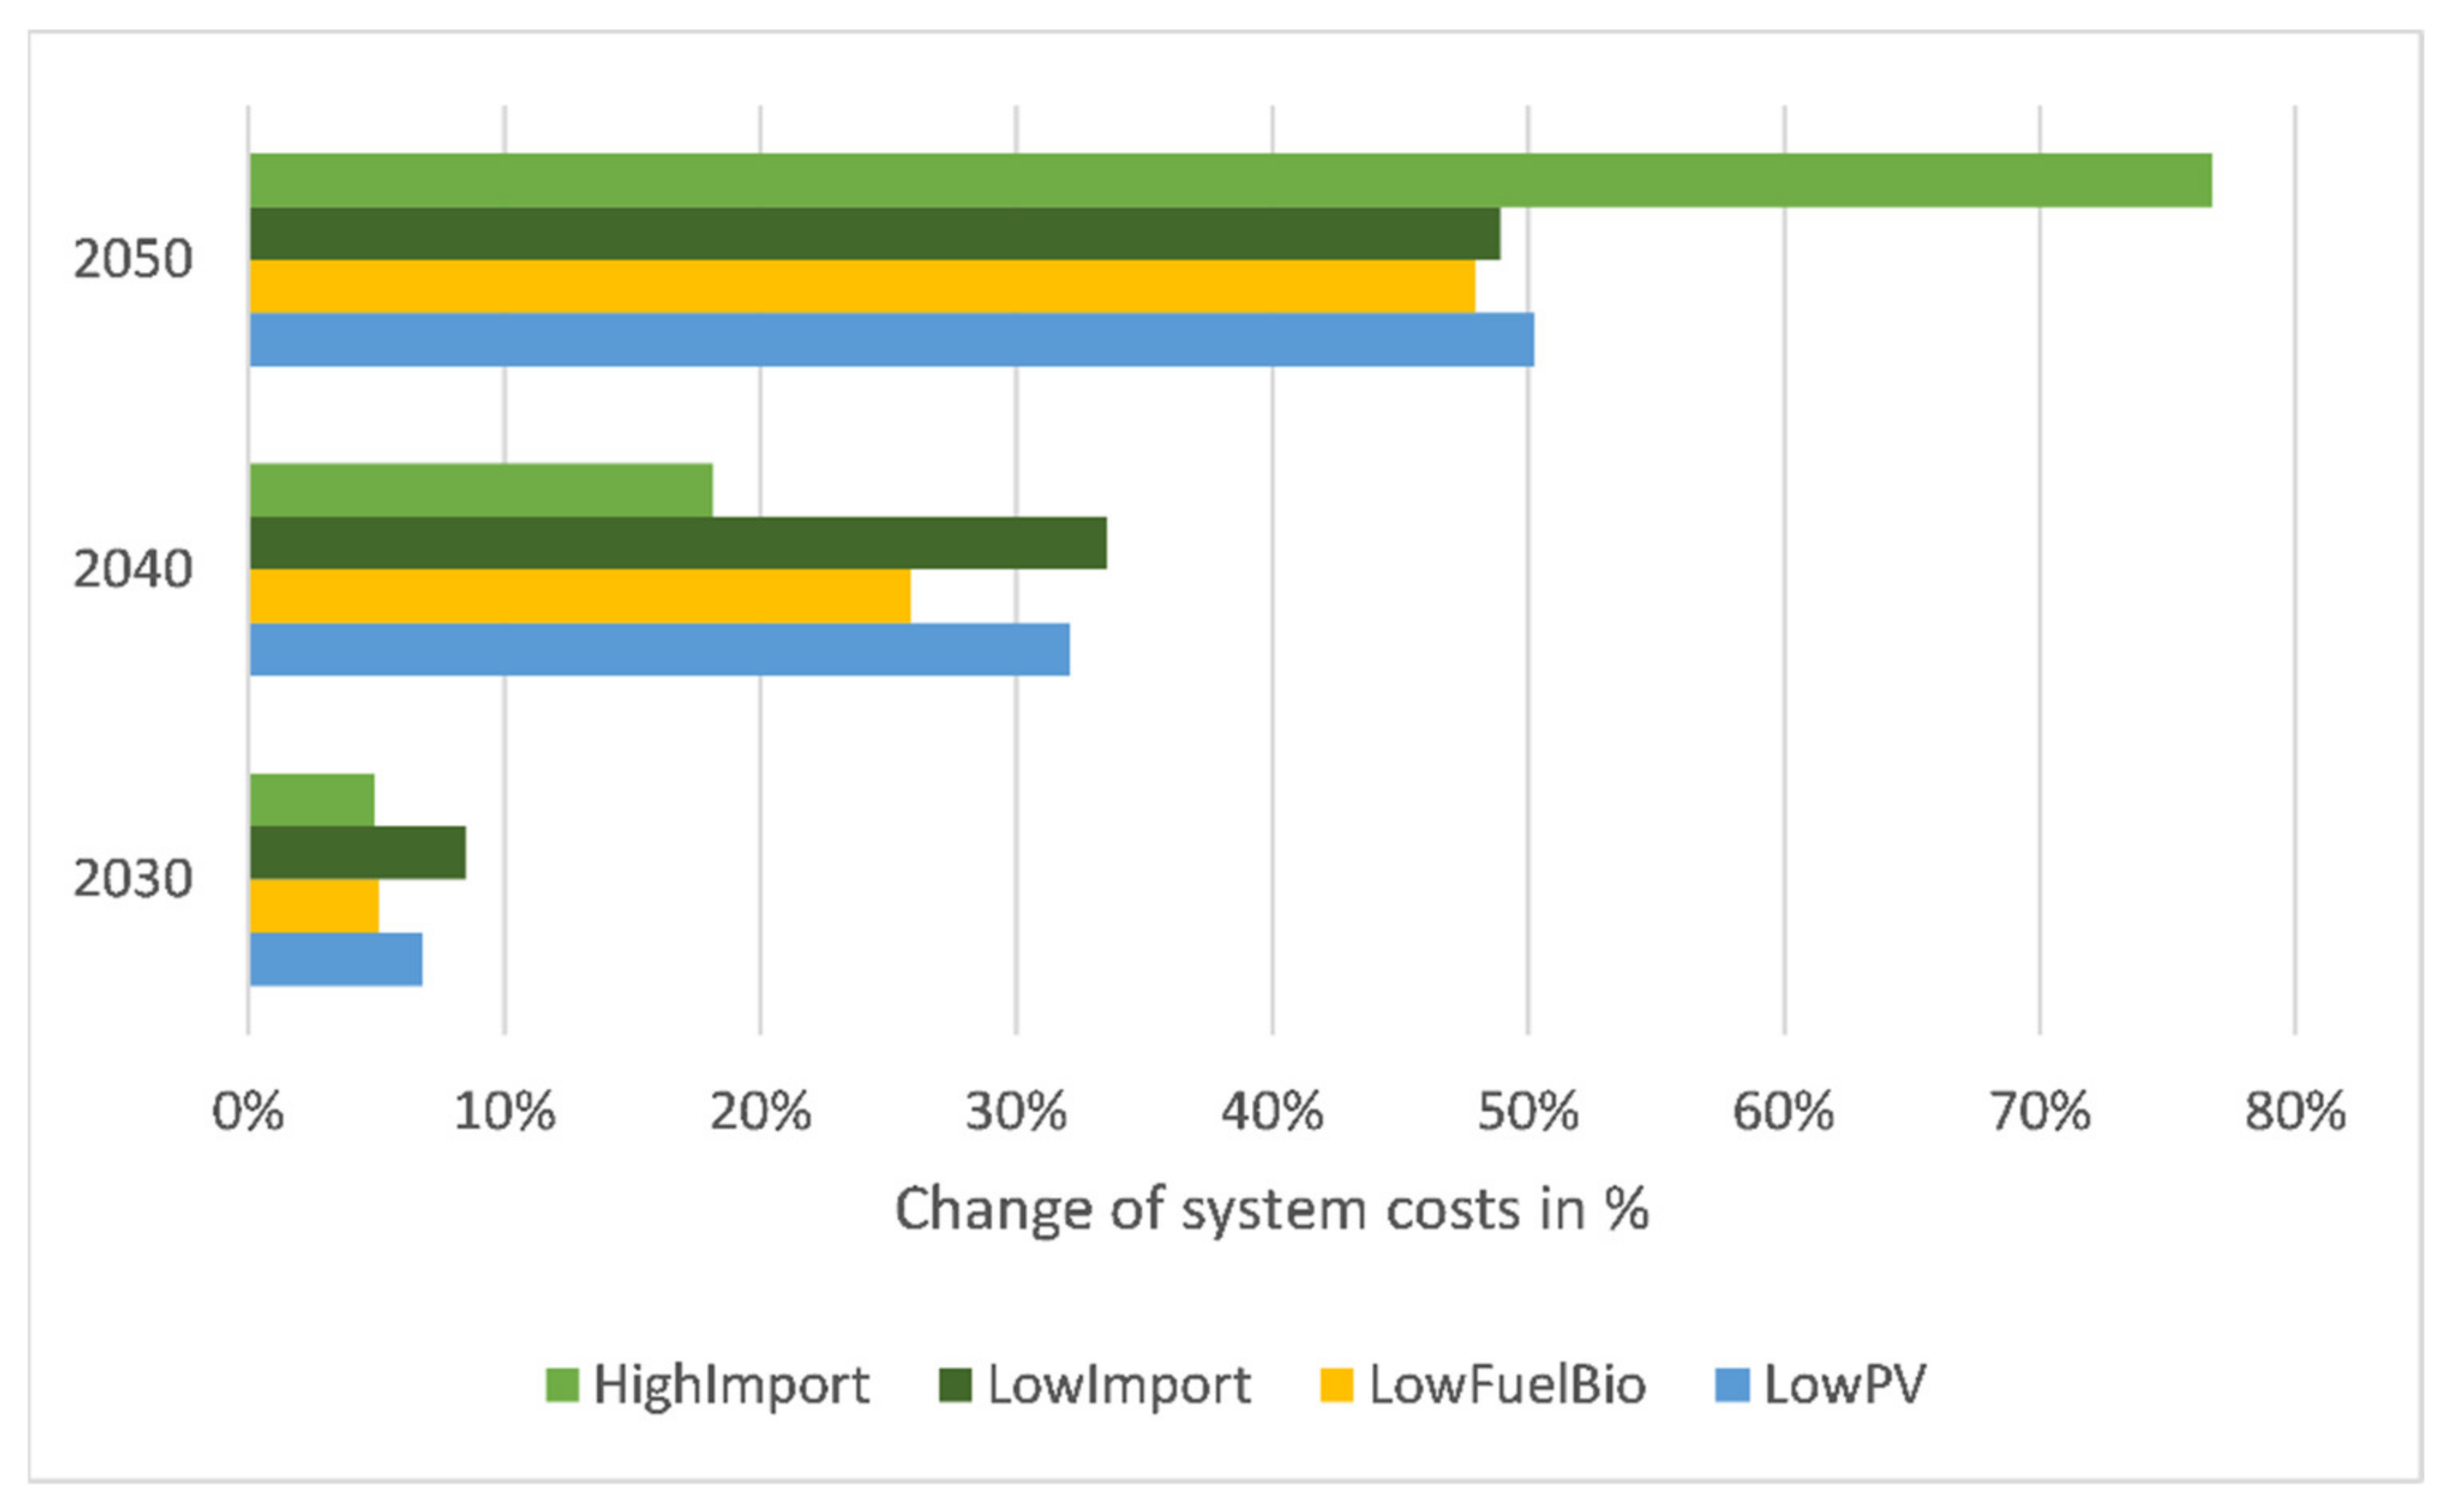
All variants (3-h resolution) increase system costs gradually over time from 50% to 80% in 2050 compared to the BS (see Figure 16). The differences are mainly due to power exchange costs especially in the LowFuelBio and LowPV scenarios. Other than that, the changes from investment costs and fixed O&M costs also play a role in the HighImport and LowImport scenarios. Even though the cost increase is higher with less imports in the beginning of the energy system transition, the LowImport scenario results in significantly higher system costs in the decarbonized energy system in 2050.

4.4. Primary Energy Supply

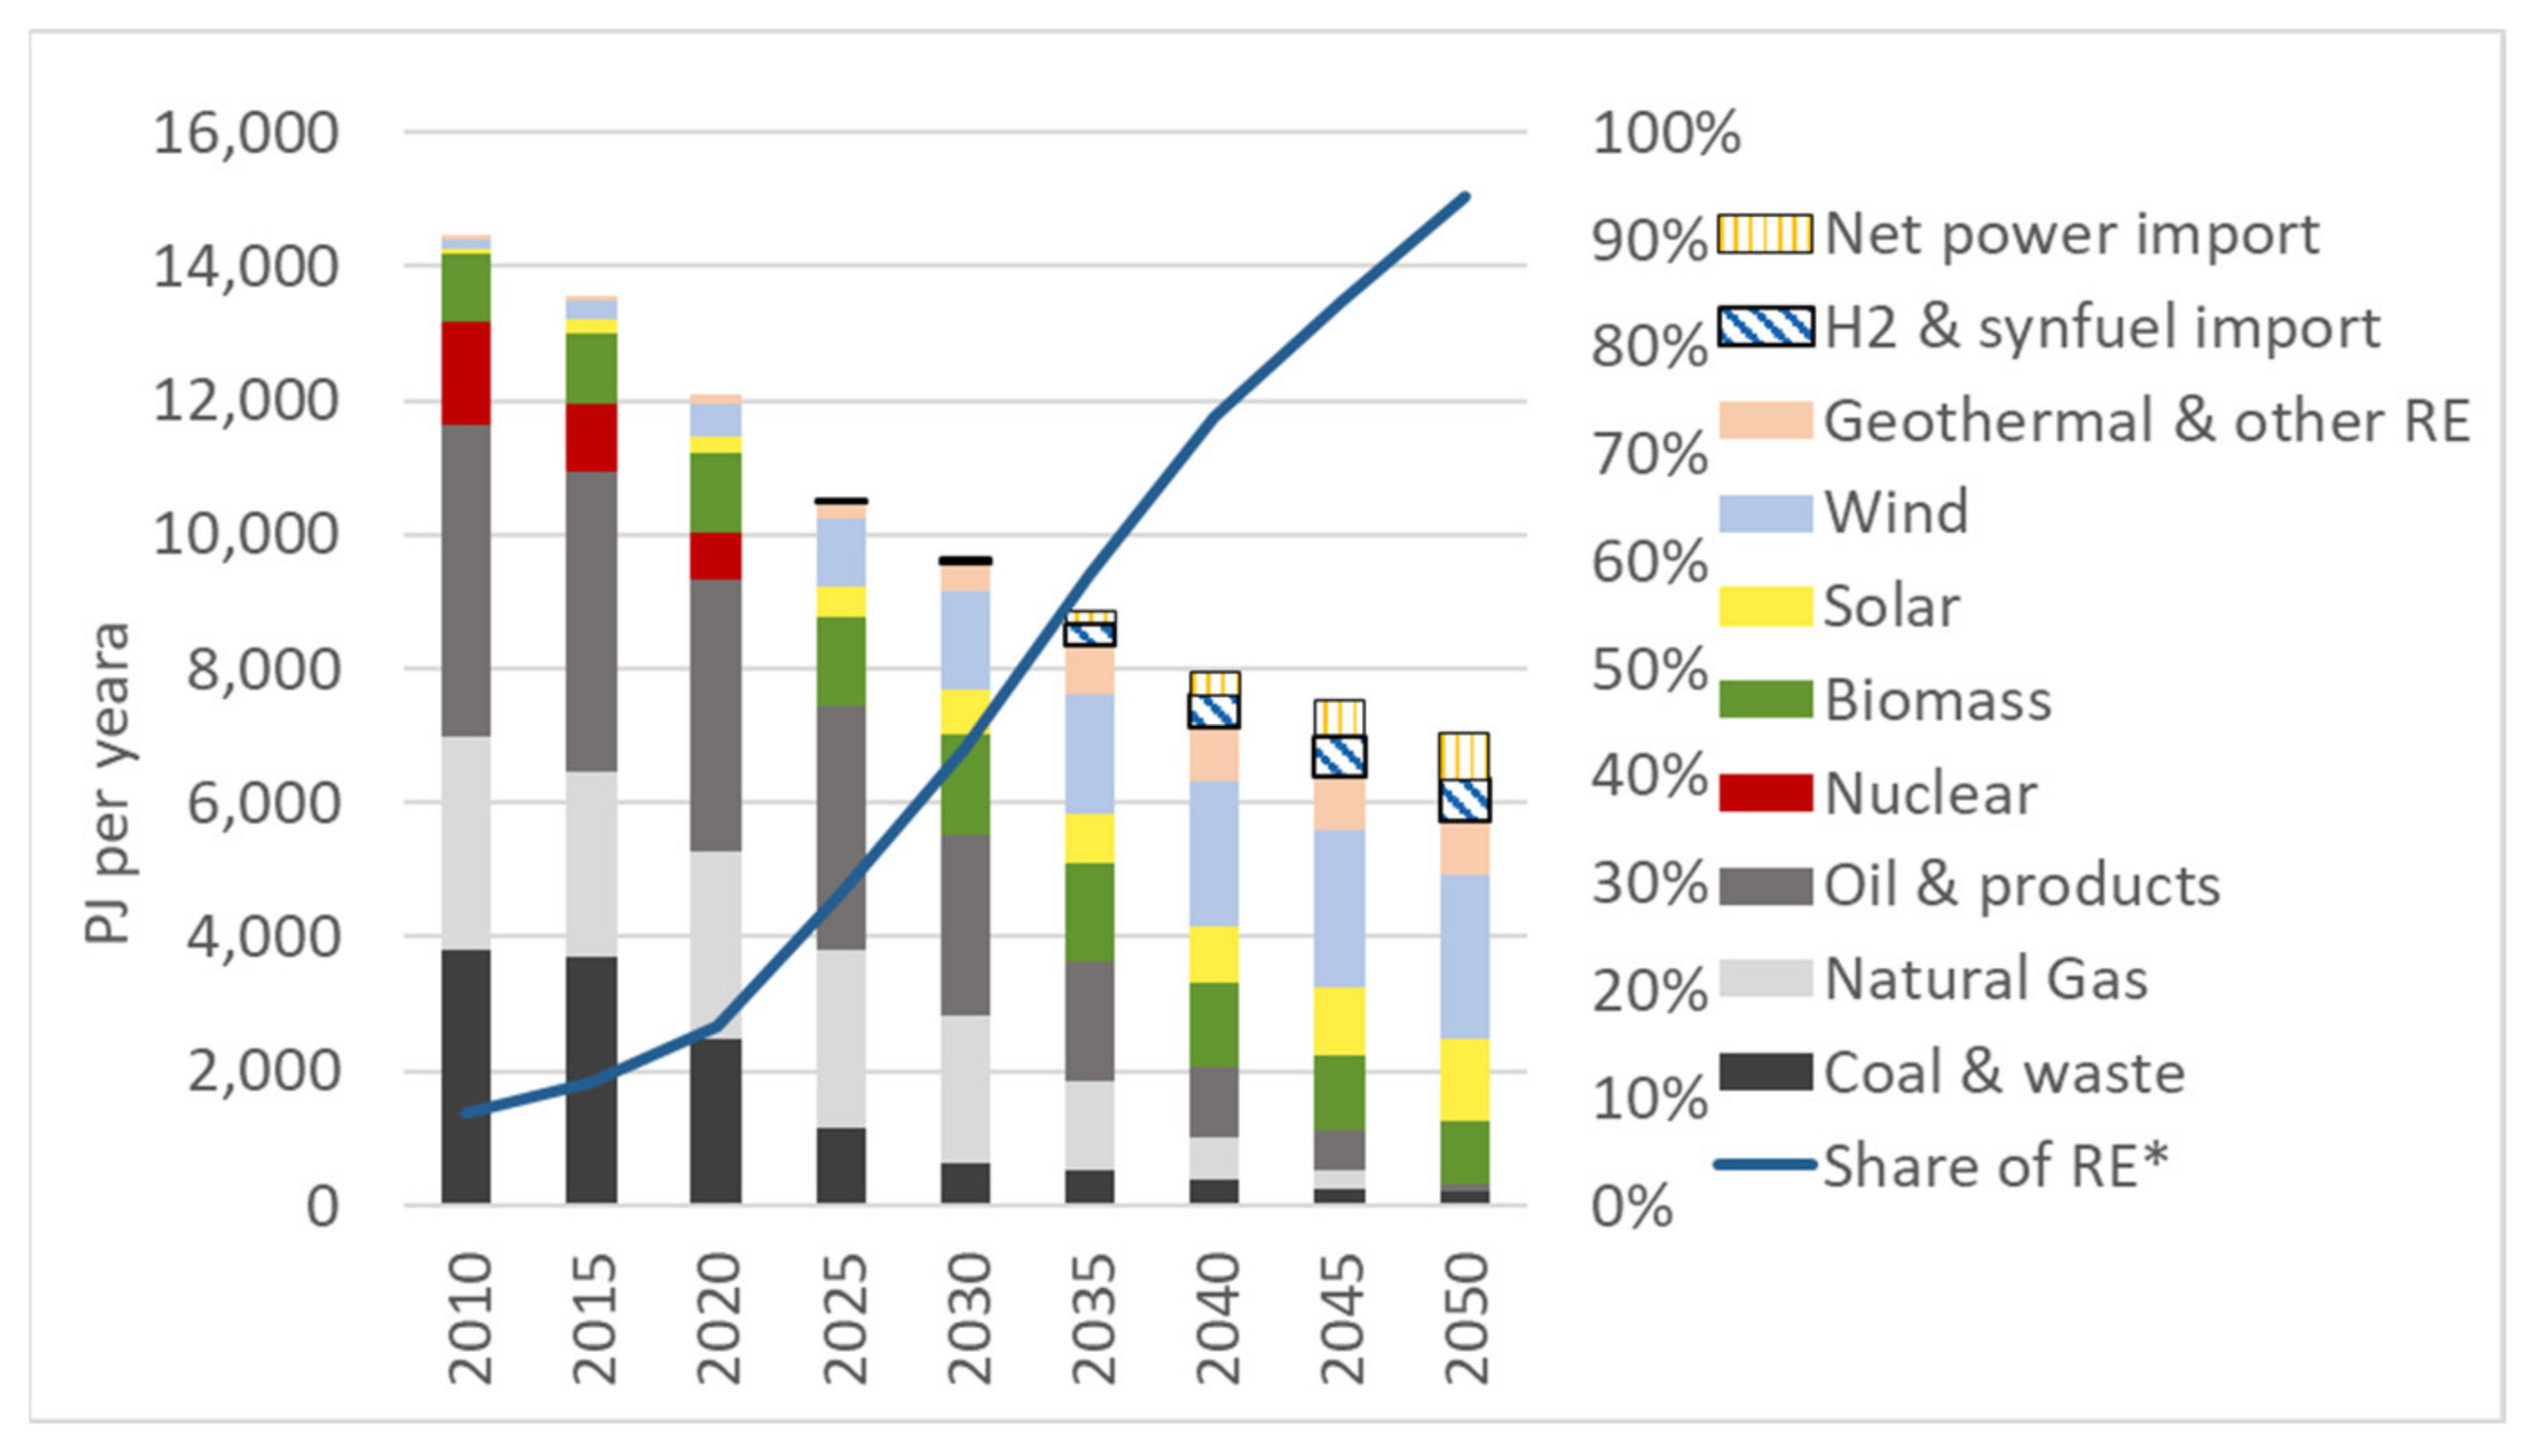
As electricity becomes the main “fuel” in the BS and power production is increasingly shifted to renewable energy, the primary energy supply consistently changes over time (Figure 17). In order to restrict the German energy sector to the proposed carbon budget, the speed for increasing the renewable energy share in primary energy needs to triple within the next decade; by 2030 the share of renewable energy in primary energy needs to rise to 43%. Imports of oil, gas and coal would be replaced partially by green imports—as electricity or power based synthetic fuels and gases. However, a residual of fossil fuels can still be seen in the BS in 2050, resulting mainly from incineration of “fossil” wastes and non-energy use as feedstocks. Overall, the scenario leads to a total of 95% renewable energy in primary energy in 2050—representing a residual emission of below 20 Mt CO2 that could be offset via carbon dioxide removal (CDR) measures.

5. Discussion

Our normative target scenario explores the scale and limits of developments physically and technically necessary to achieve the climate targets. The goal is to illustrate the technical challenges beyond what is currently assumed as realistic or possible. We do so by developing a Budget Scenario that shows ONE single exemplary path to energy transition. Hence, we neither claim to show the full range of possible pathways nor to represent an overall optimized system (in terms of e.g., costs, acceptance or feasibility).
The limits and determinants of the transformation, which may result from decisions of the relevant actors from industry and politics as well as from public acceptance, are not explicitly addressed here. These factors are difficult to predict; however, as the context of the scenario, they must enable the decisive impetus for disruptive developments so that the necessary implementation of new technologies in line with the net zero target can happen.
Our Budget Scenario shows that achieving the climate targets of Paris is only possible if a turnaround in the energy system is tackled promptly in all consumption and supply sectors, the remaining emission budget serving as a joint target. The CO2 budget that could be allocated to Germany is still unclear as the variance of the calculations is high. While our assumption of 6.5–7.5 Gt CO2 for the energy sector covers a medium range of the existing budget calculations, the authors of [12], for example, aim for much lower limits of 4.2 Gt CO2 until 2050. In most calculations, the remaining CO2 budget for Germany will be used up within the next 10 years under current conditions.
In our scenario, the VRE from solar and wind will play the main role in the future, supplying renewable primary energy, especially in the form of electricity. However, they can only become the backbone of the energy system if sector coupling, infrastructure expansion and hydrogen economy are implemented quickly and are already substantial by 2030. Our modeling provides a first hint for the spatial distribution of this infrastructure demand under the objective function of minimum system costs—with a focus on wind and storable energy in the Lower Saxony region and PV all across the south west from Bavaria to North Rhine-Westphalia.
While the modeled grid infrastructures go far beyond the currently planned installations in the TYNDP [66], our results are limited by the spatial resolution of the modeling. For a detailed infrastructure planning, especially of power, hydrogen and gas grid transformation a higher spatial resolution is necessary. Additionally, a detailed modeling of future import and export relations both for power and synthetic fuels will significantly influence the capacities to be installed.
The sensitivity analysis provides hints at the influence of European power exchange; however, this is limited to the neighbor countries, neglecting a trans-European perspective, which has been the focus of various other studies [67,68,69]. For synthetic fuels and gases, significant potential and cost advantages are envisaged for production overseas [42,70]. While these import aspects might have significant impact on the system optimization with regard to installed capacities and total system costs, our study limits hydrogen and synfuel imports outside the geographical system boundary to external assumptions.
The Budget Scenario has also a strong focus on the final energy demand sectors: efficiency measures play a crucial role in the transformation of the energy system. A reduction of the final energy demand of all sectors in Germany by 30% to 45% compared to 2018 seems to be technically possible. However, the behavioral component included in this is not clearly quantifiable—neither in terms of sufficiency, nor in terms of rebound effects. Demand reduction can already be strongly advanced in the transport sector by 2030 through electric drives [52].
The challenge of long-term investments in the building sector for insulation and the installation of efficient heating systems, such as heat pumps and heat networks, is disproportionately higher. The building sector, therefore, requires a significant increase in transformation incentives ranging from information campaigns and recommendations for building improvement to financial support and the development of reward-penalty systems for net zero buildings [71], specifically accelerating energy saving. However, the modeling approach with regard to demand specifically in buildings and other sectors is clearly limited to findings from literature. Consumer aspects, e.g., in the residential and transport sectors cannot be represented within our supply and technology focused models.
In industry, CO2 emissions are still considered difficult to avoid today, even though, for example, key technologies, such as direct reduction, are already being intensively developed and promoted in steel production [72]. According to our scenario, 50% to 70% of coal-based blast furnaces should be replaced by new low-emission technologies for primary steel production by 2030. In addition to such specific solutions, the direct electrification of process heat generation and complementary replacement of fossil fuels by synthetic gases are seen as essential elements of transformation in the industrial sector.
However, the scenario analysis in this paper cannot answer the important question of the future role and economics of the gas grid in directly supplying industrial sites (just as it cannot for buildings). The techno-economic limits of direct electrification as well as of energy savings through more efficient solutions cannot be evaluated here in all individual branches but are addressed through assumptions on the average achievable energy intensities according to the best available technologies. More in-depth analyses of possible options and their limits are required, which are beyond the scope of this paper but are also in part already included in transformation studies with varying degrees of detail, which were also used here as a background knowledge for parameterizing the model.
Here, we would like to refer to the complementary analysis by Rhoden, Simon et al. [73], identifying challenges and opportunities for net zero emissions scenarios, such as the BS, focusing on the spatial dimension of impacts, benefits and losses for different stakeholders and technologies. Especially stakeholder perspectives and public acceptance need to be and are addressed increasingly [74,75,76,77]. Our scenario can provide a valuable data base for such additional analyses.
Thus, despite all efforts to outline a feasible decarbonized energy system, there are considerable uncertainties in the implementation of available new technologies assumed in the scenario as well as about the remaining residual emissions of CO2 from energy supply. Whether through unavoidable emissions from industrial processes or from the use of waste to generate energy, there are other obstacles to a completely CO2-free energy system than “just” the energy transition.

6. Conclusions and Outlook

This paper presents one of the first budget-driven energy scenarios for Germany. We assumed a total of 7 Gt of CO2 from 2021 to 2050. By coupling a cost optimization model (REMix) and an accounting framework (ESM), our results show that Germany will have to accelerate its energy transition considerably to stay within this boundary. For this to happen, the necessary reduction in CO2 emissions must be achieved to a large extent by 2030, and this is only possible through a massive expansion of RE technologies that are already marketable. In particular, the significant increase in tenders for renewable electricity generation plants by at least a factor of 2 to 3 compared to today must be a short-term measure to also ensure the basis for a rapidly increasing supply of renewable energies to the other sectors.
A transition to new and more efficient technologies must be organized and financed in parallel for all consumption sectors. Important directional decisions, e.g., on the expansion or transformation and future use of electricity, gas and district heating networks, must be made in the five to ten years. Moreover, a phase-out of coal use by 2030 is a basic requirement. This has to be complemented by a tripling of power generation from PV and wind, around 16 million electric vehicles and 5 million heat pumps in the same time. In the long run, such shifts require new power transmission capacity in the order of 120 GW and around 100 GW of hydrogen electrolyzers by 2050.
In addition to the mitigation of energy-related emissions, other sources of greenhouse gases must also be increasingly addressed, for example agriculture or further industrial processes. Options for carbon removal via natural and technical means (CDR measures) should also be advanced, even if they will only play a limited and rather long-term role. In the case where politics and the economy are globally too indecisive and react too late, these options might eventually become important for negative emissions but are expected at significantly higher costs compared to emission mitigation measures.
Finally, adaptation measures will become increasingly important for flood-prone and highly urbanized areas. Care should be taken to ensure that efforts in adaptation do not limit funding and investment for mitigation and are not misused as excuse for avoiding ambitious measures in the energy sector. In the end, the work for this scenario analysis has again shown that there is a broad consensus in the scientific community that political and economic decision-makers must now set the course for climate neutrality decisively and courageously and implement the necessary measures without further delay.

Supplementary Materials

The following are available online at https://www.mdpi.com/article/10.3390/su14021025/s1, SI-pdf-file: SI_pathway_German energy sector_1_5_C_budget_03_12_2021.docx Spread sheets: S1_ESM_to_Remix_16_07_2021.xlsm; S1_Remix_to_ESM_04_10_2021.xlsx; S2_Input data Net Zero Budget Scenario.xlsm; S4_heat_supply_for_industrial_process_heat.xlsx; S5_Results ESM Net Zero Budget Scenario_selected.xlsx; S6_Results REMix Net Zero Budget Scenario_selected.xlsx; S7_Results REMix_Sensitivity Analysis.xlsx.

Author Contributions

Conceptualization: S.S. (Sonja Simon) and T.P.; methodology: S.S. (Sonja Simon), M.X., T.P. and C.H.; data analysis: S.S. (Sonja Simon), M.X., C.H., H.G. and S.S. (Shima Sasanpour); writing—original draft preparation: S.S. (Sonja Simon), M.X., C.H., S.S. (Shima Sasanpour), H.G. and T.P.; writing—review and editing: S.S. (Sonja Simon), M.X., C.H., S.S. (Shima Sasanpour), H.G. and T.P.; visualization: S.S. (Sonja Simon), M.X. and H.G. All authors have read and agreed to the published version of the manuscript.

Funding

This research was funded by the Helmholtz Initiative Climate Adaptation and Mitigation, Cluster I “Net Zero 2050”.

Institutional Review Board Statement

Not applicable.

Informed Consent Statement

Not applicable.

Data Availability Statement

More information and data can be found in the repository on Zenodo: https://doi.org/10.5281/zenodo.5761840 (last modified 9 December 2021).

Acknowledgments

The authors wish to thank Tobias Naegler, DLR, for providing data extraction and processing for the scenario comparison.

Conflicts of Interest

The authors declare no conflict of interest.

References

  1. UNEP. Emissions Gap Report 2019. Executive Summary; United Nations Environment Programme: Nairobi, Kenya, 2019; Available online: https://www.unep.org/resources/emissions-gap-report-2019 (accessed on 19 August 2021).
  2. IPCC. Summary for Policymakers. In Global Warming of 1.5°C. An IPCC Special Report on the Impacts of Global Warming of 1.5°C above Pre-Industrial Levels and Related Global Greenhouse Gas Emission Pathways, in the Context of Strengthening the Global Response to the Threat of Climate Change, Sustainable Development, and Efforts to Eradicate Poverty; Masson-Delmotte, V., Zhai, P., Pörtner, H.-O., Roberts, D., Skea, J., Shukla, P.R., Pirani, A., Moufouma-Okia, W., Péan, C., Pidcock, R., et al., Eds.; World Meteorological Organization: Geneva, Switzerland, 2018; p. 32. [Google Scholar]
  3. Friedlingstein, P.; O’Sullivan, M.; Jones, M.W.; Andrew, R.M.; Hauck, J.; Olsen, A.; Peters, G.P.; Peters, W.; Pongratz, J.; Sitch, S.; et al. Global Carbon Budget 2020. Earth Syst. Sci. Data 2020, 12, 3269–3340. [Google Scholar] [CrossRef]
  4. Gignac, R.; Matthews, H.D. Allocating a 2 °C cumulative carbon budget to countries. Environ. Res. Lett. 2015, 10, 075004. [Google Scholar] [CrossRef] [Green Version]
  5. Rogelj, J.; Geden, O.; Cowie, A.; Reisinger, A. Net-zero emissions targets are vague: Three ways to fix. Nat. Commun. 2021, 591, 365–368. [Google Scholar] [CrossRef] [PubMed]
  6. UNEP. Emissions Gap Report 2020. Executive Summary; United Nations Environment Programme: Nairobi, Kenya, 2020; Available online: https://www.unep.org/emissions-gap-report-2020 (accessed on 19 August 2021).
  7. UNFCCC. GHG Data Interface, Report Produced on November, 11th 2021. Available online: https://di.unfccc.int/detailed_data_by_party (accessed on 11 November 2021).
  8. EU-Commission. The European Green Deal. 2019. Available online: https://eur-lex.europa.eu/resource.html?uri=cellar:b828d165-1c22-11ea-8c1f-01aa75ed71a1.0002.02/DOC_1&format=PDF (accessed on 11 January 2021).
  9. McGrath, M. Climate Change: China Aims for ’Carbon Neutrality by 2060’. Available online: https://www.bbc.com/news/science-environment-54256826 (accessed on 26 April 2021).
  10. Naegler, T.; Sutardhio, C.; Weidlich, A.; Pregger, T. Exploring long-term strategies for the German Energy Transition - A Review of Multi-Sector Energy Scenarios. Renew. Sustain. Energy Transit. 2021, 100010. [Google Scholar] [CrossRef]
  11. Van Vuuren, D.P.; van Soest, H.; Riahi, K.; Clarke, L.; Krey, V.; Kriegler, E.; Rogelj, J.; Schaeffer, M.; Tavoni, M. Carbon budgets and energy transition pathways. Environ. Res. Lett. 2016, 11, 075002. [Google Scholar] [CrossRef] [Green Version]
  12. Kobiela, G.; Samadi, S.; Kurwan, J.; Tönjes, A.; Fischedick, M.; Koska, T.; Lechtenböhmer, S.; März, S.; Schüwer, D. CO2-Neutral bis 2035: Eckpunkte Eines Deutschen Beitrags zur Einhaltung der 1, 5-°C-Grenze; Wuppertal Institut: Wuppertal, Germany, 2020; Available online: https://epub.wupperinst.org/frontdoor/deliver/index/docId/7606/file/7606_CO2-neutral_2035.pdf (accessed on 21 April 2021).
  13. Robinson, J.B. Energy backcasting A proposed method of policy analysis. Energy Policy 1982, 10, 337–344. [Google Scholar] [CrossRef]
  14. Mengis, N.; Simon, S.; Thoni, T.; Stevenson, A.; Goerl, K.; Steuri, B.; Oschlies, A. Defining the German Carbon Budget; Helmholtz Climate Initiative: Berlin, Germany, 2021; Available online: https://www.netto-null.org/Projektergebnisse/Project_Briefings/index.php.de (accessed on 20 October 2021).
  15. Meyer, A. Contraction and Convergence: The Global Solution to Climate Change Devon; Green Books: Cambridge, UK, 2000. [Google Scholar]
  16. Stott, R. Contraction and convergence: The best possible solution to the twin problems of climate change and inequity. BMJ 2012, 344, e1765. [Google Scholar] [CrossRef] [Green Version]
  17. Meyer, A. C&C Example (28 June 2010) in Wikipedia. Available online: https://commons.wikimedia.org/wiki/File:Web_C%26C.png (accessed on 17 October 2021).
  18. AGEB. Auswertungstabellen zur Energiebilanz Deutschland 1990–2016. Arbeitsgemeinschaft Energiebilanzen. Available online: https://www.ag-energiebilanzen.de/10-0-Auswertungstabellen.html (accessed on 29 May 2021).
  19. AGEB. Energiebilanz der Bundesrepublik Deutschland 2019. Arbeitsgemeinschaft Energiebilanzen. Available online: https://ag-energiebilanzen.de/7-0-Bilanzen-1990-2019.html (accessed on 27 April 2021).
  20. BMWi. Zahlen und Fakten. Energiedaten. Gesamtausgabe - Datensammlung des BMWi. Bundesministerium für Wirtschaft und Energie. Available online: https://www.bmwi.de/Redaktion/DE/Artikel/Energie/energiedaten-gesamtausgabe.html (accessed on 27 April 2021).
  21. AGEB. Satellitenbilanz "Erneuerbare Energieträger" zur Energiebilanz der Bundesrepublik Deutschland 2019. Available online: https://ag-energiebilanzen.de/7-0-Bilanzen-1990-2019.html (accessed on 27 April 2021).
  22. Simon, S.; Naegler, T.; Gils, H. Transformation towards a Renewable Energy System in Brazil and Mexico—Technological and Structural Options for Latin America. Energies 2018, 11, 907. [Google Scholar] [CrossRef] [Green Version]
  23. Teske, S.; Pregger, T.; Simon, S.; Naegler, T.; Pagenkopf, J.; van den Adel, B.; Meinshausen, M.; Dooley, K.; Briggs, C.; Dominish, E.; et al. Methodology. In Achieving the Paris Climate Agreement Goals: Global and Regional 100% Renewable Energy Scenarios with Non-Energy GHG Pathways for +1.5 °C and +2 °C; Teske, S., Ed.; Springer International Publishing: Cham, Switzerland, 2019; pp. 25–78. [Google Scholar]
  24. Gils, H.; Simon, S.; Soria, R. 100% Renewable Energy Supply for Brazil—The Role of Sector Coupling and Regional Development. Energies 2017, 10, 1859. [Google Scholar] [CrossRef] [Green Version]
  25. Scholz, Y. Renewable Energy Based Electricity Supply at Low Costs: Development of the REMix Model and Application for Europe; Universitätsbibliothek der Universität Stuttgart: Stuttgart, Germany, 2012; Available online: http://elib.uni-stuttgart.de/opus/volltexte/2012/7635 (accessed on 30 September 2021).
  26. Gils, H.C.; Scholz, Y.; Pregger, T.; Luca de Tena, D.; Heide, D. Integrated modelling of variable renewable energy-based power supply in Europe. Energy 2017, 123, 173–188. [Google Scholar] [CrossRef] [Green Version]
  27. Xiao, M.; Wetzel, M.; Pregger, T.; Simon, S.; Scholz, Y. Modeling the Supply of Renewable Electricity to Metropolitan Regions in China. Energies 2020, 13, 3042. [Google Scholar] [CrossRef]
  28. Gils, H.C.; Simon, S. Carbon neutral archipelago—100% renewable energy supply for the Canary Islands. Appl. Energy 2017, 188, 342–355. [Google Scholar] [CrossRef] [Green Version]
  29. Nitsch, J.; Pregger, T.; Naegler, T.; Heide, D.; Tena, D.L.d.; Trieb, F.; Scholz, Y.; Nienhaus, K.; Gerhardt, N.; Sterner, M.; et al. Langfristszenarien und Strategien für den Ausbau der Erneuerbaren Energien in Deutschland bei Berücksichtigung der Entwicklung in Europa und Global; Deutsches Zentrum für Luft- und Raumfahrt, Fraunhofer: Stuttgart, Germany; Institut für Windenergie und Energiesystemtechnik (IWES): Kassel, Germany; Ingenieurbüro für neue Energien (IFNE): Teltow, Germany, 2012; Available online: http://www.fvee.de/fileadmin/publikationen/Politische_Papiere_anderer/12.03.29.BMU_Leitstudie2011/BMU_Leitstudie2011.pdf (accessed on 13 March 2013).
  30. Steurer, M.; Brand, H.; Blesl, M.; Borggrefe, F.; Fahl, U.; Fuchs, A.-L.; Gils, H.C.; Hufendiek, K.; Münkel, A.; Rosenberg, M.; et al. Energiesystemanalyse Baden-Württemberg: Datenanhang zu Techoökonomischen Kenndaten; Ministerium für Umwelt Klima und Energiewirtschaft Baden-Württemberg: Stuttgart, Germany; STrise—Universität Stuttgart, Deutsches Zentrum für Luft- und Raumfahrt, Zentrum für Sonnenenergie- und Wasserstoff-Forschung Baden-Württemberg: Stuttgart, Germany, 2018. [Google Scholar]
  31. Tsiropoulos, I.; Tarvydas, D.; Zucker, A. Cost Development of Low Carbon Energy Technologies-Scenario-Based Cost Trajectories to 2050, 2017 ed.; Publications Office of the European Union: Luxembourg, 2018; Available online: https://publications.jrc.ec.europa.eu/repository/handle/JRC109894 (accessed on 14 October 2021).
  32. Cao, K.-K.; Pregger, T.; Scholz, Y.; Gils, H.C.; Nienhaus, K.; Deissenroth, M.; Schimeczek, C.; Krämer, N.; Schober, B.; Hendrik, L. Analyse von Strukturoptionen zur Integration erneuerbarer Energien in Deutschland und Europa unter Berücksichtigung der Versorgungssicherheit (INTEEVER); Bundesministerium für Wirtschaft und Energie: Berlin, Germany, 2019. [Google Scholar]
  33. REMix Model Input Data for the THG95/GHG95 Scenario Analysed within the MuSeKo Project. Available online: https://doi.org/10.5281/zenodo.5705414 (accessed on 30 November 2021).
  34. DEA. Technology Data Renewable Fuels; Danish Energy Agency and Energinet: Copenhagen, Denmark, 2021. Available online: https://ens.dk/sites/ens.dk/files/Analyser/technology_data_for_renewable_fuels.pdf (accessed on 8 September 2021).
  35. Fette, M.; Brandstätt, C.; Gils, H.C.; Gardian, H.; Pregger, T.; Schaffert, J.; Tali, E.; Brücken, N. Multi-Sektor-Kopplung-Modellbasierte Analyse der Integration erneuerbarer Stromerzeugung durch die Kopplung der Stromversorgung mit dem Wärme-, Gas-und Verkehrssektor; Fraunhofer-Institut für Fertigungstechnik und Angewandte Materialforschung (IFAM): Bremen, Germany; Deutsches Zentrum für Luft- und Raumfahrt e.V. (DLR): Köln, Germany; Gas- und Wärme-Institut Essen e.V.: Essen, Germany, 2020; Available online: https://elib.dlr.de/135971/ (accessed on 20 October 2020).
  36. VDE. Energiespeicher für die Energiewende—Speicherungsbedarf und Auswirkungen auf das Übertragungsnetz für Szenarien bis 2050; Verband der Elektrotechnik, Elektronik, Informationstechnik e.V.: Frankfurt, Germany, 2012. [Google Scholar]
  37. Sauer, D.; Fuchs, G.; Lunz, B.; Leuthold, M. Technology Overview on Electricity Storage—Overview on the Potential and on the Deployment Perspectives of Electricity Storage Technologies; ISEA/RWTH Aachen University: Aachen, Germany, 2012. [Google Scholar]
  38. BMWi. Entwurf des Integrierten Nationalen Energie- und Klimaplans; Bundesministerium für Wirtschaft und Energie. 2019. Available online: https://www.bmwi.de/Redaktion/DE/Downloads/E/entwurf-des-integrierten-nationalen-energie-und-klimaplans.pdf?__blob=publicationFile&v=12 (accessed on 4 March 2020).
  39. Kemmler, A.; Kirchner, A.; Auf der Maur, A.; Ess, F.; Kreidelmeyer, S.; Piégsa, A.; Spillmann, T.; Wünsch, M.; Ziegenhagen, I. Energiewirtschaftliche Projektionen und Folgeabschätzungen 2030/2050, Dokumentation von Referenzszenario und Szenario mit Klimaschutzprogramm 2030; Prognos AG, Fraunhofer ISI, GWS: Basel, Schweizerland, 2020. [Google Scholar]
  40. Thrän, D.; Lauer, M.; Dotzauer, M.; Kalcher, J.; Oehmichen, K.; Majer, S.; Millinger, M.; Jordan, M. Technoökonomische Analyse und Transformationspfade des energetischen Biomassepotentials (TATBIO); DBFZ Deutsches Biomasseforschungszentrum, UFZ Helmholtz-Zentrum für Umweltforschung: Leipzig, Germany, 2019; Available online: https://www.bmwi.de/Redaktion/DE/Publikationen/Studien/technooekonomische-analyse-und-transformationspfade-des-energetischen-biomassepotentials.html (accessed on 21 October 2021).
  41. FNR. Basisdaten Bioenergie Deutschland; Fachagentur Nachwachsende Rohstoffe: Gülzow, Germany, 2018. [Google Scholar]
  42. Liebich, A.; Fröhlich, T.; Münter, D.; Fehrenbach, H.; Giegrich, J.; Köppen, S.; Dünnebeil, F.; Knörr, W.; Biemann, K.; Simon, S.; et al. System Comparison of Storable Energy Carriers from Renewable Energies; IFEU—Institut für Energie- und Umweltforschung: Heidelberg, Germany; Deutsches Zentrum für Luft- und Raumfahrt, Joanneum: Stuttgart, Germany; Research Forschungsgesellschaft mbH: Graz, Austria, 2021. [Google Scholar]
  43. Bataille, C.; Åhman, M.; Neuhoff, K.; Nilsson, L.J.; Fischedick, M.; Lechtenböhmer, S.; Solano-Rodriquez, B.; Denis-Ryan, A.; Stiebert, S.; Waisman, H.; et al. A review of technology and policy deep decarbonization pathway options for making energy-intensive industry production consistent with the Paris Agreement. J. Clean. Prod. 2018, 187, 960–973. [Google Scholar] [CrossRef] [Green Version]
  44. Davis, S.J.; Lewis, N.S.; Shaner, M.; Aggarwal, S.; Arent, D.; Azevedo, I.L.; Benson, S.M.; Bradley, T.; Brouwer, J.; Chiang, Y.M.; et al. Net-zero emissions energy systems. Science 2018, 360. [Google Scholar] [CrossRef] [Green Version]
  45. Naegler, T.; Simon, S.; Klein, M.; Gils, H.C. Quantification of the European industrial heat demand by branch and temperature level. Int. J. Energy Res. 2015, 39, 2019–2030. [Google Scholar] [CrossRef] [Green Version]
  46. Rehfeldt, M.; Fleiter, T.; Toro, F. A bottom-up estimation of the heating and cooling demand in European industry. Energy Effic. 2017, 11, 1057–1082. [Google Scholar] [CrossRef]
  47. Harpprecht, C.; Naegler, T.; Steubing, B.; Tukker, A.; Simon, S. Decarbonization scenarios for the iron and steel sector: Germany as a case study. In preparation.
  48. Bhaskar, A.; Assadi, M.; Nikpey Somehsaraei, H. Decarbonization of the Iron and Steel Industry with Direct Reduction of Iron Ore with Green Hydrogen. Energies 2020, 13, 758. [Google Scholar] [CrossRef] [Green Version]
  49. Fischedick, M.; Marzinkowski, J.; Winzer, P.; Weigel, M. Techno-economic evaluation of innovative steel production technologies. J. Clean. Prod. 2014, 84, 563–580. [Google Scholar] [CrossRef] [Green Version]
  50. Roderer, V. Future Environmental Impacts of Cement Production in Germany and the Effects on Downstream Consumers; Pforzheim University: Pforzheim, Germany, 2021; Available online: https://elib.dlr.de/143385/1/Masterarbeit_Roderer_original.pdf (accessed on 11 August 2021).
  51. Brunke, J.-C.; Blesl, M. Energy conservation measures for the German cement industry and their ability to compensate for rising energy-related production costs. J. Clean. Prod. 2014, 82, 94–111. [Google Scholar] [CrossRef]
  52. Ehrenberger, S.; Seum, S.; Pregger, T.; Simon, S.; Knitschky, G.; Kugler, U. Land transport development in three integrated scenarios for Germany – Technology options, energy demand and emissions. Transp. Res. D Transp. Environ. 2021, 90, 102669. [Google Scholar] [CrossRef]
  53. Henning, A.; Plohr, M.; Özdemir, D.; Hepting, M.; Keimel, H.; Sanok, S.; Sausen, R.; Pregger, T.; Seum, S.; Heinrichs, M. The DLR Transport and the Environment Project-Building Competency for a Sustainable Mobility Future; DLR Deutsches Zentrum fur Luft- und Raumfahrt e.V.: Köln, Germany, 2016; pp. 192–198. [Google Scholar]
  54. Hepting, M.; Pak, H.; Grimme, W.; Dahlmann, K.; Jung, M. Climate impact of German air traffic: A scenario approach. Transp. Res. D Transp. Environ. 2020, 85, 102467. [Google Scholar] [CrossRef]
  55. Brosowski, A.; Thrän, D.; Mantau, U.; Mahro, B.; Erdmann, G.; Adler, P.; Stinner, W.; Reinhold, G.; Hering, T.; Blanke, C. A review of biomass potential and current utilisation – Status quo for 93 biogenic wastes and residues in Germany. Biomass Bioenergy 2016, 95, 257–272. [Google Scholar] [CrossRef] [Green Version]
  56. FNR. Anbau und Verwendung nachwachsender Rohstoffe in Deutschland; Fachagentur Nachwachsende Rohstoffe e.V.: Gülzow, Germany, 2021; Available online: https://www.fnr-server.de/ftp/pdf/berichte/22004416.pdf (accessed on 3 June 2021).
  57. FNR. Zeitreihe für den Anbau nachwachsender Rohstoffe in Deutschland; Fachagentur Nachwachsende Rohstoffe e.V.: Gülzow, Germany, 2017. [Google Scholar]
  58. Von Krbek, K.; Bertsch, V.; Scholz, Y. Can resource classes substitute spatial resolution in energy system models? A spatial scaling analysis. In Proceedings of the European Conference on Operational Research, Athens, Greece, 11–14 July 2021. [Google Scholar]
  59. Sterchele, P.; Brandes, J.; Heilig, J.; Wrede, D.; Kost, C.; Schlegl, T.; Bett, A.; Henning, H.-M. Wege zu einem klimaneutralen Energiesystem: Die deutsche Energiewende im Kontext gesellschaftlicher Verhaltensweisen; Fraunhofer-Institut für Solare Energiesysteme ISE: Freiburg, Germany, 2020; Available online: https://www.ise.fraunhofer.de/de/veroeffentlichungen/studien/wege-zu-einem-klimaneutralen-energiesystem.html (accessed on 12 October 2021).
  60. IHA. In 2020 Hydropower Status Report Sector Trends and Insights; International Hydropower Association: London, UK, 2020; Available online: https://hydropower-assets.s3.eu-west-2.amazonaws.com/publications-docs/2020_hydropower_status_report.pdf (accessed on 3 June 2021).
  61. Gesetz zur Änderung des Windenergie-auf-See-Gesetzes und anderer Vorschriften. Available online: https://www.bgbl.de/xaver/bgbl/start.xav?startbk=Bundesanzeiger_BGBl&start=//*%5b@attr_id=%27bgbl120s2682.pdf%27%5d#__bgbl__%2F%2F*%5B%40attr_id%3D%27bgbl120s2682.pdf%27%5D__1631697779438 (accessed on 17 September 2021).
  62. Gils, H.C.; Gardian, H.; Schmugge, J. Interaction of hydrogen infrastructures with other sector coupling options towards a zero-emission energy system in Germany. Renew. Energy 2021, 180, 140–156. [Google Scholar] [CrossRef]
  63. Junne, T.; Simon, S.; Buchgeister, J.; Saiger, M.; Baumann, M.; Haase, M.; Wulf, C.; Naegler, T. Environmental Sustainability Assessment of Multi-Sectoral Energy Transformation Pathways: Methodological Approach and Case Study for Germany. Sustainability 2020, 12, 8225. [Google Scholar] [CrossRef]
  64. Madeddu, S.; Ueckerdt, F.; Pehl, M.; Peterseim, J.; Lord, M.; Kumar, K.A.; Krüger, C.; Luderer, G. The CO2 reduction potential for the European industry via direct electrification of heat supply (power-to-heat). Environ. Res. Lett. 2020, 15. [Google Scholar] [CrossRef]
  65. Fraunhofer-Institut für System- und Innovationsforschung ISI; Consentec GmbH; Sensfuß, F.; Lux, B.; Bernath, C.; Kiefer, C.; Pfluger, B.; Kleinschmitt, C.; Franke, K.; Deac, G.; et al. Langfristszenarien für die Transformation des Energiesystems in Deutschland. Available online: https://www.langfristszenarien.de/enertile-explorer-wAssets/docs/LFS_Kurzbericht_final_v5.pdf (accessed on 15 November 2021).
  66. ENTSO-E. Netzentwicklungsplan 2030; European Association for the Cooperation of Transmission System Operators (TSOs) for Electricity: Brussels, Belgium, 2016. [Google Scholar]
  67. Sasanpour, S.; Cao, K.-K.; Gils, H.C.; Jochem, P. Strategic policy targets and the contribution of hydrogen in a 100% renewable European power system. Energy Rep. 2021, 7, 4595–4608. [Google Scholar] [CrossRef]
  68. Zappa, W.; Junginger, M.; van den Broek, M. Is a 100% renewable European power system feasible by 2050? Appl. Energy 2019, 233–234, 1027–1050. [Google Scholar] [CrossRef]
  69. Child, M.; Kemfert, C.; Bogdanov, D.; Breyer, C. Flexible electricity generation, grid exchange and storage for the transition to a 100% renewable energy system in Europe. Renew. Energy 2019, 139, 80–101. [Google Scholar] [CrossRef]
  70. Fasihi, M.; Bogdanov, D.; Breyer, C. Long-Term Hydrocarbon Trade Options for the Maghreb Region and Europe—Renewable Energy Based Synthetic Fuels for a Net Zero Emissions World. Sustainability 2017, 9, 306. [Google Scholar] [CrossRef] [Green Version]
  71. Lu, Y.; Khan, Z.A.; Alvarez-Alvarado, M.S.; Zhang, Y.; Huang, Z.; Imran, M. A Critical Review of Sustainable Energy Policies for the Promotion of Renewable Energy Sources. Sustainability 2020, 12, 5078. [Google Scholar] [CrossRef]
  72. IWR-Online. Klimafreundlicher Stahl – Salzgitter AG erhält BMU-Förderung. Available online: https://www.iwr.de/news/klimafreundlicher-stahl-salzgitter-ag-erhaelt-bmu-foerderung-news37124 (accessed on 30 September 2021).
  73. Rhoden, I.; Simon, S.; Ball, C.; Mengis, N.; Voegele, S.; Baetcke, L.; Steuri, B.; Kuckshinrichs, W.; Manske, D.; Yeates, C. Spatial Heterogeneity-Challenge and opportunity for net-zero Germany; Systemforschung und Technologische Entwicklung, Forschungszentrum Jülich: Jülich, Germany, 2021. [Google Scholar]
  74. Nasr, A.K.; Kashan, M.K.; Maleki, A.; Jafari, N.; Hashemi, H. Assessment of Barriers to Renewable Energy Development Using Stakeholders Approach. Entrep. Sustain. Issues 2020, 7, 2526–2541. [Google Scholar] [CrossRef] [Green Version]
  75. Segreto, M.; Principe, L.; Desormeaux, A.; Torre, M.; Tomassetti, L.; Tratzi, P.; Paolini, V.; Petracchini, F. Trends in Social Acceptance of Renewable Energy Across Europe—A Literature Review. Int. J. Environ. Res. Public Health 2020, 17, 9161. [Google Scholar] [CrossRef] [PubMed]
  76. Lucas, H.; Carbajo, R.; Machiba, T.; Zhukov, E.; Cabeza, L.F. Improving Public Attitude towards Renewable Energy. Energies 2021, 14, 4521. [Google Scholar] [CrossRef]
  77. Naegler, T.; Becker, L.; Buchgeister, J.; Hauser, W.; Hottenroth, H.; Junne, T.; Lehr, U.; Scheel, O.; Schmidt-Scheele, R.; Simon, S.; et al. Integrated Multidimensional Sustainability Assessment of Energy System Transformation Pathways. Sustainability 2021, 13, 5217. [Google Scholar] [CrossRef]
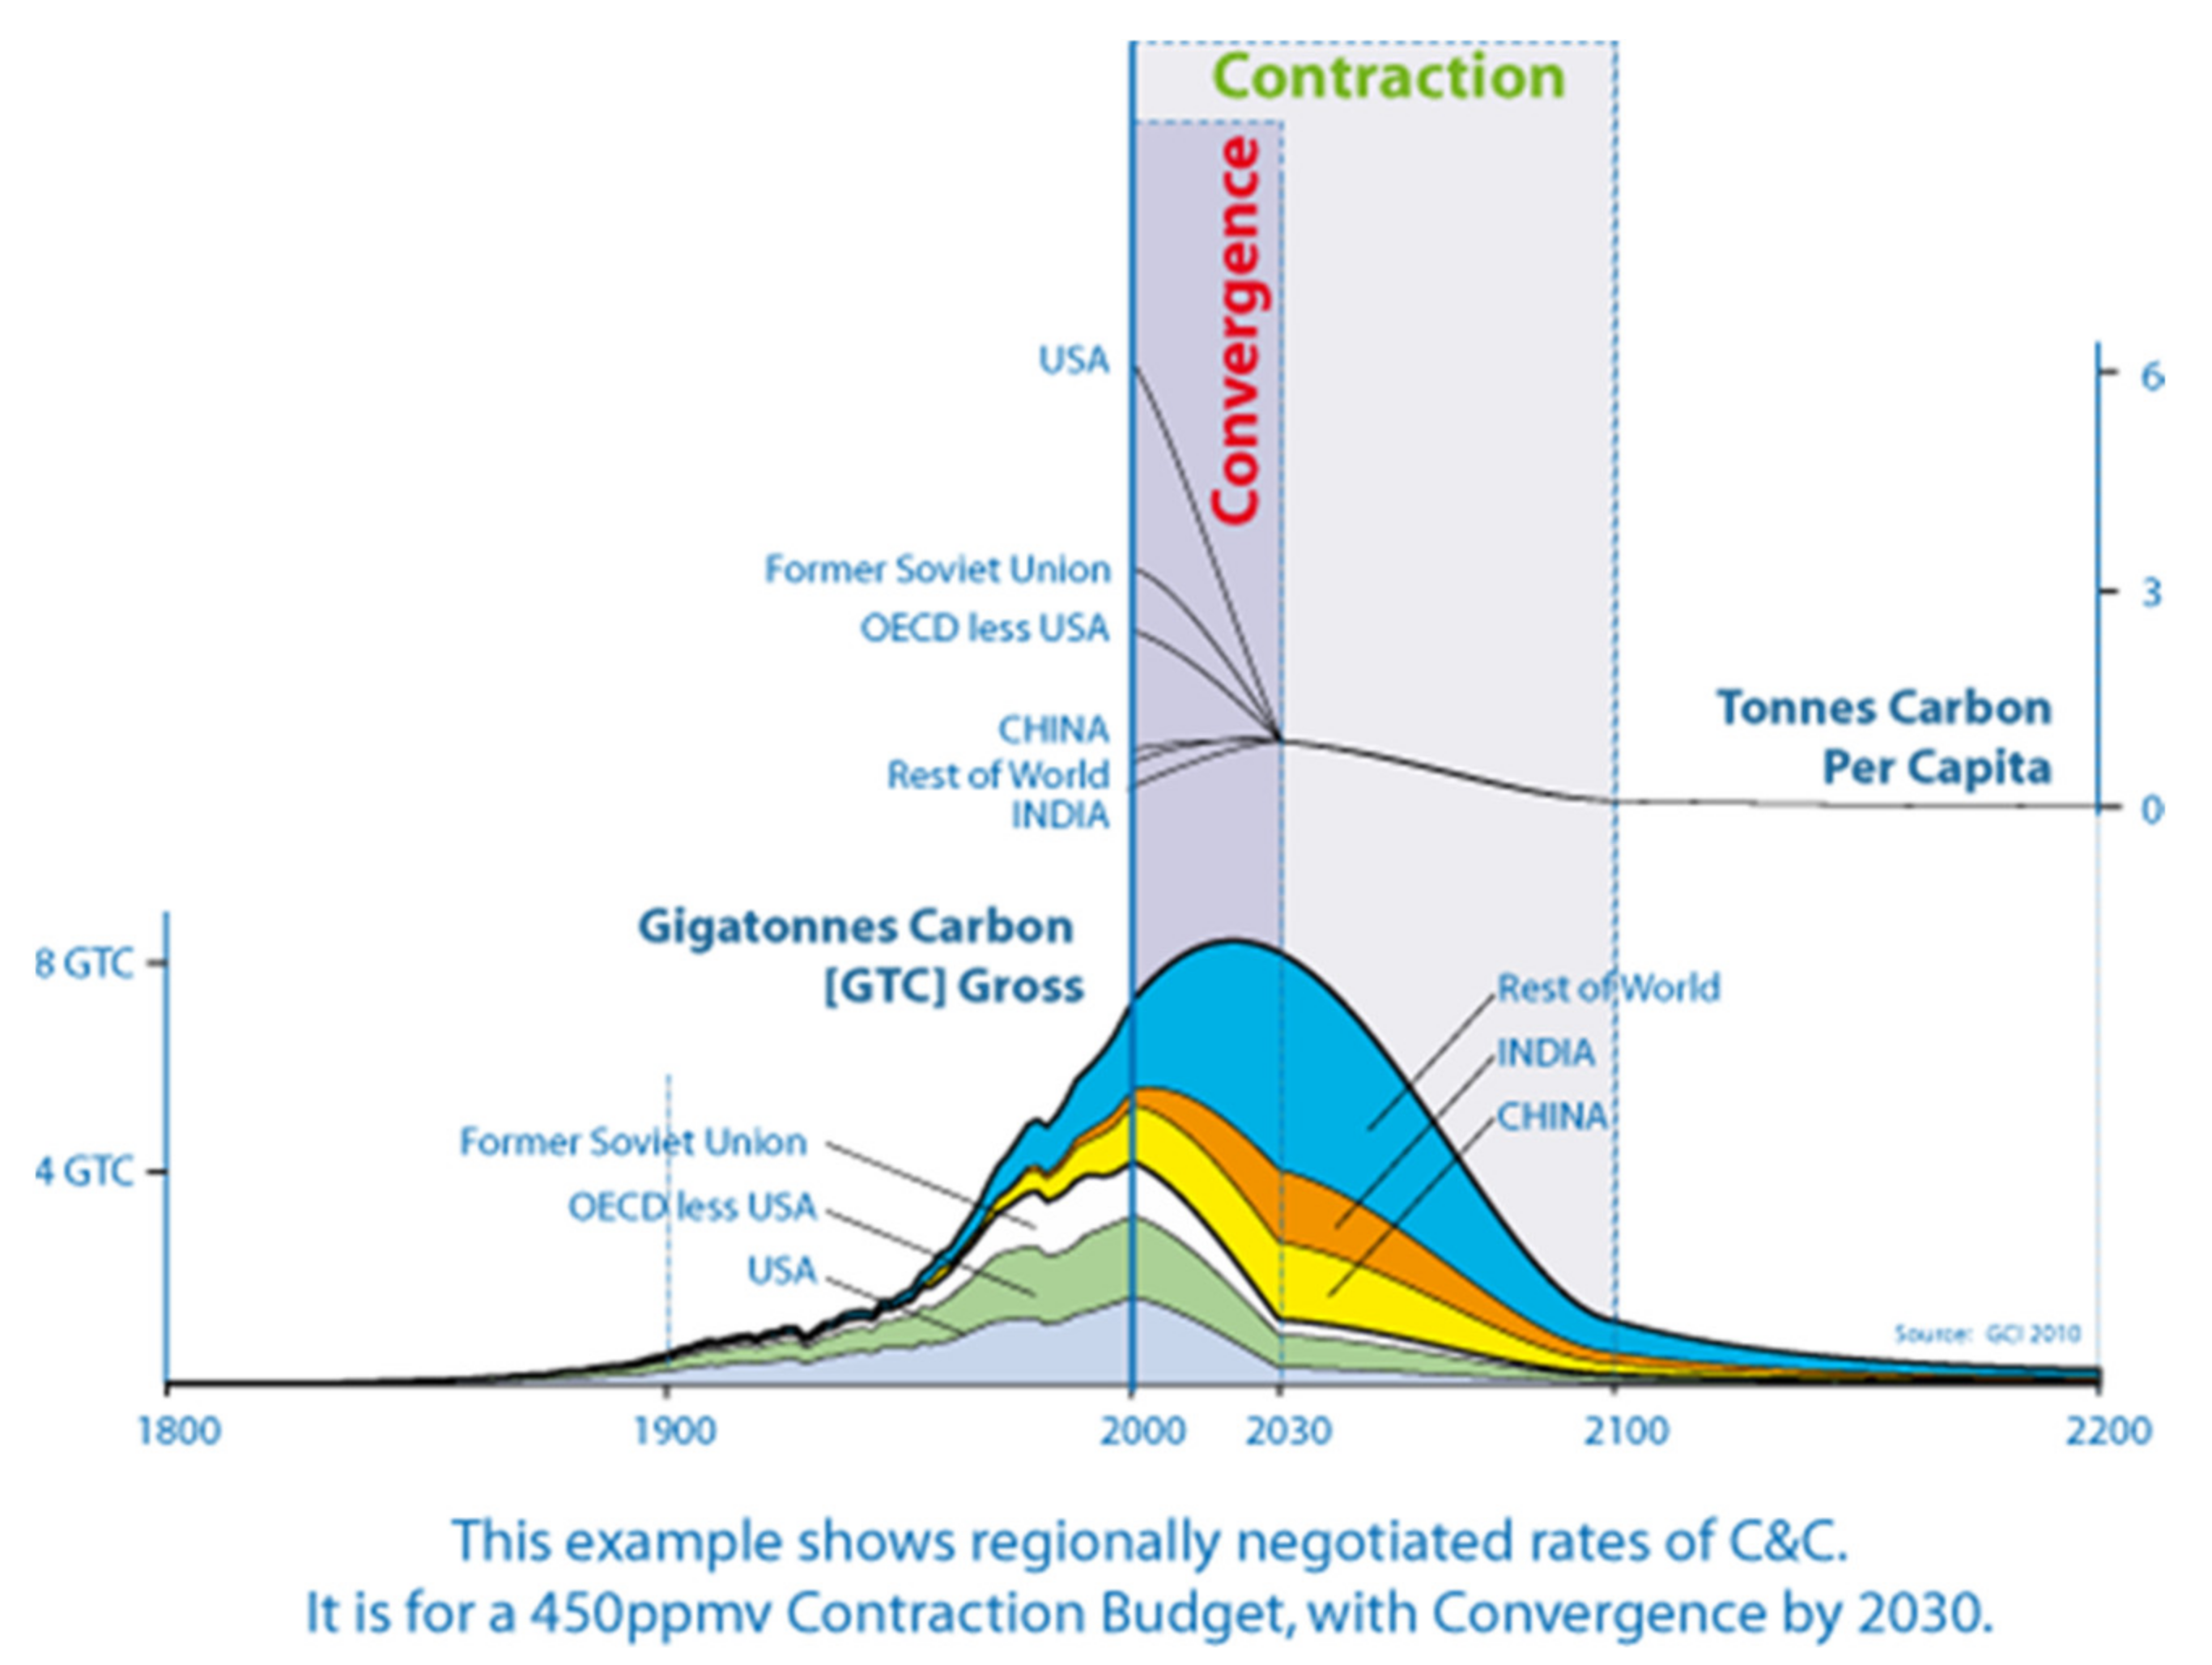
Figure 1. The contraction and convergence approach for deriving fair carbon budgets for nations [17].
Sustainability 14 01025 g001
Figure 2. Applied energy system model (ESM) for the energy scenario analysis.
Sustainability 14 01025 g002
Figure 3. Energy system optimization model REMix adapted from [27].
Sustainability 14 01025 g003
Figure 4. System boundary with modeled regions of Germany and neighboring countries.
Sustainability 14 01025 g004
Figure 5. Model coupling of ESM and REMix adapted from [28].
Sustainability 14 01025 g005
Figure 6. Cumulative CO2 emissions from 2021–2050 and annual CO2 emissions from the German energy system under the Budget Scenario.
Sustainability 14 01025 g006
Figure 7. Projection of final energy demand in the BS after 2020 compared with historic development from 2005–2018.
Sustainability 14 01025 g007
Figure 8. Heat supply for the residential, industrial, services and other sectors in the BS, (a) residential, service & commerce, (b) industrial heat.
Sustainability 14 01025 g008
Figure 9. Fuel supply to total transport and specifically passenger cars; * each sectoral energy supply consists of a mix of fuels; ** only domestic, (a) all transport fuels, (b) passenger cars.
Sustainability 14 01025 g009
Figure 10. Installed power capacities and generation in the BS in Germany, (a) power generation, (b) installed capacity..
Sustainability 14 01025 g010
Figure 11. The results of a purely cost-optimizing modeling of regional RE power generation capacities in 2050 (colored area) and electricity production in 2030 and 2050 (column charts). Values for 2019 are derived from statistics.
Sustainability 14 01025 g011
Figure 12. Added power grid capacity between 2020 and 2050 within German regions and to the modeled neighboring countries in the Budget Scenario.
Sustainability 14 01025 g012
Figure 13. The regional distribution of hydrogen infrastructures in the scenario year of 2030 (left) and 2050 (right).
Sustainability 14 01025 g013
Figure 14. Total system costs (including power import costs) for Germany in the BS.
Sustainability 14 01025 g014
Figure 15. The sensitivity analysis of power generation from PV, wind and net power imports in Germany relative to the BS.
Sustainability 14 01025 g015
Figure 16. Sensitivity analysis of total system costs for Germany relative to the BS.
Sustainability 14 01025 g016
Figure 17. Primary energy supply in the BS for Germany (historic values before 2020 and modeling results from 2020).
Sustainability 14 01025 g017
Table 2. Assumptions on socio-economic development and fuel costs for Germany.
Unit2020203020402050
GDPbillion EUR20163326372940884430
Populationmillion capita83.582.981.379.0
CO2 price highEUR2016/t24140220240 *
Fuel prices:
Crude oilEUR2016/GJ13.017.018.019.4
Natural gasEUR2016/GJ8.09.010.010.6
Hard coalEUR2016/GJ2.53.64.04.3
SyncrudeEUR2016/GJ119806560
UraniumEUR2016/GJ0.60.70.91.0
LigniteEUR2016/GJ5.65.14.84.5
Source: NECP background study [39]; * own assumption.
Table 3. Assumptions on biomass, waste and hydrogen costs.
Unit2020203020402050
Biomass costs
Waste wood and wood chipsEUR2016/GJ3.23.23.23.2
Pellets, short rotation forestryEUR2016/GJ13.914.815.816.7
Landfill gasEUR2016/GJ1.01.01.01.0
Liquid biofuelsEUR2016/GJ21.628.335.041.7
Raw biogasEUR2016/GJ15.014.614.313.9
Waste costEUR2016/GJ0000
Hydrogen cost *EUR2016/GJ24.424.424.424.4
Source: own assumptions based on [40,41]; * based on [42].
Table 4. Renewable energy potentials in Germany considered in our Budget Scenario.
UnitPotentialSources
PVGW566[26,35]
Wind
OnshoreGW217[58,59]
OffshoreGW72[26,35]
Biomass
BiogasPJ/a950[55]
Solid BiomassPJ/a340[55]
Energy crop areamil ha2.7[56,57]
Table 5. Targets for market shares of energy carriers in space heat, hot water and process heat for 2050.
Energy SourceResidential Space
Heat & Hot Water
Services: Space Heat
& Hot Water
Industry: Space
Heat & Hot Water
Industry:
Process Heat
Power17%18%18%39%
Gas (Methane, H2)5%6%10%33%
District heat30%30%35%6%
Solar thermal10%10%8%5%
Biomass7%15%8%10%
Heat pumps and geothermal30%21%21%1%
Hard coal and waste---4%
Oil products---2%
Total100%100%100%100%
Table 6. Sensitivity analysis for the optimization of the power system in Germany with REMix.
Scenario NamesMin. Domestic Power Generation SharePV Potentials (Germany)Fuel Price for Solid BiomassDescription
BS90%566 GWHighHigh PV potentials
HighImport80%566 GWHighLower minimum domestic power generation share
LowPV90%283 GWHighHalf PV potentials
LowFuelBio90%566 GWLowLow fuel price scenario for solid biomass
LowImport95%566 GWHighHigher minimum domestic power generation share
Publisher’s Note: MDPI stays neutral with regard to jurisdictional claims in published maps and institutional affiliations.