1. Introduction
Agri-environmental (AE) collective schemes in European countries show great diversification in goals, priorities, environmental issues, political background, legislation and administration issues, economic viability of the agricultural sector, impact and result AE indicators, and more [
1,
2]. Therefore, it is difficult for decision makers to compare the schemes and make strategical decisions for improvement. An approach to delivering AE public goods using AE collective schemes is relatively new in many European countries; it only began with CAP reform 2014–2020 [
3,
4,
5]. Hence, more explicit knowledge about the subject is scarce and numerous data are collected with qualitative techniques (in-depth interviews, workshops with interested stakeholders, SWOT analyses) [
6,
7,
8,
9]. Public goods are things that are nonexcludable and non-rival (something that is available to all, irrelevant of who has accessed the supply of the good or to what extent it has been accessed) [
10]. The need to encourage behaviours that provide public goods arises because of the market failure to supply them autonomously [
11]. Thus, whilst the agricultural industry is being valued for its capacity to provide public goods [
12,
13], without appropriate intervention, land managers are unable or unwilling to supply them [
14]. The need is most clear in the context of agriculture’s biodiversity and GHG footprint [
15,
16,
17]. These anxieties and ambitions are manifest across CAP 2021–2027 [
18,
19]. These are the main reasons why new AE collective schemes across the EU are thinking of novel strategies to succeed in the provision of AE public goods and to exchange diversified knowledge. There is a set of policy challenges that includes maintaining the diversity and distinctive character of agricultural habitats and landscapes, facilitating the adaptation of species and habitats to climate change, maintaining and restoring farmland biodiversity, and conserving the genetic resource, which all require some form of appropriate and sustained management of agricultural land. Addressing these challenges involves supporting activities both to maintain and extend appropriate forms of agriculture and the beneficial practices required to deliver the public goods in question, as well as to avoid the loss of environmentally valuable agricultural land to other land uses, such as urban development or land abandonment [
10,
20]. Studies of AE collective schemes are still biased towards their own environment [
3,
21], and comparison studies of different AE collective schemes do not exist yet. For this reason, this study is a path towards the first comparison study of different AE collective schemes in general.
The start for any strategic planning is good knowledge of how supportive one’s environment is and can be in the near future to succeed in one’s goals (public and private) [
22]. Strengths-Weaknesses-Opportunities-Threats (SWOT) analysis may be a simple yet useful planning tool to begin strategic planning [
23]. SWOT analysis is one of the key tools for addressing complex strategic situations by reducing the number of data to enhance decision-making. It is often employed when monitoring or evaluating a specific program, service, product, or industry and exploring measures for improvement [
24]. In other words, this method analyses how supportive the environment is to the goal. The great advantage of the SWOT analysis is that it can be used by any person or stakeholder group (regardless of their previous knowledge and experience) and for any strategic goal [
23]. Therefore, when AE collectives across the EU were thinking of developing innovative new AE contracts to better deliver AE public goods, they firstly used the SWOT analysis, a brain-storming tool for decision making, to analyse a collective scheme’s internal and external factors that influence the scheme’s performance [
2].
Nevertheless, SWOT analysis alone does not give a straight solution nor recommendation for developing a strategic plan [
23]. For this, the decision makers often use other methods, among which is also the multi-criteria decision-making (MCDM) method. The use of MCDM is suitable for solving problems of agri-environmental programs and multifunctional issues of agriculture [
9]. MCDM is also an appropriate tool for assessing environmental services and for comparing types of land use in relation to their implementation of environmental services [
25]. Furthermore, MCDM methods are used in the field of environmental management and stakeholder involvement [
26] and help many stakeholders to assess often conflicting criteria (objectives), communicate their different preferences, and classify or prioritize goals, strategies, opportunities, etc. [
27]. Consequently, an integration of SWOT analysis into MCDM in a field of sustainable management of natural resources has proven successful several times, just to mention a few up-to-date research articles [
28,
29,
30,
31]. This study aims to integrate the SWOT and MCDM together. There are some works that studied a similar topic but had a different problem to solve such as the Quantified SWOT analytical method [
32], SWOT-SMART [
33], AHP-SWOT-fuzzy TOPSIS [
9,
34], SWOT-fuzzy goal programming [
35], and others. In these works, the SWOT results commonly serve as a tool for defining important criteria for the objective of the MCDM model [
9,
33], for setting a SWOT matrix of possible strategies [
35], or for simultaneously performing SWOT analysis on several alternatives to assess the competing strength and then suggest a competing strategy [
32]. None of the work, to the best of our knowledge, uses raw input data of SWOT analysis, measures the sum of its importance factors by criteria, and uses this measurement as an input for the MCDM model. In addition, to the best of our knowledge, in other works, only a single SWOT analysis is integrated into MCDM and used in various ways. This is sufficient when a decision maker(s) wants to know the best strategy for improvement of one system and when researchers want to describe it, but when one has several systems or, in our case, AE collective schemes that are extremely diversified in their external and internal environment, the integration of a single SWOT analysis to the MCDM that compares several AE collective schemes is simply not applicable. Additionally, the decision makers in our case want to have several other pieces of information: (a) which AE collective scheme(s) at the moment give(s) the best output in providing AE public goods. They also want to (b) have direct insight into practical internal and external circumstances that affect the provision of AE public goods and (c) have knowledge exchange between AE collective schemes. None of the decision makers want to have a description of strategy or a comparison of different strategies because they do not have one yet. They are building novel AE collective schemes from old ones and want to know where they are at the moment, in which fields it is more prosperous to invest time and money, and what kind of environment they have to evolve to support new ideas to extend the provision of AE public goods in their environment.
To the best of our knowledge and investigation, no study before has tried to use the information provided from SWOT analysis to answer these questions, simultaneously using several SWOT analyses for several alternatives that have extremely diversified environments. Here, the proposed SWOT scorecard technique allows a simultaneous comparison of several SWOT analyses by their importance of external and internal factors and keeps immediate track of experiences, practices, and circumstances that affect these factors. That is why a SWOT scorecard could be the basis for a decision support tool for decision makers that need to set a strategic plan for an individual system at the beginning of a new scheme, compare their work up to the present, and exchange knowledge to succeed in a common goal in the future.
It is known that when properly used, SWOT can be a good basis for devising a strategy [
32]. Several European countries have applied SWOT analysis for strategy prioritization and to ensure the consistency of horizontal policies in their national strategies for sustainable development [
19].
It is a fact that in setting novel cooperative schemes, such as the AE collective schemes, no comparable quantitative data or common indicators exist yet. The AE collectives therefore face a wall by not having any comparable data input to set the strategic plan for improvement and to learn from good or bad practices [
36]. However, they have conducted SWOT analyses. Each AE collective scheme presented here has conducted one SWOT analysis for its environment. One of the major limitations of the traditional SWOT method is that the significance of each element in the process of decision making cannot be quantified, and it is hard to evaluate which element is more influential for the strategic decision [
2]. For this reason, the comprehensive appraisal of the strategic decision-making process cannot be made through the traditional SWOT method [
37]. However, we argue that if several SWOT analyses are made for the same reason, regardless of their diversified environments, they can still be compared if the descriptive results are used in a comparable way, using here the proposed SWOT scorecard technique that can evaluate the sum of importance of individual factors involved in the decision-making process by transforming them into numeric values.
In this research, a multi-criteria Decision Expert method (DEX) was chosen because we can only use qualitative data from already existing SWOT analyses [
2] of selected collective schemes (also alternatives), and the DEX method enables the evaluation of qualitative inputs. The DEX method consists of a decision tree and the classification of attributes, criteria, and sub-criteria into levels and sub-levels. In addition, it allows the weighting of criteria at all levels [
38].
All collectives in this research have the same goal; hence, the results of their SWOT analyses, regardless of their diversity, should be comparable if used properly. The qualitative results from SWOT analyses had to be somehow evaluated to be comparable in an MCDM model. In this article, a special technique is introduced, inspired by the work of Wright et al. [
39], that can change qualitative data from a SWOT analysis to a quantitative SWOT scorecard and deliver input data for an MCDM model that compares extremely diversified AE collective schemes across the EU. The technique is further tested and discussed within the MCDM model with five cases of AE collective schemes in a DEXi program.
2. Materials and Methods
2.1. Decision Tree for MCDM
In the first part of the modelling, a decision tree was made with individual decision-making approach based on qualitative analysis of the relevant literature [
1,
40]. Using a hierarchical top-down approach, we identified the main objective, attributes, criteria, and sub-criteria that should influence the synergy between aspects in AE collective schemes to provide AE public goods. With a hierarchical bottom-up approach, using existing SWOT analyses [
2] and grouping the result inputs into previously identified attributes, we clarified and named the level of criteria. Therefore, the final decision tree was made using both approaches.
Table 1 presents the final decision tree for MCDM model, including MCDM goals, relevant attributes, and criteria.
The decision tree has two MCDM goals: to analyse synergy between different aspects in AE collective schemes (Goal 1) and to compare alternatives in AE public goods provision (Goal 2). Here, in this article, only results of goal 1 are fully presented. Goal 2 is still in a development phase to date. The model has four aspects: social, agri-environmental, economic, and political. Each aspect has three criteria, so all together, the model compares twelve criteria. In this model, equal weights for criteria and attributes were used, as Ahtainen et al. [
40] argue that social, economic, and environmental objectives of agriculture are equal for stakeholders.
2.2. MCDM Decision Expert (DEX) Model
DEXi’s multi-attribute models are called qualitative. They are characterized by:
Using qualitative (symbolic) attributes, whose scales are discrete and typically consist of words rather than numbers;
Employing utility functions that are represented by (tables of) decision rules rather that numerical formulae.
In principle, DEXi’s multi-attribute models have a strict tree structure: attributes are structured so that there is exactly one path from each aggregate attribute to the root of the tree. This means that each attribute (other than the root) influences exactly one parent in the tree. A tree of attributes can be interpreted in three ways:
Decomposition: This represents a decomposition of a decision problem into sub-problems. To solve ‘a problem’, which is represented by a higher-level attribute, one has to solve sub-problems represented by its lower-level descendants.
Dependency: A higher-level attribute depends on its immediate descendants in the tree. This dependency is modelled by a utility function that corresponds to the higher-level attribute.
Aggregation: Tree structure defines the bottom-up aggregation of option values. The value of a higher-level attribute is calculated as an aggregation of the values of its immediate descendants in the tree. Again, this aggregation is defined by the corresponding utility function.
The interpretation of attribute types is as follows:
Basic attributes represent inputs of the model;
Root attributes represent its main outputs;
Other aggregate attributes represent intermediate results of option evaluation that is calculated with a utility function.
Basic attributes represent inputs of the multi-attribute model. Options are described by the values of basic attributes. These options come from other sources outside of DEX and are transformed from the raw data, here called ‘prime input data’, to fit the DEX decision rules. In our case, the origin of prime input data is several SWOT analyses. Here, prime input data means unchanged raw qualitative data, usually recorded as the opinion or observation of the performer of the SWOT analysis. DEX does not recognize ‘prime input data’ by themselves because prime input data do not carry any information by themselves that can be described as a range on scale. Thus, this has to be done in advance by MCDM analyst. In the DEX model, options are described as qualitative values, such as: ‘yes’, ‘no’, ‘more’, ‘less’, or range values such as ‘100–150’—anything that can describe meaning assigned to the value of basic attributes. Normally, the definition of options in DEX is chosen with the help of knowledgeable people (experts in field). The definition of options in our case is the result of the SWOT scorecard technique and transformation of its numeric results to a descriptive three-level Likert scale.
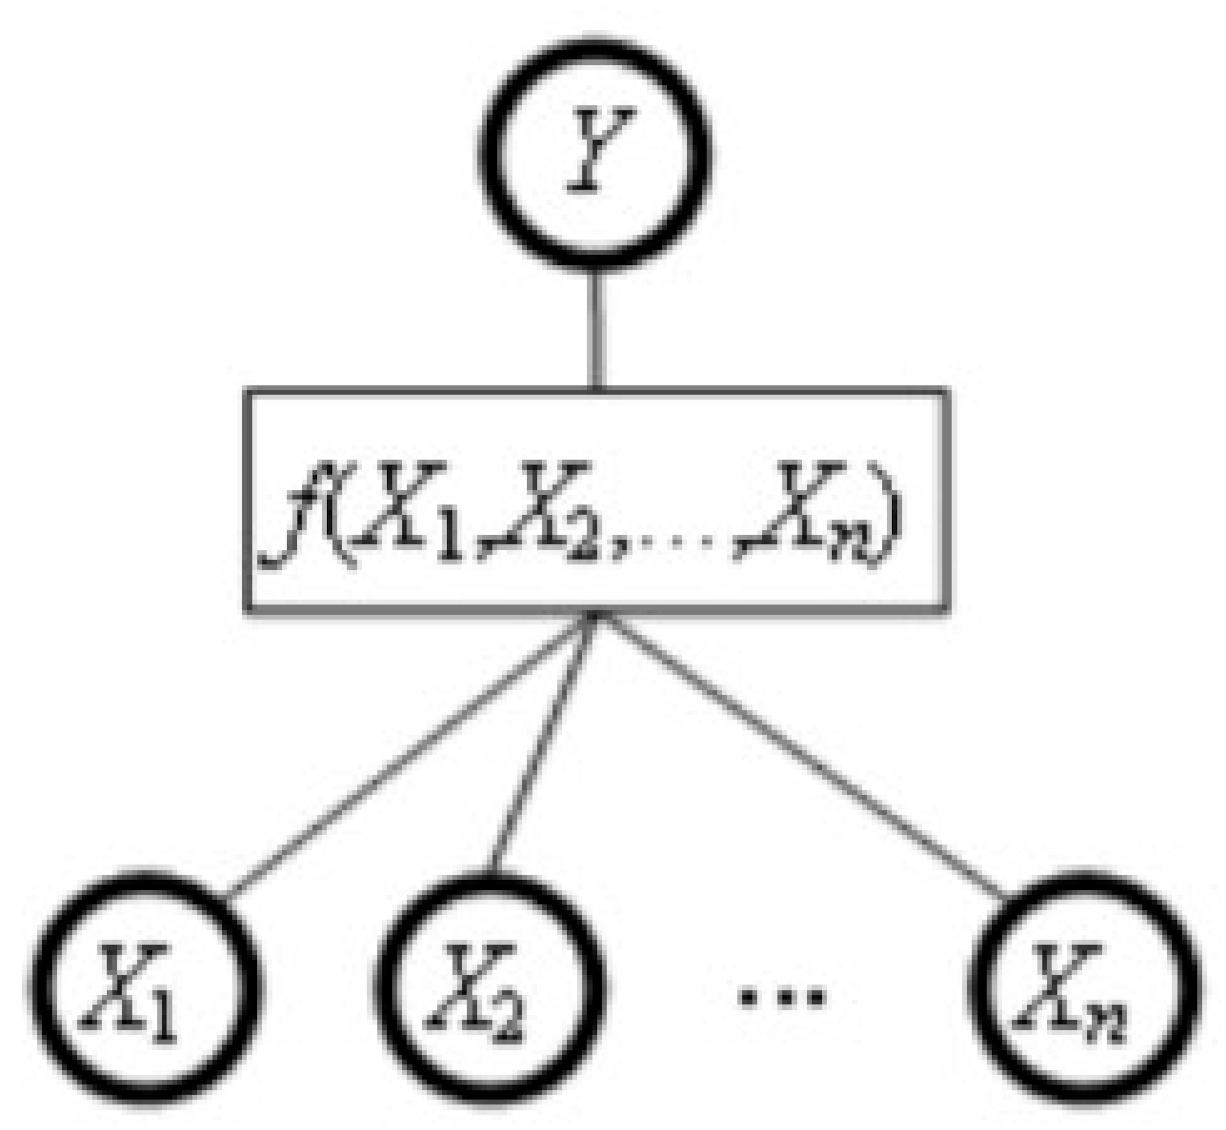
In DEXi, a utility function maps all the combinations of the lower-level attribute values into the values of Y. Utility functions are the components of multi-attribute models that define the aggregation aspect of option evaluation. The mapping is represented in a table, where each row gives the value of f for one combination of the lower-level attribute values. Rows are also called decision rules, because each row can be interpreted as an ‘if-then’ rule of the form: if X1 = value 1 and X2 = value 2 and … and Xn = value n, then Y = value (or value interval).
For each aggregate attribute Y, whose descendants in the tree of attributes are X
1, X
2, …, X
n, the corresponding utility function f defines the mapping: f: X
1 × X
2 × … × X
n → Y [
41] (pp. 15–16).
Figure 1 presents the utility functions schematically.
The obtained evaluation and analysis results provide the basis for decision maker’s assessment of options and possible choice of the best one [
41].
2.3. The Alternatives
Alternatives used in this model have but one common point, their goal: to better provide AE public goods through AE collective schemes. For the input data, five SWOT analyses of AE collective schemes from three different countries were used: the Netherlands (2 collective schemes: NL_Limburg, NL_ANOG), France (2 collective schemes: FR_HautPyrenees_loc, FR_HautPyrenees_SHP), and the United Kingdom (1 collective scheme: UK_CSFF). The diversity of presented collective schemes is extreme: the Netherlands collectives have the longest tradition, knowledge, and experiences with the collective schemes (more than 30 years) and are best supported with legislation coherence; however, they lack biodiversity and have huge problems with nitrogen leaking. France has two very new transhumance AE collective schemes in the Great Pyrenees, a very remote mountain region where wild environment mixes with pasture agriculture that threatens extinction. The United Kingdom scheme has the environment full of biodiversity, the greatest of all three; therefore, a result-based AE approach combines greatly with an AE collective approach [
1].
2.4. The SWOT Scorecard Instruction Technique
In SWOT analysis, every sentence given is one input data point. Firstly, we had to group the input data by attributes from the decision tree.
Table 2 presents an example of such grouping of input data from SWOT analyses for attribute ‘Political aspects’, keeping track of the origin of the analysis (S = strength, W = weakness, O = opportunity, T = threat) for every alternative.
After linking all input data to corresponding aspects, the input data could be further grouped and linked to corresponding criteria, the sub-level of attribute. Each attribute in the presented model has three criteria.
Sometimes, more than one input data point of strength and weakness factors is linked to the same criteria. For example, FR_HautPyrenees_loc has two weaknesses: the weakness factor ‘a lack of administration flexibility in dates’ and the weakness factor ‘too much administrative constraints (calendar lag in controls: practices reported before implementation’. These factors are linked to the same criteria named ‘flexibility’. If this is the case, no matter how many input data are linked to the same criteria, the SWOT scorecard evaluates a value 1 for all strengths per criteria and −1 for all weaknesses per criteria per alternative.
However, this should not be the case for opportunity or threat factors because they have a different nature in explaining the environment in the SWOT scorecard. Opportunity/threat is the capability of the environment to support/suppress the strength/weakness factors in each criterion. Therefore, some opportunities or threats can be used more than others in the scorecard if they describe the capability to support/suppress more than one strength or weakness in more than one criterion. In addition, if there exists more than one opportunity/threat, this evaluates more/less supportive environment. Therefore, the SWOT scorecard evaluates a value 0.5 for each opportunity per criterion and −0.5 for each threat per criterion. The scale for SWOT scorecard has nine levels, from 2 to −2.
2.5. Mathematically Described SWOT Scorecard Calculation Procedure
MCDM model evaluates alternatives in their capability to provide AE public goods using AE collective schemes. Descriptive evaluation of the capability to provide AE public goods using AE collective schemes is goal G of the model. MCDM model consists of x number of alternatives X. X have z number of attributes A and n number of criteria C, where x, z, and n > 1 and x, z, and n = {ℕ}. X, A, and C = qualitative variables, and A and C have influence on G. The MCDM model returns x number of G for x number of X.
SWOT analyses have SWOT factors such as strengths = S, weaknesses = W, opportunities = O, and threats = T. S and W describe internal factors, and O and T describe external factors of the AE collective scheme’s environment and its capability to provide AE public goods.
In this paper, importance of internal and external factors of SWOT analyses are proposed not to be the same. The SWOT scorecard sums the importance of S, W, O, and T factors for the C. The importance is described as the SWOT scorecard result or SS.
Each C in the MCDM model consists of qualitative data of S, W, O, or T factors; C
n = {S
n, W
n, O
n, T
n}. S consists of i number of qualitative variables s, W consists of j number of qualitative variables w, O consists of k number of qualitative variables o, and T consists of l number of qualitative variables t. i, j, k, and l ≥ 0, and i, j, k, and l = {ℕ}. With symbols decision rules for importance of S, W, O, and T factors are as follows:
Sn = If there exists a variable s that can improve G, S is valued as the number 1.
Wn = If there exists a variable w that can worsen G, W is valued as −1.
On = If there exists a variable o that can improve G, every o is valued as the number 0.5, and O is a product of the value 0.5 and k.
Tn = If there exists a variable t that can worsen G, every t is valued as the number −0.5, and T is a product of the values −0.5 and l.
With symbols
SS
n is a sum of importance of internal and external factors S
n, W
n, O
n, and T
n (see Formula (1)):
For each C, we have different results of SS depending on the input data of S, W, O, and T. This is how we obtain the results that are at the last step transformed into a three-level Likert scale (
Table 3).
2.6. Transcript of SWOT Scorecard to DEX Model Scale
SWOT scorecard and its numeric values had to be transformed to descriptive values to fit the DEX model scale that is qualitative and discrete [
38]. A nine-level Likert scale was used to explain the scorecard values from extremely low support of the environment (value −2 in the SWOT scorecard) to the extremely high support of the environment (value 2 in the SWOT scorecard). The Likert scale had to follow specific transformation rules to be used in DEX model scale for criteria. The DEX model works well when on the level of criteria and attributes there are small scales (up to three levels) [
41]. That is why the nine-level Likert scale had to be transformed to the three-level Likert scale.
Table 3 presents all transformation rules of numeric to descriptive values for SWOT scorecard to fit the DEX model.
The DEX model has three scales, one on the criteria level, one on the attributes level, and one on the goal level. The scale for criteria was mentioned above and evaluates a level of support from the environment for each factor (input data). The evaluation of attributes in the upper level of the DEX model analyses the potential synergy between criteria on the level of attribute. The scale for attributes consists of three descriptive levels: ‘good synergy between criteria’, ‘neutral synergy between criteria’, and ‘bad synergy between criteria’. The scale for the evaluation of the goal, however, should have more than three levels for the model to be sensitive enough to show the differences between the AE collective schemes [
42]. This is why the scale for the goal has nine levels, from ‘extremely good synergy between aspects in AE collective scheme’ to ‘extremely poor synergy between aspects in AE collective scheme’.
2.7. Decision Steps from SWOT Scorecard to MCDM
Decision steps from SWOT to MCDM are presented step by step. The SWOT scorecard technique consists of 4 steps (steps 2–4 and step 8); other steps are the procedure for the MCDM DEX model, with or without SWOT scorecard.
Step 0: Defining alternatives and collecting input data for the model (in our case, this is done through the SWOT analyses).
Step 1: Building hierarchical tree of criteria, attributes, and goals.
Step 2: Organizing descriptive SWOT results by criteria for every alternative, keeping track of the origin of data (S, W, O, and T factors). This step gives us a set of so called ‘prime input data’.
Step 3: SWOT scorecard technique: transforming ‘prime input data’ with a formula to numeric results.
Step 4: Transforming SWOT scorecard results to descriptive scale that can be used in DEX model. This gives us options of values of basic attributes and is the input data for the DEX model.
Step 5: Putting the input data into the DEX model.
Step 6: Defining utility functions to the intermediary attributes.
Step 7: Running the DEX model.
Step 8: Evaluating the outcomes. Either compare the alternatives or exchange knowledge between alternatives with the tracking of ‘prime input data’ information.
2.8. ‘If-Then’ Rules in DEX Model
The value of alternative characteristics in the DEXi program is mapped to the upper level with a system of ‘if-then’ rules, which were determined in the DEX model by individual decision-making approach, considering ordered scales and equal weights for all criteria and attributes.
Table 4 presents possible combinations of values of criteria per attribute and possible combinations of values of attributes per goal and ‘if-then’ rules for attributes and goals. In the table, the criteria value level ‘low support from the environment’ is abbreviated by the word ‘low’, the value level ‘neutral support from the environment’ is abbreviated by the word ‘neutral’, etc. The same corresponds to the naming of the attribute value levels.
4. Discussion
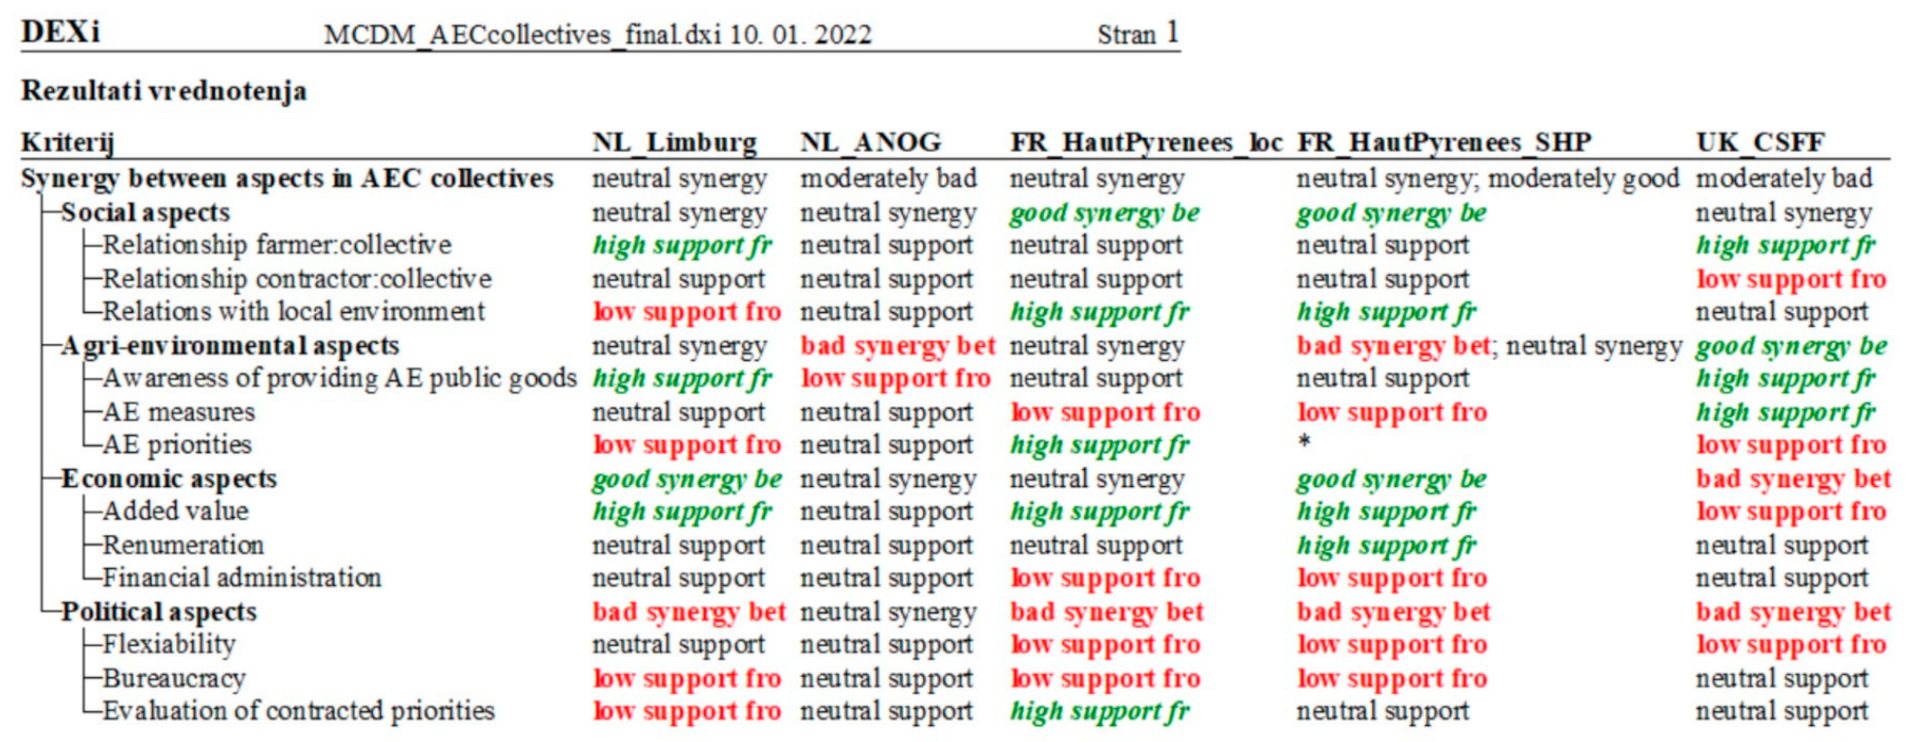
The DEX model illustrates that all alternatives have from moderately bad to neutral synergy between aspects in their AE collective scheme, which means it is placed in the middle of the evaluation scale. From
Table 4, it can be seen that each alternative could have one of these combinations of attribute values: (bad:neutral:neutral:neutral); (neutral:neutral:neutral:neutral); (bad:bad:neutral:good); (bad:bad:good:good); or (bad:neutral:neutral:good). The alternative NL_Limburg has a combination neutral:neutral:good:bad, NL_ANOG has a combination neutral:bad:neutral:neutral, FR_HautPyrenees_loc has a combination good:neutral:neutral:bad, FR_HautPyreness_SHP has a combination good:bad:good:bad, and UK:CSFF has a combination neutral:good:bad:bad. The first value represents social aspects, the second represents agri-environmental aspects, the third represents economic aspects, and the fourth represents political aspects.
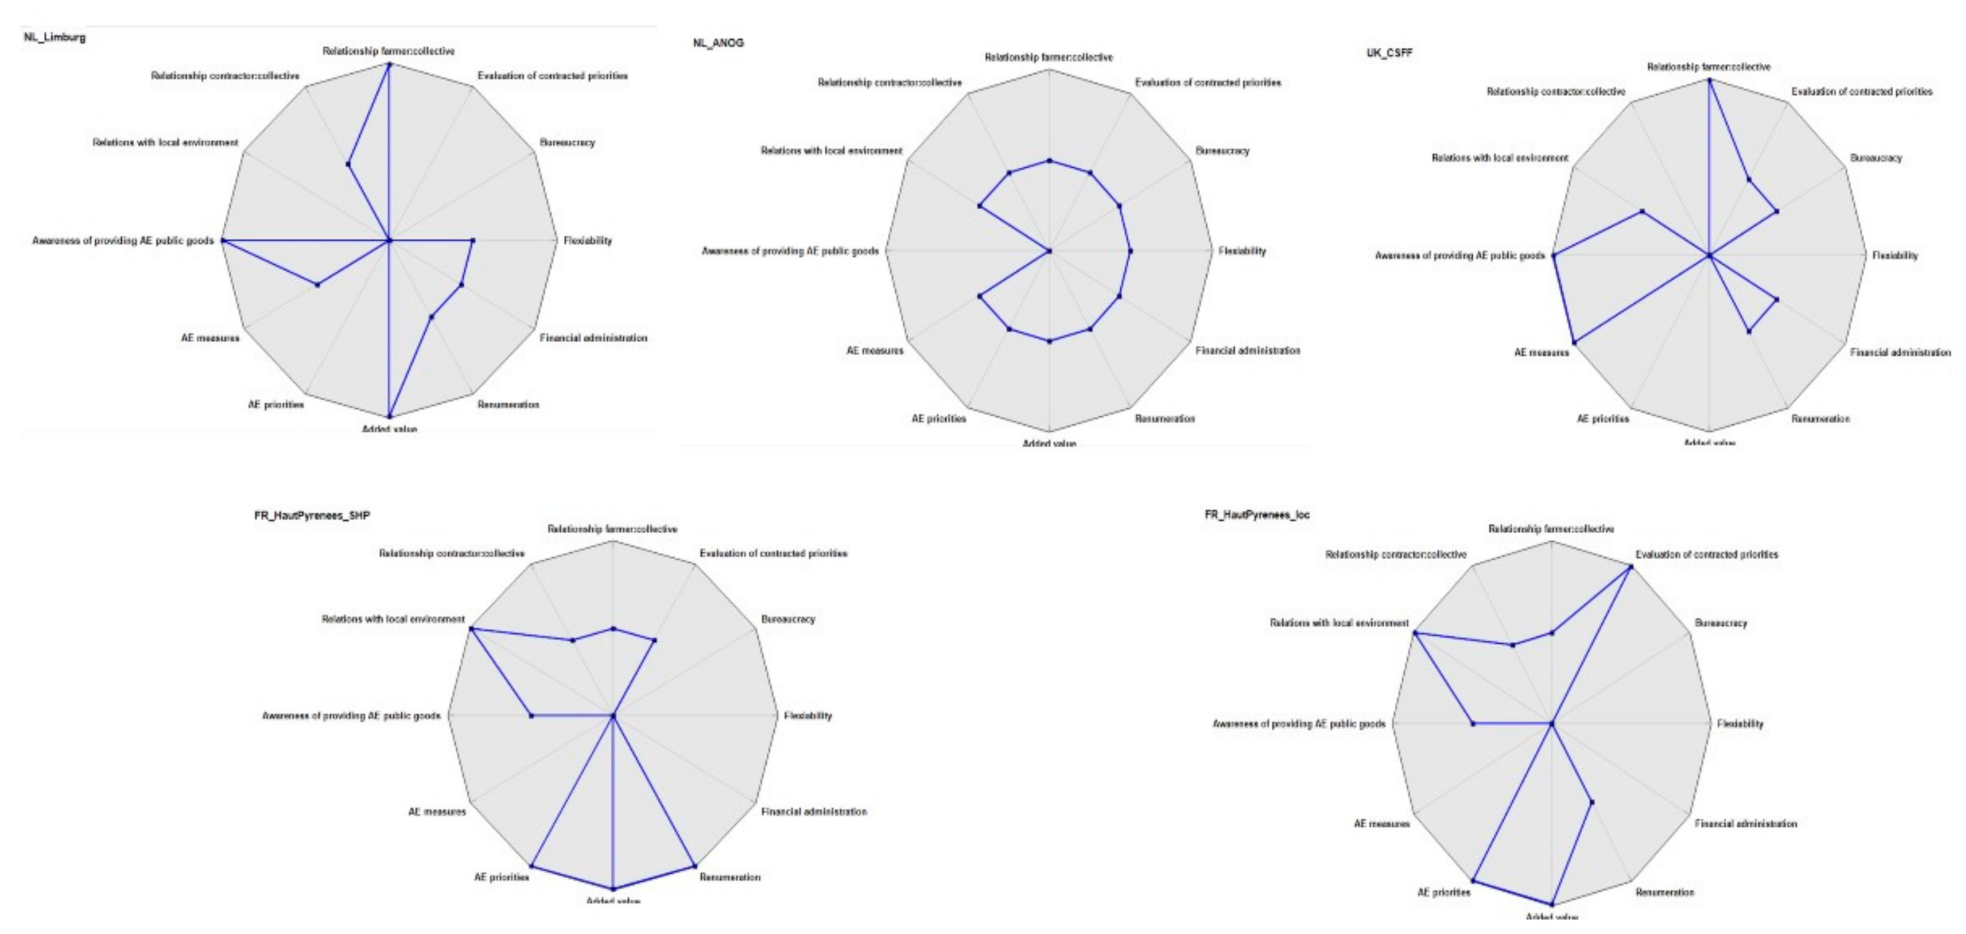
The DEX model demonstrates (see
Figure 2) that there is not a distinct difference between the alternatives in their capability to provide AE public goods: all alternatives have neutral to moderately bad synergy between aspects in AE collective schemes and have a similar capability to provide AE public goods. Their capability is neither bad nor good. However, the DEX model also illustrates that the alternatives are very diversified within themselves (see
Figure 3). They do have very different synergies between criteria and attributes and would need improvement and help in different fields. The model also suggests that the schemes would need to have very different strategic plans to perform better in their environment. Their strong and weak points to provide AE public goods are very different. The recommendations for improvement should be individually addressed, and the DEX model can help pinpoint the individual aspects and criteria that would need improvement. If a decision maker should use this model, it could be of great advantage to him or her to see exactly in which fields the AE collective scheme would need special attention and support. Through this model, a decision maker can, for example, search for the weakest points/fields and face the reality that their AE collective scheme needs special attention in the field of economic aspects. The model could evaluate the lowest values for every criterion in the field of economic aspects, as it is true for the alternative UK_CSFF. If that happens, the decision maker can easily refer to the original input data from the SWOT scorecard and compare the self-results with other collectives in the model.
For example, the same decision maker from UK_CSFF could see that the NL-Limburg case received good evaluation of economic aspects, good evaluation of the criteria added value, neutral evaluation for the criteria renumeration, and neutral evaluation for the criteria financial administration (see
Figure 2). In the SWOT scorecard, he or she would find the original nine-level scores for each criterion and alternative in the model accompanying the original data input. The decision maker would in this case see that the NL-Limburg data received very high scores (1,5) for the support from the environment for the financial added value criteria because the stakeholders in the SWOT analysis acknowledged that they recognize strengths in ‘cheaper, less overhead costs’ and ‘learning about environmentally friendly farming results in less external inputs for the farmer’; they also stated a realistic opportunity for ‘buying or developing machines together as a collective’. For a decision maker from UK_CSFF, this is valuable and exact information of what could improve its environment to better support the provision of AE public goods. Furthermore, this can also go the other way around: the SWOT scorecard and the original data input can show valuable information of bad practices and a non-supportive environment to the provision of AE public goods, information that a wise decision maker can turn to or be aware of when deciding on the next steps in the strategic plan.
This work is using the SWOT analysis result for two purposes. The first is to define the criteria by using a bottom-up approach, which is not new and is very well described [
43]. The second is to use several SWOT analysis results as direct and non-censured input data for the MCDM model by transforming them to numeric values and calculating the sum of importance of internal and external factors that describe criteria using the SWOT scorecard technique introduced here. This part of the approach cannot be truly compared to other approaches because it aims to use several SWOT analyses that simultaneously analyse extremely diversified environments, and this has not been tried before. However, disadvantages in certain steps of transforming the SWOT scorecard to a descriptive scale, both from the practitioner and academic point of view, have been noticed. Here, the proposed SWOT scorecard technique allows for the transformation of descriptive values to a common mathematical language—to numeric values. The results of several SWOT analyses can be compared simultaneously by their difference in the sum of importance of internal and external factors that describe criteria. In the next steps, other manipulation procedures such as the evaluation processes of the MCDM models can begin. This technique is applicable when only SWOT analyses are available as a prime source of information and when we want to set new strategies for new schemes and want to learn from our own past and competitor experiences.
The possible practical disadvantage of this method is that we do not know how it is applicable when we have different sources of information. Would it be possible to join the results of the SWOT scorecard with other types of input data? If this is not the case, then this approach is suitable only at the beginning phases of understanding how diversified systems approach a common goal and to set the first strategic decisions. Practitioners could see this as unpleasant because new types of comparable data will eventually appear, as will the need to evaluate the progress of AE collective schemes and to adjust strategies. Here, other solutions, such as the SWOT-fuzzy goal programming that Khan introduced, could help; however, his approach involves many experts at several decision steps, which, from the practitioner point of view, is unfriendly and time and money consuming [
35]. The progress of this SWOT scorecard-DEX model should go in the direction of finding easily applicable and non-time-consuming integration of both types of data, qualitative and quantitative, in the first steps of transforming prime input data to fit the DEX model.
The other important disadvantage that we acknowledge is the difficulty in entering and transforming the data into the SWOT scorecard and then putting the results into DEXi. This should be done simultaneously with the use of a friendly interface if we want to develop an applicable less time-consuming DSS tool.
There is also one other disadvantage of the approach that is more methodological and concerns academic circles. We have not found any studies that would try to measure the importance of factors solely without their connections. Sometimes the SWOT matrix is introduced that measures connections between S–O, W–O, S–T, and W–T factors [
35], where the relative importance of the SWOT factor is determined through a pair-wise comparison within and between SWOT groups, and the importance degree of the SWOT factors is computed based on the comparison matrix. This gives a set of possible strategies for one organization. In another case, a Quantified SWOT method is used that is developed based on the Grand Strategy Matrix [
44]. This method allows enterprises not only to realize their position in the competition but also to have a reference for developing strategies. However, both these methods do not keep track of the original information, and decision makers cannot learn from other experiences. They also do not provide a solution for simultaneously comparing several SWOT analyses, nor do these methods link all the factors together to see how they affect one another according to corresponding criteria. The sum of importance of factors that the SWOT scorecard measures gives a unique way of explaining the meaning of S, W, O, and T by its corresponding criteria. However, the decision rules of the SWOT scorecard were made arbitrary. Because of this, we cannot check if the assumptions made in the decision rules are correct. It is merely an assumption that the external factors are half as important than the internal factors if only one such fact is acknowledged. Additionally, if more than one fact is acknowledged for external factors that describe the same criteria, then the value multiplies by the number of facts acknowledged. SWOT analyses generally are criticized on the basis that SWOT factors are not prioritized by their significance; thus, this may result in an improper strategic action [
45]. One solution here could be to introduce the Importance-Performance Analysis (IPA), a technique for measuring customers’ satisfaction from customer satisfaction surveys [
46], to systematically generate prioritized SWOT factors based on customers’ perspectives. This in turn produces more accurate information for strategic planning. Specifically, strengths and weaknesses of the organization are identified through an IPA matrix which is constructed based on an organization’s performance and the organization’s importance. Opportunities and threats are obtained by comparing the IPA matrix of the organization with that of its competitor. This solution is also possible to perform on different AE collective schemes and to assign more accurate importance values to SWOT scorecard decision rules.
It should be noted that we have specific circumstances that disable the direct application of any of other approaches such as the Quantified SWOT analytical method [
32], SWOT-SMART [
33], AHP-SWOT-fuzzy TOP-SIS [
9,
34], or SWOT-fuzzy goal programming [
35], so we were forced to develop the described approach to fit our specific situation. Altogether, we can list three major advantages of the proposed approach that use SWOT analysis as unorganized qualitative data collection for the MCDM model, by introducing three major disadvantages found in the previously noted approaches [
9,
32,
33,
35]:
- (1)
The MCDM on other approaches analyses only one environment at a time using only one SWOT analysis for one MCDM, and this is insufficient for our specific circumstances.
- (2)
Advantage of the proposed approach: It enables several SWOT analyses to be simultaneously introduced into a SWOT scorecard table, so the platform is established to compare different environments that describe the same MCDM goal. The proposed approach does not have a limitation on the number of SWOT analyses that can be compared simultaneously.
- (3)
In other approaches, the criteria for the MCDM can differ in accordance with the environment that describes the MCDM problem, so the MCDM cannot compare different environments, even if they describe the same MCDM goal.
- (4)
Advantage of the proposed approach: It solves this issue with the use of the SWOT scorecard technique that unifies diverse SWOT analyses firstly into the same criteria factors, using the bottom-up approach and finding the convergence points that can be described with the same name. These names should be common denominators of criteria factors for all SWOT analyses that are used in the MCDM.
- (5)
Other approaches do not envisage multiple uses with a unified method that can translate qualitative to quantitative values and enable analysing different environments in the provision of the same MCDM goal, which is exactly the opposite of what we need in our situation.
The advantage of the proposed approach: The unified method to translate qualitative to quantitative values is introduced that evaluates unorganized qualitative data collection of several SWOT analyses with the same perspective. As a result, the SWOT scorecard table of quantitative values is established, which can be described with the use of a Likert scale and enables comparing diverse environments simultaneously.
Notwithstanding these advantages of the proposed approach, this approach is a work in progress and has been established for a specific purpose. Currently, our priority is to establish a functioning MCDM model that will provide decision support to emerging new AE collective schemes.
We are aware of all methodological dilemmas and issues. We plan to address them in the continuation of the project.


