Abstract
One of the primary causes of additional losses in dry-type distribution transformers is harmonic disturbances in the distribution network. It is critical to investigate the change law of trans-former losses under harmonic conditions. The effect of harmonics on transformer core losses and winding losses is first investigated in this paper. The field-circuit coupling method is then used to create a finite element model of a three-phase phase dry type distribution transformer. Finally, the relationship between core loss and harmonic voltage, winding loss and harmonic current is calculated and analyzed for each harmonic frequency. The AC resistance factor model is found to be more accurate than the conventional model in calculating transformer harmonic winding losses. This paper’s findings have significant theoretical implications for the analysis of harmonic losses and loss reduction in distribution networks.
1. Introduction
The transformer is an important piece of transmission and distribution equipment in the power system, and there is a significant amount of loss. Transformer losses account for approximately 8% of total power generation capacity in China’s power grids. Dry type distribution transformer losses account for 60% to 80% of total distribution network losses [,,]. The efficiency of the transformer is directly related to the efficiency of the grid’s power conversion and is an important economic indicator for electrical energy transmission. The power characteristics of distributed power generation and the diversity of loads in the new type of distribution network can cause power quality pollution in the distribution network, such as harmonics, three-phase voltage imbalance, voltage fluctuations, and flicker. Distributed power generation degrades distribution network power quality and increases distribution network losses []. As a result, an in-depth examination of transformer loss calculation under power quality disturbance is extremely useful in reducing network losses and optimizing distribution network structure. The abbreviations involved in this paper are shown in Table 1.

Table 1.
An explanation of the parameters and variables used in this paper.
The equivalent model method, the parametric method, and the harmonic factor method are the three main analytical methods for calculating transformer harmonic losses. This paper [] compares six commonly used transformer harmonic equivalent models and validates the applicability of the currently used transformer harmonic simplification models. In the literature [], a transformer harmonic loss model based on circuit theory was developed to derive a formula for calculating transformer harmonic loss. However, the harmonic winding resistance model in this model has errors at high frequency harmonics. In the IEEE Std C57.110 standard [] the correction method for eddy current losses and additional losses in transformer windings under harmonics is proposed. In this standard the concept of harmonic lead-in is introduced, but harmonic winding ohmic losses are not corrected. In the literature [], the concept of AC resistance factor is proposed for improving the harmonic winding AC resistance formula, the accuracy of which is yet to be verified.
Numerical models are frequently used to solve such problems in order to obtain an accurate model for calculating transformer losses under harmonic conditions. In terms of the means and accuracy with which the problem can be solved, the numerical method outperforms the analytical method. Because of its high computational accuracy and ability to adapt to various complex shapes, the finite element method has become a proven analytical tool in engineering. Several researchers used the finite element method of field-path coupling to model the two-dimensional structure of the transformers used. In the literature [,], researchers have analysed the leakage field distribution and the influence of harmonic currents on harmonic losses. The Finite element analysis software ANSYS was used to build a simplified two-dimensional simulation model of the leakage field of the transformer, but the two-dimensional model simulation is subject to some errors with respect to the actual operating conditions []. A 3D simulation model of the transformer electric-magnetic-structural force field was established in [], which basically matched the simulation results with the test data to verify the effectiveness of the 3 D finite element method. The Steinmetz model was used in [] to investigate the magnetic loss characteristics of transformers. The effect of harmonic characteristic quantities on the core loss characteristics was investigated using the generalised Steinmeth model, and the simulation results demonstrated that the method has a high degree of computational accuracy. Furthermore, using the field-circuit coupling method and a finite element model, the loss characteristics of a high-voltage DC converter transformer, a filter transformer, a harmonic filter distribution transformer, and a high-speed permanent magnet generator were simulated. The method’s validity was established [,,,,,,]. Kamran Dawood et al. [] proposed a method for determining the leakage impedance in the tap winding using finite elements. For all cases, the difference between the finite element models and the experimental short-circuit test was less than 1%. A design method for economical, low harmonic loss distribution transformers is presented in the paper []. Yazdani-Asrami et al. [] used the finite element method (FEM) to simulate and analyze the effect of non-sinusoidal voltages on distribution transformer no-load losses. The simulation results show that increasing the THD of distorted voltage will significantly increase the transformer’s no-load loss. In literature [], an analytical algorithm for calculating the hysteresis losses of three-phase HTS transformer windings in the presence of harmonic loads is presented and the results show that this algorithm is highly accurate. Susnjic et al. [] used 3D FE analysis to calculate eddy current losses in power transformers generated in yoke ply-wood and unshielded tank walls. A numerical study of copper losses in three-phase transformers with different geometrical designs was carried out using the finite element method by Chiu et al. []. The results show that the eddy currents in the windings cause additional losses. The non-sinusoidal AC losses of coils have been studied using the finite element method by M. Yazdani–Asrami et al. []. The results of the study have important implications for the design of HTS transformers and HTS power cables.
The effect of harmonic voltage and harmonic current on the iron and copper losses of transformers is investigated in this paper. An analytical calculation model for transformer iron and copper losses under harmonic action is developed. A three-phase 10 kV transformer model is created using a field-circuit coupled model and a finite element simulation model to calculate transformer core and winding losses, and the effects of harmonic voltages and currents are quantified.
2. Transformer Loss Model
The losses in transformers can be divided into: iron losses, copper losses, dielectric losses and miscellaneous losses. In this paper the losses in the transformer core and windings under harmonic action are discussed. According to the Steinmetz empirical formula and the IEEE Std C57.110 standard, the total losses of a transformer can be expressed as the sum of the transformer no-load core losses and the load winding losses, as shown in Equation (1).
where PTL is the total theoretical loss of transformer, including no-load core loss PNL and PLL. f is the current frequency. Bm is the silicon core working flux density amplitude. n is hysteresis coefficient which equals to 2~2.5. t is silicon wafer thickness. k1 and k2 depend on the characteristics of silicon steel, which can be obtained from experiments []. G is the core mass. is the unit core magnetic loss. is the unit core vortex loss. pF is core additional loss and its’ proportion is relatively small. PEC is the transformer winding resistance loss and POSL is the additional loss caused by winding skin effect and adjacent effect.
2.1. Transformer Core Harmonic Loss
According to Equation (1), the unit core loss part of the transformer can be characterized as:
where, k1 and k2 can be characterized by the core hysteloss coefficient Kh and the core vortex loss coefficient Kc, respectively, which are only dependent on the core material. n is the hysteresis coefficient, generally taken as 2, unit additional core loss.
Because:
where, Em is the induced motive potential amplitude of transformer, which is positively correlated with the primary side voltage of the transformer. N is winding turns. A is effective cross-sectional area of the transformer core.
The unit core loss of a transformer under single harmonics can be calculated according to the following formula []:
Then, the unit core loss of the transformer under multiple harmonics can be carried out as []:
According to Equation (5), the transformer core hysteresis loss increases with the increase of the primary harmonic voltage content and decrease with the increase of the harmonic frequency. The vortex loss also increases with the primary harmonic voltage content. As the additional losses are relatively small and do not affect the trend of no-load losses with frequency, they are treated as constant values that do not vary with frequency in the theoretical calculations in this paper.
2.2. The Winding Harmonic Loss
The T-type equivalent model is often used to simulate the transformer working principle when analyzing the transformer winding harmonic loss, and the transformer harmonic winding resistance is usually equivalent to Rdc (h is the harmonic order, Rdc is the winding DC resistance) in order to calculate the transformer winding resistance loss and vortex loss . The external power supply can be regarded as the superposition of independent sources of different harmonic components when calculating the transformer loss by using T-type equivalent model, as shown in Figure 1.
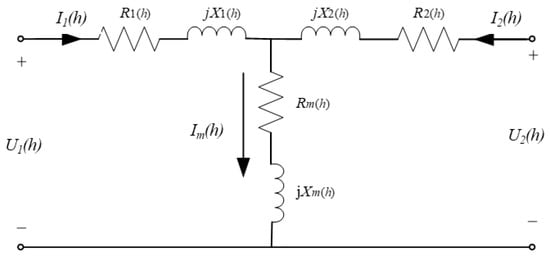
Figure 1.
A T-type equivalent circuit model.
In Figure 1, h is the harmonic order and I1(h) is the primary side harmonic current. I2(h) is the harmonic current on the secondary side of the transformer. R1(h) and X1(h) are the transformer primary side winding resistance and leakage resistance under the h-th harmonic action. R2(h) and X2(h) are the resistance and reactance of the secondary side winding of the transformer under the h-th harmonic. Rm(h) and Xm(h) are the excitation impedance and excitation resistance of the transformer under the h-th harmonic.
When using the T-transformer equivalent loss model equivalent circuit, R(h) is calculated using Rdc for equivalence. Harmonic reactance is a quantity proportional to frequency, so it is easy to obtain jX(h) = jhX(1). The active power loss of the transformer primary side harmonic winding can be calculated as:
Similarly, the active power loss of the secondary side harmonic winding is:
where, N1 and N2 are the number of primary and secondary turns of the transformer respectively. k is the ratio of turns. Then the calculation relation of harmonic winding loss of three-phase transformer is as follows:
Equations (6) and (9) shows that when the harmonic voltage acts on the transformer the excitation reactance of the transformer increases, so the current value value is very small. Therefore this item can be neglected. The harmonic current produces harmonic losses directly in the winding resistance, which increases the winding losses. Therefore, the transformer harmonic winding losses are mainly related to the harmonic current.
However, the Rdc model does not consider the loss resulting from the winding skin effect and the proximity effect on the winding resistance. The AC resistance coefficient model was proposed in [] to accurately express the transformer harmonic winding loss.
where, R(h) is the h-th harmonic winding AC resistance, and Rdc is the winding DC resistance. is the skin effect depth of the h-th harmonic winding. Σ and μ are the electrical conductivity and magnetic conductivity of the copper wire, respectively. p is the number of winding layers. D is the thickness of each silicon steel sheet and ωh is the angular frequency of the h-th harmonic.
Then, the modified three-phase transformer is as follows:
An actual 630 kVA transformer is used as an example []. The transformer has a winding layer of 36, a silicon steel sheet thickness of 1.2 mm and a transformer winding DC resistance of 0.91 Ω. The resistive frequency characteristics of the transformer’s harmonic winding model are shown in Figure 2.
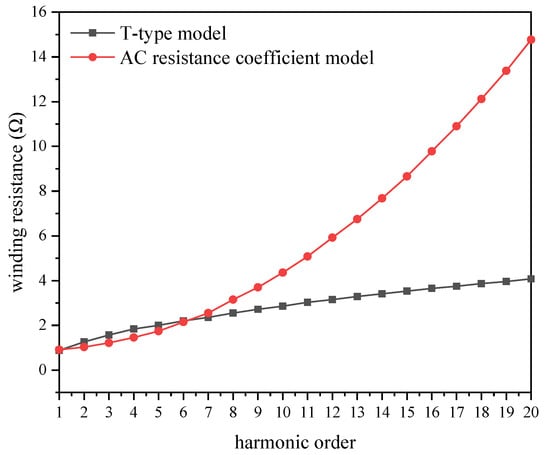
Figure 2.
Winding harmonic resistance characteristics.
When the harmonic frequencies are very low, the angular frequency values of the harmonics are very low. From equations and , the value of is very small. Therefore the value of is negligible. The h-th harmonic winding AC resistance R(h) is very close to Rdc. At low frequencies the skin effect and the proximity effect on the AC resistance are negligible, so it can be seen from 2 that the two resistance models are a good fit at this time. However, as the frequency increases, the value of increases very significantly. Rdc more slowly as the frequency increases. The effect of the skin effect and the proximity effect caused by the leakage field on the harmonic resistance of the winding becomes progressively greater, and the size of the harmonic resistance of the winding as characterised by the two models appears to vary considerably. It is easy to see from Equation (12) that the two models will produce a large difference in the calculation of the transformer’s harmonic current winding losses.
3. The Field-Circuit Coupling Model
In order to analyze the accuracy of the transformer model described above, the field-road coupling theory is applied to establish the transformer finite element model and solve the transformer loss by numerical method. Vector magnetic position A and scalar potential Φ are introduced to the Maxwell equations to form independent electric field and magnetic field partial differential equations:
Taking the equation into the Maxwell equations yields the independent magnetic field and electric field partial differential equations:
Matrix form of the field control equations for in 3 D transient field-circuit coupling calculation is shown in Equation (15) [].
where, A is vector magnetic position. is source current density. is reluctivity.
The calculation of can be based on the following formula:
where, N is number of turns of winding. S is the cross section of the winding. h is unit vector along the coil tangent direction.
The equivalent model by coupling calculation of the circuit and the electromagnetic field is shown in Figure 3. Re characterizes the core vortex loss, and the hysteresis loop characterizes the hysteresis loss generated during the change of the core magnetic field.
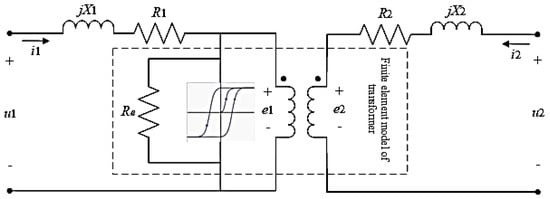
Figure 3.
An equivalent circuit diagram of the field−coupling model.
The circuit control equation is:
where, Ω is the core area of three-phase transformer.
By solving the differential equation of Equations (15)–(19), the field-circuit coupling calculation of the three-dimensional model can be realized.
4. Simulation and Discussion
The three-dimensional transformer core and winding finite element model is established based on the SCB10-630/10 step-down dry-type transformer commonly used in the distribution network to simulate and calculate the internal electromagnetic process of the transformer. An external circuit is set up to implement the calculation of the coupling between the circuit and the magnetic field. The model does not take into account the losses in the pull plates, clamps and leads. It is also assumed that the dry type distribution transformer consists of the core, yoke, high and low voltage windings, insulating resin and surrounding air.
A schematic diagram of the transformer is shown in Figure 4.
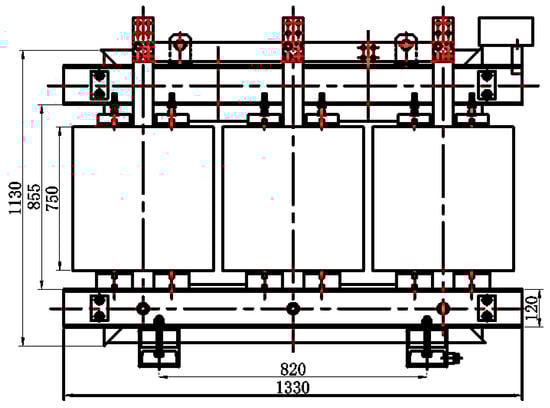
Figure 4.
A schematic diagram of a 630/10 transformer (unit: mm).
To obtain the transformer parameters, a three-dimensional finite element model of the transformer is established based on the transformer data (Table 2). To ensure that the transformer leakage field is included in the simulation, the simulation space boundary exceeds 50% of the transformer’s 3D model. Each simulation’s finite element values do not exceed 5% of the actual values. The simulation step size is set to one-twentieth of the excitation source period, and the simulation stop time is set to ensure that all parameters converge.
Table 2.
The transformer parameters.
Figure 5 shows the 3D finite element simulation model of the transformer, and Table 2 shows the transformer parameters.
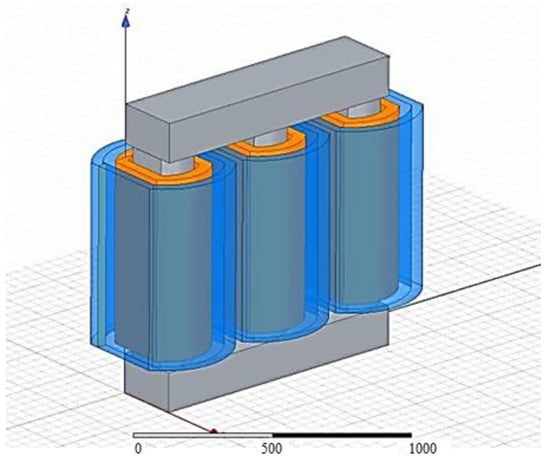
Figure 5.
A 3D finite element model of the transformer (unit: mm).
The finite element model is a more idealised approximate model. Because the no-load loss of the model only considers the core eddy current loss and hysteresis loss, and ignores the silicon steel sheet interlayer loss. There are some errors with the actual transformer nameplate losses, but the short-circuit impedance is close to the real transformer. Therefore, the simulation results of the model have some reference value.
4.1. Transformer No-Load Loss Analysis
Simulated no-load tests are carried out on a finite element transformer model using a field-circuit coupled model, and no-load test simulation results are obtained. The secondary side of the transformer is disconnected and the primary side of the transformer is added to inject the fundamental rated voltage and the 5th harmonic respectively. The time domain waveforms of the fundamental no-load loss and 5th harmonic no-load loss of the transformer obtained from the simulation are shown in Figure 6.
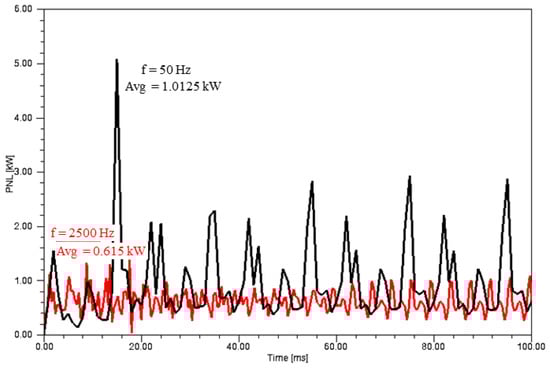
Figure 6.
The time domain waveform plot of transformer no-load loss.
From Figure 6, the average value of the 5th harmonic no-load loss is less than that of the fundamental no-load loss, which is in accordance with the analysis result in Section 2.1. Since the no-load loss is mainly the core loss, the transformer core loss density distribution map obtained according to the field-circuit coupling method simulation is shown in Figure 7.
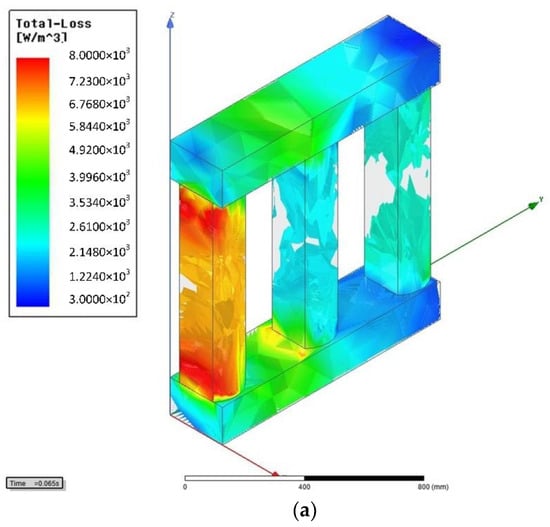
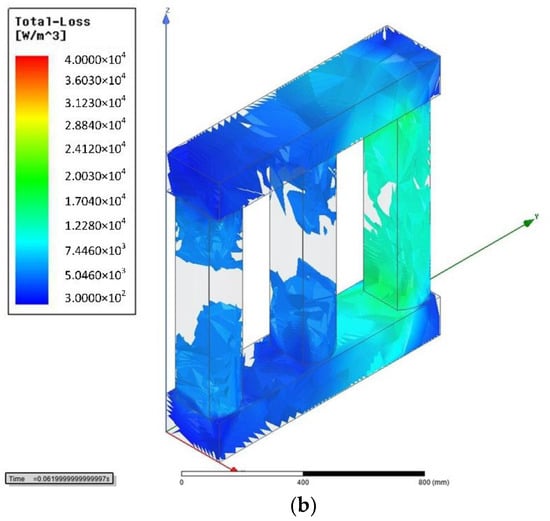
Figure 7.
(a) Fundamental harmonic core loss density distribution map; (b) 5th harmonic core loss density distribution. Transformer no-load loss density distribution.
Figure 7a shows the fundamental harmonic core loss density distribution map and 7b shows the 5th harmonic core loss density distribution, respectively. It can be seen that when one transformer phase is at the peak voltage, the loss density of the transformer core acting under the fundamental harmonic voltage is greater than that of under 5th harmonic.
By varying the frequency of harmonics, the average core loss under the 5th, 7th, 11th, 13th, 17th, and 19th harmonic obtained by the field-circuit coupling method are shown in Table 3. The hysteresis loss and eddy current loss in Table 3 are plotted and are shown in Figure 8.
Table 3.
The average core loss under harmonic voltage (kW).
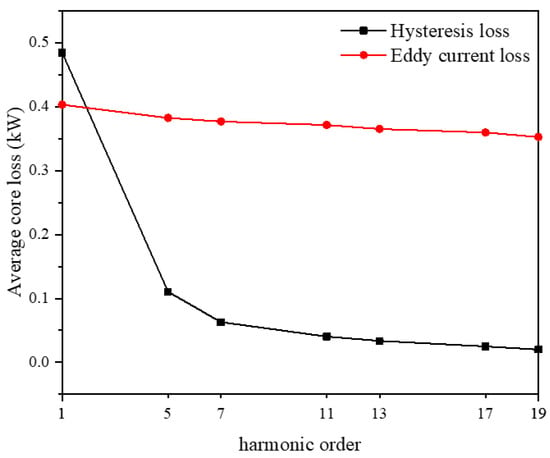
Figure 8.
The core loss harmonic.
Figure 8 shows that the simulated core hysteresis loss decreases as the no-load voltage frequency increases, while the core eddy current loss varies only slightly with frequency. The movement of the magnetic do-mains in the core material causes hysteresis losses in the core. The core hysteresis losses from the 5th, 7th, 11th, 13th, 17th, and 19th harmonics are all smaller than the fundamental core hysteresis losses, as shown in Figure 8. The hysteresis loss decreases as the frequency of the no-load voltage increases, demonstrating that the losses caused by magnetic domain movement are inversely proportional to the frequency of change of the magnetic field inside the transformer core. The core eddy current losses are mainly dependent on the magnitude of the induced electric potential, which varies very little with frequency.
Equation (5) is used to calculate the theoretical transformer core loss and is compared to the simulated value as shown in Table 4 and Figure 9.
Table 4.
A comparison of calculated and simulated results at no load and errors. (Absolute values).
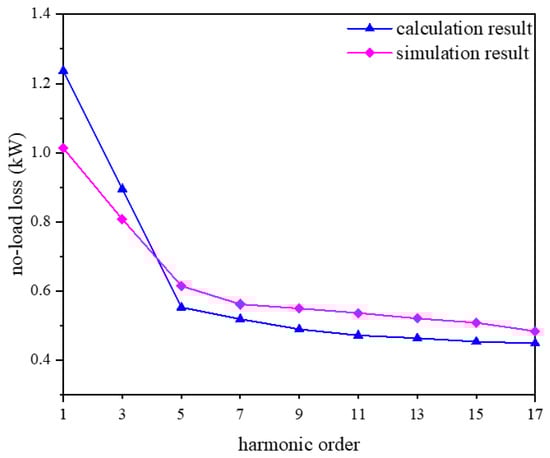
Figure 9.
A no-load loss simulation and calculation value comparison.
The comparison between the calculated values and the simulation results in Figure 9 shows that the results of Equation (5) are consistent with the trend of the simulation results. The error is mainly due to the inaccurate calculation of the additional losses. The reasonableness of Equation (5) is verified.
4.2. Transformer Load Loss Analysis
Transformer load losses are mainly those generated by transformer windings. The first and second side currents of the transformer are maintained at the rated current, and the distribution of the transformer winding losses under the fundamental wave and the harmonic current is simulated, and the result is shown in Figure 10.
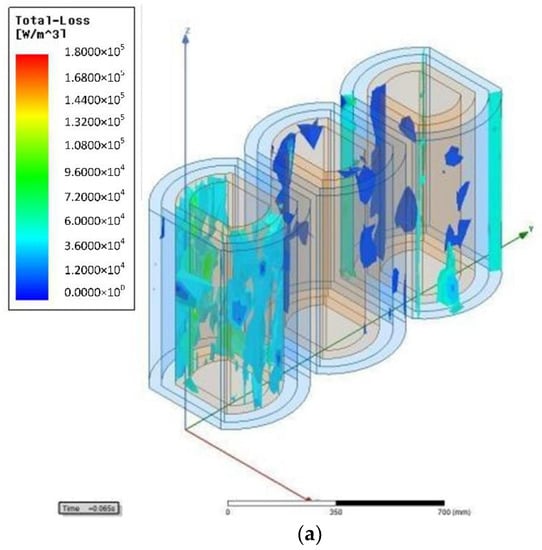
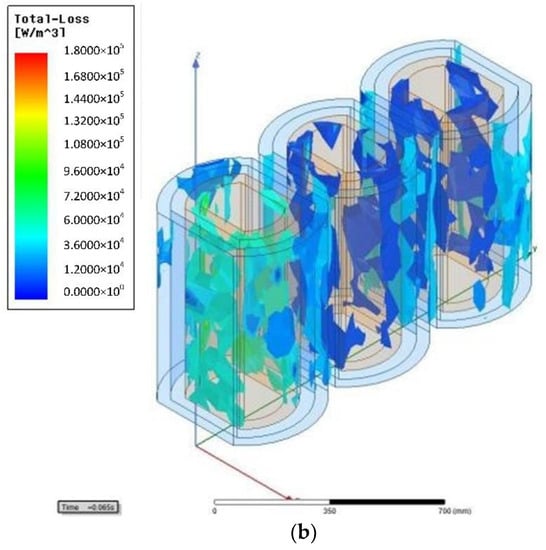
Figure 10.
(a) Fundamental wave winding loss density distribution; (b) 5th harmonic winding loss density distribution. Transformer load loss density distribution.
It can be seen that when the transformer is at peak voltage in the same phase, the loss density of the transformer winding produced under the fundamental wave is less than the loss density under the 5th harmonic current. This means that harmonic currents can increase the loss value of the transformer windings.
According to the allowable values of harmonic currents specified in GB/T 14549-1993, harmonic currents with contents of 5%, 7% and 9% are injected into the primary side of the transformer respectively. The average values of the transformer harmonic winding losses for the 5th, 7th, 11th, 13th, 17th and 19th transformers without and after taking into account the skin effect are obtained by the field-coupling method respectively as shown in the Table 5 and Table 6.
Table 5.
The average value of winding losses with different harmonic content (kW) (before considering the skin effect).
Table 6.
The average value of winding losses with different harmonic content (kW) (after considering the skin effect).
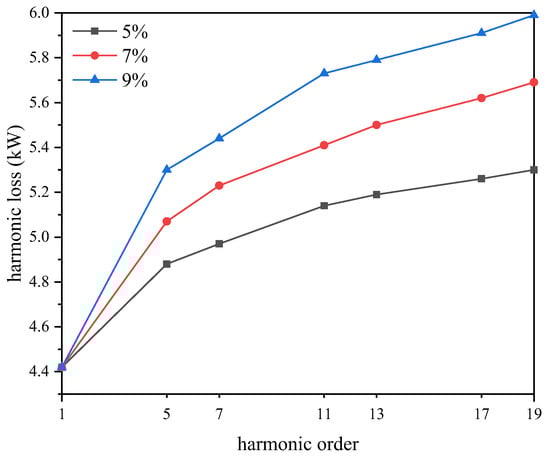
Figure 11.
Winding loss under harmonic (cell splitting).
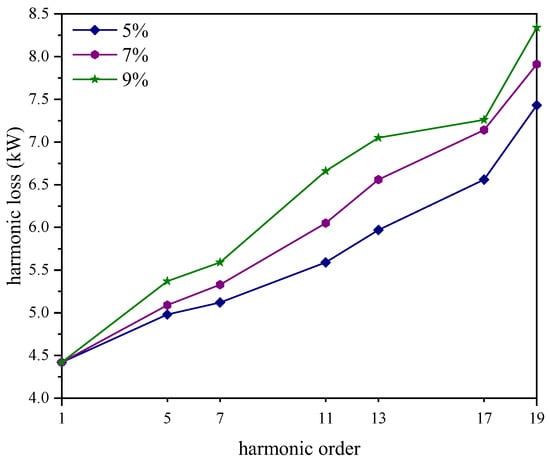
Figure 12.
Winding loss under harmonic (skin depth profiling).
Figure 11 and Figure 12 show that the higher the content of harmonic currents in the transformer winding, the greater the value of harmonic losses. At the same time, the harmonic loss value grows in proportion to the number of harmonics. When the skin effect is taken into account for the same harmonic current content, the losses of each harmonic are higher than when it is not. The skin effect on winding in the harmonic case is taken into account in the model shown in Figure 12. The skin effect losses are also accounted for in the winding losses, so the higher values are reasonable.
Figure 11 shows that the harmonic characteristics of the simulated winding losses are consistent with the harmonic resistance characteristics of the Rdc model in Figure 2 when the skin effect is ignored. The harmonic characteristics of the winding losses obtained after accounting for the skinning depth of δh are consistent with the harmonic characteristics of the AC resistance factor of Figure 2, as shown in Figure 12.
The winding losses at 5% harmonic current content are calculated using the two models separately and compared with the simulated values after the skinning effect is added to obtain Figure 13.
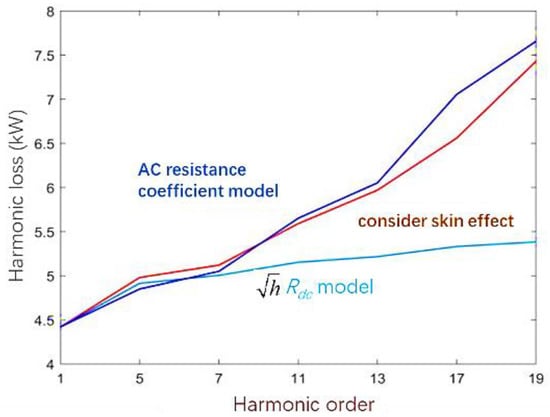
Figure 13.
Winding loss simulation and calculation value comparison.
Figure 13 shows that after accounting for the skin effect on winding losses, harmonic additional losses increase with the number of harmonics. At the same time, the higher harmonic additional losses significantly increase. The finite element simulation results fit well with the calculated values of the high harmonic winding losses after the AC resistance factor correction, with small errors.
Table 7 displays the error results. Except for the 17th harmonic, the absolute value of error for the AC resistance factor model is less than 5%, whereas the Rdc model exceeds 25% as the number of harmonics increases. In calculating higher harmonic losses in transformer windings, the AC resistance coefficient model is thus more accurate than the conventional model.
Table 7.
The error between calculated and simulated values of harmonic losses for different models (absolute values).
5. Conclusions
Based on the field-circuit coupling method, a three-dimensional model of a three-phase coherent distribution transformer is established in this paper. The harmonic loss change law of the transformer is simulated and analyzed by using the finite element method. The following conclusions are obtained:
- (1)
- As the voltage frequency increases, the hysteresis loss of the core of the three-phase coherent distribution trans-former decreases. As a result, when eliminating the line harmonic voltage in the transformer’s long-term no-load or light-load distribution line, the low harmonic voltage should be prioritized.
- (2)
- By the finite element method of field-path coupling, the AC resistance coefficient model is more accurate than the conventional harmonic winding resistance model Rdc when calculating the high harmonic resistance of the winding of a three-phase dry-type distribution transformer due to skin and proximity effects. By using the AC resistance factor model, the accuracy of the calculation of high harmonic losses in transformer windings can be significantly improved. The errors in the 7th, 11th, 13th, 17th and 19th harmonic losses calculated using the AC resistance coefficient model are reduced by 31%, 87%, 91%, 61% and 89% respectively compared to the Rdc model.
- (3)
- Harmonic additional winding losses increase as harmonic currents increase. The more harmonic currents there are, the greater the harmonic additional losses. The extra losses are most noticeable at higher harmonic currents. Higher harmonic currents should be monitored more closely in distribution lines where transformers are heavily loaded or overloaded in order to reduce harmonic load losses in the transformer.
A partial simplification of the transformer model has been made when using finite element simulation. For example, the losses in the pull plates, clips and leads are ignored. Further deepening and extension studies will be carried out in future work.
Author Contributions
Conceptualization, X.M. and R.J.; methodology, X.M.; software, X.M.; validation, X.M., R.J. and C.L.; formal analysis, C.L.; investigation, X.D.; resources, X.M.; data curation, H.D.; writing—original draft preparation, X.M.; writing—review and editing, H.D. and M.D.; visualization, M.D.; supervision, H.D.; project administration, X.D.; funding acquisition, X.M. All authors have read and agreed to the published version of the manuscript.
Funding
This research was funded by [Laboratory research project of State Grid Co., Ltd; Gansu Youth Science and technology program] grant number [21JR7RA745].
Institutional Review Board Statement
Not applicable.
Informed Consent Statement
Not applicable.
Data Availability Statement
Not applicable.
Conflicts of Interest
The authors declare no conflict of interest.
References
- Chiu, H.-C.; Pao, H.-K.; Hsieh, R.-H.; Chiu, Y.-J.; Jang, J.-H. Estimation of the eddy current losses in a dry-type 3000 KVA transformer with machine learning. Energy Rep. 2020, 6, 447–451. [Google Scholar] [CrossRef]
- Attar, M.; Tezcan, S.S. Design and Cost Analysis of Two Different Types of 400 kVA Distribution Transformers. In Proceedings of the 13th International Conference on Electronics, Computers and Artificial Intelligence, ECAI 2021, Pitesti, Romania, 1–3 July 2021. [Google Scholar] [CrossRef]
- Liu, C.; Yang, R. Calculation and analysis of transformer’s harmonic loss. Power Syst. Prot. Control 2008, 36, 33–36. [Google Scholar]
- Qionglin, L.; Shuming, L.; Jiajing, W. Calculation model of 10 kV distribution network loss considering power quality impact and its experimental verification. Electr. Power Autom. Equip. 2022, 42, 212–220. [Google Scholar]
- Fang, S.L.; Li, J.H.; Huang, Y.; Qiu, W.; Sang, H.S. Research and Evaluation of the Transformer Harmonic Model. Proc. CSU-EPSA 2013, 25, 103–108. [Google Scholar]
- Zhang, Z.L.; Wang, K.; Li, D.W.; Zhou, J.; Wu, X.H.; Huang, S.; Tang, J. Transformer harmonic loss calculation and influence factor analysis. Power Syst. Prot. Control. 2011, 39, 68–78. [Google Scholar]
- IEEE. IEEE Recommended Practice for Establishing Liquid-Immersed and Dry-Type Power and Distribution Transformer Capability When Supplying Nonsinusoidal Load Currents: IEEE Std C57.110™-2018; Revision of IEEE Std C57.110-2008; IEEE: New York, NY, USA, 2018; pp. 1–68. [Google Scholar]
- Hurley, W.; Gath, E.; Breslin, J. Optimizing the AC resistance of multilayer transformer windings with arbitrary current waveforms. IEEE Trans. Power Electron. 2000, 15, 369–376. [Google Scholar] [CrossRef]
- Thango, B.A.; Jordaan, J.A.; Nnachi, A.F. Analysis of stray losses in transformers using finite element method modelling. In Proceedings of the 2021 IEEE PES/IAS PowerAfrica, PowerAfrica 2021, Nairobi, Kenya, 23–27 August 2021. [Google Scholar] [CrossRef]
- Qi, H.; Rong, X.Z.; Guo, X.Z. Influence of Harmonic Current on Load Loss of 27.5kV Dry Type Transformer. Transformer 2021, 58, 36–41. [Google Scholar]
- Wensi, W. Research on Parameters Distortion Characteristics and Loss of Transformer under Harmonic Background. Master’s Thesis, North China Electric Power University, Beijing, China, 2019. [Google Scholar]
- Chen, C.; Xin, L.; Xin, J. Research on Multiphysics Simulation of Transformer Winding Vibration Based on Finite Element Method. Transformer 2018, 55, 21–26. [Google Scholar]
- Le, W. Study on the Core Magnetic Loss of Harmonic Transformer based on Steinmetz Model. Master’s Thesis, Heibei University of Technology, Tianjin, China, 2020. [Google Scholar]
- Li, Y.; Li, Y.; Luo, L.; Rehtanz, C.; Wang, C.; Ruberg, S. Simulation of the Electromagnetic Response Characteristic of an Inductively Filtered HVDC Converter Transformer Using Field-Circuit Coupling. IEEE Trans. Ind. Electron. 2012, 59, 4020–4031. [Google Scholar] [CrossRef]
- Qiu, H.; Zhao, X.; Yang, C.; Yi, R.; Wei, Y. Influence of open-circuit fault on electromagnetic field of high-speed permanent magnet generator with Gramme ring windings. IET Electr. Power Appl. 2020, 14, 220–225. [Google Scholar] [CrossRef]
- Xu, J.; Gu, X.; Liang, C.; Bai, Z.; Kubis, A. Harmonic suppression analysis of a harmonic filtering distribution transformer with integrated inductors based on field–circuit coupling simulation. IET Gener. Transm. Distrib. 2018, 12, 615–623. [Google Scholar] [CrossRef]
- Zhang, Z. Analysis of new filtering transformers energy saving theory and calculation of harmonics eddy current loss. Chin. J. Power Sources 2016, 40, 444–447. [Google Scholar]
- Luo, G.; Zhang, R.; Chen, Z.; Tu, W.; Zhang, S.; Kennel, R. A Novel Nonlinear Modeling Method for Permanent-Magnet Synchronous Motors. IEEE Trans. Ind. Electron. 2016, 63, 6490–6498. [Google Scholar] [CrossRef]
- Gan, B.; Zhang, B.; Liu, Y.; Feng, G. Thermal Analysis of Modular Fault-Tolerant Permanent Magnet Motor Based on Electromagnetic-Thermal Bi-Directional Coupling. IEEJ Trans. Electr. Electron. Eng. 2022, 17, 454–469. [Google Scholar] [CrossRef]
- Zhu, S.; Hua, W.; Shi, B. Comparison of Methods Using Different Sources for Computing PWM Effects on Permanent Magnet Machines Considering Eddy Current Reaction. IEEE Trans. Magn. 2021, 57, 1–4. [Google Scholar] [CrossRef]
- Dawood, K.; Işik, F.; Kömürgöz, G. Analysis and optimization of leakage impedance in a transformer with additional winding: A numerical and experimental study. Alex. Eng. J. 2022, 61, 11291–11300. [Google Scholar] [CrossRef]
- Moradnouri, A.; Hajiaghapour-Moghimi, M.; Vakilian, M. A Framework for Economic and Low Harmonic Loss Distribution Transformer Selection based on Ecodesign Directive. In Proceedings of the 34th International Power System Conference, PSC 2019, Tehran, Iran, 9–11 December 2019; pp. 19–24. [Google Scholar] [CrossRef]
- Yazdani-Asrami, M.; Mirzaie, M.; Akmal, A.A.S. No-load loss calculation of distribution transformers supplied by nonsinusoidal voltage using three-dimensional finite element analysis. Energy 2013, 50, 205–219. [Google Scholar] [CrossRef]
- Irannezhad, F.; Heydari, H.; Faghihi, F. Precise appraisement of the harmonic loads impact on hysteresis losses in a 3-phase HTS transformer. Int. J. Electr. Power Energy Syst. 2021, 133, 107199. [Google Scholar] [CrossRef]
- Susnjic, L.; Haznadar, Z.; Valkovic, Z. 3D finite-element determination of stray losses in power transformer. Electr. Power Syst. Res. 2008, 78, 1814–1818. [Google Scholar] [CrossRef]
- Chiu, H.-C.; Pao, H.-K.; Hsieh, R.-H.; Chiu, Y.-J.; Jang, J.-H. Numerical Analysis on the Eddy Current Losses in a Dry-type 3000 KVA Transformer. Energy Procedia 2019, 156, 332–336. [Google Scholar] [CrossRef]
- Yazdani-Asrami, M.; Gholamian, S.A.; Mirimani, S.M.; Adabi, J. Influence of field-dependent critical current on harmonic AC loss analysis in HTS coils for superconducting transformers supplying non-linear loads. Cryogenics 2021, 113, 103234. [Google Scholar] [CrossRef]
- Ehsanifar, A.; Allahbakhshi, M.; Tajdinian, M.; Dehghani, M.; Montazeri, Z.; Malik, O.; Guerrero, J.M. Transformer inter-turn winding fault detection based on no-load active power loss and reactive power. Int. J. Electr. Power Energy Syst. 2021, 130, 107034. [Google Scholar] [CrossRef]
- Zhang, X.; Yang, S.; Guo, Q. Transformer Health Assessment Method Based on Loss Parameter Identification by Multivariate Linear Regression. 2019. Available online: https://ieeexplore.ieee.org/document/8984141/ (accessed on 5 September 2022).
- Qionglin, L.; Lei, Z.; Huijin, L.; Xue, C.; Zhenan, Z.; Shangbei, F. Simulation calculation and experimental research on harmonic loss of power transformers. Power Grid Technol. 2013, 37, 3521–3527. [Google Scholar] [CrossRef]
- Pan, C.; Wang, C.; Liu, Z.; Chen, X. Winding vibration analysis of unbalanced transformer based on electromagnetic-mechanical coupling. Int. J. Electr. Power Energy Syst. 2021, 134, 107459. [Google Scholar] [CrossRef]
Publisher’s Note: MDPI stays neutral with regard to jurisdictional claims in published maps and institutional affiliations. |
© 2022 by the authors. Licensee MDPI, Basel, Switzerland. This article is an open access article distributed under the terms and conditions of the Creative Commons Attribution (CC BY) license (https://creativecommons.org/licenses/by/4.0/).