Abstract
The protection of urban lakes is important for the construction and development of the city and the eco-environment. Affected by urban expansion, most urban lake scenic areas have suffered from a reduction in area and ecological degradation. Protecting and restoring urban lake scenic areas has been a hot topic among the public. Given this background information, we analyzed the ecological problems and contradictions from the perspective of landscape ecology. This study evaluated the landscape pattern and ecological sensitivity in the Chaohu Lake Basin, China. The proposed method was based on the analytical hierarchy process (AHP) and geographical information system (GIS). The results showed that the ecological sensitivity map was divided into four sensitivity levels consisting of level 1, level 3, level 5, and level 7, which represent 65%, 27%, 5%, and 2% of the study area. It was found that highly sensitive areas existed primarily in the highlands, where the natural conditions were poorer than in other areas and human activities have been developing rapidly. Additionally, the medium sensitive levels occurred in the low lands, probably in response to agricultural practices. Based on our results, three ecological zones were proposed, which require different protection and utilization solutions in order to restore the local ecological environment in terms of sustainable development.
1. Introduction
Lakes have been important to urban development and environmental protection in China since the strategy of sustainable development and the conversion of farmland to lakes was applied, which contributed to urban eco-environment and microclimate regulation to a great extent [1]. In recent years, however, the quality of the ecological environment of urban lake scenic areas has obviously declined because of urban development, a rapidly growing population, and the excessive use of natural resources. This phenomenon has been noticeable in the Chaohu Lake Basin of eastern China. As one of China’s five largest freshwater lakes, Chaohu Lake is also an important water source and ecological conservation zone. The concerns of the Chaohu Lake Basin were that urbanization and industrialization might destroy the ecological environment and natural resources, which would put a damper on the sustainable use of the natural resources. Traditional methods for the problems of lakes remained at the technical level of landscape optimization and ecological remediation, which made it difficult to deal with the contradictory relationship between urban development and lake ecology. In fact, the solutions to the problem of urban lake scenic areas must be considered in a more macro way. Additionally, the macroanalysis and regional construction are the main characteristics of landscape ecology.
From the perspective of landscape ecology, landscape pattern and ecological sensitivity are discussed in this paper. Ecological sensitivity is a critical indicator for measuring the quality of the eco-environment and has become an important systematic tool in landscape ecological protection and utilization. Ecological sensitivity is a concept derived from geomorphology and was first proposed by Brunsden and Thornes (1979), who argued that sensitivity indicated the propensity to change and the capacity to absorb the effects of disturbances. Since then, the meanings of ecological sensitivity have been continuously explored and developed [2]. Previous studies have mostly focused on the macroscopic level, i.e., to study the various effects on the ecological environment of the region caused by the destruction of ecological factors by human disturbance or changes in conditions due to natural succession, and to analyze the relevant factors to derive the specific degree of impact. The study of ecological sensitivity, based on its geographical factors and differences in historical and human factors, has gradually developed into a number of studies on regional sensitivity, the sensitivity of the landscape to environmental change, the sensitivity of coastal cities to the expansion of the tourism industry, and the sensitivity of the snowpack to changes in natural conditions [3,4,5,6].
In order to facilitate the evaluation of ecological sensitivity, scholars quantified ecological impact factors and used statistical modeling methods to analyze the ecological sensitivity of study subjects. Through the study of ecological sensitivity, we can point out the direction for the coordinated development of the regional ecological environment and reduce the interference of human factors in the ecological environment, so that sustainable development becomes a possibility. At present, the study of ecological sensitivity plays a pivotal role in the field of environment and ecology, and its research methods and evaluation systems are constantly being improved [7].
An ecosystem is strong and stable when it is capable of withstanding pressurization from nature and humans; otherwise, it will become sensitive and will get worse. The impact factors can be categorized as inner and outer sensitivities. Inner sensitivity is brought by the eco-environment itself and outer sensitivity is mainly influenced by man’s activity. Evaluating ecological sensitivity requires data from different resources and areas. A lot of techniques have been found useful for data analysis, such as the morphological spatial pattern analysis (MSPA) [8] method, GIS [9], and entropy method [10,11]. The methods mentioned above require a lot of data which are not always simple to acquire. In order to overcome this difficulty, the AHP method proposed by Saaty [12] was advanced [13].
Because of these good features, it has been applied to quantitative research in various fields of nature, society, and economy [14,15,16], and environmental sensitivity studies [10]. Since the launch of the first generation of Landsat satellite in 1972, a considerable amount of research has been conducted on the earth’s environment using satellite images and thus contributes to social development and risk prevention and the decrease in natural and anthropogenic disasters in a remarkable way [17,18]. Remote sensing has also increasingly been applied to evaluate landscape sensitivity [7]. Landsat [8] opened up more possibilities for scientific research [19]. It provided more data and played an important role in social development planning, the study of natural and man-made disasters, and resources management, and supported the evaluation of the dynamics, trends, and spatial distribution of the eco-environment [20]. However, the application of remote sensing for ecological sensitivity assessment is still in the exploratory stage and needs to be improved.
In summary, this paper took the Chaohu Lake Basin as an example. Firstly, the sustainability of the current state of the ecosystem in the Chaohu Lake Basin was assessed, which we performed to try to provide information for landscape planning decisions. Secondly, we intended to delineate protection areas in the Chaohu Lake Basin. It incorporated most of the parameters involved in ecological sensitivity. Their integration in the multilevel analysis combined with the use of GIS was then used to delineate the protected areas around the basin lakes. Multiple approaches, including remote sensing, AHP, and correspondence analysis, were used. The Landsat 8 data were products with a high spatial resolution (30 m). The Operational Land Imager (OLI) and Thermal Infrared Sensor (TIRS) were more advanced when compared with the former Landsat, as characteristics such as resolution, imager, sensor-band, etc. were all improved [21].
The novelty of this study is that there are few such studies in the Chaohu basin that need to be added urgently. Additionally, the land-use data used in the study were supervised and classified by the ENVI, and the accuracy was confirmed by comparison with the images on Google Earth to ensure a high degree of accuracy. The study of the landscape spatial structure and protection and utilization of urban lake-type scenic areas was not only conducive to fully understanding the distribution of the ecological environment in the region, which has a positive impact on the rational development and sustainable utilization of resources, but it can also provide a corresponding theoretical basis for landscape ecological planning and ecological environment construction in the study area. At the same time, the analysis of the original conditions of the area can effectively anticipate ecological problems and can encourage researchers to take timely measures. The conservation and utilization strategy of urban lake-type scenic areas proposed by this research can provide a reference for local ecological environmental protection and governmental improvement of the management system.
2. Material and Methods
2.1. Study Area
Hefei, the capital of Anhui Province in eastern China, is a rapidly growing city. The selected study area, Chaohu Lake, is located in the southern region of Hefei, with a total area of 780 km2 [22] and coordinates of 117°16′–117°51′ E and 30°25′–31°43′ N (Figure 1). Chaohu Lake is one of the five largest freshwater lakes in China and is located in the middle and lower reaches of the Yangtze River [23]. The Chaohu Lake Basin has a subtropical temperate monsoon climate with a moderate climate, where the annual average temperature ranges between 15 and 16 °C, with a mean annual precipitation of 1100 mm [24]. In addition to a comfortable climate and adequate rainfall, Chaohu Lake is also rich in fish resources, which makes this place suitable for people to live. The Chaohu Lake Scenic Area has three types of landforms: plains, hills, and mountains. Its regional geomorphology is characterized by lake bodies, plains, hills, and mountains from inside to outside. The Chaohu Lake Scenic Area has obvious regional differences in landform morphology, and the topography of the area is more complex. The terrain and landforms generally show the characteristics of long from east to west and narrow from north to south. Chaohu Lake’s scenic area has an excellent ecological environment, rich plants, and fishery resources, with landscape resources such as Wanfo Lake, Hangbu River, and Mushan Island. It brings great economic and ecological value to the surrounding residents through the development of leisure tourism. Nowadays, the Chaohu Lake Basin is one of the most popular areas in the central Anhui Province, with a resident population of 803,200 in 2019 [25].
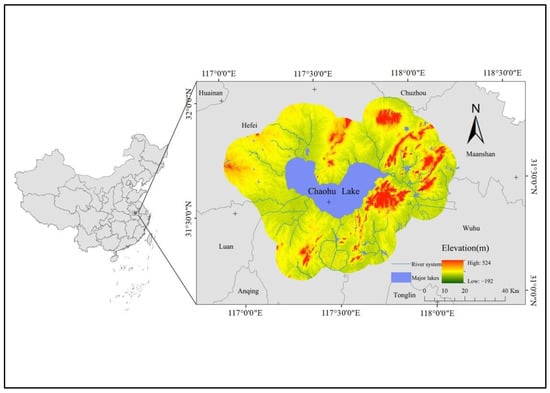
Figure 1.
The location of Chaohu Lake Basin and the scope of the study area.
2.2. Data Sources
The satellite data used in this study were all downloaded for free from the websites: “Geospatial Data Cloud” (Computer Network Information Center of the Chinese Academy of Sciences) and the United States Geological Survey. Due to the wide range of study areas, this study combined multiple types of remote sensing data. The satellite images used for the study were based on the images from 2018 and 2020. Image data from the Landsat OLI and TIRS were resampled to the resolution of 30 × 30 m. The remote sensing data and map data were all unified into Albers conic projection. In order to reduce the errors caused by different climates, the images were mainly selected from September to October each year (Table 1). The images from September to October 2020 were not available for some areas because of cloudiness, so we chose images from June instead to ensure that all satellite images were below 5% cloudiness. Because the core areas of the Chaohu Lake Basin did not have a clear boundary, we referred to the Chaohu Lake Basin Water Pollution Control Regulations published by the Department of Ecology and Environment of Anhui Province to determine the study areas, which were the administrative scope of the first-grade protection of Chaohu Lake and buffered 10 km.

Table 1.
The image data set.
The locations and information of lakes were provided by online maps such as the National Platform for Common Geospatial Information Services.
The basic map data mainly consisted of the administrative map and boundary of the research area, which was taken from the National Geomatics Center of China, and the digital elevation model (DEM) was downloaded for free from the website: “Geospatial Data Cloud”.
To further process the raw data, we analyzed the NDVI and normalized the difference water index (NDWI) using Landsat 8 OLI images (Table 2). Landsat data were also used to observe land cover. Administrative and topographic maps were used to analyze township boundaries, residential areas, and agricultural areas. DEM was utilized to collect slope and terrain elevation. To consider the impact of human activities on the eco-environment, we decided to take the villages and towns as the boundary and increase the buffer distances. All the factors were converted into raster data and were set up in ArcGIS version 10.7, Esri, and from Redlands, CA, USA.
Table 2.
Spectral bands of Landsat 8 Operational Land Imager (OLI) and Thermal Infrared Sensor (TIRS).
2.3. Data Processing Methods
2.3.1. The Rationale for the Factor Selection
Ecological sensitivity is the sensitivity of the ecosystem to disturbance by natural and human activities, which is important for research on ecosystem protection. Located in the city, urban lake scenic areas are frequently disturbed by natural and human activities due to their important geographical location and ecological value in the city. Based on the data suitability and sensitivity status of different areas, there are no general rules for how many variables should be selected to evaluate the ecological sensitivity [7,10,26]. In this study, combined with the location, environment, and the present research about the protection and utilization of urban lakes, 5 variables of three types were considered, which were geography, hydrography, and vegetation.
The variable/factor included elevation, slope, and land-use type because there were mountains, farmland, and residential areas around the Chaohu Lake Basin. The modification normalized difference water index (MNDWI) was used to represent hydrography and the NDVI was applied to vegetation.
2.3.2. Grading of Evaluation Factors
Based on the referenced literature and expert advice and taking into account the local environment, the evaluation factors were graded [27,28,29]. The classification standards are shown in Table 3.
Table 3.
Different factors and their weight in the Chaohu Lake Basin.
2.3.3. Determination of Weights
The AHP method was used to determine the weights of each variable. The process of the AHP method includes selecting decision-level variables, creating a comparison matrix based on the judgment values given by the experts, comparing the variables in the matrix, and assigning weights to the variables. To reduce bias in the decision-making process, the study is required to be tested for consistency, and the consistency index (CI) is calculated; when the CI < 0.1, the consistency of the two comparisons is considered to be within acceptable limits and the comparison matrix has satisfactory consistency. The process converts subjective evaluations into numerical values and ranks them in numerical form.
The overall scheme of the AHP approach can be simplified into four detailed steps. First, the decision problem is deconstructed into a hierarchical structure, with each factor and subfactor further separated into its own attributes and grouped at the same level. Second, decision tables are available for each level of the hierarchical decomposition. They show a series of pairwise comparisons, using a scale from 9, 7, 5......, 1/5, 1/7 to 1/9 preference scaling methods, where 9 indicates the most important, 7 the second most important, and so on, and 1/9 the least important; then, based on the relative importance of the decision variables revealed by the figures in the table, a matrix of relative importance relationships is established and the weight values of each influence factor are calculated. The formula is as follows:
where means the objective weight of the ith indicator and ai is the geometric mean of each variable.
Finally, the AHP method requires decision makers to maintain consistency in their judgments during the decision-making process, and consistency testing is a means to test for errors introduced by human factors. The consistency of n in the square matrix needs to be evaluated. The AHP method allows inconsistency to exist, but if the consistency indicators do not reach the required level, then the answers need to be rechecked for comparisons [30,31]. The CI is calculated as:
where is the total score of the variables and n is the number of factors. To ensure that the matrix has a reasonable consistency, the value of CI needs to be less than 0.1. In this study, CI = 0.056 < 0.10.
The weights are determined by the score of the authoritative researcher or expert in the field and then the weight of each indicator is calculated. The weights of the indicators are shown in Table 4.
Table 4.
The relative importance matrix of influencing factors.
2.3.4. Steps for Calculating the Ecological Sensitivity
The framework of the ecological sensitivity assessment was proposed to integrate the AHP approach, GIS, and The Environment for Visualizing Images (ENVI) techniques [29,32]. The steps for calculating the ecological sensitivity were as follows [33]:
The ecological sensitivity (ES) map was created based on the generated stack and each component’s weight with the support of the algebra computation is given in (Equation (4)). The higher the ES value, the more sensitive the ecological is:
where C1 is the digital elevation map, C2 is the slope map, C3 is the land-use type, C4 is the watershed protection, C5 is the vegetation coverage, and Wi, i = 1, 2, 3, 4, 5 are their corresponding weights, as shown in Table 3. C1, C2, C3, C4, and C5 are calculated by using (Equation (5)):
where v is the value of each variable, wi is the weight of each variable (Table 3), and n is the total number of variables.
Based on the method mentioned above, final maps of elevation, slope, land-use type, watershed protection, vegetation coverage, and ecological sensitivity were produced and classified as level 1, level 3, level 5, and level 7 based on the Natural Interval Classification method of ArcGIS.
2.4. Factors Description
Elevation (C1). The elevation of the Chaohu Lake Basin was classified using digital elevation maps as the data source and the Reclassify tool of Spatial Analyst in ArcGIS for the elevation data. Elevation changes had a significant impact on transport, soil, regional climate, and other possible processes that might affect ecological sensitivity.
Slope (C2). DEM data obtained from the Geospatial Data Cloud of Anhui (http://www.gscloud.cn/) were utilized to create a slope map of the study area. The slope was a major factor affecting urban construction and natural disasters such as soil erosion, floods, or flash floods.
Land-use type (C3). In order to determine the land-use type, the three bands of the Landsat OLI image, including bands 6, 5, and 4, were combined [34,35]. The combined image was classified using supervised classification with a maximum likelihood algorithm into six types, namely: farmland, grassland, water body and woodland, construction land, and unused land. The separability of the classification results should be calculated after the classification is completed. If the separation degree is higher than 1.85, the separability is better and the classification accuracy is better. Then, the land-use classification results were checked and accuracy was verified by using remote sensing image data as validation samples. The accuracy and Kappa coefficient were calculated by the confusion matrix, and the overall classification accuracy value of the study area was obtained as 90.72%, and the mean value of the Kappa coefficient was 0.81, which satisfied the classification accuracy requirement. The separation degree of land-use types in the study area is shown in Table 5. The accuracy was high, and the results did not produce large deviations. The land-use type layer was constructed according to remote sensing.
Table 5.
Land-use classification separability.
Watershed protection (C4). The NDWI [36] is a common index to distinguish water from remote sensing data, as shown in (Equation (6)).
The water information obtained from remote sensing images is easily disturbed by vegetation, land, buildings, and other land-use types. A modified NDWI indicator, the MNDWI, can eliminate these disturbances by replacing the near-infrared band with the middle infrared band in the NDWI model [37]. That is, (Equation (7)):
The MNDWI has a range of (−1,1). Green and MIR are green bands and middle infrared bands, respectively; they are band 3 and band 6 in Landsat 8. The improved NDWI method significantly enhances the contrast between water bodies and buildings, reduces the impact of buildings on the extraction effect of water bodies to a certain extent, improves the accuracy of water extraction, and thus fits better for the extraction of the urban water body.
Vegetation coverage (C5). Vegetation coverage was studied using the NDVI calculated from the Landsat 8 images in October 2020. In previous decades, remote sensing was used as a feasible method to retrieve some variables used in eco-environmental sensitivity such as environmental and climatic variables [20,22], spatial scales [2], and land cover [24,38]. In the present study, the OLI image was radiometrically corrected based on the dark pixel method in the ENVI (ver 5.3 Exelis VIS, and from Denver, CO, USA). The NDVI ranges between −1 and +1. Areas with vegetation cover and other types of study areas show positive and negative values, respectively. Areas with high vegetation cover are shown by the value of +1 and the complete absence of vegetation is represented by the value of −1. The fourth band (red) and fifth band (near-infrared) of the OLI image are utilized to obtain the NDVI value using the following (Equation (8)) [39]:
where float is the reflectance of bands 5 and 4 of the floating point. Several specific domains of the vegetation cover were obtained by the supervised classification of the NDVI images using Jenks. As Table 2 shows, the bare lands of the study area with an NDVI range of 0–0.1 had a lower weight with level 1, and concentrated vegetation cover with an NDVI range of 0.6–1 had a higher weight with level 7.
3. Results and Discussion
Based on the method mentioned, five group variables including elevation, slope, land-use type, watershed protection, and vegetation coverage were decided, and a final composite map of ecological sensitivity was produced and classified into four levels, namely level 1, level 3, level 5, and level 7 based on the Natural Interval Classification method. The ecological sensitivity distributions of the five groups of variables and the ecological sensitivity overly map are described below.
3.1. Elevation Impact
Changes in elevation are strongly related to urban transport, soils, regional climate, and other factors that may have an impact on the regional ecology. The elevation of the study area was between −192 m to 524 m. The effect of elevation is illustrated below (Figure 2), showing that the level 1 impact covered 65% of the total area, located in almost all areas of the study area. The level 3 elevation impacts were located in the north, northwest, and northeast and occurred in 32% of the whole area. A fraction of level 5 and level 7 was distributed in the east, northeast, south, and north, accounting for 3% of the total area.
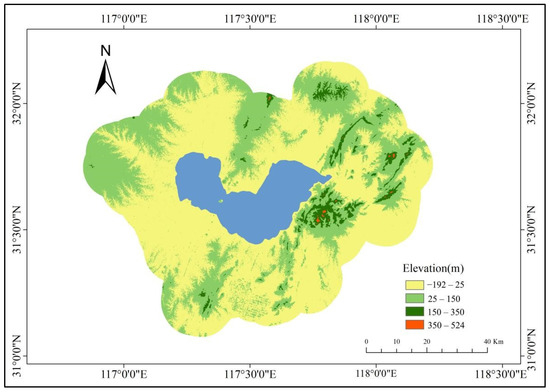
Figure 2.
Spatial distribution of elevation impact in the study area.
3.2. Slope Impact
Slope is the inclination of the ground, which is one of the main factors affecting urban construction and natural disasters. The higher the slope, the higher the ecological sensitivity and susceptibility to soil erosion and landslides, and the more prone to natural disasters and unsuitable for human production activities. When the slope is 0–8°, it is flat with mild soil erosion, easy to build terraces, suitable for developing plantation production, and it is also suitable for human residence, sightseeing, and urban construction; when the slope is 8–15°, it is gently sloping land, which needs strengthened soil and water protection measures; when the slope is 15–25°, it is sloping land, which is prone to soil erosion and is steep, and can be used for a small amount of construction; when the slope is 25° or more, it is called steep sloping land, which is not suitable for construction and is recommended to be protected as ecological land. The results of the slope impacts are shown in Figure 3. The level 1 slope impacts contributed to 77% of the total area, situated mainly along the north and west. Their distribution was in connection with soil erosion. The greater the slope, the more serious the soil erosion. The level 3 values accounted for the remaining 16% of the total area. These values were mainly found in the south and west with low terrain elevation. Level 5 and level 7 accounted for 7% of the total area, and were mainly found in the northeast, east, and south. Moreover, these locations usually suffered from landslides due to scarce vegetation and poor forest restoration. As a result, soil erosion happened in conjunction with a decline in fertility.
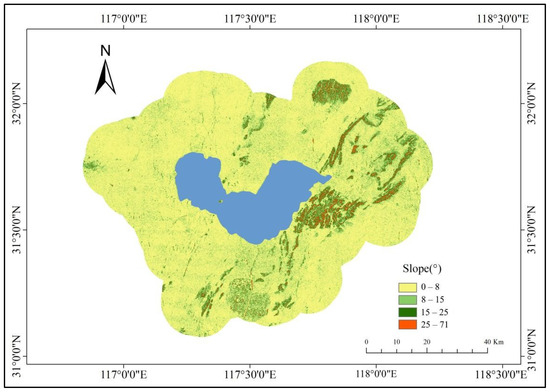
Figure 3.
Spatial distribution of slope impact in the study area.
3.3. Land-Use Type Impact
The geomorphological factors were selected to analyze the land-use types, which mainly included forest land, water area, arable land, grassland, construction land, and unused land. According to the relevant research, the various land-use types were graded, and the evaluation results were transformed into raster graphics to obtain the land-use evaluation results. The spatial distribution of the land-use type impacts is shown in Figure 4. Overall, the Chaohu Lake Basin was characterized by a relatively high level of land-use type impacts. The farmland was mostly in the south, southwest, and southeast, and it accounted for almost 34% of the total area, which had a low impact on ecological sensitivity. The grassland area was distributed mainly in the south and west, accounting for 6% of the total area. The waterbody and woodland areas accounted for 24% of the total area. These values were mainly found in the middle, northeast, and west region where the land was characterized by rich water sources and more vegetation cover. Construction land and unused land impacts occurred in 36% of the total area and were located in the northwest and east. It was obvious that the land-use type significantly contributed to all the sensitivity levels, in particular, the classes of level 1 and level 7.
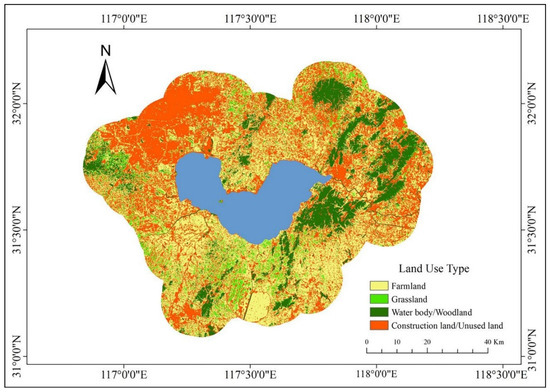
Figure 4.
Spatial distribution of land-use type in the study area.
3.4. Normalized Difference Vegetation Index Impact
Good vegetation growth can reduce the probability of natural disasters, enhance soil and water conservation capacity, and at the same time improve the biodiversity level, thus increasing ecosystem complexity and diversity, enhancing the regulation capacity of ecosystems, and contributing to ecosystem balance. Overall, vegetation cover is an intuitive reflection of the response to vegetation growth, and the higher the vegetation cover, the higher the ecological sensitivity. In this study, the vegetation cover of the Chaohu Lake watershed was classified into classes with reference to the classification criteria of previous authors. The area with a low NDVI accounted for 12% of the total area (Figure 5). Most of this land was located in the center portion of the region, where the land had abundant water and less vegetation cover. The level 3 and level 5 NDVI were observed in 2% and 15% of the total area, respectively, primarily in the northwest, south, and east of the Chaohu Lake Basin. High-level NDVIs were distributed mainly in the north and the southeast, accounting for 71% of the total areas. The areas characterized by a high NDVI were the main agricultural production areas, wetlands, and place of residence of the Chaohu Lake Basin, in which crops grew relatively well because there was sufficient water from rain and irrigation and little wind speed. The NDVI was an important indicator of forest resources and green coverage.
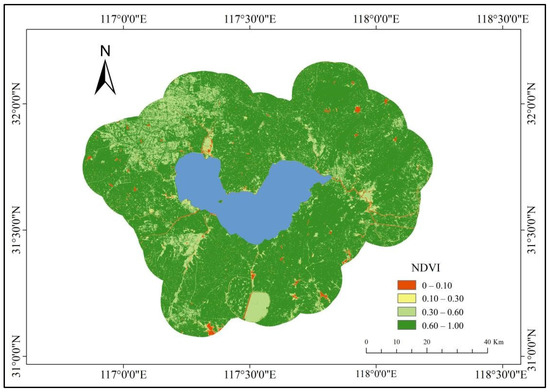
Figure 5.
Spatial distribution of NDVI in the study area.
3.5. Watershed Protection Impact
Water resources are important constituents of urban lake-type scenic areas, among which the good protection and utilization of water bodies are also beneficial to the development of scenic resources, economic development, ecological and climatic conditions of the city, and improvement of the living environment of the surrounding residents. In this paper, we refer to relevant literature and combine it with the actual situation of the Chaohu Lake basin to classify and evaluate the distance from the water source, as the closer the distance from the water source, the more vulnerable the ecological environment of the area is to damage. The results of the watershed protection impacts are shown in Figure 6. The level 1 hydrological network impacts contributed 83% of the total area, primarily located on the edge of the Chaohu Lake Basin. The level 3 and level 5 values accounted for the remaining 2% of the total area. These values were mainly 100 to 300 m away from lakes and 50 to 200 m away from rivers. The classes of level 7 were mainly situated in the center of the Chaohu Lake Basin and accounted for almost 15% of the total area. On average, the watershed protection impacts in the Chaohu Lake Basin were at a moderate level.
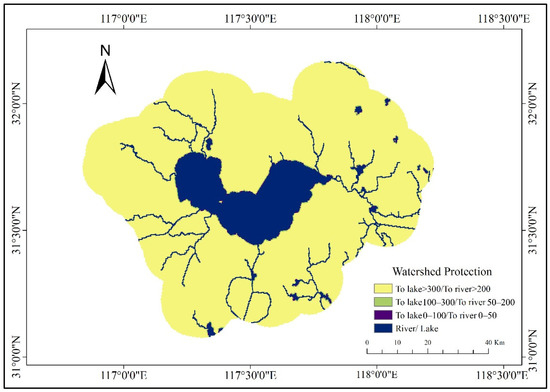
Figure 6.
Spatial distribution of watershed protection in the study area.
3.6. Spatial Distribution of Ecological Sensitivity
The resulting ecological sensitivity map classified into four levels is shown in Figure 7.
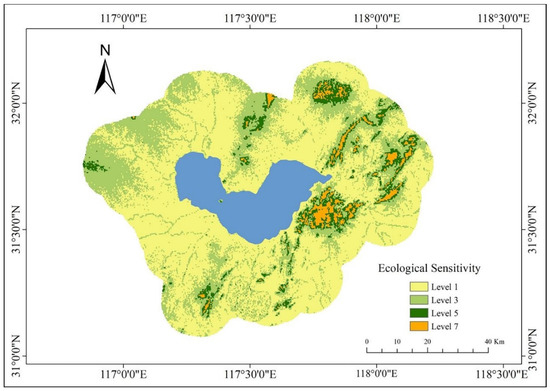
Figure 7.
Spatial distribution of ecological sensitivity in the study area.
Level 5 and level 7 ecological sensitivity indices were mainly found in construction land, bare hills, and areas in which trees had been planted, which were located in the southeast, northeast, and east regions with elevations ranging from 0–150 to 150–524 m. We suspected that one of the reasons was that these areas were affected by things that human have performed more often due to buildings relating to industry and the mining market in these regions. In addition, because of the terrain conditions, these areas suffered from landslides. Comparing the ecological sensitivity map and DEM, it seems that the sensitivity correlates with the distribution of elevation. Level 5 and level 7 were mainly distributed in high-rise lands with slope angles varying from 15° to 71°. The places of lower elevation gathered a larger crowd, more buildings, and event space with less vegetation cover. The high places were a higher probability of inadequate forest protection and severe soil erosion resulting from landslides during heavy rainfall periods.
From the above ecological sensitivity assessment, it was obvious that extensive data were needed. However, we could not collect all the data, and as time keep advancing, more will be left to the future to explore and improve.
4. Discussion
4.1. Partition for Eco-Environmental Protection and Management
In order to improve the practicability of ecological sensitivity evaluations for ecological environmental protection and utilization, an ecological protection area map was created and is shown in Figure 8. The ecological environmental protection and management zoning basis were created according to the analysis of the factors influencing the conservation planning of the Chaohu Lake basin, combined with the results of the ecological sensitivity evaluation and with reference to the corresponding provisions of the GB/T50298-2018 Master Plan Standards for Scenic Areas on the grading and classification of conservation cultivation planning, as well as the requirements for environmental protection and moderate development of urban lake-type scenic areas, the objectives of protecting and constructing large landscape ecological land, maintaining the number of patches, maintaining ecological corridors, and building a landscape ecological security pattern [40,41]. This was analyzed from the ecological sensitivity map. We divided it into three areas, including:
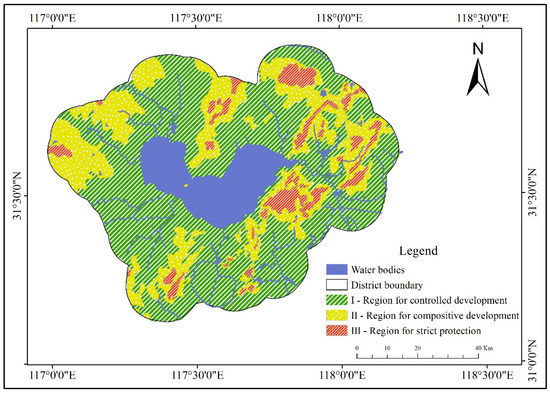
Figure 8.
The proposed eco-environmental protection zoning map.
- (i)
- region for controlled development;
- (ii)
- region for composite development;
- (iii)
- region for strict protection.
4.1.1. Region for Controlled Development
This region was generated by the level 1 ecological sensitivity zone. It occurred in most of the study areas but was mainly found in the Hefei and Wuhu areas. The land was flat in most parts, and covered by farmland, plantation forest, and residential land, accounting for 63% (approximately 6231 km2) of the study area. Land-use type should be reserved and appropriate landscape infrastructure could be incorporated.
4.1.2. Region for Composite Development
This area was a collection of the level 3 components of the ecological sensitivity zone, lying mainly in Hefei, Ma’anshan, and tiny parts in Wuhu. The total area was 30% (approximately 1849 km2). Most of this landform was low-rise mountains and forests, and in addition, this land also consisted mainly of the large-scale farming enterprise, trees had been planted for commercial purposes, and forests were planted to protect the ecology. This region could be moderately exploited and the government could open up some areas for tourists.
4.1.3. Region for Strict Protection
This region consisted of level 5 and level 7 ecological sensitivity zones. The landform was full of forests produced by nature and the landform was characterized by a large natural elevation of the earth’s surface rising abruptly from the surrounding level, accounting for 7% (approximately 425 km2) of the study area. The mountains, rivers, vegetation, and animals in region III should be protected strictly. Protection measures would be implemented directly.
4.2. Plans for the Three Regional Types
To deal with the difficult situations, there are some proper ways that decisions can be put into effect to protect the eco-environment in the three different zones. Firstly, governments can prioritize the implementation of active ecological protection policies and social management for areas with a high ecological sensitivity. The people who live in a group of houses situated in a rural area located along the Chaohu Lake Basin should also comprehend the meanings of eco-environmental protection, as this will improve their awareness and will cause them to understand how to make better use of land and water resources; otherwise, they will bring ecological problems such as algal disasters. Secondly, the state of being clear of trees due to companies preparing the land to grow crops for the production of food via slash and burn agriculture should be kept from happening. Additionally, the management of worthless material that is to be disposed of should be improved. The lack of concentration in surrounding villages needs to be addressed and overcome by arranging new settlements and helping them to conduct the principal activity to earn money somewhere else. Thirdly, in the context of climate change, the Chaohu Lake Basin endures great damage and people lose their life due to natural catastrophes, such as an overflowing of water beyond its normal confines or the sliding down of a mass of earth or rock from mountains; thus, the process of eroding also should be noticed. As a region with a lake, there are a lot of water cultural activities, which significantly contribute to economic development [42]. However, the rapid growth of these companies has put tremendous pressure on the ecosystem, and it is absolutely vital to protect the lake shore by creating obstacles that prevent it from being eroded by water. Meanwhile, Eco-tourism should be organized. Nevertheless, it is also difficult to solve the clash of opposing needs between economic development and ecological protection. However, if we could respect this relationship, they might be able to get along in the long run.
The protection of the Chaohu Lake Basin can improve the flood storage function and ecological protection function. Combining wetlands with ecological agriculture not only enriches biodiversity and improves ecosystem stability but also takes into account the water purification function. After the treatment, the water quality has been significantly improved and the occurrence of cyanobacteria in Chaohu Lake is on a decreasing trend. The ecological sensitivity of the Chaohu Lake Basin is well managed, and the coexistence of the city and lake has eventually been realized. In the future, we can select research factors with broader and more diverse coverage, study other research methods to make the distribution of factor weights more equitable, and add spatial and temporal dynamics to predict future ecological sensitivity changes. It is hoped that ecological sensitivity can be included in the reference range for the subsequent planning of urban lake scenic areas. This will reduce the irreversible damage caused by development to highly sensitive areas, protect the ecological environment, and make sustainable development a reality. The Anhui Province’s “14th Five-Year Plan” key basin water ecological environmental protection plan proposed that the province will carry out a new round of comprehensive management strategies for Chaohu Lake. It is expected that by 2025, the function of the wetland ecosystem in the Chaohu Lake Basin will be basically stable, the richness of biological species will increase significantly, and the wetland ecological barrier will be basically constructed.
5. Conclusions
Chaohu Lake is a typical urban lake scenic area. The ecology of urban lakes indirectly influences urban economy and development. Chaohu Lake has been affected by the rapid development of Hefei city and surrounding cities and has been seriously polluted since the 1980s. Although the water quality has been greatly improved under the control and management of relevant departments, its ecological problems have not been eradicated so far. Guided by the theories of landscape ecology, sustainable development, and habitat environment, this study analyzed a series of factors to evaluate the ecological sensitivity and to propose recommendations for the protection and utilization of urban lake scenic areas. The ecological situation was evaluated by considering three aspects of influences: geography, hydrography, and vegetation influences, which deepened the utilization of the ecological importance and corresponded to the distinct sensitivity of the lake ecosystem. This research intended to analyze environmental variables and evaluated them with the help of Landsat8 technology. Additionally, all variables were combined with the AHP method to determine the weights of the elements and used GIS, ENVI, and remote sensing as the main auxiliary tools. Key points in our results are summarized as follows.
The results showed that the overall ecological sensitivity of the Chaohu Lake Basin is currently at the medium ecologically sensitive type. Areas of high-level sensitivity were mainly in the medium and high lands where natural conditions are relatively poor. The high land in this region occasionally suffers from soil erosion and landslide. Overall, 65% of the low ecological sensitivity appeared in low and medium land areas due to abundant water, high vegetation coverage, and less human activity. In the study area, all of the landscape, soil, and vegetation components were important for the ecological sensitivity, and the anthropogenic and marine influences made larger contributions to the spatial heterogeneity of ecological sensitivity than the topographic influence did. We found that areas with lower biodiversity always showed lower levels of vegetation cover and higher sensitivity, while areas with higher biodiversity always had higher levels of vegetation cover and a lower sensitivity. Consequently, it had extreme impacts on the eco-environment. In addition, drought, landslide, and floods sometimes occurred in the Chaohu Lake Basin in the summer, so the elevation of the high place often lacked vegetation and a high sensitivity. The map for the Chaohu Lake Basin protected zoning had reasonable area assignments for the different protected areas. It had the best compatibility with land use and the equilibrium of protection and development. The assessment method proposed here could be applied to other regions by adjusting the factors associated with the desired variables of interest so that one day the sustainable development of the urban lake can come true.
However, there are still shortcomings in this study. Firstly, in terms of time span, this paper only analyzes and evaluates the current situation of the study area, but fails to select more time nodes to analyze its spatial and temporal dynamic evolution. Secondly, in terms of the selection of ecological sensitivity evaluation factors, this paper fails to select more comprehensive and multiple evaluation factors because of the limited research data and time. Finally, although this paper presents the general problems of urban lake-type scenic areas, it only focuses on the Chaohu Lake Scenic Area as an example and may not be applicable to the problems of other urban lake-type scenic areas. These questions will be further addressed in future studies.
Author Contributions
Conceptualization, G.W.; methodology, C.L. and X.Y.; software, G.W., Z.Y., C.L. and X.Y.; validation, Z.Y.; formal analysis, G.W.; investigation, G.W. Z.Y. C.L. and X.Y.; resources, G.W.; data curation, G.W.; writing—original draft preparation, G.W.; writing—review and editing, S.Z.; visualization, G.W.; supervision, S.Z.; project administration, S.Z.; funding acquisition, S.Z. All authors have read and agreed to the published version of the manuscript.
Funding
This research and the APC were funded by Anhui Provincial Natural Fund grant number 2008085MC100 and Anhui Natural Science Research Project grant number KJ2019ZD19.
Acknowledgments
We are grateful to the Landscape Architecture Research Office, Bureau of Agriculture and Rural Affairs, Hefei City, Anhui Province, China.
Conflicts of Interest
The authors declare no conflict of interest.
References
- Yu, H.; Tu, Z.; Yu, G.; Xu, L.; Wang, H.; Yang, Y. Shrinkage and protection of inland lakes on the regional scale: A case study of Hubei province, China. Reg. Environ. Chang. 2020, 20, 1–14. [Google Scholar] [CrossRef]
- Chi, Y.; Zhang, Z.; Wang, J.; Xie, Z.; Gao, J. Island protected area zoning based on ecological importance and tenacity. Ecol. Indic. 2020, 112, 106139. [Google Scholar] [CrossRef]
- Burrough, S.L.; Thomas, D.S.G.; Orijemie, E.A.; Willis, K.J. Landscape sensitivity and ecological change in western Zambia: The long-term perspective from dambo cut-and-fill sediments. J. Quat. Sci. 2015, 30, 44–58. [Google Scholar] [CrossRef]
- Thomas, M.F. Landscape sensitivity to rapid environmental change—A quaternary perspective with examples from tropical areas. Catena 2004, 55, 107–124. [Google Scholar] [CrossRef]
- McGlade, J.; McIntosh, B.S.; Jeffrey, P. Landscape sensitivity, resilience and sustainable watershed management. Coping Water Defic. 2008, 48, 113–134. [Google Scholar]
- Tennant, C.J.; Harpold, A.A.; Lohse, K.A.; Godsey, S.E.; Crosby, B.T.; Larsen, L.G.; Brooks, P.D.; Van Kirk, R.W.; Glenn, N.F. Regional sensitivities of seasonal snowpack to elevation, aspect, and vegetation cover in western North America. Water Resour. Res. 2017, 53, 6908–6926. [Google Scholar] [CrossRef]
- Chi, Y.; Zhang, Z.; Gao, J.; Xie, Z.; Zhao, M.; Wang, E. Evaluating landscape ecological sensitivity of an estuarine island based on landscape pattern across temporal and spatial scales. Ecol. Indic. 2019, 101, 221–237. [Google Scholar] [CrossRef]
- Zhang, Y.; Shen, W.; Li, M.; Lv, Y. Assessing Spatio-temporal changes in forest cover and fragmentation under urban expansion in Nanjing, eastern China, from long-term Landsat observations (1987–2017). Appl. Geogr. 2020, 117, 1–10. [Google Scholar] [CrossRef]
- Rahman, M.R.; Shi, Z.H.; Chongfa, C.; Dun, Z. Assessing soil erosion hazard -a raster based GIS approach with spatial principal component analysis (SPCA). Earth Sci. Inform. 2015, 8, 853–865. [Google Scholar] [CrossRef]
- Shi, Y.; Li, J.; Xie, M. Evaluation of the ecological sensitivity and security of tidal flats in Shanghai. Ecol. Indic. 2018, 85, 729–741. [Google Scholar] [CrossRef]
- Saedpanah, S.; Amanollahi, J. Environmental pollution and geo-ecological risk assessment of the Qhorveh mining area in western Iran. Environ. Pollut. 2019, 253, 811–820. [Google Scholar] [CrossRef] [PubMed]
- Saaty, T.L. Analytic Heirarchy Process; Wiley statsRef: Statistics reference online; John Wiley & Sons, Ltd: Hoboken, NJ, USA, 2014. [Google Scholar] [CrossRef]
- Bhushan, N.; Rai, K. Strategic Decision Making: Applying the Analytic Hierarchy Process; Springer: London, UK, 2004. [Google Scholar]
- Khademi, N.; Behnia, K.; Saedi, R. Using analytic hierarchy/network process (AHP/ANP) in developing countries: Shortcomings and suggestions. Eng. Econ. 2014, 59, 2–29. [Google Scholar] [CrossRef]
- Lyu, H.M.; Zhou, W.H.; Shen, S.L.; Zhou, A.N. Inundation risk assessment of metro system using AHP and TFN-AHP in Shenzhen. Sustain. Cities Soc. 2020, 56, 1–14. [Google Scholar] [CrossRef]
- Zhang, Y.; Yang, Z.; Yu, X. Measurement and evaluation of interactions in complex urban ecosystem. Ecol. Model. 2006, 196, 77–89. [Google Scholar] [CrossRef]
- Gu, K.; Fang, Y.; Qian, Z.; Sun, Z.; Wang, A. Spatial planning for urban ventilation corridors by urban climatology. Ecosyst. Health Sustain. 2020, 6, 1747946. [Google Scholar] [CrossRef]
- Miao, Z.H.; Pan, L.; Wang, Q.Z.; Chen, P.; Yan, C.; Liu, L.K. Research on urban ecological network under the threat of road networks—A case study of Wuhan. ISPRS Int. J. Geo-Inf. 2019, 8, 342. [Google Scholar] [CrossRef]
- Wu, J.; Luo, J.; Tang, L. Coupling relationship between urban expansion and lake change—A case study of Wuhan. Water 2019, 11, 1215. [Google Scholar] [CrossRef]
- Jiang, L.; Huang, X.; Wang, F.; Liu, Y.; An, P. Method for evaluating ecological vulnerability under climate change based on remote sensing: A case study. Ecol. Indic. 2018, 85, 479–486. [Google Scholar] [CrossRef]
- Irons, J.R.; Dwyer, J.L.; Barsi, J.A. The next Landsat satellite: The Landsat Data Continuity Mission. Remote Sens. Environ. 2012, 122, 11–21. [Google Scholar] [CrossRef]
- Zhang, Z.; Gao, J.; Fan, X.; Zhao, M.; Lan, Y. Assessing the variable ecosystem services relationships in polders over time: A case study in the eastern Chaohu Lake Basin, China. Environ. Earth Sci. 2016, 75, 1–13. [Google Scholar] [CrossRef]
- Ouyang, H.L.; Wang, Q.M.; He, W.; Qin, N.; Kong, X.Z.; Liu, W.X.; He, Q.S.; Jiang, Y.J.; Yang, C.; Yang, B.; et al. Organochlorine pesticides in the dust fall around Lake Chaohu, the fifth largest lake in China. Environ. Monit. Assess. 2013, 186, 383–393. [Google Scholar] [CrossRef] [PubMed]
- Zhang, Z.; Gao, J.; Gao, Y. The influences of land use changes on the value of ecosystem services in Chaohu Lake Basin, China. Environ. Earth Sci. 2015, 74, 385–395. [Google Scholar] [CrossRef]
- Huang, J.; Zhan, J.; Yan, H.; Wu, F.; Deng, X. Evaluation of the impacts of land use on water quality: A case study in the Chaohu Lake Basin. Sci. World J. 2013, 2013, 329187. [Google Scholar] [CrossRef] [PubMed]
- Wu, D.; Chen, D.; Tang, L.; Shao, G. A comprehensive assessment of ecological sensitivity for a coal-fired power plant in Xilingol, Inner Mongolia. Int. J. Sustain. Dev. World Ecol. 2017, 24, 420–426. [Google Scholar] [CrossRef]
- Wang, S.H.; Li, Q.; Deng, S.H.; Liu, S.W. Optimization of rural residential land based on ecological sensitivity and suitability—Assessment in tunchang, Hainan. Chin. J. Agric. Resour. Reg. Plan. 2017, 3, 27–35. [Google Scholar]
- Zou, H.K.; Hu, Y.; Li, Y.H.; Wang, B. Ecological sensitivity analysis of xining city based on GIS. Geomat. Spat. Inf. Technol. 2018, 4, 21–24. [Google Scholar]
- Xu, S.; Xu, D.; Liu, L. Construction of regional informatization ecological environment based on the entropy weight modified AHP hierarchy model. Sustain. Comput. 2019, 22, 26–31. [Google Scholar] [CrossRef]
- Stein, W.E.; Mizzi, P.J. The harmonic consistency index for the analytic hierarchy process. Eur. J. Oper. Res. 2007, 177, 488–497. [Google Scholar] [CrossRef]
- Xu, K.; Xu, J. A direct consistency improvement method for the probability- hesitant analytic hierarchy process. IEEE Access 2019, 7, 9445–9458. [Google Scholar] [CrossRef]
- Lai, V.S.; Wong, B.K.; Cheung, W. Group decision making in a multiple criteria environment: A case using the AHP in software selection. Eur. J. Oper. Res. 2002, 137, 134–144. [Google Scholar] [CrossRef]
- Chang, Y.Z.; Dong, S.C. Study on green ecological assessment of high-speed railway using unascertained measure and AHP. Teh. Vjesn. 2017, 24, 1579–1589. [Google Scholar]
- Li, J.; Wang, X.; Wang, X.; Ma, W.; Zhang, H. Remote sensing evaluation of urban heat island and its spatial pattern of the Shanghai metropolitan area, China. Ecol. Complex. 2009, 6, 413–420. [Google Scholar] [CrossRef]
- Nuthammachot, N.; Stratoulias, D. Fusion of Sentinel-1A and Landsat-8 images for improving land use/land cover classification in songkla province, Thailand. Appl. Ecol. Environ. Res. 2019, 17, 3123–3135. [Google Scholar] [CrossRef]
- McFeeters, S.K. The use of the Normalized Difference Water Index (NDWI) in the delineation of open water features. Int. J. Remote Sens. 1996, 17, 1425–1432. [Google Scholar] [CrossRef]
- Xu, H. Modification of normalized difference water index (NDWI) to enhance open water features in remotely sensed imagery. Int. J. Remote Sens. 2006, 27, 3025–3033. [Google Scholar] [CrossRef]
- Wang, L.; Jia, Y.; Yao, Y.; Xu, D. Identification and evaluation of land use vulnerability in a coal mining area under the coupled human-environment. Open Geosci. 2019, 11, 64–76. [Google Scholar] [CrossRef]
- Pettorelli, N.; Vik, J.O.; Mysterud, A.; Gaillard, J.M.; Tucker, C.J.; Stenseth, N.C. Using the satellite-derived NDVI to assess ecological responses to environmental change. Trends Ecol. Evol. 2005, 20, 503–510. [Google Scholar] [CrossRef]
- Nguyen, A.K.; Liou, Y.A.; Li, M.H.; Tran, T.A. Zoning eco-environmental vulnerability for environmental management and protection. Ecol. Indic. 2016, 69, 100–117. [Google Scholar] [CrossRef]
- Roy, S.; Bose, A.; Chowdhury, I.R. Flood risk assessment using geospatial data and multi-criteria decision approach: A study from historically active flood-prone region of Himalayan foothill, India. Arab. J. Geosci. 2021, 14, 999. [Google Scholar] [CrossRef]
- Yan, J.; Shi, W.; Li, F. Evaluation and countermeasures of the implementation of the lake protection and governance system in Wuhan city, middle China. Sustainability 2018, 10, 3379. [Google Scholar] [CrossRef]


Publisher’s Note: MDPI stays neutral with regard to jurisdictional claims in published maps and institutional affiliations. |
© 2022 by the authors. Licensee MDPI, Basel, Switzerland. This article is an open access article distributed under the terms and conditions of the Creative Commons Attribution (CC BY) license (https://creativecommons.org/licenses/by/4.0/).