Article

Application of Event Detection to Improve Waste Management Services in Developing Countries

1
Department of Computer Engineering, Aligarh Muslim University, Aligarh 202002, India
2
Department of Business Administration, College of Business Administration, Princess Nourah bint Abdulrahman University, P.O. Box 84428, Riyadh 11671, Saudi Arabia
*
Author to whom correspondence should be addressed.
Sustainability 2022, 14(20), 13189; https://doi.org/10.3390/su142013189
Submission received: 15 September 2022 / Revised: 10 October 2022 / Accepted: 12 October 2022 / Published: 14 October 2022
(This article belongs to the Special Issue Solid-Waste and Waste-Water Treatment Processes)

Abstract

:
This study illustrates a proof-of-concept model to improve solid waste management (SWM) services by analyzing people’s behavior towards waste. A deep neural network model is implemented to detect and identify the specific types of events/activities in the proximity of the waste bin. This model consists of a three-dimensional convolutional neural network (3D CNN) and a long short-term memory (LSTM)-based recurrent neural network. The model was trained and tested over a handcrafted data set and achieved an average precision of 0.944–0.986. This precision is promising to support the implementation of the model on a large scale in the actual environment. The performance measures of all individual events indicate that the model successfully detected the individual events and has high precision for classifying them. The study also designed and built an experimental setup to record the data set, which comprises 3200 video files duration between 150–1200 s. Methodologically, the research is supported through a case study based on the recorded data set. In this case study, the frequencies of identified events/activities at a bin are plotted and thoroughly analyzed to determine people’s behavior toward waste. This frequency analysis is used to determine the locations where one of the following actions is required to improve the SWM service: (i) people need to be educated about the consequences of waste scattering; (ii) bin capacity or waste collection schedules are required to change; (iii) both actions are required simultaneously; (iv) none of the actions are needed.

1. Introduction

In recent decades, urbanization has emerged as a major concern around the globe due to the massive shifting of people into urban areas for improved living standards. This rapid urbanization has created colossal challenges for cities in their development, especially in developing countries. However, developing countries have exhibited rapid socioeconomic growth. Consequently, urban cities with improved lifestyles are inflating in these countries. Municipal solid waste (MSW) generation is growing due to fast urbanization and aggrandized living standards [1]. One of the challenges in developing countries is solid waste management (SWM), as the yield of waste is directly proportional to the population of the city. MSW is defined as a highly nonhomogeneous by-product of residential, commercial, and institutional activities and mainly consists of household garbage, street cleaning, food residues, medical waste, and all other non-industrial solid waste [2,3]. The proportion of constituent components in MSW is highly inconsistent, but according to numerous studies, it has been predicted that organic materials majorly contribute to the MSW composition [3]. According to the World Bank report on global MSW, the amount of MSW generated around the globe was approximately 2.01 billion tons in 2016, and more than 33% of the total was not managed in an environmentally safe manner [4]. When taking a glance at global waste, it is anticipated that global waste generation will expand to approximately 2.2 billion tons per year by 2025 [5] and 3.40 billion tons by 2050, which is more than double the population growth over the same period [4]. Low- and middle-income countries produced around 64%, or 1327 million tons, of the total global waste and it is estimated that waste generation per capita per day will grow by 40% or more in 2050 [4]. In low-income countries, the total amount of waste generation will increase by three or more folds by 2050 [4]. The yield of MSW is tremendously growing in the urban regions and metro cities of developing countries [6]. If these residues are not handled through appropriate management, they can damage the environment and human and animal health [7].
Following the World Bank report “What is waste 2.0” [4], lower-income and lower-middle-income countries collected 39% or 37 million tons and 51% or 299 million tons of waste generated in 2016, respectively. This report shows how proper management of MSW is required from its inception to its disposal. Solid waste management (SWM) is one of the primary services among all essential services of the urban civic body. It is a critical problem in most urban areas of lower-income and lower-middle-income countries such as India. Generally, MSW does not receive considerable attention, as it utilizes a significant proportion of the urban government budget without any monetary or economic remuneration [7]. SWM services primarily consist of collecting waste from bins or households and its transportation to waste treatment plants or landfill facilities. In developing countries, SWM issues do not only arise due to ineffective handling of waste by the municipal administration but also negligence or negative attitudes of the people toward waste. In this study, the existing SWM system, associated working processes, and people’s behavior toward waste were recorded through a survey. The survey observations are thoroughly examined here, and some major issues are identified. These issues are broadly divided into two categories based on accountability.

1.1. Lack of Awareness

The survey observations indicate that a lot of people in developing countries do not possess a positive attitude toward waste due to a lack of knowledge about the impact of scattered waste on the environment, human and animal health, and the city’s reputation. Thus, people do not take proper care when they throw away their daily household waste. Therefore, waste is thrown outside the waste bin or scattered around the bin, even if it is not full or overflowing. This scattered waste generates a dirty and unhealthy environment in residential areas and highly affects the cleanliness of the city. It also produces a bad odor and greenhouse gases (methane and carbon dioxide), which enormously impact the air quality. There is a need to identify areas where people have shortcomings in their knowledge about the consequences of mishandled waste, so that in these regions, governmental and non-governmental bodies can run awareness programs and advertisements to enhance people’s knowledge about the negative effects of scattered waste. It is not practically possible to perform the survey in the whole city to discover the patterns in people’s behavior toward waste, so it is not feasible to identify regions where the highest level of attention is needed to make people aware. There is a need to develop an automated, cost-effective, and efficient solution to deal with this problem. The literature analysis indicates that machine learning is an optimal alternative to detect and process the events related to human behavior toward waste.
Information and communication technology (ICT) is identified as a solution to make the system more effective and communicable. The proposed model utilizes the existing infrastructure of city surveillance and the SWM system for large-scale practical implementation. The reason for the integration of existing resources in developed solutions is illustrated in the subsequent sections.

1.2. Lack of Utilization of Existing Infrastructure

In economically weak countries, the governments are not competent to allocate adequate funds to manage MSW, so civic bodies have limited resources and lack the technology to operate the SWM system efficiently. The working procedure of the current SWM system is analyzed, and major reasons are identified for waste dissemination around the waste bin. One key reason for bin overflow is the size. In this case, the bin has insufficient capacity to accommodate all the waste dropped between two consecutive visits of the collecting truck. In studied areas, waste collection from bins is generally carried out once a day. Another reason for waste flooding around bins is uneven collection, as the bin size has enough capacity to hold the amount of waste dropped throughout the whole day. The scattering of waste in the bin’s proximity is also an issue, previously elaborated.
The municipal governments in developing and under-developed countries always face financial crises in developing and operating the SWM infrastructure and services [8]. Thus, they have a limited number of SWM resources and cannot use the advanced technology-based modern SWM solutions used in developed countries. Moreover, waste generation is tremendously growing with increasing urbanization and living standards. Therefore, municipal administrations continuously face multiple challenges in managing the generated waste. There is a need to use a technology-based, cost-effective solution to make the SWM system more effective and efficient in time and energy. If the existing SWM and surveillance system of a city are integrated with machine learning techniques, the outcomes would be highly cost-effective. They could be implemented practically to a large extent. Our proposed system utilizes the surveillance system to capture video data, which are further used as input data for artificial neural network training. The research implements the convolutional neural network (CNN), a class of artificial neural networks, to detect and identify the type of event related to human behavior toward waste. This low-cost and highly efficient solution will be the best alternative for handling waste in developing countries, and the practical implementation of this solution at a large scale will help to maintain a clean, green, and sustainable environment.
Machine learning comprises the collection of techniques from artificial intelligence (AI) aiming to develop and build systems that can learn from data, enhance their accuracy through training, and make decisions automatically without being explicitly programmed. Machine learning techniques provide remarkable computational features, so machine learning applications have reached a peak in all fields of engineering and science. Similarly, deep learning (DL) is a subset of machine learning, and CNN is a disruptive class of deep neural networks interchangeable with DL. CNN has exhibited a remarkable advancement in image recognition. Generally, CNNs analyze visual data and perform tasks beyond image classification. They can be recognized at the core of all computer vision tasks, such as photo tagging, autonomous vehicles, event detection, surveillance, and medical image analysis. In the past few years, they have become dominant in many computer vision tasks. Therefore, researchers from diverse domains, including SWM, have been involved with tremendous interest [9]. CNN models can automatically learn complex tasks and hierarchies of spatial features compared to handcrafted features. They perform adaptive learning through a backpropagation algorithm by employing multiple convolutional, pooling, and fully connected layers. Due to these exceptional advantages, these models can be effectively used for waste dump detection, different types of waste detection and classification, and event detection in the waste monitoring system.
Nowadays, video surveillance systems have become necessary, from residential safety to traffic management and control. These systems have gained notable popularity for security purposes. The recorded videos from these systems have gained attention not only for the panoramic scenes but their intelligent features, such as object detection, face detection and recognition, motion detection, and event detection. Therefore, there has been massive growth in video data due to the extensive utilization of surveillance systems. It is necessary to understand the video data to make more efficient use of surveillance system data. Ordinary surveillance systems have substituted advanced technology-based intelligent systems with real-time processing and analysis of these large video data. One of the key features of an intelligent surveillance system is different types of event detection in real-time video data. These events can be used in other frameworks to improve services, make decisions, and implement decisions. Event detection has emerged as the most prevalent research topic in computer vision. Event detection is not a cumbersome task, but specific types of event detection are complicated and challenging, as the scenes of specified events are diverse. Additionally, it is tough to define the boundaries of different events. The proposed system incorporates multiple cameras for recording streaming videos to create the experimental data set.
Conclusively, this research aims to implement the state-based system using 3D CNN to automate waste bin monitoring and identify residents’ behavior toward waste disposal. The study makes the following contributions to the knowledge pool of SWM to deliver the above objectives.
  • We built an experimental setup and created a data set of 3200 video files. These videos have durations of 150–1200 s and were captured at various city locations for 15 days. Additionally, captured data are preprocessed and labeled to generate the ground truth.
  • The main contribution of the study is exploiting the computational capabilities of 3D CNN to identify the events related to waste thrown in the waste bin and its proximity. These events determine the position of waste thrown, i.e., if waste is successfully placed inside the bin or thrown outside the bin due to improper handling, or dropped outside due to the overflow of the bin.
  • An analysis of the identified events through a case study was performed to develop an effective waste management infrastructure, policies, and awareness to improve SWM services.

2. Literature Survey

MSW is one of the most urgent issues in urban and smart city development, especially in developing countries. SWM is a multi-disciplinary research topic that focuses on developing waste collection, transportation, and disposal processes and related issues. Much research has been carried out to determine optimal waste collection schemes using various optimization techniques and to develop novel methodologies for energy recovery from waste and environmentally safe waste disposal. Tirkolaee et al. and others have implemented several state-of-the-art optimization techniques, such as Pareto-based algorithms [10], mixed-integer linear programming [11], hybrid augmented ant colony optimization [12], gray wolf optimization algorithm [13], and hybrid simulated annealing algorithm [14]. However, SWM issues are not limited to these; they comprise many social-level problems that need immediate attention to improve services and cleanliness in the city area. A survey was carried out to monitor existing bins placed by the municipality in residential areas to determine the primary reasons behind the scattering of waste in the bin’s proximity. Three types of activities/events are primarily observed:
  • The bin status is not filled or overflowing, and the waste is dropped directly into the bin.
  • The bin condition is not filled or overflowing, but the waste is thrown intentionally or unintentionally in the proximity of the bin.
  • The bin status is filled or overflowing, and then the waste is dropped outside the bin.
The first two activities are associated with people’s behavior, while the third is related to the bin capacity or waste collection schedule. In the first two scenarios, the people are responsible, but the municipal administration is accountable in the third case. The scattering of waste around the bins would be controlled using the proposed event detection and classification system. This system identifies locations where these events/activities occur with high frequency. Then, municipal administrations can perform necessary actions in identified areas, such as running an awareness program to educate people about the effects of waste scattering, modifying the waste collection schedule, and changing the bin capacity.
The municipal administration data show that a city with an average population has a large number of bins. Therefore, it is impossible to manually monitor every bin to identify the earlier events. Moreover, manual monitoring needs a significant amount of capital and human resources. Now, bin monitoring can be performed using event detection in video footage. The videos can be recorded using an existing surveillance camera by placing the bins in the camera view. The main objective of event detection in a video is to determine the occurrence of any specific event. For event detection, first, the occurrence of an event is recognized, and then the type of event is identified, as described in the proposed work. Event detection in a video is extensively used in many artificial intelligence systems, such as robotics, electronics, road safety, autonomous driving, intelligent transportation systems, and content identification. Recently, DL models have produced remarkable results in computer vision and pattern recognition, such as action recognition [15], abnormal event detection [16], object detection [17], recognition and tracking, behavior analysis [16], and face detection and recognition [18]. DL models can learn all aspects directly from the image, which has improved object detection and recognition. Alex Krizhevsky designed and implemented a deep CNN named AlexNet [19] that exhibited excellent outcomes for image classification tasks in the Large-Scale Visual Recognition Challenge [19]. Additionally, AlexNet has successfully introduced audio and video recognition, medical data analysis, and image processing [20]. Recent research has emphasized deep CNN models to detect and recognize events in various systems such as surveillance, road safety, intelligent traffic, and health diagnosis.
This segment of the literature survey discusses some state-of-the-art works that implement image processing and DL algorithms to solve various problems in SWM, such as bin monitoring, waste detection and identification, and waste material detection. Different image detection and recognition techniques have been applied in SWM and waste processing tasks [21]. Image detection and recognition are primarily utilized to segregate waste material and objects [22]. Waste collection routes and schedules have been determined based on the current waste level in the bin using image processing [23]. This approach localizes the bin in the image and applies a support vector machine (SVM) for classification with four masks to compute the level of waste in the bin. The bin can have different shapes and sizes with empty, semi-empty, filled, and overflow waste conditions. In the earlier phase of research that comprises advanced technology-based solutions for various problems in the SWM system, Hannan et al. applied a content-based image retrieval approach to predict the waste level in the bins based on the features extracted from the image texture [24]. In this approach, several distance measures are utilized to compute and compare the similarity between the images. The performance of implemented feature extraction techniques is evaluated on a test data set of 250 images, and the accuracy of different similarities distances is compared. The comparison of similarity distance outcomes shows that the earth mover’s distance has the highest precision to measure the similarity of images and shows more efficiency than other distance methods. In [25,26], the author has reviewed and analyzed the information and communication technologies (ICTs) and their applications in various SWM tasks. This systematic review of ICTs concluded that ICTs have emerged as an integral part of the SWM architecture design. The study divided the ICTs into four broader categories—spatial, identification, data acquisition, and communication technologies—to develop efficient waste collection and monitoring systems for effective management. Image processing techniques in SWM applications mainly concentrate on the waste level in the bin and on sorting different waste materials and objects. Additionally, this review identified the numerous barriers to building a large-scale MSW system for urban and smart city development. These barriers are inadequate MSW data, expensive network structure development and maintenance, lack of real-time data transfer and information availability, and unavailability of dynamic routing and scheduling.
Nowadays, many researchers have focused on automating waste collection, monitoring, segregation, disposal, and management tasks to make the system and recycling process more effective and efficient. The research community has given significant attention to image processing-based solutions for SWM systems in the past few years. Various interesting solutions comprising a wide range of approaches and techniques have been suggested and successfully implemented with remarkable outcomes. DL techniques have been successfully applied to separate different types of waste materials. In [27], the DL strategy is explored to build a novel waste segregation framework that applies the YOLOv3 algorithm using the Darknet neural network. This system is trained for six classes, namely cardboard, paper, plastic, biodegradable material, glass, and metal, and compared with the YOLOv3-tiny to assess the YOLOv3 algorithm performance and competency. The experimental outcomes report 85.29% and 26.47% accuracy for YOLOv3 and YOLOv3-tiny, respectively. These outcomes prove that the YOLOv3 algorithm has the generalization power for the different categories with various waste items and materials. In a project report, Yang and Thung demonstrated a machine learning technique to categorize waste into six categories. They constructed a data set named TrashNet, with a database of 2527 images of solid waste for all six categories. They applied the SVM with scale-invariant feature transform algorithm and handcrafted feature extraction-based classification and obtained 63% and 22% accuracy for CNN, respectively. Interestingly, they found that SVM has a significantly better performance than the CNN model. In this case, CNN could not obtain the optimal hyperparameters during the training phase [28]. Bircanoğlu et al. used various CNN architectures on this data set and attained maximum accuracy of 95% by image augmentation [29].
Similarly, Ruiz et al. randomly assigned the initial weights to the CNN model and obtained an accuracy of 89% [30]. In [31], the TrashNet data set is improved by adding more images of trash. The authors also constructed a synthetic data set to identify the roadside waste dump in this study. This synthetic data set was generated by segmenting waste, changing the backgrounds, and reaching the maximum accuracy of 84%. A hybrid model was developed by fusing autoencoder, CNN, and SVM to categorize the waste as biodegradable, recyclable, and non-recyclable with approximately 100% precision over 2000 images [32]. Chu et al. combined weight and metal detection sensors with the CNN model to develop a multilayer hybrid model for classifying waste into recyclable and non-recyclable categories. The result analysis implies that this model has significantly higher classification performance than CNN and obtained overall classification accuracies are 98.2% and 91.6% under two different testing scenarios. In this novel architecture, CNN extracts the visual features, while sensors are utilized to capture physical attributes [33]. Another study proposed a CNN model to classify the electrical appliances and a faster region-based CNN to determine the dimensions of appliances, showing precision of more than 90% [34]. The literature analysis also unveils that many research studies utilize the existing pre-trained state-of-the-art models to perform waste identification and classification tasks. In [35], four CNN models, namely Alexnet, VGG16, GoogLeNet, and Resnet, pre-trained on ImageNet, were fine-tuned to predict six waste categories. Moreover, a performance comparison was performed among all CNNs models using SVM and SoftMax as a classifier, and the highest classification accuracy is demonstrated with GoogLeNet+SVM at 97.86%.
The studies above mainly concentrate on framework design using different CNN architectures for waste categorization. Still, the Internet of Things (IoT) has been significantly applied to solve waste management problems. In [36], the authors designed a novel framework to automate various SWM processes. The framework comprises an intelligent garbage bin that incorporates an ultrasonic sensor and multiple gas sensors. This framework also provides the real-time monitoring of garbage using cloud servers and mobile applications. Singh et al. and Malapur and Pattanshetti implemented a similar framework with an intelligent, cost-effective, and time-deductive design for smart city SWM services. This system has a GSM module to send a message to the user’s mobile number when the waste level in the bin reaches the threshold level and a passive infrared sensor to measure the waste level [37,38,39]. An IoT-based model was built using Raspberry Pi and infrared sensors. In this system, the SWM system administrator performs the collection vehicle scheduling and routing for efficient waste collection [40]. In addition to waste classification and bin-level detection, Muthugala et al. developed a robot prototype for waste picking from the ground. The experimental results exhibit that the implemented prototype architecture utilizes the DL model to detect waste on the ground and reported an accuracy of 95% [41]. In [42], a similar novel robot was built to pick up waste on grass. The prototype of this novel robot incorporates deep CNN-based custom software to detect the waste accurately and navigate autonomously. The experimental outcomes show that it achieved more than 95% waste recognition accuracy and provided similar cleaning efficiency as the manual method. Many studies have also applied the different CNN models to detect and locate illegal dumping [43].
The literature analysis illustrates that the contributions of SWM researchers have primarily concentrated on two aspects, namely waste bin monitoring and waste detection and classification. Many waste management and computer vision community researchers have focused on waste detection and classification using image processing through artificial neural networks, especially CNN. Waste detection and classification are generally used at recycling centers to segregate waste items and materials. However, this segregation process has also been used at the source level. This process mainly contributes to making the recycling process more effective and efficient. Waste segregation cannot determine people’s behavior toward waste and cleanliness in residential areas. The bin monitoring covers the waste level detection inside the bin using various technologies, namely IoT, sensors, image processing, video processing, machine learning, etc. The waste level is measured to determine the bin condition: empty, semi-empty, full, or overflowing.
Additionally, the location of full or overflowing bins is used in optimization algorithms as nodes to determine the optimal paths and schedules for waste collection vehicles. The existing bin monitoring systems do not cover the following condition(s): bin is not filled or overflowing, but the waste is dropped intentionally or unintentionally in the proximity of the bin. This condition depends on the people’s behavior toward waste and cleanliness in the surrounding area and city. The existing monitoring system entirely depends on the assumption that everyone behaves positively toward waste and drops the waste directly into the bin. However, our survey results indicate that people do not exhibit serious behavior toward waste and cleanliness, especially in developing countries. The survey also shows that some people lack knowledge about the consequences of littering around bins. Therefore, they throw their waste outside the bin, even if it is not full or overflowing. Moreover, some people habitually engage in this type of activity.
Contrary to the above scenario, a significant number of people, especially in urban areas, are aware of the consequences of littering waste around bins. Still, people mostly find bins full or overflowing when they throw their waste. They are forced to drop the waste outside the bin in this situation. The survey analysis identifies the primary reason for this situation: the capacity of the bin is not enough to hold the amount of waste dropped between two consecutive visits of the waste collection vehicle, or the waste collection service is not regular. This scenario indicates that municipal administrations lack the infrastructure and human resources to run waste management services seamlessly. It is thus necessary to develop an automatic system to determine people’s behavior toward waste and the demand for infrastructure and human resources. Now, municipal bodies can develop policies and plan to deal with problems that arise from people’s behavior and the lack of infrastructure and human resources.

3. Proposed Model

This section describes the proposed event detection and classification model workflow to determine and analyze people’s behavior toward waste. This behavioral analysis is utilized to identify areas in the city where people lack knowledge about the consequences of waste scattering and open dumping. The study of classified events is also performed to determine the bin capacity, the number of bins, and the waste collection schedule. Based on the above outcomes, the municipal administration can design policies for waste awareness programs and place adequate bins with appropriate capacities to improve SWM services. First, the overall workflow of the event detection and classification model is illustrated, and then different components are explained.

3.1. Overview

The overall workflow of the proposed event detection and classification for the SWM improvement is depicted in Figure 1. The proposed model is a state-based system that takes a continuous video stream input and generates a corresponding output stream. First, overlapping groups (with stride S) of successive’ N’ frames from the input video stream are generated. These groups are used as the input for a 3D CNN-based network block 3.2, which yields a corresponding vector for each group. These vectors are further processed by an LSTM-based network block 3.3, which updates the current state of the block and generates the output vector. The output of the LSTM block is finally passed through a fully connected feed-forward neural network (FFNN) block to produce the final decision vector. The decision vector is a four-element vector. These elements represent the probability of an event/activity (event/activity is referred to as the event in onward discussion) in the current time duration. The first element is the probability of any event occurring in the proximity of the waste bin. The second element is the probability of an event related to the bin (interaction with the bin). The third element is the probability of successful interaction with the bin (the waste is successfully dropped in the bin). The fourth element is the probability of unsuccessful waste placement in the bin due to overflow. Table 1 displays a brief description of the decision vector. The current video frame group of ‘N’ frames is constituted by the current and previous ‘N−1’ frames. The model does not require a high rate of output generation. Therefore, we stride the two conjugative groups by ‘S’ frames to decrease the total output generated by the model in one unit of time. We designed the model to have N = 51 frames and the stride S = 8. The decision vector generated by the model is stored with its timestamp and camera ID. These stored decision vectors are further utilized to develop bin infrastructure, policies, and waste awareness programs to improve the SWM services, city cleanliness, and green environment (refer to Section 3.6).

3.2. 3D Convolutional Neural Network Block

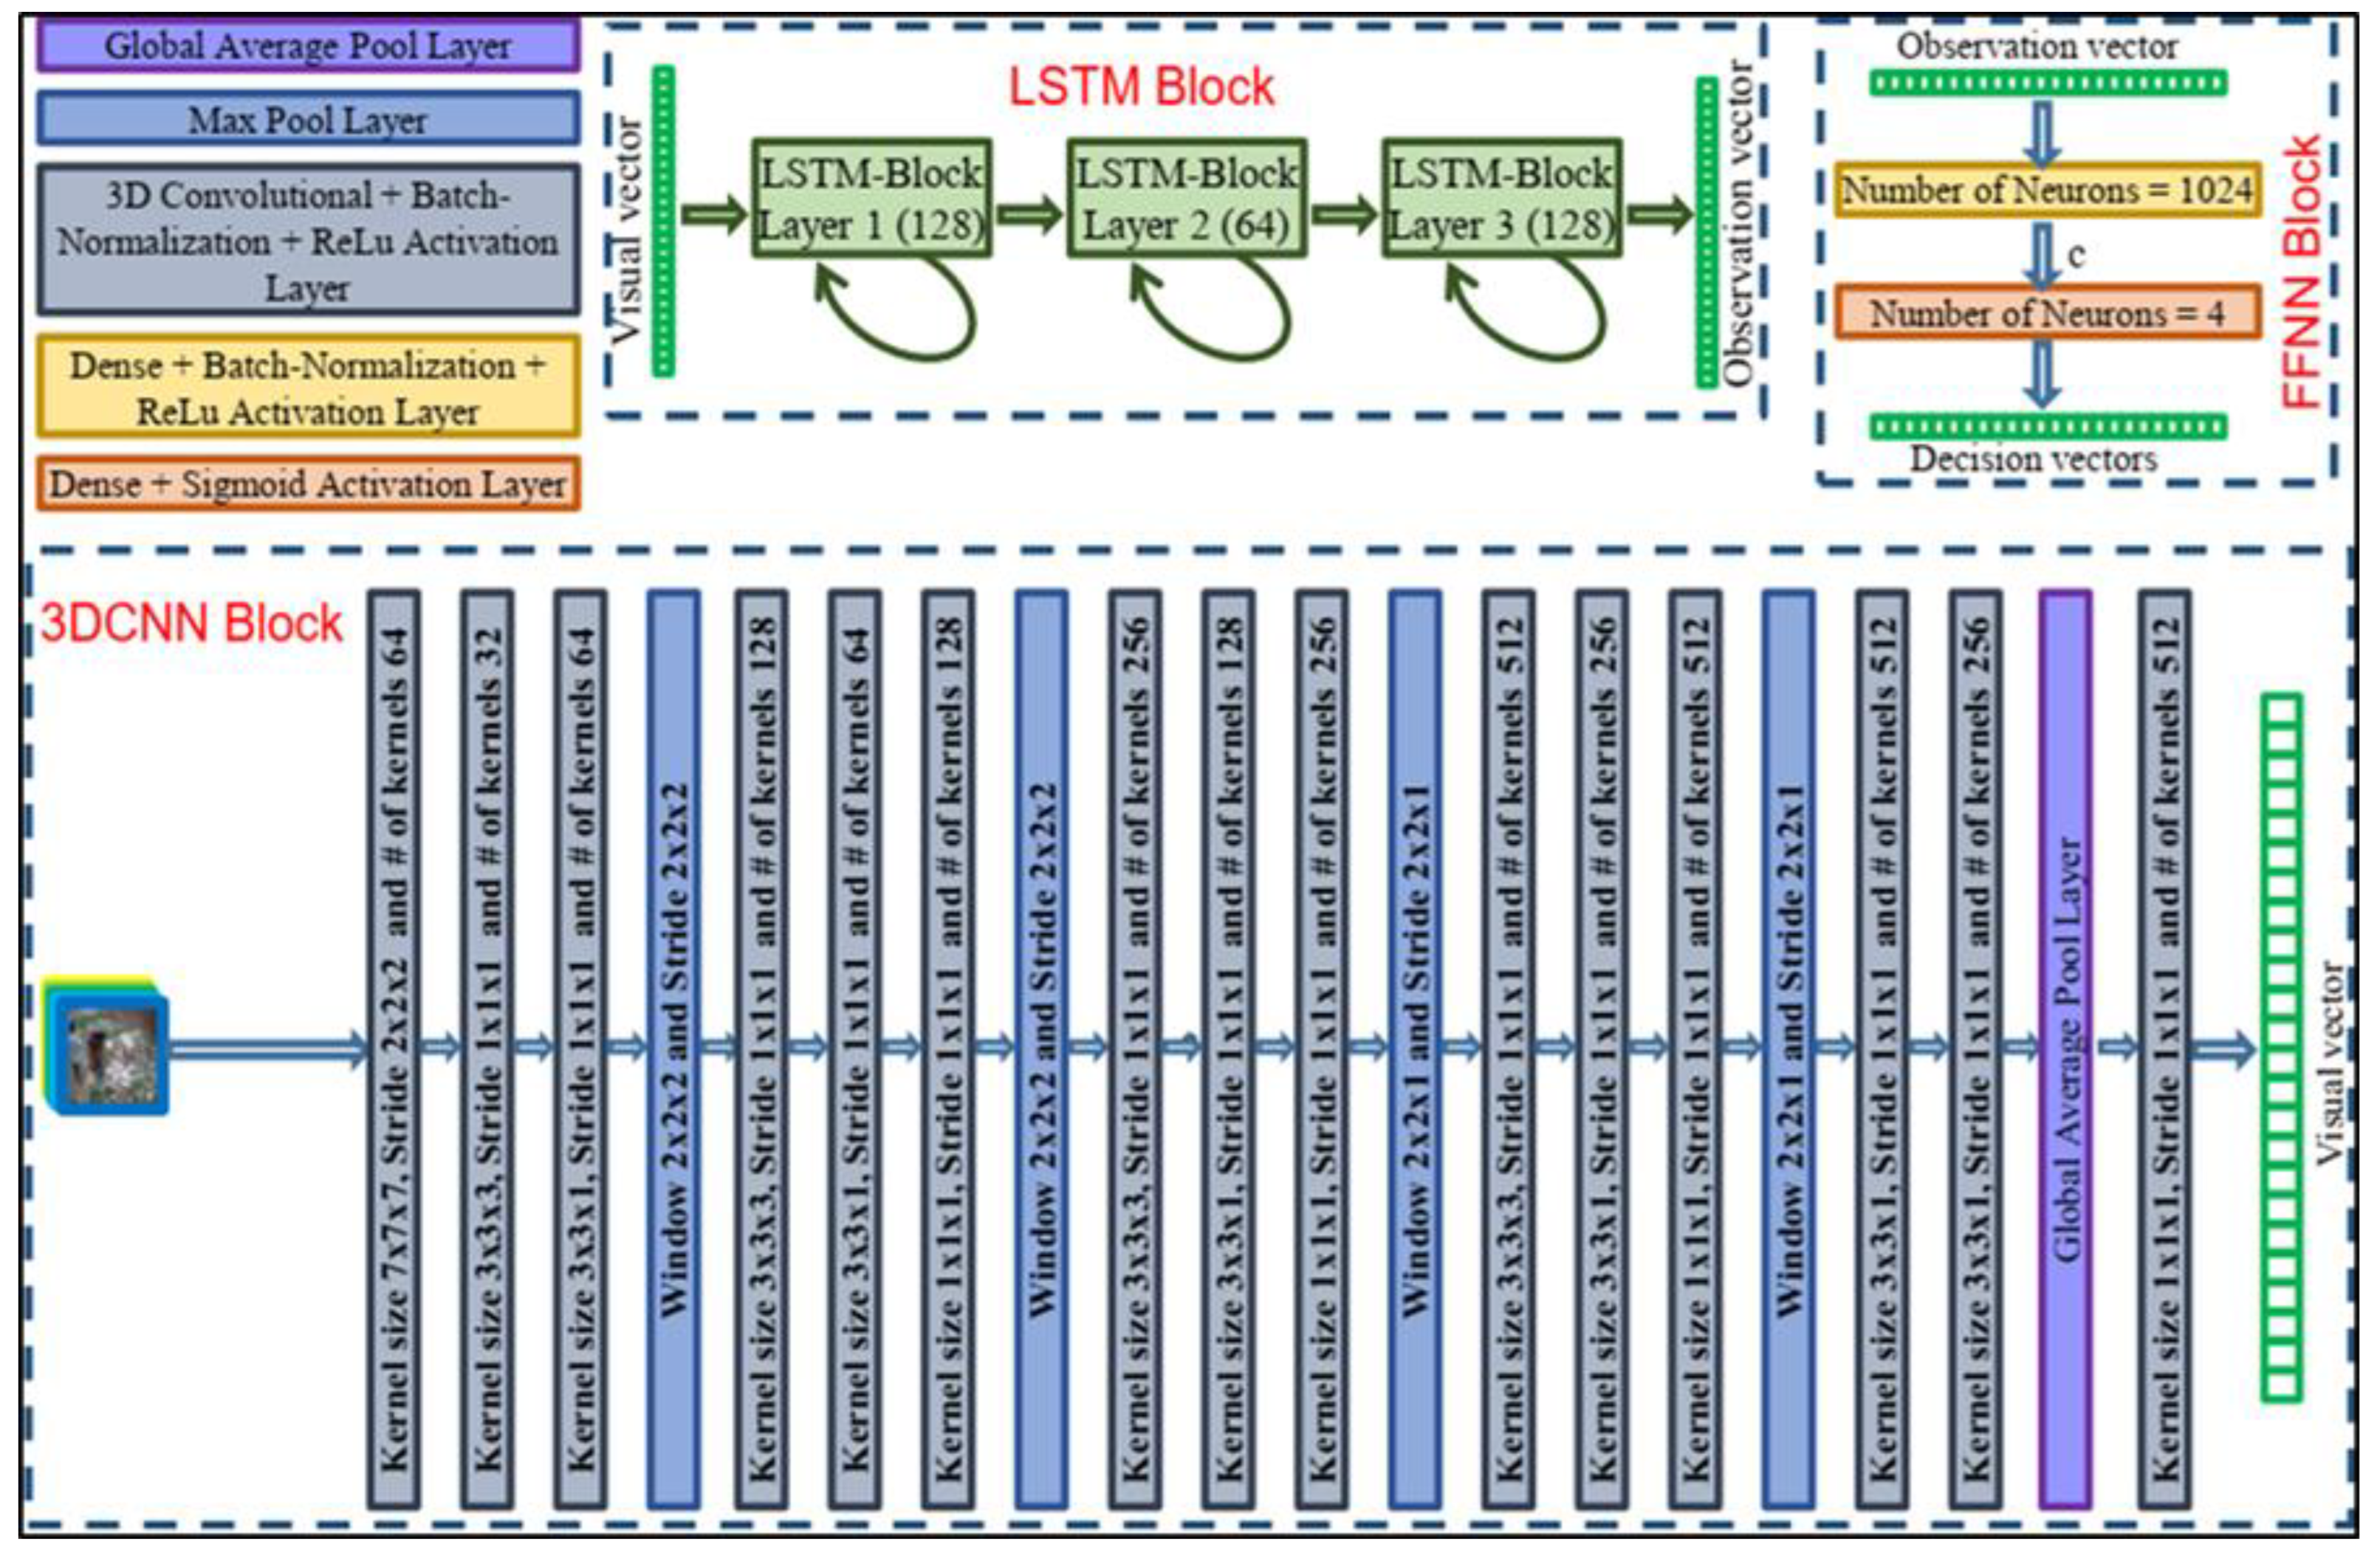
This block generates visual features for a group of ‘N’ continuous frames from the input video stream. These features should incorporate the whole video frame group (covering all N frames and the entire image frame, height, and width). The performance of a two-dimensional CNN layer for encoding the spatial information of an image is satisfactory, but we need to cover spatial and temporal (frames of different timestamps) data from the group of image frames. The 3D CNN and recurrent network (e.g., LSTM) are commonly used to encode temporal data. We utilized the 3D CNN block for feature extraction, including spatial and temporal information. This block consists of various layers, namely 3D CNN, addition, batch-normalization, and pooling layer. The architecture of this block is depicted in Figure 2 with the kernel size and stride of different layers (as width × height × temporal). No padding is used in the convolution and pooling layers as we want to reduce the feature size as a one-dimensional vector. The block’s effective receptive field is height × width × 51 (this block covers the whole image frame and 51 conjugative image frames). We assume a video is generated with a frame rate of f frames/second, then the output rate of the system will be f ∕S output/second as the stride between two groups is S (we used S = 8). The vector generated by the 3D CNN block is passed to the LSTM block (refer to Figure 2) for updating the state of the system and developing its output at that time duration (last 51 image frames 51/f s).

3.3. Long Short-Term Memory Block

The time for an event/activity has significant variance. There are some events/activities which occur instantaneously, whereas some take time. The model should incorporate all types of events and encode them to form a state vector and its output (observation) vector. The stateful LSTM layer fulfils these requirements. Therefore, we utilized three LSTM layers to create a network block to produce the desired outputs. These LSTM layers have 128, 64, and 128 as output neurons. Thus, this block generates a 128-dimensional vector which is further passed to an FFNN block to generate the final decision vector. The architecture of the used LSTM block is shown in Figure 2.

3.4. Fully Connected Feed-Forward Neural Network Block

We need a system to detect exciting events and activities. Besides this, it should also differentiate them into various categories. An FFNN is a conventional model for the desired purpose. The proposed system also utilizes the FFNN for generating the final decision vector. The decision vector is a probability vector, and the events are not mutually exclusive. Therefore, we deployed the sigmoid activation function at the final layer of the FFNN block. The architecture of the FFNN block is shown in Figure 2.

3.5. Training Loss Function

We adopted a derivative of focal loss [44] as the cost function for learning the proposed model. The cost function is expressed as the following equation.
L o s s = c e l l H S D V c e l l < 0.9 ( 1 D V c e l l ) γ × log ( D V c e l l ) | H S |              + c e l l L S D V c e l l > 0.1 ( D V c e l l ) γ × log ( 1 D V c e l l ) | L S |
The loss is the modified focal loss, and DV represents the generated decision vector. DVcell is one element of the decision vector, HS is the set of elements of the decision vectors labeled as High, and LS is the set of elements of decision vectors labeled as Low. The focal loss hyperparameter γ is set to 2.0.

3.6. Interpretation of Output Decision Vector

This section illustrates the output decision vector in terms of occurrences of different events. The model stores the generated decision vector with its timestamp and camera ID. A wide range of information can be extracted from these data. These data can obtain the number of EA2 events in a camera location during a specific period. This information identifies the locations with a high number of waste-dropping/throwing activities. These locations are potential points where waste may scatter in bin proximity due to overflow. The number of event occurrences EA2 determines the required bin capacity to hold the waste and waste collection schedule.
Besides this, the frequencies of occurrence of events EA3, EA4, and EA5 at any bin location serve to categorize the behavior of the people who drop their waste in that bin. The high frequency of event EA3 at any bin location implies that neighboring people pay attention to dropping waste in the bin and know the consequences of scattering waste. Suppose any bin faces high frequency of the event EA4. This indicates that people lack knowledge about the impact of waste scattering and do not possess a positive attitude, so they mishandle the waste and drop it outside the bin. In these bin locations, municipal administration should run an awareness program to educate the people about the impact of waste scattering on human health and the environment.
Similarly, if any location has a high frequency of the event, EA5 implies that people are aware of the consequences of waste scattering. In this case, waste is overflowing, and it is scattered due to less bin capacity. Therefore, more bins in the nearby areas may be necessary or bin capacity should be increased to hold the waste dropped in two consecutive collections from bins or waste collection frequency should be increased.

4. Experimental Setup

4.1. Data Generation

We designed an experimental setup to create a data set for analyzing people’s behavior toward waste. It comprises various cameras installed at different locations, and each camera has one waste bin in its viewing scene. These cameras are run for two weeks to record the activities of people in the proximity of the bin. The final data set contains 3200 video files of different durations between 150–1200 s, and these videos mainly comprise activities/events for most of the time.
A preprocessing step is not a vital phase for a CNN-based system, but it can reduce the total training time and sometimes improve the system’s performance. Besides this, it is also instrumental in appropriately representing the input data for the subsequent phases of the system. We designed a 3D CNN block with a receptive field of 255 × 255 × 51 without the global average pooling layer. This receptive field is sufficient to cover the spatiotemporal information inside the given group of continuous image frames. We resized the image frames so that their smaller side is 255 pixels. Most of the parts of input images are incorporated into one vector (visual vector). Bigger (one side only) images produce multiple vectors. The global pooling layer averages these vectors to yield a single vector corresponding to its continuous frames group. The number of frames in a group is also taken as 51 (3D-CNN block fully covers 51 frames).

4.2. Label Generation

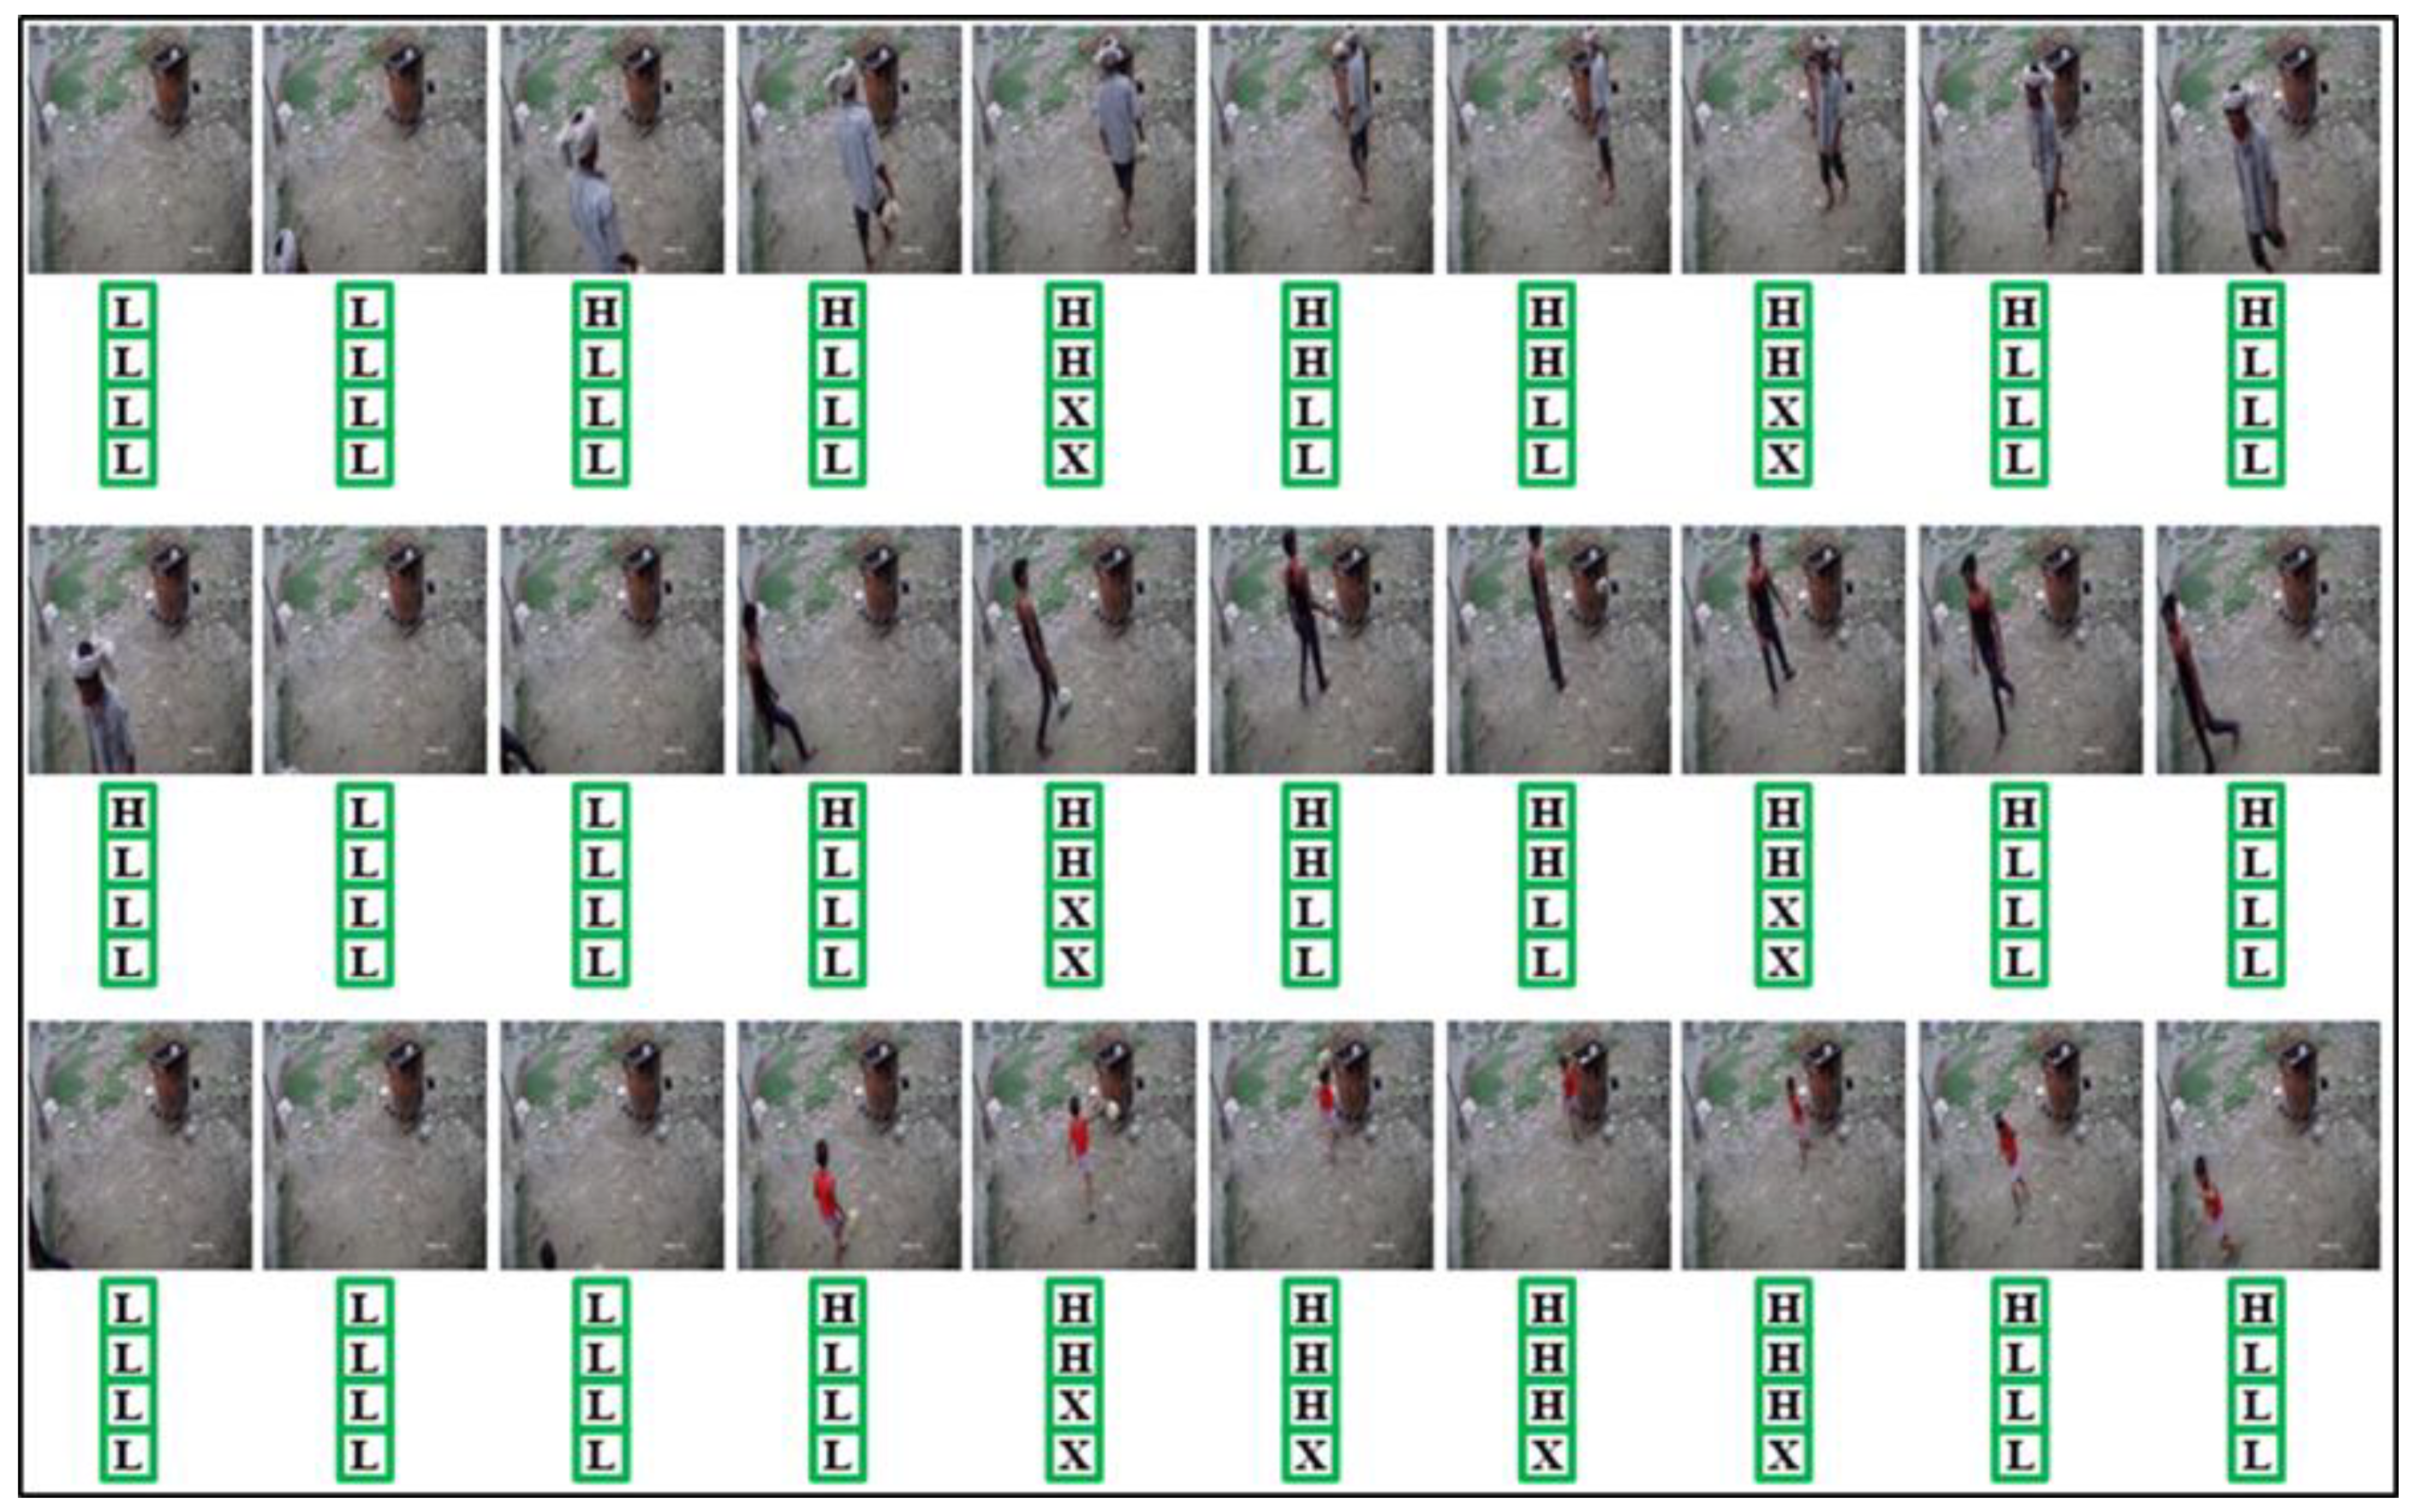
The proposed supervised machine learning model requires the ground truth label corresponding to each image frame group; therefore, we must generate these labels. The needed ground truth label is a four-element vector (decision vector), and each element is represented by H (high), L (low), and X (don’t care). First, starting and ending frames are marked corresponding to each EA1 (refer to Table 1) event in all available experimental videos. All the frames between these starting and ending frames are assigned as low-probability vectors. The first element of the decision vector for other frames is set as the high probability (H). For all the frames corresponding to EA1, mark the starting and ending frames for EA2. All frames (EA1) between the starting and ending frames of EA2 are set as high probability (H) for the second element of the decision vector, and the rest of the EA1 frames are set as don’t care (X).
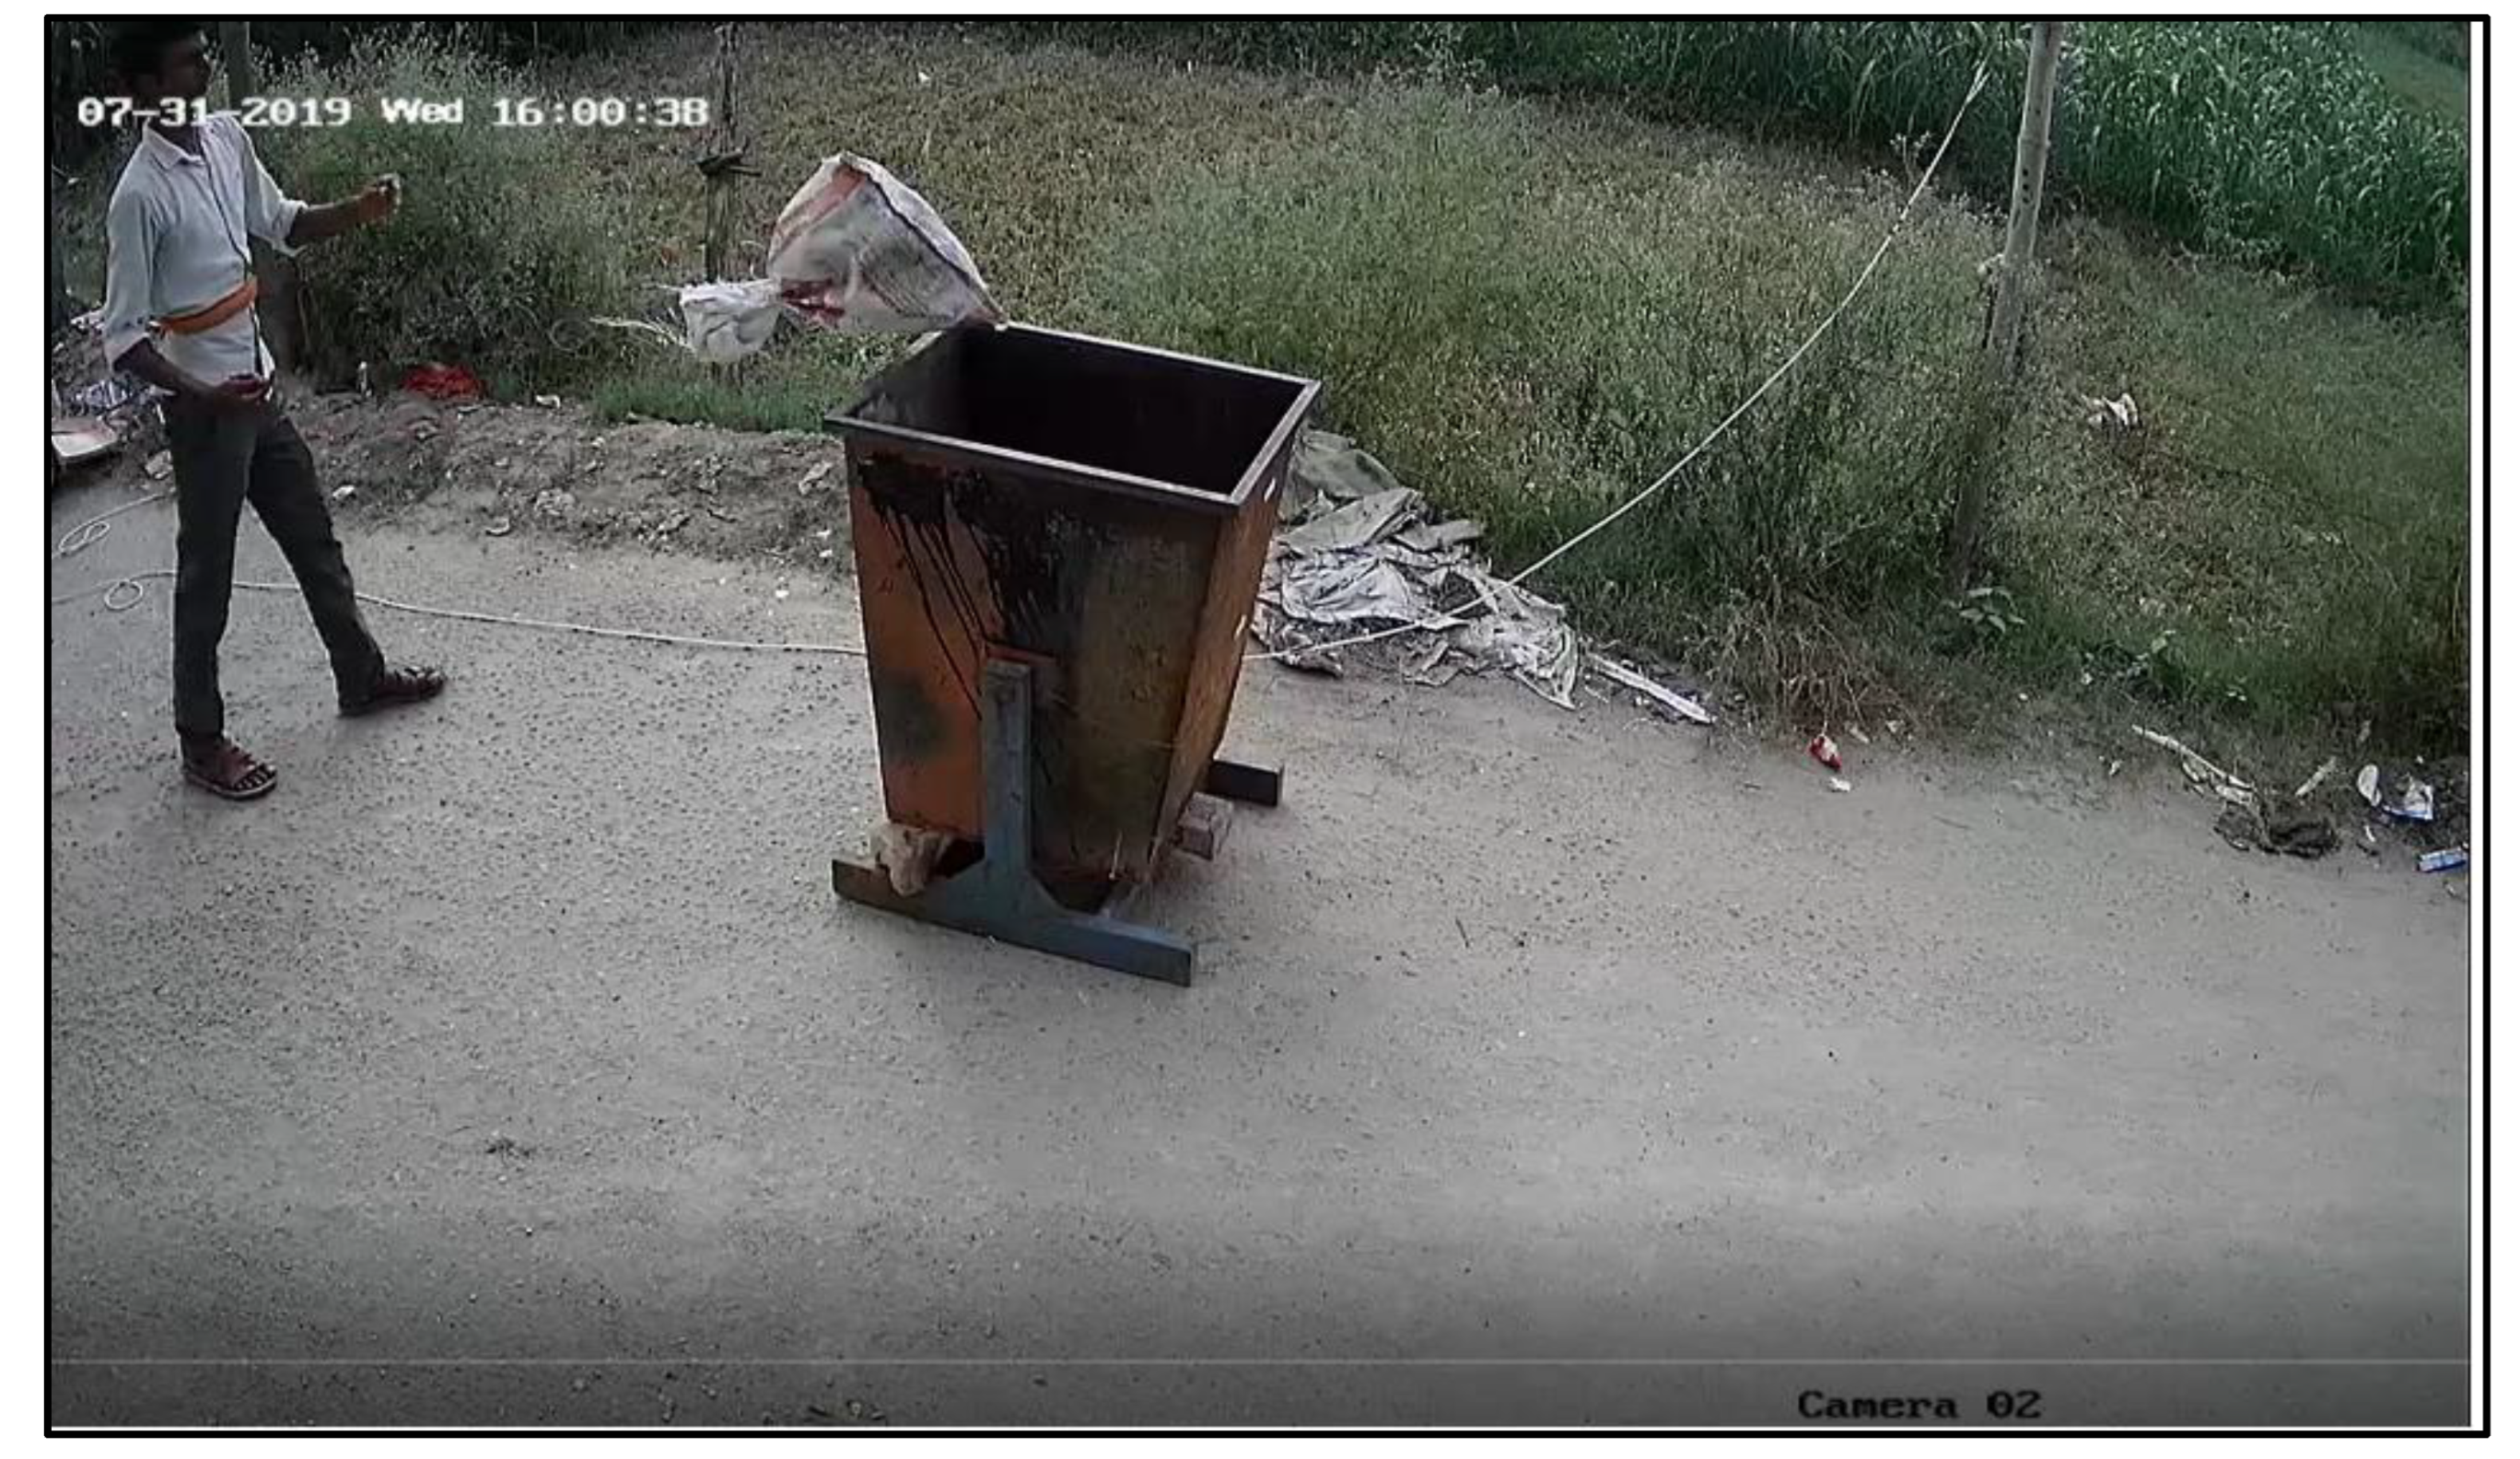
Similarly, all the frames corresponding to EA1EA2 set the third element of the decision vector as high probability (H) if the waste is placed successfully in the waste bin; otherwise, it is set as low probability (L). Finally, the fourth element of the decision vector is set as high probability (H) if an unsuccessful placement of waste in the bin is captured due to the overflow of waste; otherwise, the fourth element is set as low probability (L). One random frame from the successful placement of waste in the bin event is depicted in Figure 3, and an exemplification of label generation is presented in Figure 4.

4.3. Training Procedure

We adopted data augmentation in the training of the model to increase the variation in the data and the training samples. We employed the arbitrary rotation with rotation angle θ rotation ∈ [−15°, 15°] and random shearing with shearing angle θ shear ∈ [−5°, 5°]. The data augmentation parameters remain the same for all frames in a video sample. The loss is given by Equation (1) (refer to Section 3.5) and is used as a cost function for learning the proposed model. The LR regularization is used as a regularizer with a scale of 10−5. The stochastic gradient descent algorithm is utilized as an optimizer, with the learning rate decreasing exponentially. The opening learning rate is 0.1, and the final learning rate after 10,000 iterations is 10−4. After 10,000 iterations, we applied a linearly falling learning rate as Equation (2). We trained the model for 100,000 iterations with a batch size of 4.
L R = 10 4 ( 1.001 i t e r a t i o n C o u n t e r 10 5 )

4.4. Inference Phase

4.4.1. Offline Mode

In this mode, the testing data are stored as offline video files. Therefore, we converted it into a sequence of frames. These frames are grouped sequentially by 51 frames in each group, and stride = 8 between the first frame of conjugating groups. The LSTM cells are initialized with zero vector, and then each group is sequentially processed one by one. Here, the updated state of LSTM cells is passed to the subsequent group processing. The generated output decision vector is stored with its group ID.

4.4.2. Online Mode

In this mode, the testing data are the feed of a camera (camera ID, location). Whenever the scene viewed by the camera changes (the camera is restarted, or its location is changed), the LSTM cells are initialized with zero vector. The first 51 frames are stored in a queue and form the first group processed by the system. After removing a frame from the queue, the upcoming video frame is pushed into the queue. In this way, the queue retains the last 51 frames. After every eighth frame push, the group formed by the frames in the queue is processed. The generated output decision vector is stored with its timestamp and camera ID.

5. Results and Analysis

5.1. Evaluation Criteria

The implemented model utilizes five indicators to measure and evaluate the event/activity detection capability of the model. These measurements are recall, precision, f-measure, the area under the receiver operating characteristic curve (AUROC), and average precision (AP). The detection relies on precision (how many detections are correct?) and recall (how many are retrieved?). Generally, a detection method uses some threshold to decide whether the detection is valid. The precision and recall vary with this threshold. The recall and the precision must trade off as recall improves by decreasing the threshold, and then precision diminishes. Another measure, the f-measure (harmonic mean of precision and recall), is adopted to counter the trade-off between precision and recall and soften the threshold selection effect. The f-measure is obtained from Equation (3), where TP stands for true-positive, the number of correctly identified regions; FP stands for false-positive, the number of incorrectly identified detections; and FN stands for false-negative, the number of detections that are not identified. A predicted detection is considered as correctly identified if its score is greater than a predefined threshold (generally 0.5).
p r e c i s i o n , P = T P T P + F P r e c a l l , R = T P T P + F N f m e a s u r e , F = T P T P + F P

5.1.1. Area under Receiver Characteristic Operator Curve

AUROC is an evaluation metric used to determine the performance of binary classifiers. The receiver characteristics operator curve (ROC) is a curve that shows the probabilistic area covered by the true-positive rate (TPR) (refer to Equation (4)) against the false-positive rate (FPR) (refer to Equation (5)). TPR is the ratio of TP to the sum of TP and FN values, also referred to as recall value, to correctly identify the true-positive values. Similarly, FPR is the ratio of FP to the sum of FP and true-negative (TN) values; FPR, as the name suggests, gives the probability of the falsely rejected null hypothesis.
T P R = T P T P + F N
F P R = F P F P + T N

5.1.2. Average Precision

Average precision gives the probability of positive prediction of machine learning models. Mathematically, it is depicted in Equation (3), which is the ratio of TP to all the positive predictions (TP + FP). AP is computed by taking the average of all segments of recall values under the precision–recall curve.

5.2. Performance Analysis of the Model

This section briefly discusses the performance analysis of the proposed deep learning model. No existing benchmark test data set is available to evaluate the performance of the proposed model. Therefore, the recorded data set is divided into two parts (refer to Section 4.1): 70% for training and 30% for testing. The performance of the model is measured based on five different indicators: recall, precision, f-measure, AUROC, and AP. We tabulated these results in Table 2 for all events/activities (refer to Table 1). These results imply that the proposed system exhibits outstanding performance on all performance evaluation criteria for all events/activities. These results also show that the model yields the best overall detection results for the event EA1 (recall = 0.936, precision = 0.924, f-measure = 0.930, AUROC = 0.988, and AP = 0.986). In contrast, the event EA4 has the worst performance (recall = 0.872, precision = 0.837, f-measure = 0.854, AUROC = 0.987, and AP = 0.944). This performance difference shows that the complexity of the event EA4 is higher than the event EA1. The event EA1 is straightforward and does not have any contextual dependencies. In contrast, the event EA4 has a high contextual dependency as it triggers only when the events EA1, EA2, and EA3 have already been present. Like the event EA4, the event EA5 also has high complexity (recall = 0:891; precision = 0.859, f-measure = 0.875, AUROC = 0.990, and AP = 0.959). Although the complexity of these events is high, the performance of the model is still reasonably high for all events.
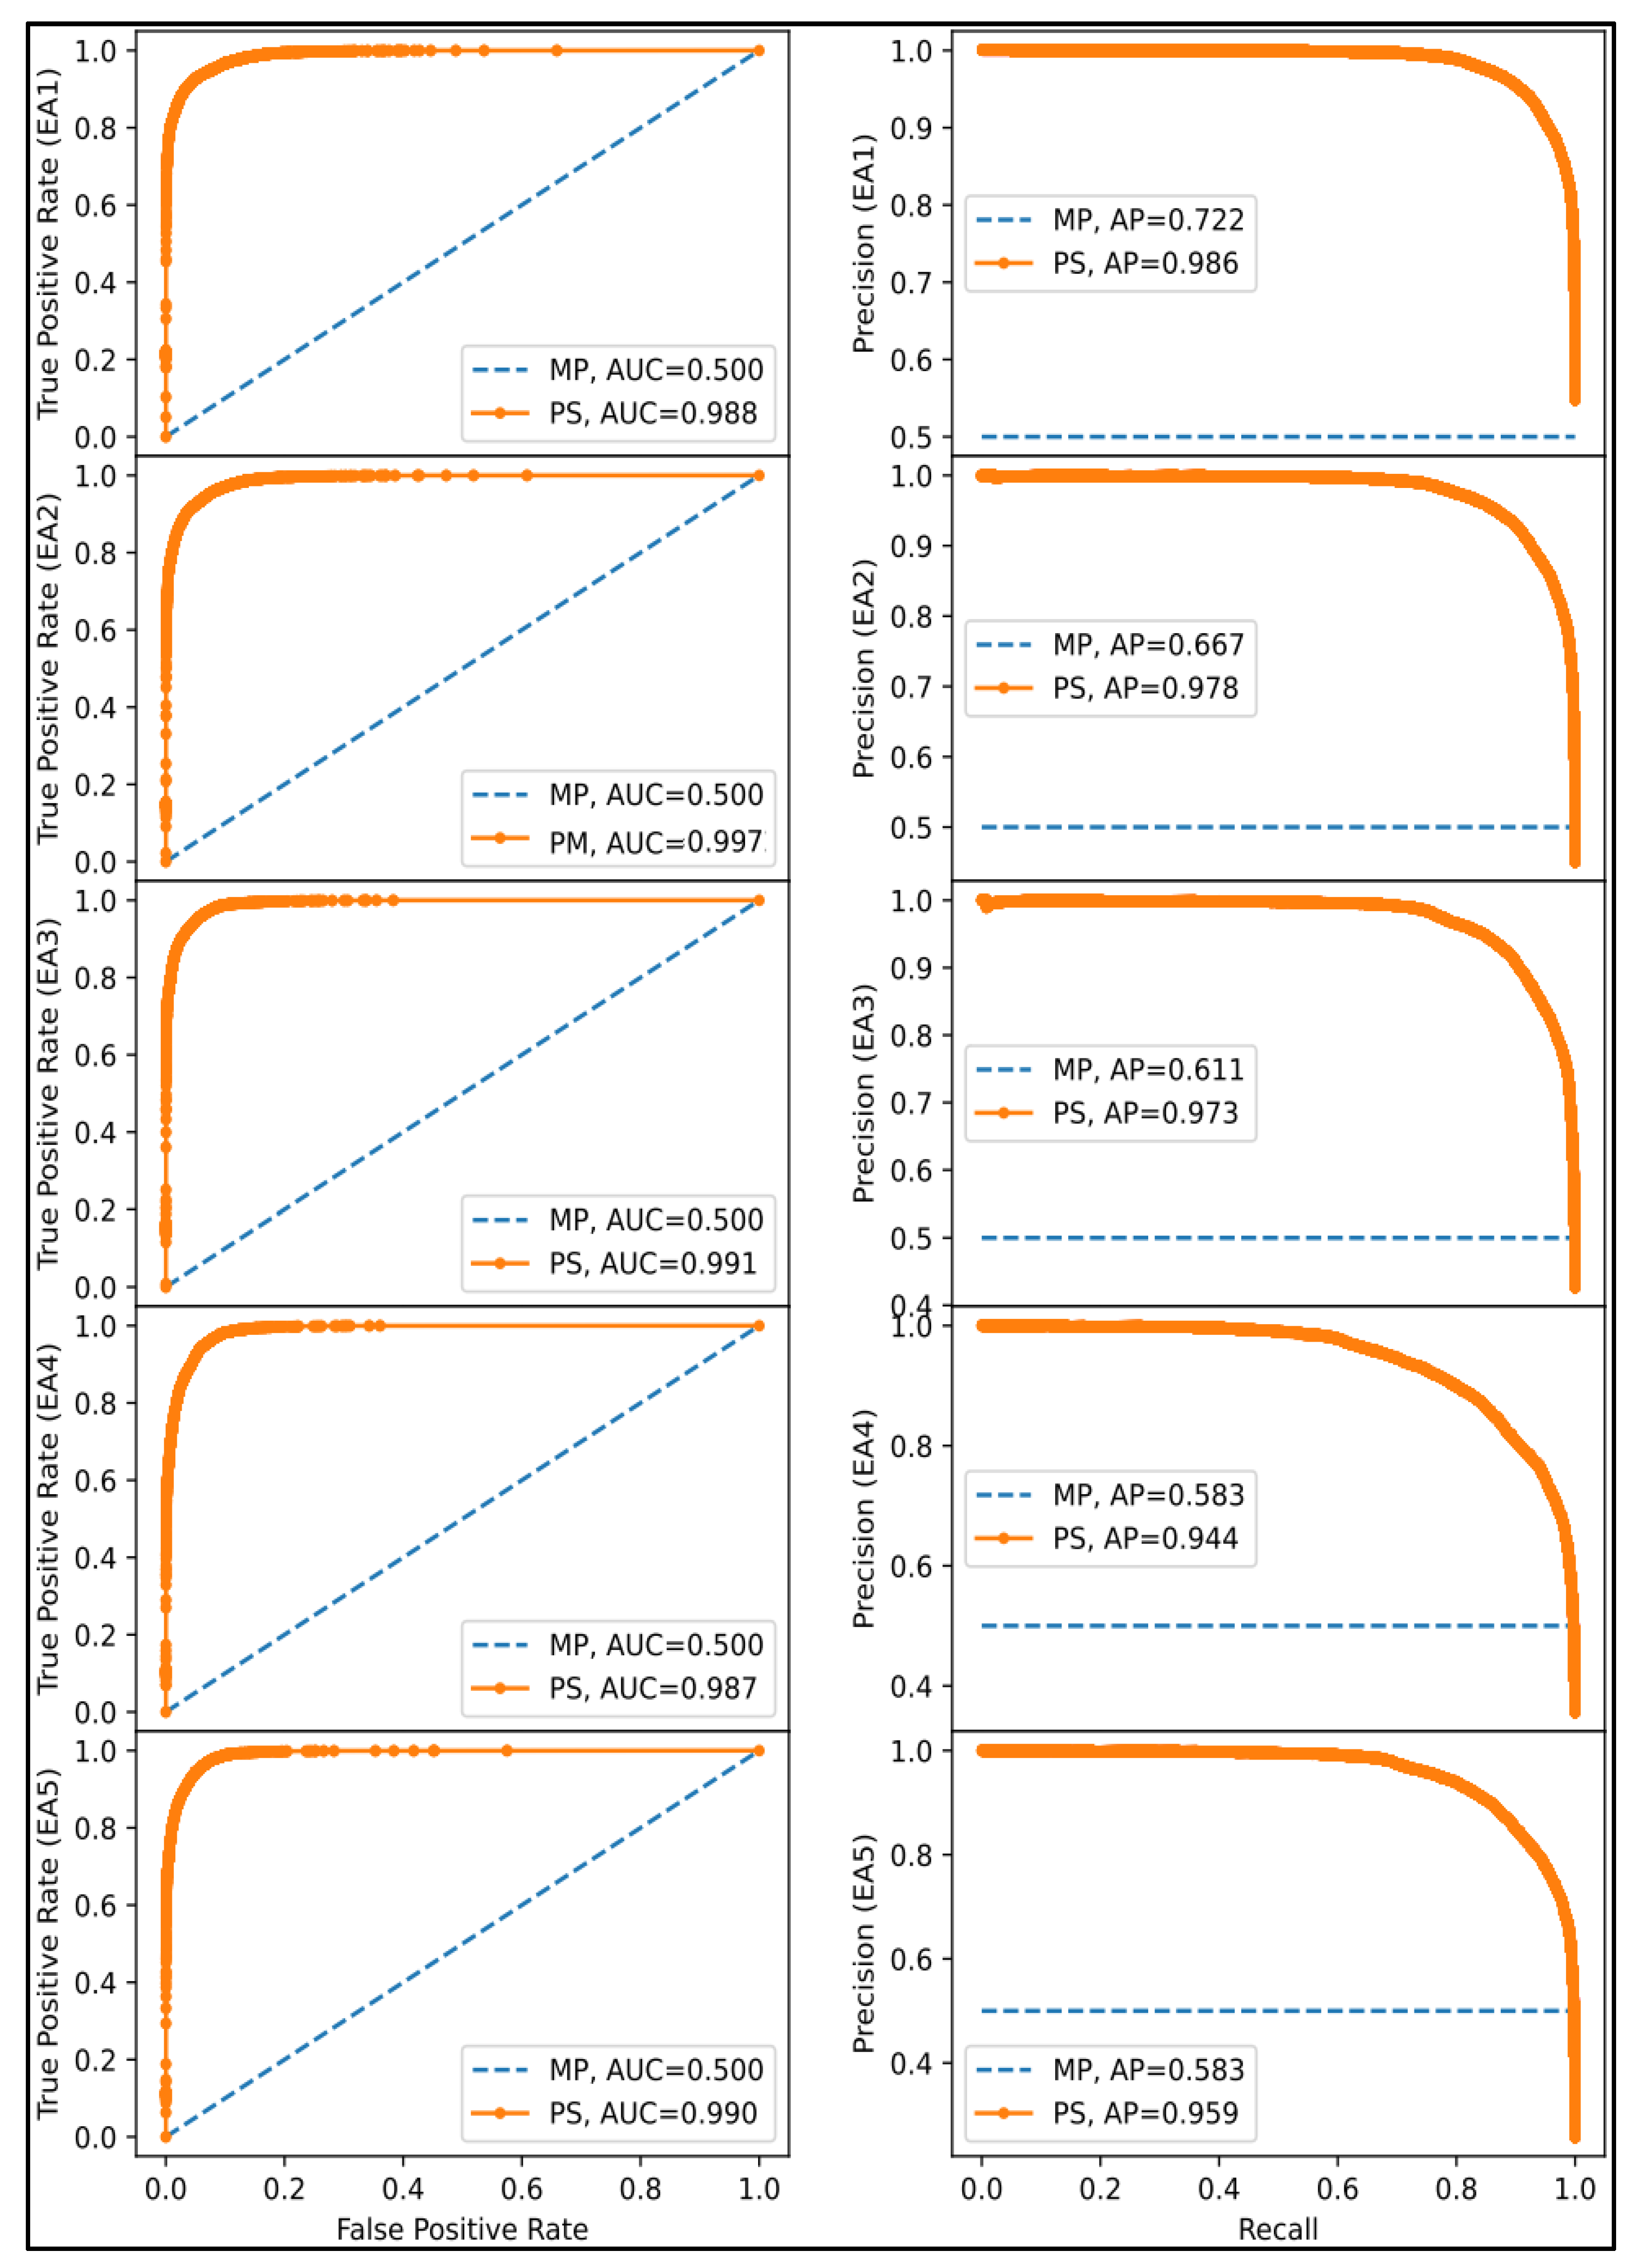
Figure 5 depicts the ROC curve and the precision–recall curves for the events EA1, EA2, EA3, EA4, and EA5, respectively. This figure incorporates the proposed model performance curves and a line for the majority prediction approach. The majority prediction line represents the results when the prediction is fixed as the majority without any learning. If any event’s happening and not happening duration is the same, then the majority prediction is correct for half of the time. In contrast, if the happening time duration of an event varies, in this case, the majority vote prediction also varies, but it (accuracy) will always be more than 0.5 (as most of the time prediction is correct). The ROC and precision–recall curve for different events in their respective figures validate the satisfactory performance of the proposed system. The high scores for the AUROC and AP show that the model is less ambiguous for decision making for any event detection.

5.3. Case Study

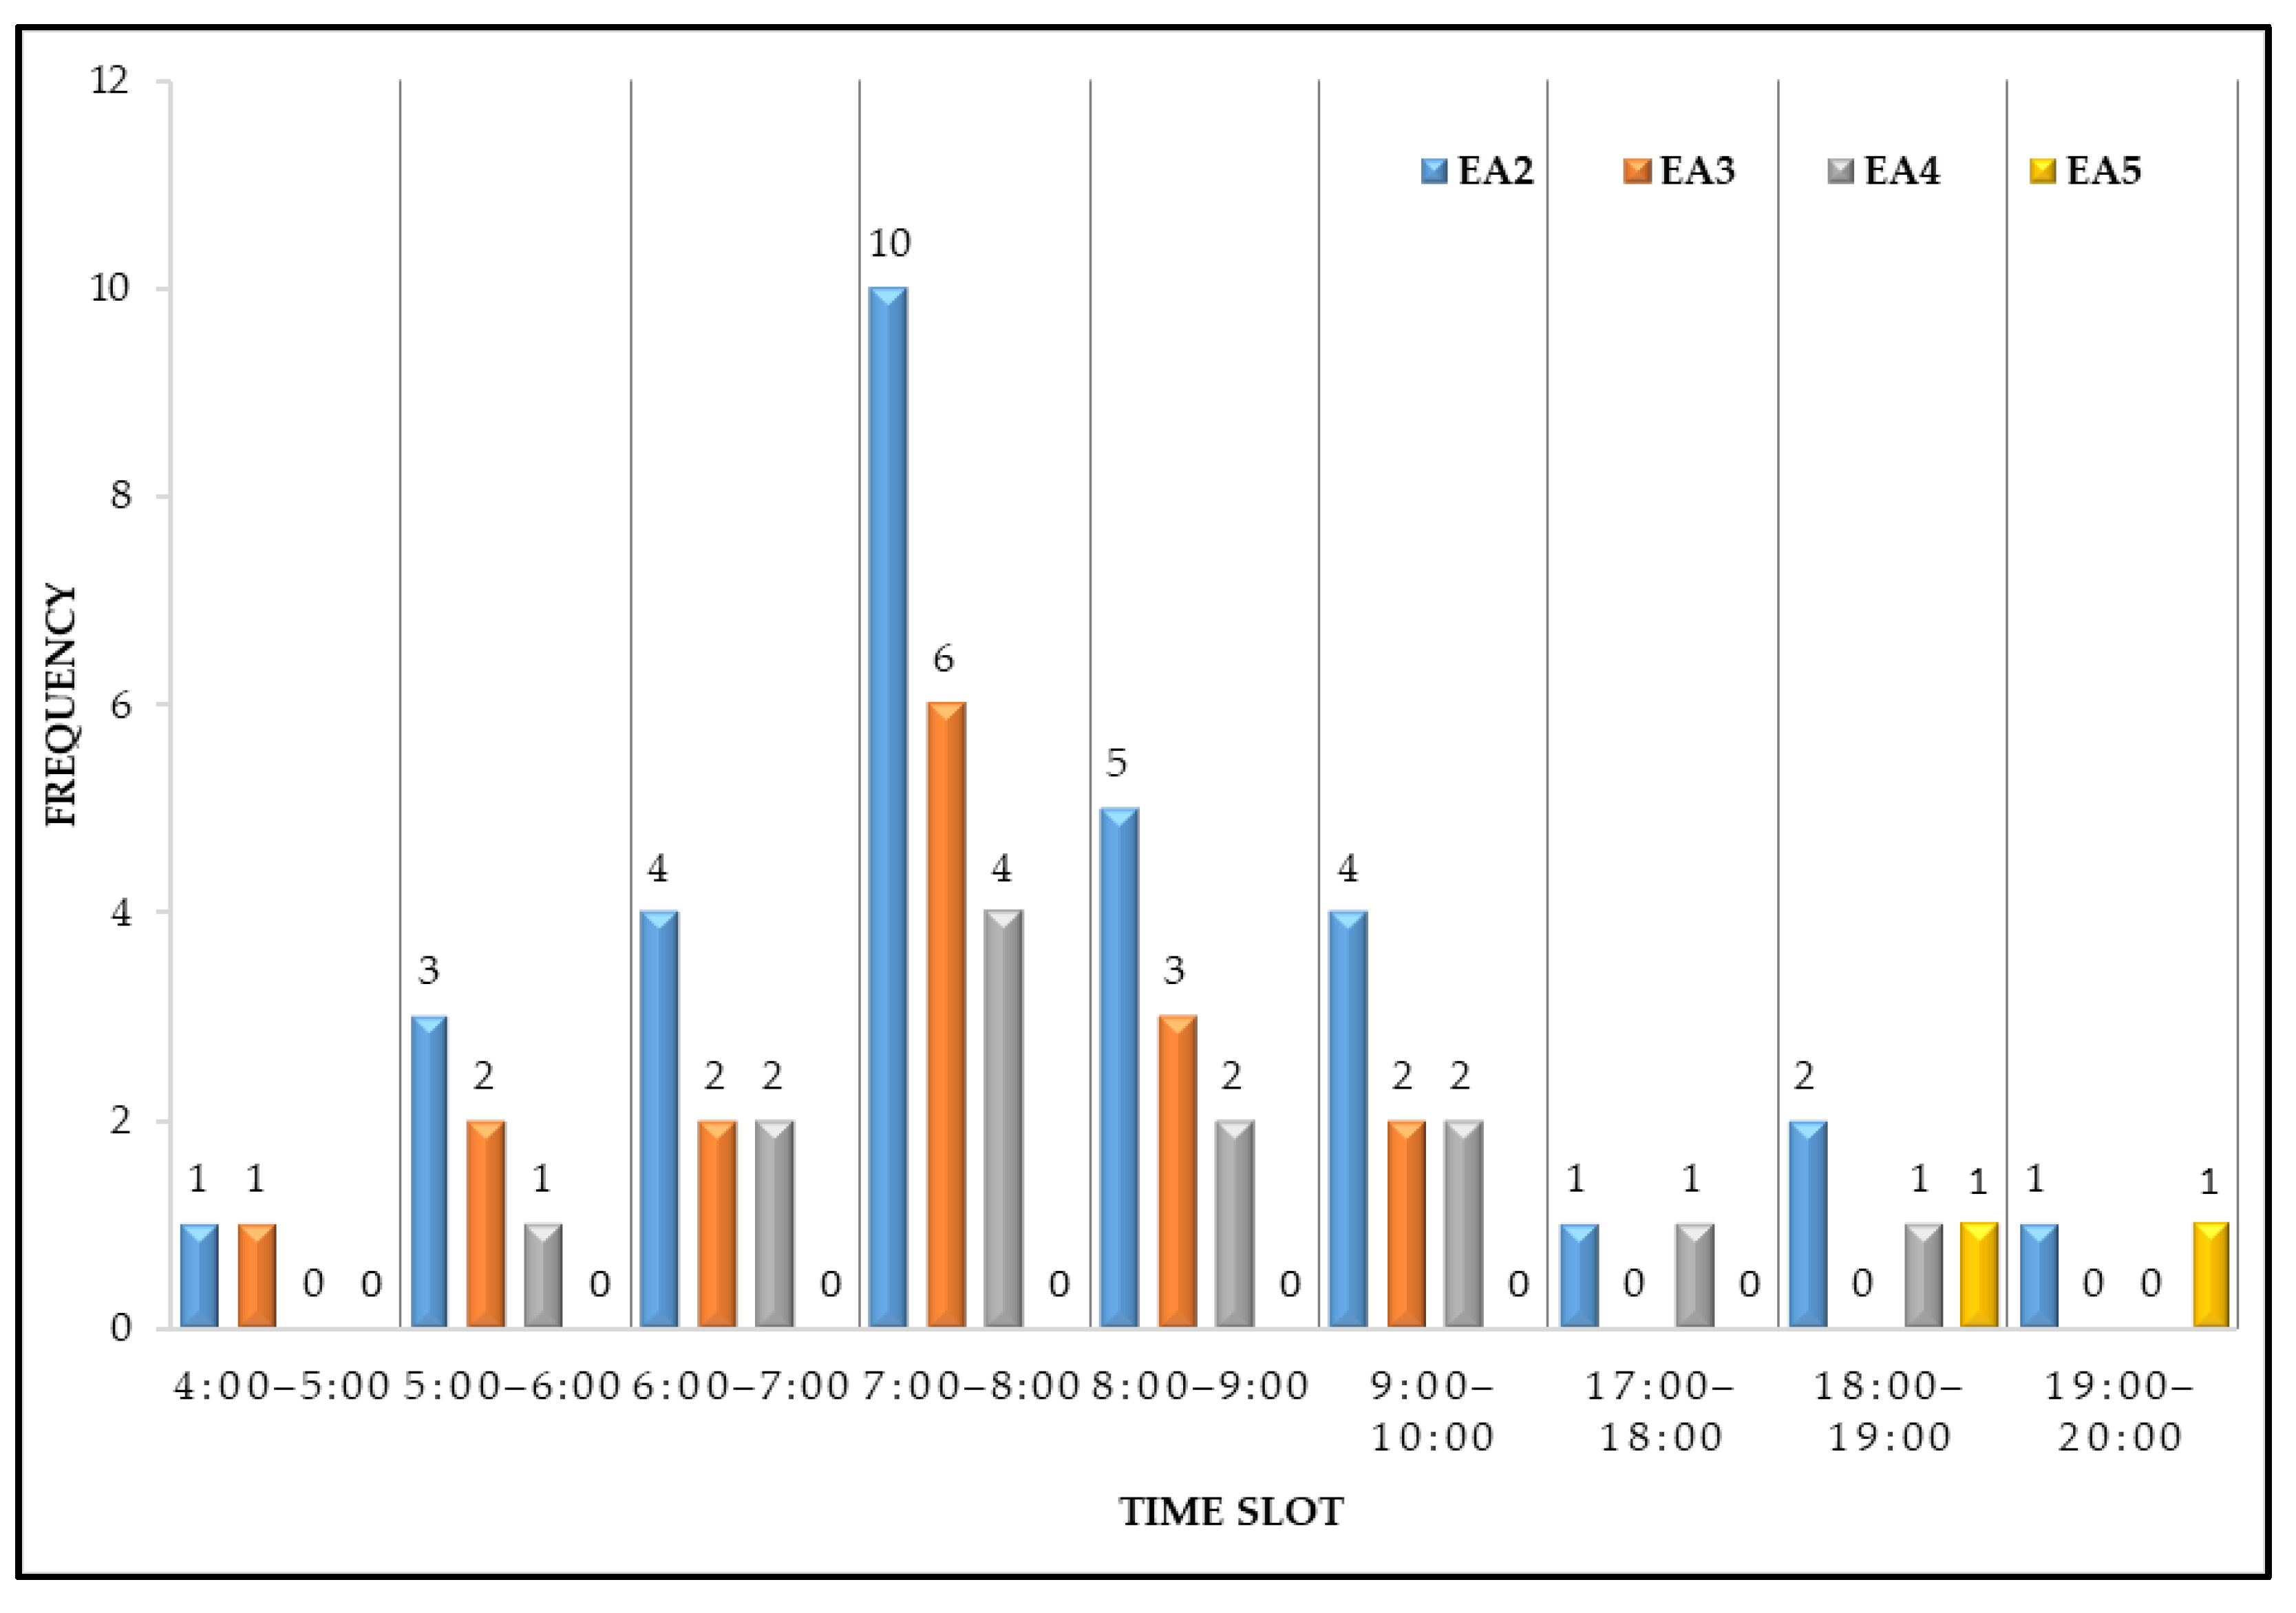
This section briefly discusses a case study performed to determine the practical applicability of the implemented deep neural network model in the actual environment. A bin is selected, and occurrences of events EA2, EA3, EA4, and EA5 are determined from the log created by the system. These occurrences are computed daily in a time slot of one hour for two weeks. The count of these occurrences is denoted as frequency. A daily average frequency plot for these events is constructed for the prime slots when the average frequency is one or more. This plot can be interpreted to deduce one of the following actions to improve the SWM service.
  • People need to be educated about the consequences of waste scattering.
  • Bin capacity or waste collection schedules are required to change.
  • Both above actions are required simultaneously.
  • None of the actions are needed.
The frequency plot is displayed in Figure 6. The graph shows that the average number of events related to the bin (EA2) in a day is approximately 31. The analysis uncovers that 51.61% of total people dropped their waste directly inside the bin while 41.94% threw it in the proximity of the bin due to inappropriate handling. The remaining 6.45% dropped waste outside the bin due to overflowing. People who mishandled the waste dropping were significant (81.25%) compared to those who dropped it properly. People’s behavior cannot be neglected; therefore, the municipality needs to take appropriate action to improve people’s behavior. Here, the most rational option to handle this condition is to educate people about the consequences of waste scattering. The municipality should develop a policy to implement awareness programs using different mediums about the consequences of waste scattering. In the large-scale system, locations of similar bins (as above, unsuccessful placement of waste in the bin due to inappropriate handling, i.e., event EA3) are determined and the awareness program is implemented in these regions. The awareness program will develop the understanding of waste handling among people. Consequently, people will improve their behavior and attitude toward waste handling and drop their waste directly into the bin.

6. Discussion

We conducted a survey to determine the events/activities in the proximity of bins when people drop their waste. From the survey analysis, we deduced that three major activities happened during the dropping of waste in the bin. These activities are described in the literature survey section. The first two activities are associated with people’s behavior, while the third is related to the bin capacity or waste collection schedule. This survey was performed through manual monitoring of a few bins and we recorded all activities of individuals when they dropped their waste. A city has a large number of bins, so it is not possible to monitor all the bins manually to determine the solutions based on the identified activities. This argument is sufficient to develop an automated system to detect and identify the above activities. Therefore, we implemented a 3D CNN and LSTM-based recurrent network model to automatically classify the different activities in the proximity of the waste bin. This model implementation at a large scale is cost-effective as it does not require any new infrastructure building. It takes the video input, which can be easily recorded through the existing surveillance system of a city by placing the bins in view of a camera.
The proposed model was trained and tested over the handcrafted data set and achieved an average precision of 0.944–0.986. The system creates a log for some specific types of activities and events, as mentioned in EA2, EA3, EA4, and EA5. The model performance measures for these events are investigated. We concluded that the model has high precision in event detection and is suitable for correctly classifying events. The overall performance and results analysis indicate that the model is capable enough to detect the events and generate promising results for these classification tasks. The detection of all events and their exact classification are not highly crucial to determining and analyzing people’s behavior toward waste, so generated outcomes have enough evidence to develop a scalable system for the actual environment.
The outcomes of the model are interpreted to derive the actionable information to improve the SWM services. This information can be given as follows. It can determine the locations where bin capacity is not utilized effectively. Moreover, it can also identify areas in the city where people are not attentive toward waste and throw it outside the bin even if it is not full. This information is beneficial in determining the bin capacity and waste collection schedule and developing awareness programs to educate people about the scattering of waste in an open environment.

7. Conclusions

We proposed and implemented an event detection and categorization model to determine people’s behavior toward waste. The model consists of a 3D CNN and LSTM-based recurrent network to classify the different activities in the proximity of bin. bins. The model was trained and tested over the handcrafted data set and achieved an average precision of 0.944–0.986. The analysis of performance measures (refer to Table 2) for all events implies that the model successfully detected all the events and has high precision for classifying the events. The comparison of performance measures between the events EA1 and EA4 implies that event EA4 is more complex than EA1. It is justified that event EA1 is a simple detection task that does not require any contextual dependencies. However, the event EA4 has a high contextual dependency as it triggers only when the events EA1, EA2, and EA3 have already been present. Like the event EA4, the event EA5 also has high complexity. Although the complexity of these events is high, the performance of the model is still reasonably high for all events.
The proposed model performance might be improved by replacing the 3D CNN with more advanced network architectures, namely ResNet or DenseNet. However, we aimed to apply deep learning and show the system’s effectiveness instead of developing the most optimal model. Moreover, the model takes the video input to be integrated with the existing city surveillance system. Therefore, large-scale implementation of the model does not require any physical infrastructure. This is the primary reason why the model can be implemented at a large scale without additional infrastructure development. This cost-effective solution has extensive financial benefits, so it can be easily deployed in economically weak countries to improve SWM services.

Author Contributions

Conceptualization, M.A., S.S. and M.S.U.; methodology, M.A. and S.S.; formal analysis, M.A., S.S. and M.S.U.; resources, S.S. and M.S.U.; data curation, M.A. and S.S.; writing—original draft preparation, M.A. and S.S.; writing—review and editing, M.A., S.S. and M.S.U.; supervision, M.S.U.; funding acquisition, S.S. All authors have read and agreed to the published version of the manuscript.

Funding

This research was supported by the Princess Nourah bint Abdulrahman University Researchers Supporting Project number (PNURSP2022R259), Princess Nourah bint Abdulrahman University, Riyadh, Saudi Arabia.

Institutional Review Board Statement

Not applicable.

Informed Consent Statement

Not applicable.

Data Availability Statement

Not applicable.

Acknowledgments

We would like to express our appreciation to Tofik Ali, a research scholar of computer vision at Indian Institute of Technology Roorkee, India, for his valuable and constructive suggestions during the planning and development of this research work. His willingness to give his time so generously has been very much appreciated.

Conflicts of Interest

The authors declare no conflict of interest.

References

  1. Ho, W.S.; Hashim, H.; Lim, J.S.; Lee, C.T.; Sam, K.C.; Tan, S.T. Waste Management Pinch Analysis (WAMPA): Application of Pinch Analysis for Greenhouse Gas (GHG) Emission Reduction in Municipal Solid Waste Management. Appl. Energy 2017, 185 Pt 2, 1481–1489. [Google Scholar] [CrossRef]
  2. Speight, J.G. Waste Gasification for Synthetic Liquid Fuel Production. In Gasification for Synthetic Fuel Production: Fundamentals, Processes and Applications; Elsevier Ltd.: Amsterdam, The Netherlands, 2015; pp. 277–301. ISBN 9780857098085. [Google Scholar]
  3. Adhikari, S.; Nam, H.; Chakraborty, J.P. Conversion of Solid Wastes to Fuels and Chemicals through Pyrolysis. In Waste Biorefinery: Potential and Perspectives; Elsevier: Amsterdam, The Netherlands, 2018; pp. 239–263. ISBN 9780444639929. [Google Scholar]
  4. Kaza, S.; Yao, L.C.; Bhada-Tata, P.; Van Woerden, F. What a Waste 2.0: A Global Snapshot of Solid Waste Management to 2050; World Bank Publications, The World Bank Group: Washington, DC, USA, 2018; Volume 1, ISBN 978-1-4648-1329-0. [Google Scholar]
  5. Moya, D.; Aldás, C.; López, G.; Kaparaju, P. Municipal Solid Waste as a Valuable Renewable Energy Resource: A Worldwide Opportunity of Energy Recovery by Using Waste-To-Energy Technologies. In Proceedings of the Energy Procedia; Elsevier Ltd.: Amsterdam, The Netherlands, 2017; Volume 134, pp. 286–295. [Google Scholar]
  6. Anjum, M.; Shahab, S. Umar MSApplication of Modified Grey Forecasting Model to Predict the Municipal Solid Waste Generation Using MLP and MLE. Int. J. Math. Eng. Manag. Sci. 2021, 6, 1276–1296. [Google Scholar] [CrossRef]
  7. Diaz-Barriga-Fernandez, A.D.; Santibañez-Aguilar, J.E.; Betzabe González-Campos, J.; Nápoles-Rivera, F.; Ponce-Ortega, J.M.; El-Halwagi, M.M. Strategic Planning for Managing Municipal Solid Wastes with Consideration of Multiple Stakeholders. In Computer Aided Chemical Engineering; Elsevier BV: Amsterdam, The Netherlands, 2018; Volume 44, pp. 1597–1602. [Google Scholar]
  8. Clos, J. The Challenge of Local Government Financing in Developing Countries; UN-Habitat: Nairobi, Kenya, 2015; ISBN 978-92-1-132653-6. [Google Scholar]
  9. Lecun, Y.; Bengio, Y.; Hinton, G. Deep Learning. Nature 2015, 521, 436–444. [Google Scholar] [CrossRef]
  10. Tirkolaee, E.B.; Goli, A.; Gütmen, S.; Weber, G.W.; Szwedzka, K. A Novel Model for Sustainable Waste Collection Arc Routing Problem: Pareto-Based Algorithms. Ann. Oper. Res. 2022, 1–26. [Google Scholar] [CrossRef]
  11. Tirkolaee, E.B.; Mahdavi, I.; Esfahani, M.M.S.; Weber, G.W. A Robust Green Location-Allocation-Inventory Problem to Design an Urban Waste Management System under Uncertainty. Waste Manag. 2020, 102, 340–350. [Google Scholar] [CrossRef]
  12. Babaee Tirkolaee, E.; Mahdavi, I.; Seyyed Esfahani, M.M.; Weber, G.W. A Hybrid Augmented Ant Colony Optimization for the Multi-Trip Capacitated Arc Routing Problem under Fuzzy Demands for Urban Solid Waste Management. Waste Manag. Res. 2020, 38, 156–172. [Google Scholar] [CrossRef]
  13. Tirkolaee, E.B.; Iraj, M.; Esfahani, M.M.S. Solving the Multi-Trip Vehicle Routing Problem with Time Windows in Urban Waste Management Using Grey Wolf Optimization Algorithm. J. Model. Eng. 2019, 17, 93–110. [Google Scholar]
  14. Babaee Tirkolaee, E.; Alinaghian, M.; Bakhshi Sasi, M.; Seyyed Esfahani, M. Solving a Robust Capacitated Arc Routing Problem Using a Hybrid Simulated Annealing Algorithm: A Waste Collection Application. J. Ind. Eng. Manag. Stud. 2016, 3, 61–76. [Google Scholar]
  15. Zhao, Y.; Xiong, Y.; Lin, D. Recognize Actions by Disentangling Components of Dynamics. In Proceedings of the IEEE Computer Society Conference on Computer Vision and Pattern Recognition, Salt Lake City, UT, USA, 18–23 June 2018; pp. 6566–6575. [Google Scholar]
  16. Xu, D.; Yan, Y.; Ricci, E.; Sebe, N. Detecting Anomalous Events in Videos by Learning Deep Representations of Appearance and Motion. Comput. Vis. Image Underst. 2017, 156, 117–127. [Google Scholar] [CrossRef]
  17. Cai, Z.; Vasconcelos, N. Cascade R-CNN: Delving into High Quality Object Detection. In Proceedings of the IEEE Computer Society Conference on Computer Vision and Pattern Recognition, Salt Lake City, UT, USA, 18–23 June 2018; pp. 6154–6162. [Google Scholar]
  18. Teoh, K.H.; Ismail, R.C.; Naziri, S.Z.M.; Hussin, R.; Isa, M.N.M.; Basir, M.S.S.M. Face Recognition and Identification Using Deep Learning Approach. J. Phys. Conf. Ser. 2021, 1755, 012006. [Google Scholar] [CrossRef]
  19. Russakovsky, O.; Deng, J.; Su, H.; Krause, J.; Satheesh, S.; Ma, S.; Huang, Z.; Karpathy, A.; Khosla, A.; Bernstein, M.; et al. ImageNet Large Scale Visual Recognition Challenge. Int. J. Comput. Vis. 2015, 115, 211–252. [Google Scholar] [CrossRef] [Green Version]
  20. Krizhevsky, A.; Sutskever, I.; Hinton, G.E. ImageNet Classification with Deep Convolutional Neural Networks. Commun. ACM 2017, 60, 84–90. [Google Scholar] [CrossRef] [Green Version]
  21. Shahab, S.; Anjum, M.; Umar, M.S. Deep Learning Applications in Solid Waste Management: A Deep Literature Review. Int. J. Adv. Comput. Sci. Appl. 2022, 13, 381–395. [Google Scholar] [CrossRef]
  22. Gundupalli, S.P.; Hait, S.; Thakur, A. A Review on Automated Sorting of Source-Separated Municipal Solid Waste for Recycling. Waste Manag. 2017, 60, 56–74. [Google Scholar] [CrossRef]
  23. Aziz, F.; Arof, H.; Mokhtar, N.; Mubin, M.; Abu Talip, M.S. Rotation Invariant Bin Detection and Solid Waste Level Classification. Meas. J. Int. Meas. Confed. 2015, 65, 19–28. [Google Scholar] [CrossRef]
  24. Hannan, M.A.; Arebey, M.; Begum, R.A.; Basri, H.; Al Mamun, M.A. Content-Based Image Retrieval System for Solid Waste Bin Level Detection and Performance Evaluation. Waste Manag. 2016, 50, 10–19. [Google Scholar] [CrossRef] [PubMed]
  25. Hannan, M.A.; Abdulla Al Mamun, M.; Hussain, A.; Basri, H.; Begum, R.A. A Review on Technologies and Their Usage in Solid Waste Monitoring and Management Systems: Issues and Challenges. Waste Manag. 2015, 43, 509–523. [Google Scholar] [CrossRef]
  26. Anjum, M.; Shahab, S.; Umar, M.S. Smart Waste Management Paradigm in Perspective of IoT and Forecasting Models. Int. J. Environ. Waste Manag. 2022, 29, 34. [Google Scholar] [CrossRef]
  27. Kumar, S.; Yadav, D.; Gupta, H.; Verma, O.P.; Ansari, I.A.; Ahn, C.W. A Novel Yolov3 Algorithm-Based Deep Learning Approach for Waste Segregation: Towards Smart Waste Management. Electronics 2021, 10, 14. [Google Scholar] [CrossRef]
  28. Yang, M.; Thung, G. Classification of Trash for Recyclability Status. CS229 Proj. Rep. 2016, 1, 3. [Google Scholar]
  29. Bircanoglu, C.; Atay, M.; Beser, F.; Genc, O.; Kizrak, M.A. RecycleNet: Intelligent Waste Sorting Using Deep Neural Networks. In Proceedings of the 2018 IEEE (SMC) International Conference on Innovations in Intelligent Systems and Applications, INISTA, Thessaloniki, Greece, 3–5 July 2018; pp. 1–7. [Google Scholar]
  30. Ruiz, V.; Sánchez, Á.; Vélez, J.F.; Raducanu, B. Automatic Image-Based Waste Classification. In Proceedings of the Lecture Notes in Computer Science (Including Subseries Lecture Notes in Artificial Intelligence and Lecture Notes in Bioinformatics), Sapporo, Japan, 15–18 December 2019; Springer: Cham, Switzerland, 2019; Volume 11487, pp. 422–431. [Google Scholar]
  31. Lindermayr, J.; Senst, C.; Hoang, M.H.; Hägele, M. Visual Classification of Single Waste Items in Roadside Application Scenarios for Waste Separation. In Proceedings of the 50th International Symposium on Robotics, ISR 2018, Munich, Germany, 20–21 June 2018; pp. 226–231. [Google Scholar]
  32. Toğaçar, M.; Ergen, B.; Cömert, Z. Waste Classification Using AutoEncoder Network with Integrated Feature Selection Method in Convolutional Neural Network Models. Meas. J. Int. Meas. Confed. 2020, 153, 107459. [Google Scholar] [CrossRef]
  33. Chu, Y.; Huang, C.; Xie, X.; Tan, B.; Kamal, S.; Xiong, X. Multilayer Hybrid Deep-Learning Method for Waste Classification and Recycling. Comput. Intell. Neurosci. 2018, 2018, 5060857. [Google Scholar] [CrossRef] [Green Version]
  34. Nowakowski, P.; Pamuła, T. Application of Deep Learning Object Classifier to Improve E-Waste Collection Planning. Waste Manag. 2020, 109, 1–9. [Google Scholar] [CrossRef]
  35. Ozkaya, U.; Seyfi, L. Fine-Tuning Models Comparisons on Garbage Classification for Recyclability. arXiv Prepr. 2019, arXiv:1908.04393. [Google Scholar]
  36. Fadel, F. The Design and Implementation of Smart Trash Bin. Acad. J. Nawroz Univ. 2017, 6, 141–148. [Google Scholar] [CrossRef] [Green Version]
  37. Malapur, B.S.; Pattanshetti, V.R. IoT Based Waste Management: An Application to Smart City. In 2017 International Conference on Energy, Communication, Data Analytics and Soft Computing, ICECDS 2017; IEEE: Piscataway, NJ, USA, 2018; pp. 2476–2479. [Google Scholar] [CrossRef]
  38. Singh, A.; Aggarwal, P.; Arora, R. IoT Based Waste Collection System Using Infrared Sensors. In Proceedings of the 2016 5th International Conference on Reliability, Infocom Technologies and Optimization, ICRITO 2016: Trends and Future Directions, Noida, India, 19 December 2016; pp. 505–509. [Google Scholar]
  39. Anjum, M.; Sarosh Umar, M.; Shahab, S. IoT-Based Novel Framework for Solid Waste Management in Smart Cities. In Proceedings of the Inventive Computation and Information Technologies, Lecture Notes in Networks and Systems, Budva, Montenegro, 12–14 April 2022; pp. 687–700. [Google Scholar]
  40. Foudery, A.A.L.; Alkandari, A.A.; Almutairi, N.M. Trash Basket Sensor Notification Using Arduino with Android Application. Indones. J. Electr. Eng. Comput. Sci. 2018, 10, 120–128. [Google Scholar] [CrossRef]
  41. Muthugala, M.A.V.J.; Samarakoon, S.M.B.P.; Elara, M.R. Tradeoff between Area Coverage and Energy Usage of a Self-Reconfigurable Floor Cleaning Robot Based on User Preference. IEEE Access 2020, 8, 76267–76275. [Google Scholar] [CrossRef]
  42. Bai, J.; Lian, S.; Liu, Z.; Wang, K.; Liu, D. Deep Learning Based Robot for Automatically Picking up Garbage on the Grass. IEEE Trans. Consum. Electron. 2019, 64, 382–389. [Google Scholar] [CrossRef]
  43. Anjum, M.; Umar, M.S. Garbage Localization Based on Weakly Supervised Learning in Deep Convolutional Neural Network. In Proceedings of the IEEE 2018 International Conference on Advances in Computing, Communication Control and Networking, ICACCCN 2018, Greater Noida, India, 12–13 October 2018; pp. 1108–1113. [Google Scholar]
  44. Lin, T.Y.; Goyal, P.; Girshick, R.; He, K.; Dollar, P. Focal Loss for Dense Object Detection. In Proceedings of the IEEE International Conference on Computer Vision, Venice, Italy, 22–29 October 2017; pp. 2980–2988. [Google Scholar]
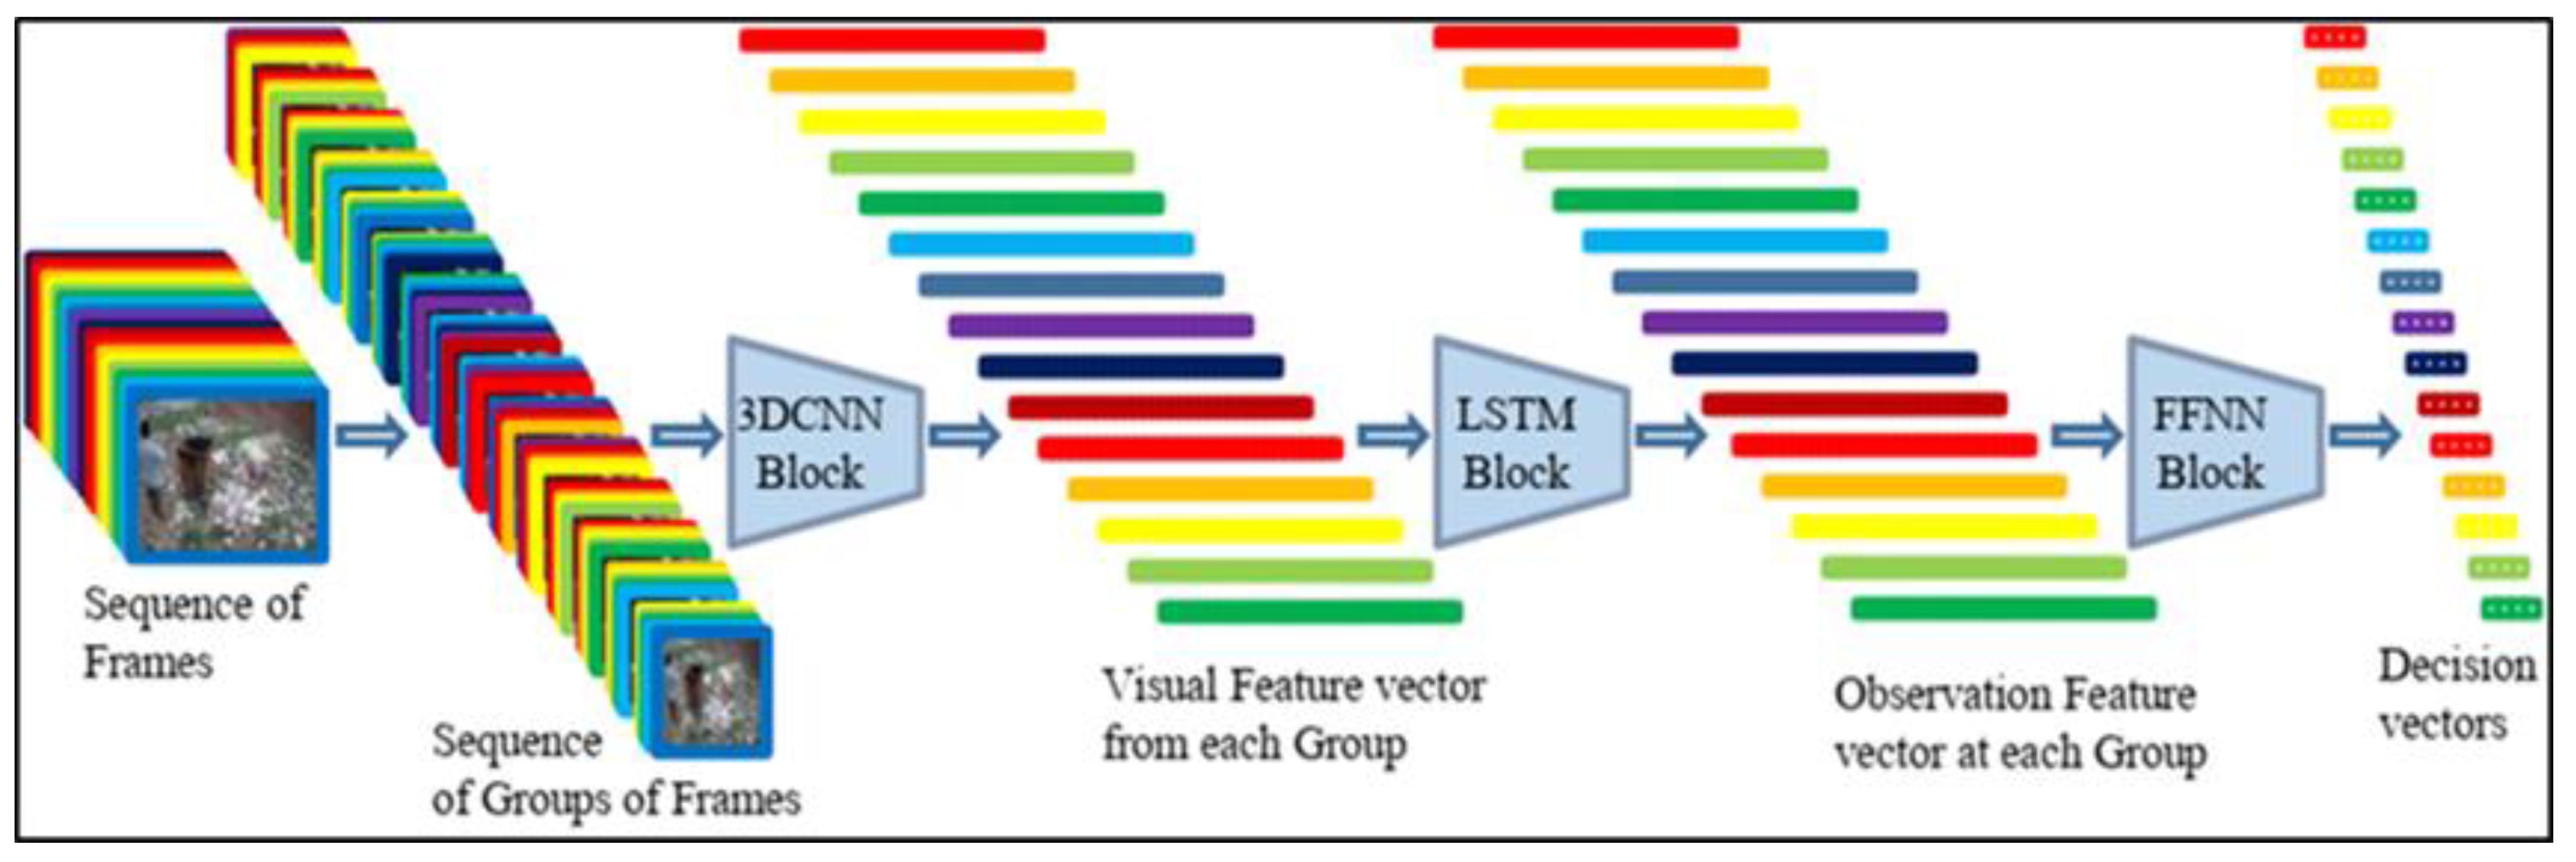
Figure 1. The data flow architecture for the proposed event detection and classification model for the SWM system.
Sustainability 14 13189 g001
Figure 2. The structure of the proposed CNN architecture and the workflow outline for the event detection and classification model.
Sustainability 14 13189 g002
Figure 3. A random frame from the event related to the bin (successful placement of waste in the bin).
Sustainability 14 13189 g003
Figure 4. A sample video sequence with its decision vector labeled in each image frame (refer to Table 1 for decision vector).
Sustainability 14 13189 g004
Figure 5. The ROC (left) and precision–recall (right) curves for all events/activities. Here PS and MP stand for proposed system and majority prediction.
Sustainability 14 13189 g005
Figure 6. Frequency plot of events EA2, EA3, EA4, and EA5 for prime slots.
Sustainability 14 13189 g006
Table 1. The description of the output decision (four-element probability) vector. X stands for do not care, H stands for high probability, and L stands for low probability.
Decision VectorDescription of the Event/ActivityAbbreviation for Event/Activity
1234
HXXXAny event occurs in the proximity of the bin.EA1
HHXXThe event is related to the bin.EA2
HHHXThe waste is successfully placed in the bin.EA3
HHLLUnsuccessful placement of waste in the bin due to inappropriate handling.EA4
HHLHUnsuccessful placement of waste in the bin due to overflow.EA5
Table 2. The performance measures of all events/activities.
Event/ActivityPerformance
RecallPrecisionf-MeasureAUROCAP
EA10.9360.9240.9300.9880.986
EA20.9200.9060.9130.9880.978
EA30.9160.8850.9000.9910.973
EA40.8720.8370.8540.9870.944
EA50.8910.8590.87650.9900.959
Publisher’s Note: MDPI stays neutral with regard to jurisdictional claims in published maps and institutional affiliations.