Article

Solid Waste Management Scenario in India and Illegal Dump Detection Using Deep Learning: An AI Approach towards the Sustainable Waste Management

1
Department of Business Administration, College of Business Administration, Princess Nourah bint Abdulrahman University, P.O. Box 84428, Riyadh 11671, Saudi Arabia
2
Department of Computer Engineering, Aligarh Muslim University, Aligarh 202002, India
*
Author to whom correspondence should be addressed.
Sustainability 2022, 14(23), 15896; https://doi.org/10.3390/su142315896
Submission received: 23 October 2022 / Revised: 22 November 2022 / Accepted: 26 November 2022 / Published: 29 November 2022
(This article belongs to the Special Issue Solid-Waste and Waste-Water Treatment Processes)

Abstract

:
The study is presented in four sections. The first section defines the municipal solid waste and solid waste management system. The second section illustrates the descriptive statistical analysis of waste generation patterns in India. The average waste generation in India was 160,038.9 tons per day in 2021; 95% of this total waste was collected and transported to the disposal sites. Based on scientific studies and observations, the per capita waste generation rate in 2018 was 0.490–0.626 g per day. In the last one and a half decades (1999–2000 to 2015–2016), Delhi and Bangalore have shown the highest percentage growth of 2075% and 1750%, respectively, in total waste generation among the highest population cities. The analysis of waste generation patterns concludes urbanization is a major factor that highly influences the waste generation rate. The third section describes the major issues in current solid waste management services. Some of these issues are the unavailability of web portals for citizens, no real-time monitoring of bins, collection vehicles and illegal dumping. These issues are identified based on the survey performed in a city and analysis of related research studies and scientific reports. We determined that illegal dumping is one of these major concerns and needs a technological solution. In the fourth section, we propose a multipath convolutional neural network (mp-CNN) to detect and localize the waste dumps on streets and roadsides. We constructed our dataset to train and test the proposed model, as no benchmark dataset is publicly available to obtain this objective. We applied the weakly supervised learning approach to training the model. In this approach, mp-CNN was trained according to the image class; in our case, it is two (waste and non-waste). In the testing phase, the model showed the performance evaluation matrices 97.82% of precision, 98.86% of recall, 98.34% of F1 score, 98.33% of accuracy, and 98.63% of AUROC for this binary classification. Due to the scarcity of benchmark datasets, waste localization results cannot be presented quantitatively. So, we performed a survey to compare the overlapping of the mask generated by the model with the region waste in the actual image. The average score for the generated mask obtained a score of 3.884 on a scale of 5. Based on the analysis of model performance evaluation parameters, precision-recall curve, receiver characteristic operator curve, and comparison of mask generated by the model over waste with corresponding actual images show that mp-CNN performs remarkably good in detection, classification, and localization of waste regions. Finally, two conceptual architectures in the context of developing countries are suggested to demonstrate the future practical applications of the mp-CNN model.

1. Introduction

Municipal solid waste (MSW) is commonly pronounced as solid waste, garbage, or trash. Waste is any discarded material or item that has no more use and does not comprise any economic value to its owner, and the owner is considered a waste generator [1]. Based on the physical state, waste is classified into three categories: solid, liquid, and gaseous. Solid waste comprises MSW, hazardous waste, solid industrial residue, healthcare waste, construction and demolition waste, and radioactive waste [2]. Now, the MSW is defined as nonhazardous waste produced by households and commercial and institutional activities [2]. According to the source of waste generation, MSW is typically divided into three categories which are illustrated in Table 1. Generally, household waste, namely batteries, and electronic items, are mixed with MSW.
Generally, the term solid waste management (SWM) is interchangeably used for MSW management. SWM is observed as one of the integral components of urban services that comprise a set of different tasks from collecting waste from households, streets, and marketplaces to final disposal as landfill or disposal. It involves various processes and actions needed to handle the waste from its inception to final disposal. Figure 1 depicts the various stages involved in the SWM service framework.
The SWM problems are significantly more severe in developing countries like India than in developed countries. Based on the literature survey and reports, it is concluded that the major factors behind the waste management problems are inefficient collection process, cost, and no monitoring of waste [3]. These factors lead to poor waste management practices that directly depreciate the resources, energy extracted, and recycled materials from a significant portion of the MSW. SWM is needed to obtain sustainable urban development by appropriately collecting, transporting, recycling, and disposing of solid waste to reduce the harmful impact on humans, the environment, and animals [4]. The SWM processes mainly consist of the deployment of bins, collection of waste, transportation, and recycling for disposal. Recycling is a process of converting waste into useful raw material.
The research contributions with their significance are illustrated below.
  • A descriptive statistical analysis of MSW generation in India is performed to uncover the current and future generation rate, total quantity, city and state-wise generation and distribution. The study also demonstrates the proliferation of waste generation in the proportion of population growth and land required for landfill disposal.
  • The study has performed a survey in a city to uncover and discuss the major issues in the existing SWM services in India. The thorough analysis of published research articles and government reports supports these issues. We have also identified some technologies and devices to deal with these issues in the prospect of sustainable urban and smart city development.
  • Based on the survey analysis, illegal dumping is identified as one of the major issues in India. Therefore, a multipath convolutional neural network (mp-CNN) model is proposed and implemented to detect and localize the waste dumps in imagery data. The study has constructed its own dataset to train and test the proposed model. Furthermore, future practical applications of the mp-CNN model are illustrated.
The study is organized into four sections. Section 1 illustrates the SWM framework, the research objectives, and their significance. Section 2 discusses the MSW generation scenario in the Indian context and presents the waste generation statistics derived from publicly available data. It also shows the impact of population growth and urbanization on waste generation patterns. Section 3 depicts the SWM system in the prospect of sustainable urban development. It also presents the various issues concluded from the survey data in the context of municipal services. Section 4 proposes an mp-CNN to detect and localize the waste in the images and represents the model evaluation criteria and results. It also demonstrates the applications of the proposed model in the context of developing countries, along with the conclusion.

2. MSW Generation Scenario in India: A Short Descriptive Statistical Analysis

India is the world’s second-largest country in terms of population, 1.21 billion according to the census 2011 [5], which is 17.7% of the world’s total population and consists of the largest block of the young population in the world. Some decades ago, two-thirds of the population of India primarily depended upon agriculture and associated activities as a source of income for their livelihood. During this period, the Indian economy significantly depended on the agriculture sector and obtained one-third of its total income from agriculture and allied activities. Nowadays, the Indian economy is very rapidly changing from agriculture to industrial and service-oriented. In 1951, agriculture and associated activities shared 51.45% of India’s national total economic output or gross domestic product, but in 2021, this share was reduced to 18.80% [6].
Consequently, the labour market of India is swiftly shifting from agriculture and associated activities to industrial and service-oriented activities. India is undergoing very speedy urbanization; more than 31.16% of the population live in urban areas. These 377.1 million urban people inhabit 7933 towns/cities [5]. India is a large country partitioned into 28 States and 8 Union Territories; it has more than 53 metropolitan cities (population of more than 1 million), which consist of more than 37% of the urban population [7]. In [7], it is estimated that the urban population will reach 575 million by 2030, and 50% of the country’s people will reside in urban areas by 2050. Fast urbanization, rapid economic development, and urban growth are not only impacting the physical size of Indian cities but also suppressing the infrastructural service around cities. The fast-urban settlement also gives birth to unplanned suburban accommodation of low-wage people. The urban economy must be developed to handle the urban and suburban settlement. The urban growth of India is remarkable, which is important for India to become a developed nation [6]. Along with rapid urbanization, India is also experiencing rapid population growth. The booming economy and speedy urbanization directly impact the living standards of the citizens.

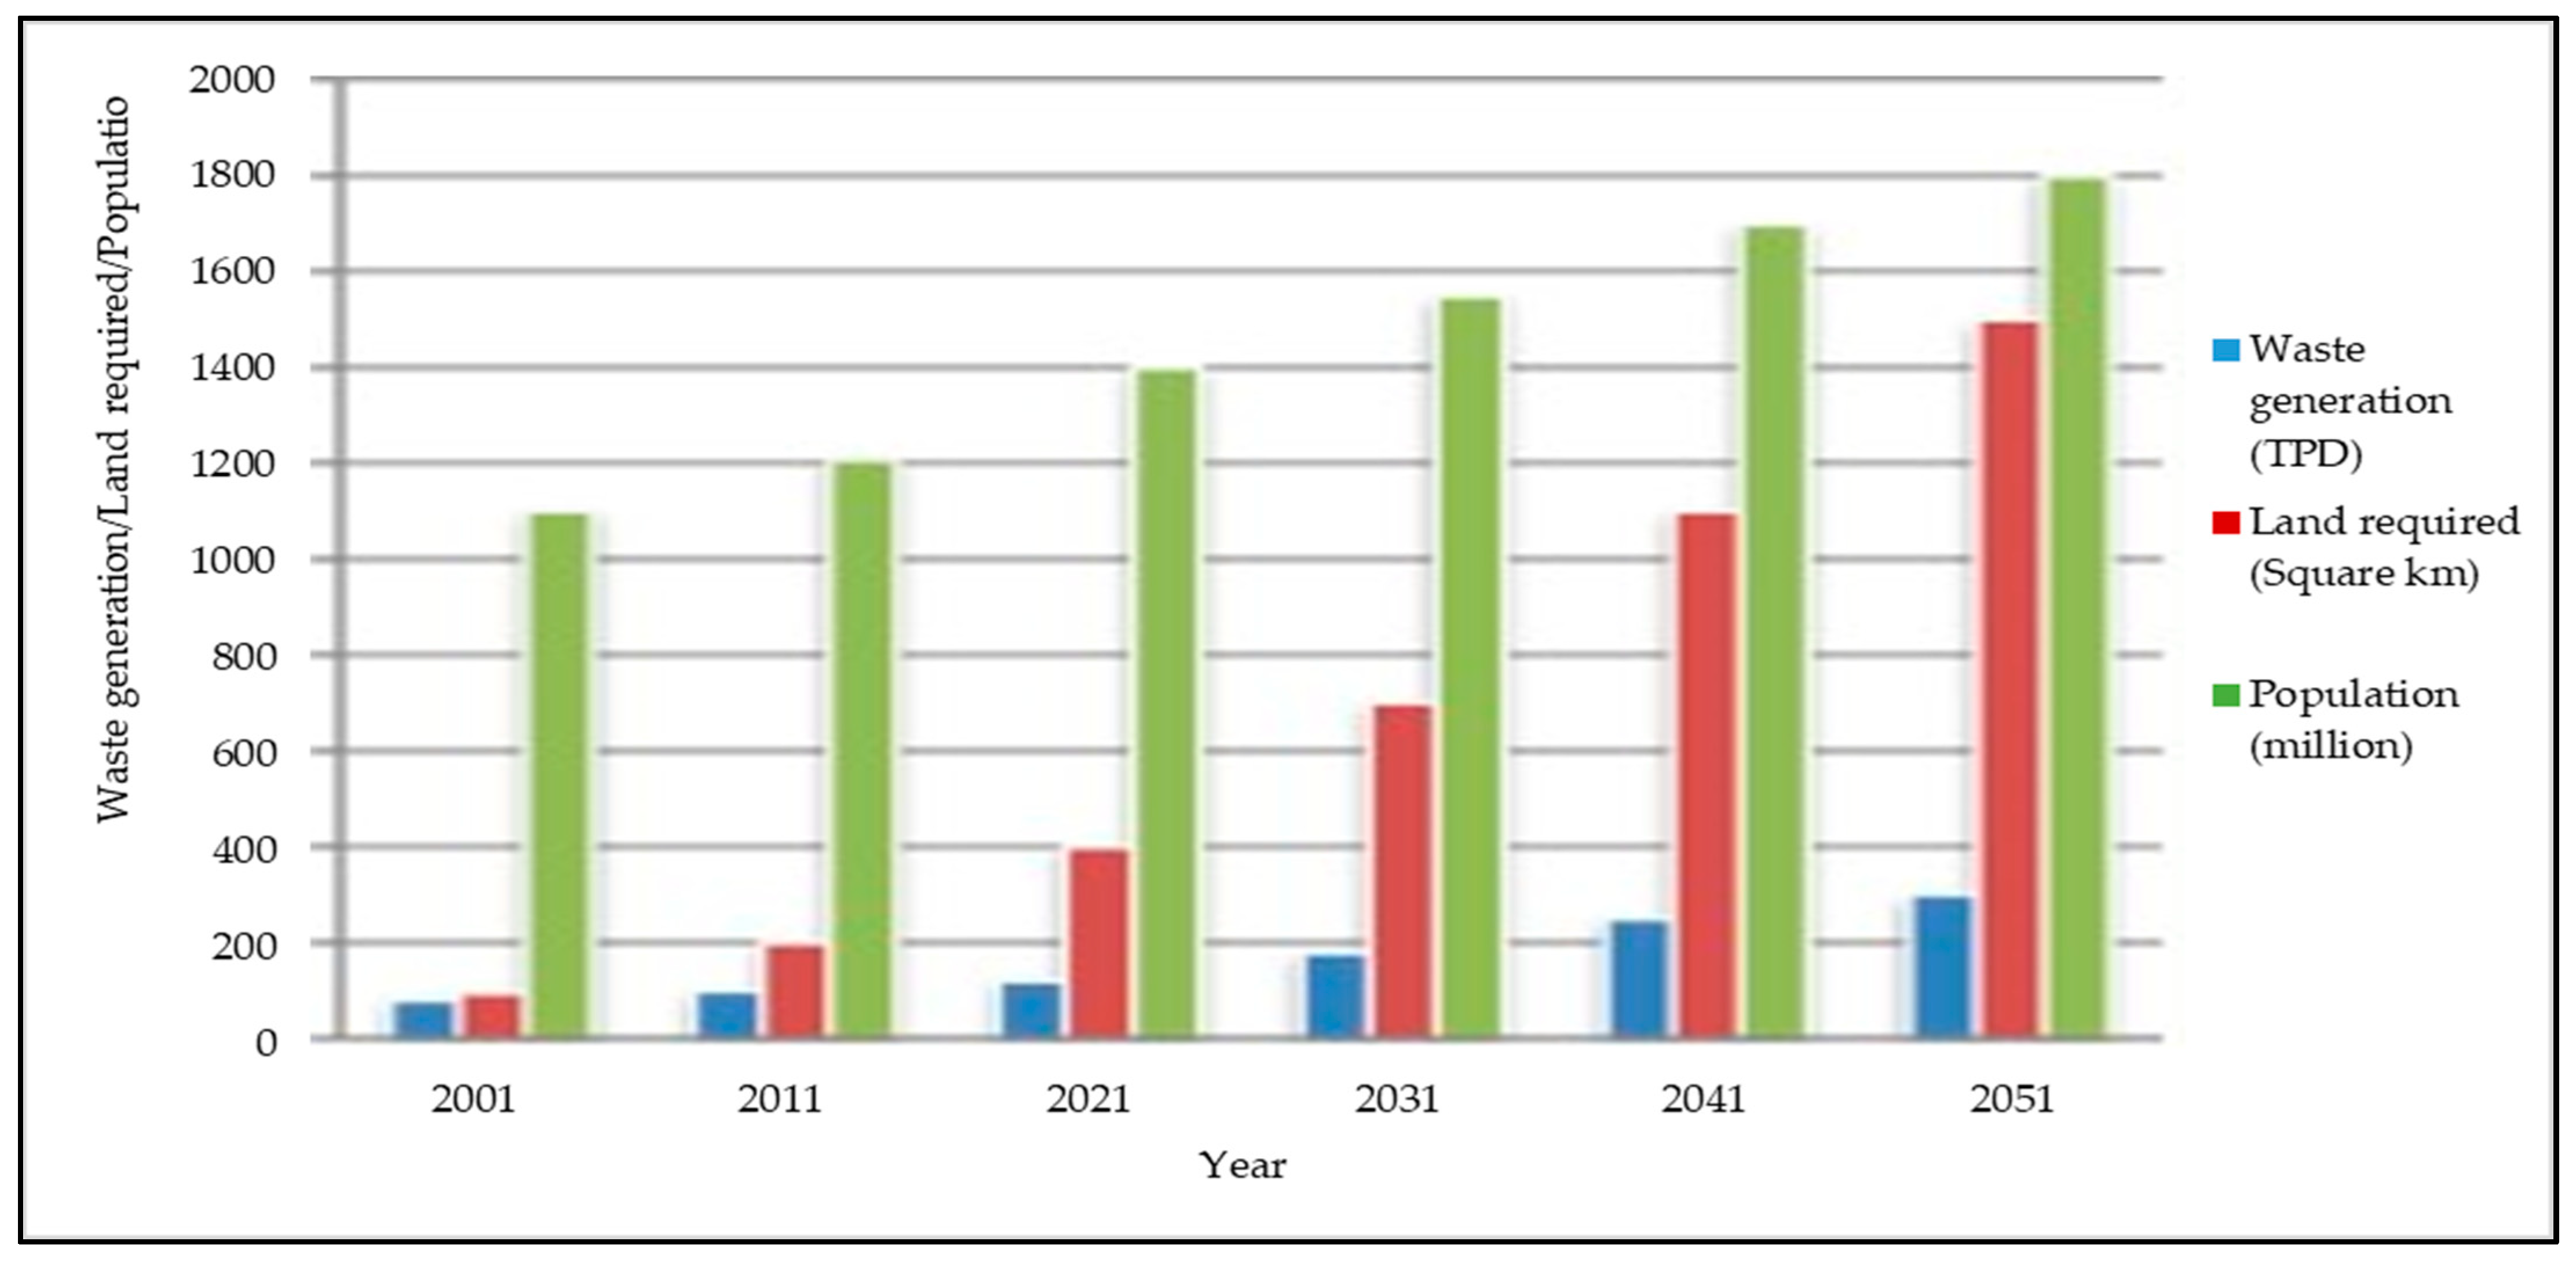
2.1. Population Growth and Waste Generation

Fast economic development, growing population, speedy urbanization, and rise in the living standard of citizens directly accelerate MSW generation in India [8]. In addition to the above waste generation influencing factors, India has a vast diversity in geography and climatic conditions (Tropical Rainy, Arid and Semi-Arid Climates, Humid Sub-Tropical Climate, Mountain Climate) and four seasons (Winter, Summer, Monsoon, Post Monsoon). The residents in the above zones have different consumption habits, so these zones have different waste generation patterns [9] and vast variations in the physical properties and chemical composition of waste [10,11]. However, no strong initiatives have been taken to investigate the waste generation patterns in urban areas of these zones, so researchers completely depend on the limited data issued by the different government institutes and boards of India. In the current scenario, SWM has emerged in the forms of problem, big challenge, and opportunity not only due to the impact on health, environment, and aesthetic concerns but also due to the massive amount of waste generated every day [12]. According to the 2021 report of the Central Pollution Control Board (CPCB), the MSW generation rate in India was 160,038.9 tons per day (TPD), approximately 0.119 kg per capita per day. Approximately 152,749.5 TPD (95.40%) of the total waste was collected and transferred to disposal sites. However, 79,956.3 TPD (50.00%) was processed and treated by all types of waste treatment facilities before disposal, 29,427.2 TPD (18.40%) was disposed of directly in a landfill, and the remaining 50,655.4 TPD (31.70%) was unaccounted for [13]. Many research studies and observations indicate that waste generation was in the range of 0.490–0.626, 0.431–0.550, and 0.170–0.620 kg per capita per day in 2018, 2012, and 2001, respectively. Table 2 illustrates the statistics of overall waste generated during the years 2000, 2009–2011, and 2021 in different states of India. The MSW generated comparison of the year 2021 with respect to 2000 shows that Tripura has registered the highest percentage growth while Andhra Pradesh has displayed the minimum. In the last decade, Manipur has shown the highest percentage growth in MSW generation, while five states marked in green colour have decreased their MSW generation.

2.2. Urbanization and Waste Generation

MSW generation is an inherited artefact of human life, naturally generated as a by-product in daily activities such as household, industrial, trading, etc. [14]. MSW generation rate and geographical distribution of waste volume are highly accelerated by urban settlement, economic prosperity, population growth, and upgraded lifestyle [14,15,16,17]. India, the second largest country on the globe in terms of human being enumeration, had a population of around 238.4 million at the turn of the 20th century. This number has grown more than four-fold in a century and a decade to climb 1210.2 million in 2011. According to Worldometers statistics, the approximate population of India was 1377.2 million in 2020, which is around 17.7% of the world’s total population [18]. The country is recording a fast population growth rate, which is the principal component that directly affects the increasing MSW in a country [19]. India has been experiencing a trade-off between the growing population and existing resources and services for many decades. Therefore, India is facing huge challenges in managing MSW generated by such a huge population [20].
Urbanization is one of the vital consequences of economic growth and heavily depends on the migration of people from rural to urban regions and the development of urban industrial zones [21]. India was a primarily rural country at the time of independence. Although transformation toward urbanization existed at that time, it was very slow due to an agriculture-based economy. Post-independence, India shifted to a mixed economy, which majorly accelerated the private sector in industrialization. According to the census of 1901, the urban population in India was 10.84% of the total [22] and steadily grew to around 14% in 1941 [21]. Figure 2 shows the total population along with the urban population from 1951 to 2011 (left) and compares the decadal growth percentage from 1961 to 2011 (right). The proportion of the urban population in the country accumulatively grew from 25.71% in 1991 (217.6 million) to 27.81% (286.1 million) in 2001 and 31.16% (377.1 million) in 2011 [22]. It grew to 34.03% in 2018 as per the annual report of the Ministry of Housing and Urban Affairs (MoHUA), Government of India [23]. The growth of the urban population was 3.3% of the total during 2001–2011 compared to 2.1% of the total during 1991–2001 [23]. In the annual report of MoHUA 2020–2021, it is estimated that the urban population will reach 575 million by 2030, and 50% of the country’s people will reside in urban areas by 2050 [7]. According to the report of the United Nations in 2007 on the “State of the World Population”, it is predicted that 40.76% of India’s total population will reside in urban areas by the year 2030 [24]. Urbanization is directly accelerating the volume of the population with relatively higher income. Therefore, urban regions have a significantly large proportion of middle- and higher-income group people as compared to rural regions [21]. The high growth in an urban population gives birth to massive and crowded cities, which directly increases the MSW generation. R. K. Annepu analysed the data from 366 Indian cities from 2001 to 2011 and obtained a growth of 50% in one decade [25].
Furthermore, it is also estimated that India’s urban population will produce 107.01 million tons of waste per year by 2031 as shown in Figure 3. Figure 3 also shows that it will be 160.96 million tons per year by 2041, which is approximately a five-fold growth in four decades. Figure 4 shows the decadal prediction of population, waste generated, and land requirement for its landfill disposal [25]. This estimation indicates that 1400 square km land will be required to dispose the waste in 2051. This huge quantity of urban waste must be appropriately managed in an environmentally safe manner so that it cannot adversely impact the inhabitant health, surrounding environment, and the daily life in Indian cities.

2.3. Metropolitan Cities and Waste Generation

The urban settlement growth rate significantly dropped during the decades 1981–1991 and 1991–2001 but marginally increased in 2001–2011. Surprisingly, the huge number of towns increased from 5161 to 7935 during 2001–2011, while the urban population growth was marginally low, from 31.48% to 31.80%. Concurrently, the count of metropolitan cities (one million plus population) climbed to 52 during 2001–2011, compared to 35 in 2001. According to the annual report of MoHUA 2017–2018, India consists of more than 53 metropolitan cities, housing more than 45% of the country’s urban population, which is unprecedented [23]. These metropolitan cities are accountable for generating one-third of GDP while covering approximately 0.2% of India’s total land area [26]. The growth in per capita waste generation is the major consequence of urbanization and industrialization [27]. The effective SWM system becomes a major challenge in metropolitan cities due to high population density [19]. It is predicted that waste generation in urban India will be 0.7 kg per capita per day by 2025, which is nearly four- to six-fold higher than in 1999 [19]. The waste generation patterns and the percentage growth of top-populated metropolitan cities with a population of more than one million are compared in Table 3 [28]. In some metropolitan cities, the amount of waste generation became more than two-fold in 2015–2016 compared to 1999–2000 [28]. The analysis of percentage growth shows that waste generation in metro cities is growing very high. Table 3 shows that the waste generation in Delhi and Bangalore has abruptly grown in one and a half decades (1999–2000 to 2015–2016) with a rise of 2075% and 1750%, respectively.

2.4. Per Capita Waste Generation

Based on the above analysis, it is deduced that waste generation is directly proportional to the population size. Therefore, as the population grows, the waste generation rate and per capita generation also grow. Table 4 compares the per capita per day waste generation for different population sizes based on different reports. Table 4 also compares the decadal growth in per capita per day waste generation based on the report by CPCB [9,29] in 2000 and the author Annepu [9,25] in 2012. This comparison indicates that per capita per day waste generation has significantly increased this decade. A similar conclusion can also be drawn over the half decadal from the reports by author Annepu [9,25] in 2012 and the CPCB report [19,30] in 2018. Figure 5 represents the predicted per capita waste generation rate by the years 2030 and 2050 for different income group countries [3]. India’s average per capita waste generation rate in 2018 is approximately equivalent to lower-middle income group countries. This indicates that India has become a lower-middle income country from the lower income, and based on the urbanization rate in India, it can be predicted that it may belong to upper-middle income group countries in the near future.

2.5. Deduction from the above Statistical Analysis

2.5.1. Analysis Significance and Usability

The above analysis is performed based on the reports published by various bodies under the Government of India (CPCB, MoHUA, Ministry of Environment, Forest and Climate Change, Office of Registrar General and Census Commissioner, etc.) and numerous research articles and scientific reports from quality publishers (Springer, Elsevier, etc.) along the World Bank report on global waste. Therefore, all information presented in the analysis is reliable and can be confidently used in further SWM research, planning, and policymaking. We have presented waste generation and collection data according to different aspects to draw a clear picture of waste generation in India. This consolidated analysis of data will be significantly helpful to improve the SWM services in urban to rural areas as it demonstrates the waste generation patterns according to population size with per capita daily generation. We have also presented waste generation in different states and cities of India for different years to predict future generation patterns. We have compared the total and urban population in terms of count and percentage growth and predicted the urban population growth and per capita per day waste generation for this urban India. Furthermore, waste generation, population growth, and land required for disposal are also illustrated. Finally, it is confidently concluded that this analysis presents highly reliable information and is significantly useful for future researchers and various officials.

2.5.2. Conclusion and Waste Generation Impact on SWM Services

Table 2 and Figure 2 (left) show that the waste generation rate has significantly increased throughout India with the increase in population. This indicates that the waste generation rate is directly proportional to population growth. Table 4 compares the different population sizes with per capita per day waste. This comparison concludes that the waste generation rate increases as the pollution of the city increases, which means urban regions produce more per capita waste than rural areas. This deduces that urbanization is another major factor that influences waste generation greatly. This table also shows that significant waste generation growth is noticed decadal. India produces a huge amount of waste daily; a considerable quantity is not collected and is left unmanaged. This gives birth to illegal dumping on streets and roadsides. Illegal dumping results from urbanization, increased living standards, lack of resources, and poor management.

3. SWM in Prospect of Sustainable Urban Development

3.1. Concept of Sustainable Development and Smart City

Nowadays, the development paradigm has completely shifted from conventional methodology to a smart and sustainable development approach, a popular catchphrase in contemporary development. Incorporating innovation in sustainable development has evolved due to the pervasiveness of the Internet of Things (IoT) technology and ubiquitous Internet connectivity. The development of urban areas innovatively and sustainably is called a smart city. Now, the smart is defined as an urban region incorporated with intelligent systems or a city with plans, concepts, and people with intelligent understanding. Here, the smart systems are not bounded to information and communication technology (ICT)-based ones; the term smart refers to the intelligence to create new designs, organizations, services, etc. In this view, the smartness of a city can be interpreted as integrating all its resources to effectively attain goals and fulfil the set objectives and purposes [32]. A smart city is an urban area that incorporates spatial technologies, IoT technologies, and ICT to transfer information for regulating the resources and managing the city services in an efficient way [33]. These services include waste collection and transportation to recycling and landfill disposal facilities [34].

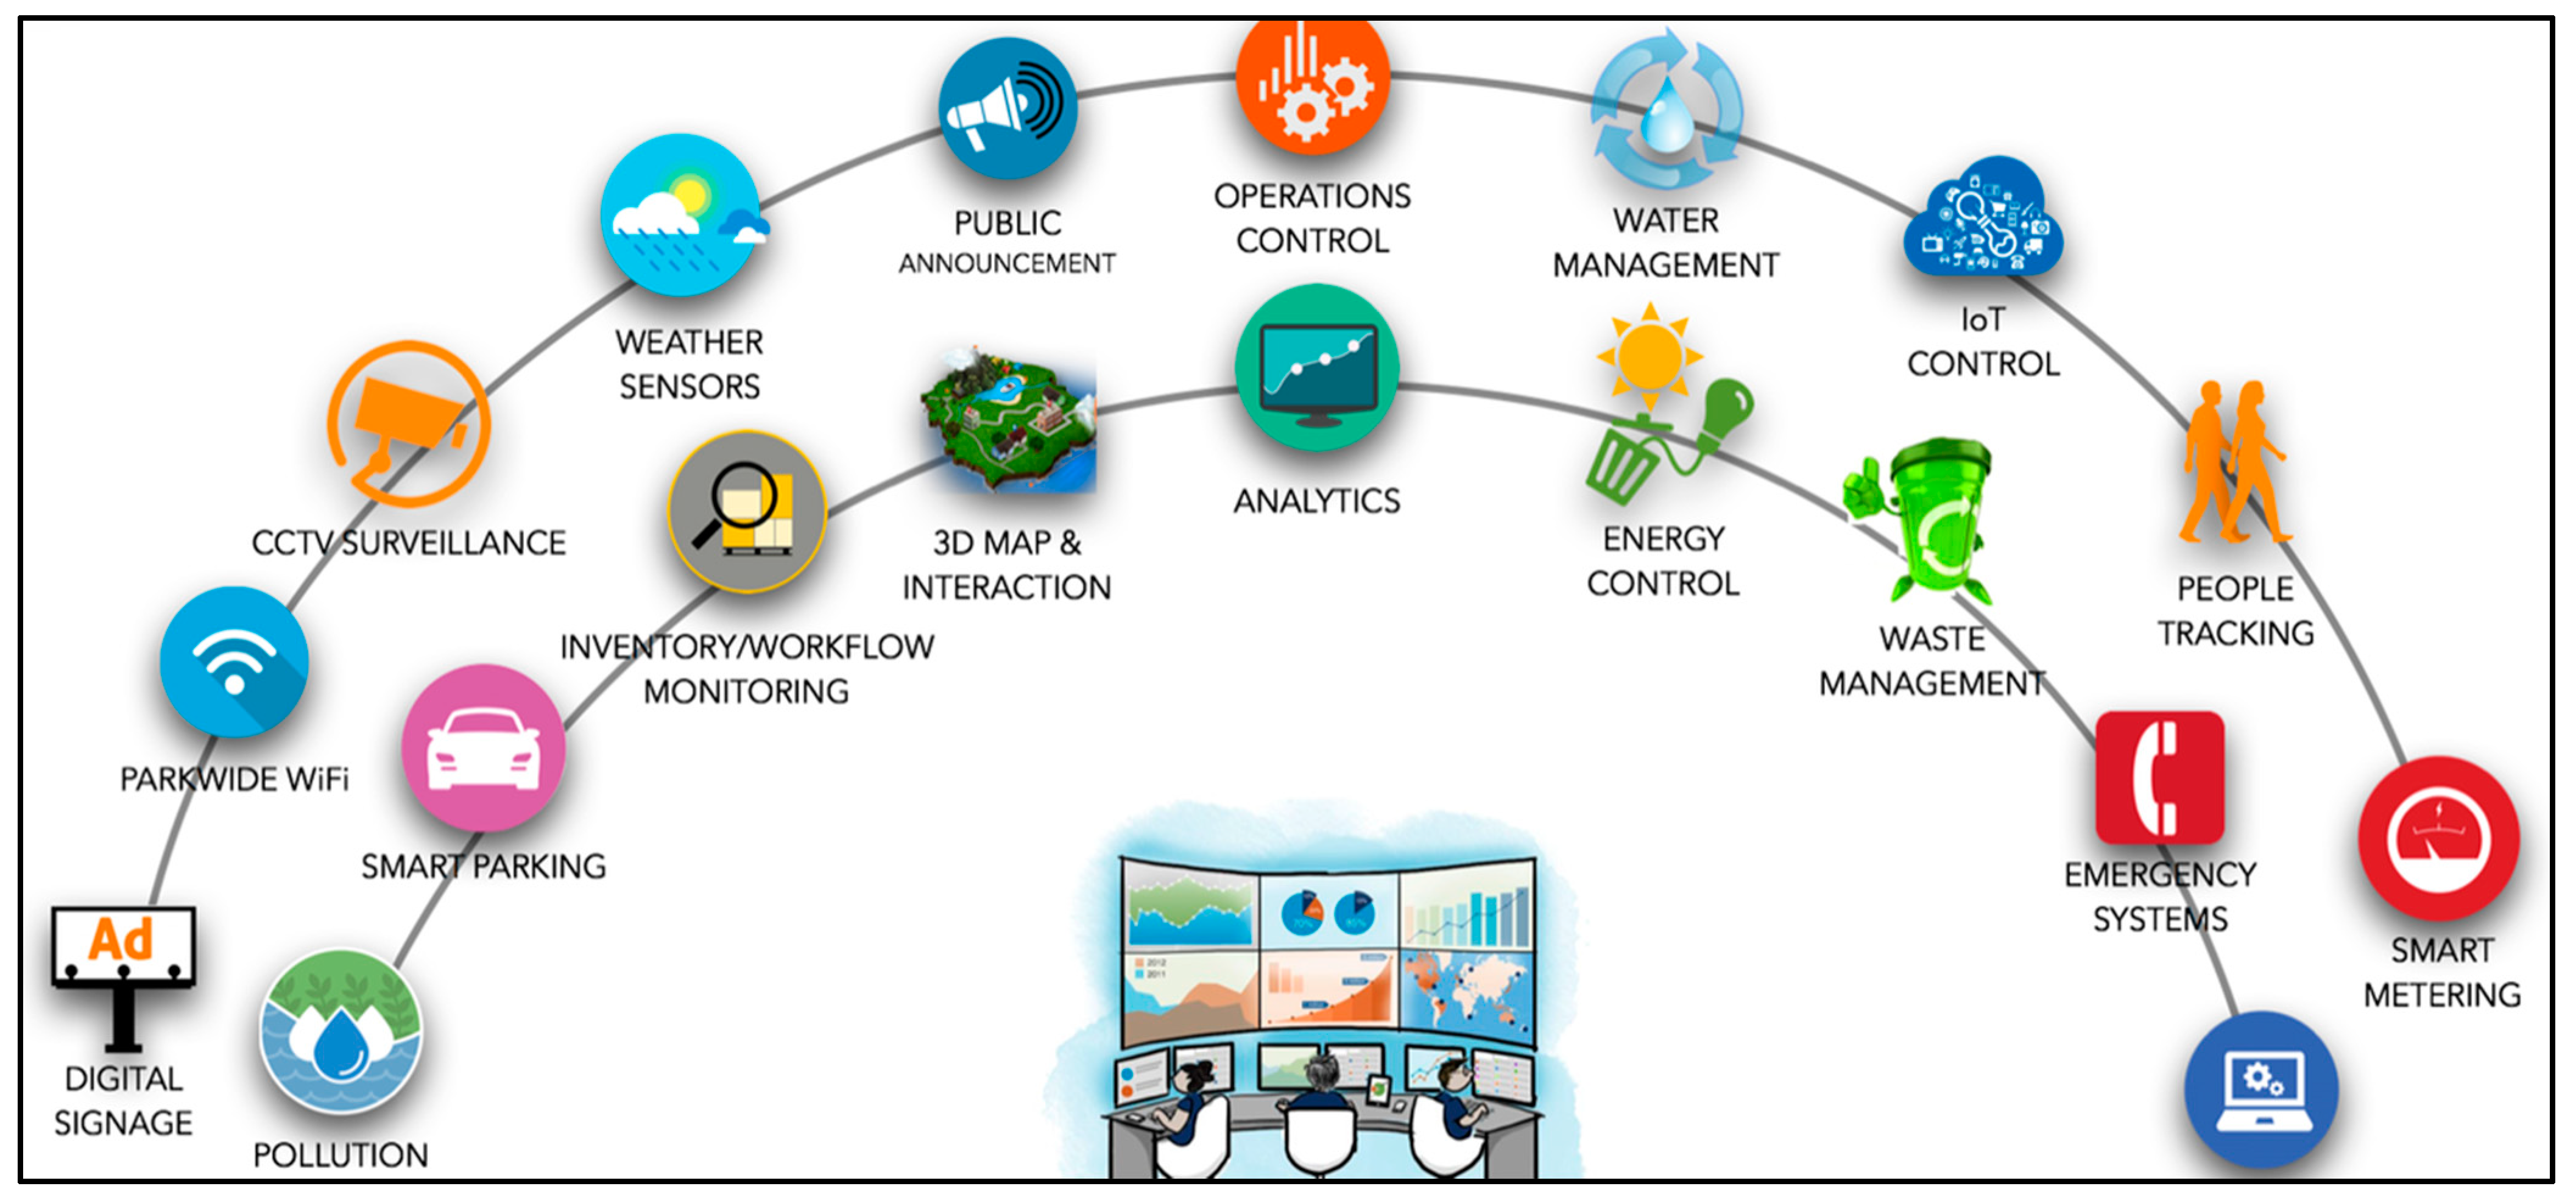
3.2. Smart City Services

It uses ICT, IoT, and other advanced technologies to deliver healthcare, hospitality education, safety and security, and other services in the urban space. It is a digital service that reacts and performs decisions based on the analysis of data collected from networks, intelligent technical systems, and various platforms [35].
Moreover, these components are interconnected through ICT infrastructure and needed data collection. They are also integrated with the hard-urban infrastructure to provide intelligent services to all residents of a city. In addition, governance and control over the subsystems are essential to become a smart city’s vision and mission success. Figure 6 demonstrates the service framework of an ICT and IoT-enabled smart city, where SWM is one of the services. It is deduced that a smart city comprises a broader range of services in the urban space to provide life in dignity and prosperity on a healthy planet. Smart SWM is one of the vital services to create a clean and green city that ultimately contributes to building a smart environment.

3.3. Smart SWM System

In the current era of urban development, the concept of a smart city has significantly emerged to improve the quality of life through the integration of ICT, IoT, and other cutting-edge technologies. Therefore, the traditional SWM system must be migrated to an intelligent SWM system in urban areas for waste collection, transportation, disposal, planning and policymaking to achieve the goal of a smart environment, one of the components of the concept of the smart city mission.
Now, a smart SWM system can be defined as a system that involves the utilization of ICT and other cutting-edge technologies to make the waste collection and transportation process more efficient in terms of running cost, time, and resource utilization in an environmentally safer manner [36]. Generally, these systems are equipped with IoT and ICT components used to capture and transfer data in real-time [36]. The collected data help to optimize waste collection routes and schedules and prompt future innovation. Figure 7 presents a schematic smart SWM system built based on the literature analysis.

3.4. Analysis of Current SWM Services in Prospect of Technological Drawbacks

SWM is an important pillar in the vision of sustainable urban development, consisting of waste collection, transfer, segregation (at source and recycling centres), treatment, and disposal to curtail the adverse effects on the environment and inhabitants; improve the city’s cleanliness and reputation. Waste separation at source, collection and transportation resources, waste treatment facilities and scientific disposal are substantially inadequate, which prompts environmental deterioration, poor health, and a pathetic lifestyle [37,38]. Unmanaged MSW has also been identified as a cause for communicating innumerable ailments [38]. The increasing waste generation rate is producing a management crisis, especially in city authorities of low-income developing countries like India, because it poses a high financial burden on low-budget municipalities [39]. Another major reason for the management crisis is a lack of perception of long-term management over a variety of tasks involved in the SWM system [39]. After an exhaustive analysis of many research articles, it is realized that India’s municipalities cannot manage such a tremendous amount of MSW because of the financial crisis and weak institutional administration.
Additionally, municipalities do not have adequate resources, infrastructure, and suitable management strategies to enhance the MSW services. Numerous studies have evaluated SWM services, waste generation patterns, and their compositions [40,41,42,43,44]. Door-to-door waste collection, shortage of waste bins in residential and market areas, sorting of waste at source and disposal, lack of technologies involved in waste treatment, scarcity of land for disposal, inefficient collection and scientific disposal methods which battle for MSW disposal optimization, are some major concerns of the municipalities [12]. Along with the above concerns, political intervention directly influences the smooth functioning of local authorities. Due to a lack of monitoring and weak management of municipal authorities, siting of MSW disposal sites directly threatens air, surface, and groundwater pollution [45]. The illegal dumping of MSW on the city’s outskirts, roadsides, and riverbanks is also creating economic, social, and environmental vulnerability in suburban areas [45]. After many drawbacks, obstacles, and dragging forces, municipalities have put great effort into improving the overall SWM service framework [46].
The study performed a survey in a city in India. It is a medium size city in population. The survey comprises two activities to record the data. First, waste dumping sites were manually visited to determine why people throw garbage in the streets or open areas. The responses were recorded and analysed. Additionally, published research studies, reports, and surveys were thoroughly investigated to uncover the issues. Based on these analyses, several issues are identified in the existing SWM system, especially in developing countries like India. These issues are enumerated as follows:

3.4.1. No Prediction about Future Waste Generation for SWM Planning

The existing SWM system does not monitor waste, so municipalities lack data about waste generation. As a result, municipalities cannot predict the amount of waste generated in the future. This lack of prediction will lead to improper SWM-related infrastructure development and resources needed as municipalities do not know how much waste they will manage in the future.

3.4.2. Scarcity of Data Analytics Tools Applications

The regular SWM system neither involves any real-time waste data nor performs regular offline surveys to collect valuable data related to waste generation. Consequently, municipalities lack data and cannot apply any data analytics tool to determine the waste generation patterns in a particular area or a bin. This scarcity leads to inappropriate planning and poor services.

3.4.3. Low Efficiency in Waste Collection

The regular SWM system comprises a fleet of waste collection vehicles and their drivers that follow a predefined fixed path without any information about the fullness status of the bin. This system does not measure the bin’s current waste level (empty, semi-empty, full). Therefore, drivers visit all the bins. As a result, semi-empty bins are emptied; in contrast, already-filled ones need to wait until the following collection round. Furthermore, since drivers visit empty bins, waste collection through predefined fixed paths yields a waste of time, fuel consumption, and excessive use of resources. The system performs inefficiently and needs high operational costs. Overall, this system does not have the tools and techniques to optimize schedules and waste collection routes. Low efficiency is considered a major drawback of the current system.

3.4.4. No Real-Time Monitoring

The existing system does not perform real-time bin and waste-collecting vehicle tracking. Besides the current waste level monitoring, the system does not measure the environmental and hazardous indicators such as temperature and methane gas concentration; therefore, it is impossible to know when a fire occurs in the bin. In addition, another drawback is being unable to track if any movement happens in the bin.

3.4.5. Unavailability of Online Platform or Web Portal

The current system does not have any platform or web portal to keep track of the drivers operating on the field. Furthermore, there is no such platform or web portal to enable the citizens to participate in SWM services such as registering a complaint and urgent services to remove waste scattered or dumped in residential areas.

3.4.6. No İllegal Dump Monitoring

The existing SWM system does not comprise any process to identify and localize the illegal waste dump on roadsides and residential areas. Moreover, it does not perform regular surveys and checks to determine these dumps. However, the municipality employees manually verify if someone makes a complaint regarding this and remove it if it is found. This traditional method of illegal dump identification and collection comprises humans who move around the city to identify the illegal dumps. The frequency of waste dumping on streets and roadsides has significantly increased due to growing waste generation and scarcity of dumping spots. This open dumping primarily impacts the city’s cleanliness and deteriorates the environment and inhabitants’ health.

3.4.7. No Analysis of Citizens’ Behaviour towards Waste

The existing SWM system does not assess the role of citizens in successful waste management. People play an essential role in making the waste collection process highly efficient in time and energy. If people are attentive and know about the consequences of waste scattering in the open, they will take proper care during the dropping of waste so that waste cannot drop outside the bin. However, according to the survey, people have less awareness about the consequences of waste scattering. They do not possess a positive attitude towards waste, especially in developing and economically weak countries. Therefore, they do not take proper care and drop the waste around the bin. Due to people’s behaviour, a flood of waste seems to be in the proximity of the bins. This attitude leads to environmental pollution, damages the city’s cleanliness, and makes waste collection from the bin time-consuming, tedious, and inefficient.

3.5. Identification of Different Technologies to Overcome the above Issues

This section concentrates on the progress of applications of advanced technologies in SWM systems. A thorough analysis of the literature is performed to achieve this goal, and different ICT [47,48], IoT devices [47,48], and image processing technologies [49] are identified that have been applied in developing an intelligent SWM service framework. The identified technologies are effective solutions to overcome the identified issues in the existing SWM systems. The identified technologies with their applications are listed in Table 5.

4. Illegal Dumping

Illegal dumping, also known as fly-tipping, is an activity that is performed purposely to dispose of waste in unapproved government or personal-free areas on streets and roadsides. The major reason behind illegal dumping is waste bin allocation at improper locations or no bin, most prominently for personal convenience and saving money and time. We have analysed that India generates a huge amount of waste daily, and the generation rate is also very high. This huge amount and high generation rate give birth to illegal dumping on the streets and roadsides. Illegal dumping is a common problem in India and can be noticed everywhere, from rural residential to urban residential areas. This unauthorized littering has become a serious and complex waste management issue for municipal administrations, especially in developing countries. It creates many risks for human and animal health, social prosperity, the environment, and the entire ecosystem [50,51]. In addition, it is one of the causes of habitat damage, flora and fauna death, underground and surface water pollution, and soil and air pollution. It is also a major reason for the aesthetic deterioration of any natural landscape and damages the cleanliness of the city and its reputation around the world. Nowadays, this problem is frequently observable, ongoing, and expensive to keep under control [52]. When an illegal dumping site is identified, municipal administrations frequently send an abatement team to remove and clean it as soon as possible because contained materials like batteries, oil, metals, etc., can cause severe consequences, in rare cases an explosion. Many studies and reports exhibit that removing illegal dumps is significantly more expensive than regular waste collection by the municipal administration. It needs a lot of infrastructures, human resources, time, and money without any remuneration [53]. Illegal dumping is considered a wicked problem due to its complex nature regarding social and political involvement and hazardous effects on the environment, inhabitants’ health and well-being [54]. Several studies and reports have stated the various factors strongly related to inefficient and ineffective waste management services in developing countries. These factors are rapid population growth, massive urban settlement, urban development, insufficient waste collection and removal infrastructure and human resources [6], inadequate service facilities, and lack of policy enforcement and awareness about the consequences of illegal dumping [55]. Generally, these factors instigate the practice of illegal dumping.
Moreover, the high landfill entry levy in developed and developing countries [56] is another major cause of encouraging many waste producers to dump illegally [57]. In [58], the author identified a unique cause of illegal dumping in South Africa. Here, people believe that some employment is generated when illegal dumping occurs. The municipal administrations have faced many challenges dealing with the illegal dumping problem. Based on the literature, government reports, and media articles, one major challenge is the illegal dumping sites or points of location identification and its immediate removal after localization. Governments and environmental authorities have also failed to control its inception because they have failed to make people aware of open dumping ill effects. Moreover, people are also not self-conscious enough to protect them from the bad impacts of dumping for their convenience.

4.1. Deep Learning

Machine learning has been utilized in numerous fields, namely, health care, environment, remote sensing, etc., to enable humans to deeply analyse and perceive their ecosystems. Machine learning comprises a subset of artificial intelligence techniques that enable the systems to learn and make decisions automatically without explicit commands. Machine learning algorithms automatically enhance themselves from experience without human intervention. It is a systematic study of algorithms and statistical techniques to analyse and deduce a conclusion from insight and patterns in data. It is one of the most prevalent computational techniques due to the unique features of computing. Likewise, machine learning consists of an indispensable set of techniques called deep learning (DL). A convolutional neural network (CNN) is an epoch-making category of deep neural networks, commonly known as DL. CNN has gained the highest popularity and has exhibited remarkable growth in visual and image recognition. Generally, CNNs are employed to analyse visual imagery and perform tasks beyond classification. With the advancement in computer hardware and computing speed, they have emerged as a core solution in a wide range of tasks such as Facebook’s photo tagging, medical diagnosis, environment, security, self-driving car, waste classification, and event detection to determine people behaviour towards waste [59]. Therefore, CNNs are the best alternative to identify and locate the illegal activities in a city using satellite imagery data. CCNs have the capability to extract and learn features directly from the images and then perform categorization with high precision [60]. TensorFlow is a core open-source software platform that helps develop the CNNs models and especially emphasizes training and inference. Figure 8 depicts the schematic workflow diagram of the implemented model.

4.2. Related Work for Dump Detection

Before the digital era, SWM-related tasks such as waste dump detection, classification, and sorting were performed manually. During this period, potentially suspicious locations for illegal dumping were inspected by humans, and waste segregation for recycling and disposal was performed by hand. The illegal dump detection procedure was expensive, time-consuming, and labour-intensive for large areas. After evolving Earth observation technology (remote sensing––especially satellite imaging), large areas or territories can be captured in high-resolution aerial images. Therefore, computer-assisted identification of dump locations has emerged as an attention-seeking topic among research communities. After the smart city development, each city establishes a surveillance system to provide safety to its people and monitoring infrastructures. This system provides street-level surveillance and captures the video for the same. These video data can be used to determine illegal dumping at the street level, which generally occurs due to a lack of community bins, their locations and most crucial, people’s towards waste [59]. The published methods or techniques to identify the waste dump at the street and territory have been evaluated and distinguished based on three main criteria: input data, method or technique used, and core task performed, i.e., output. The assessed studies are demonstrated in Table 6.

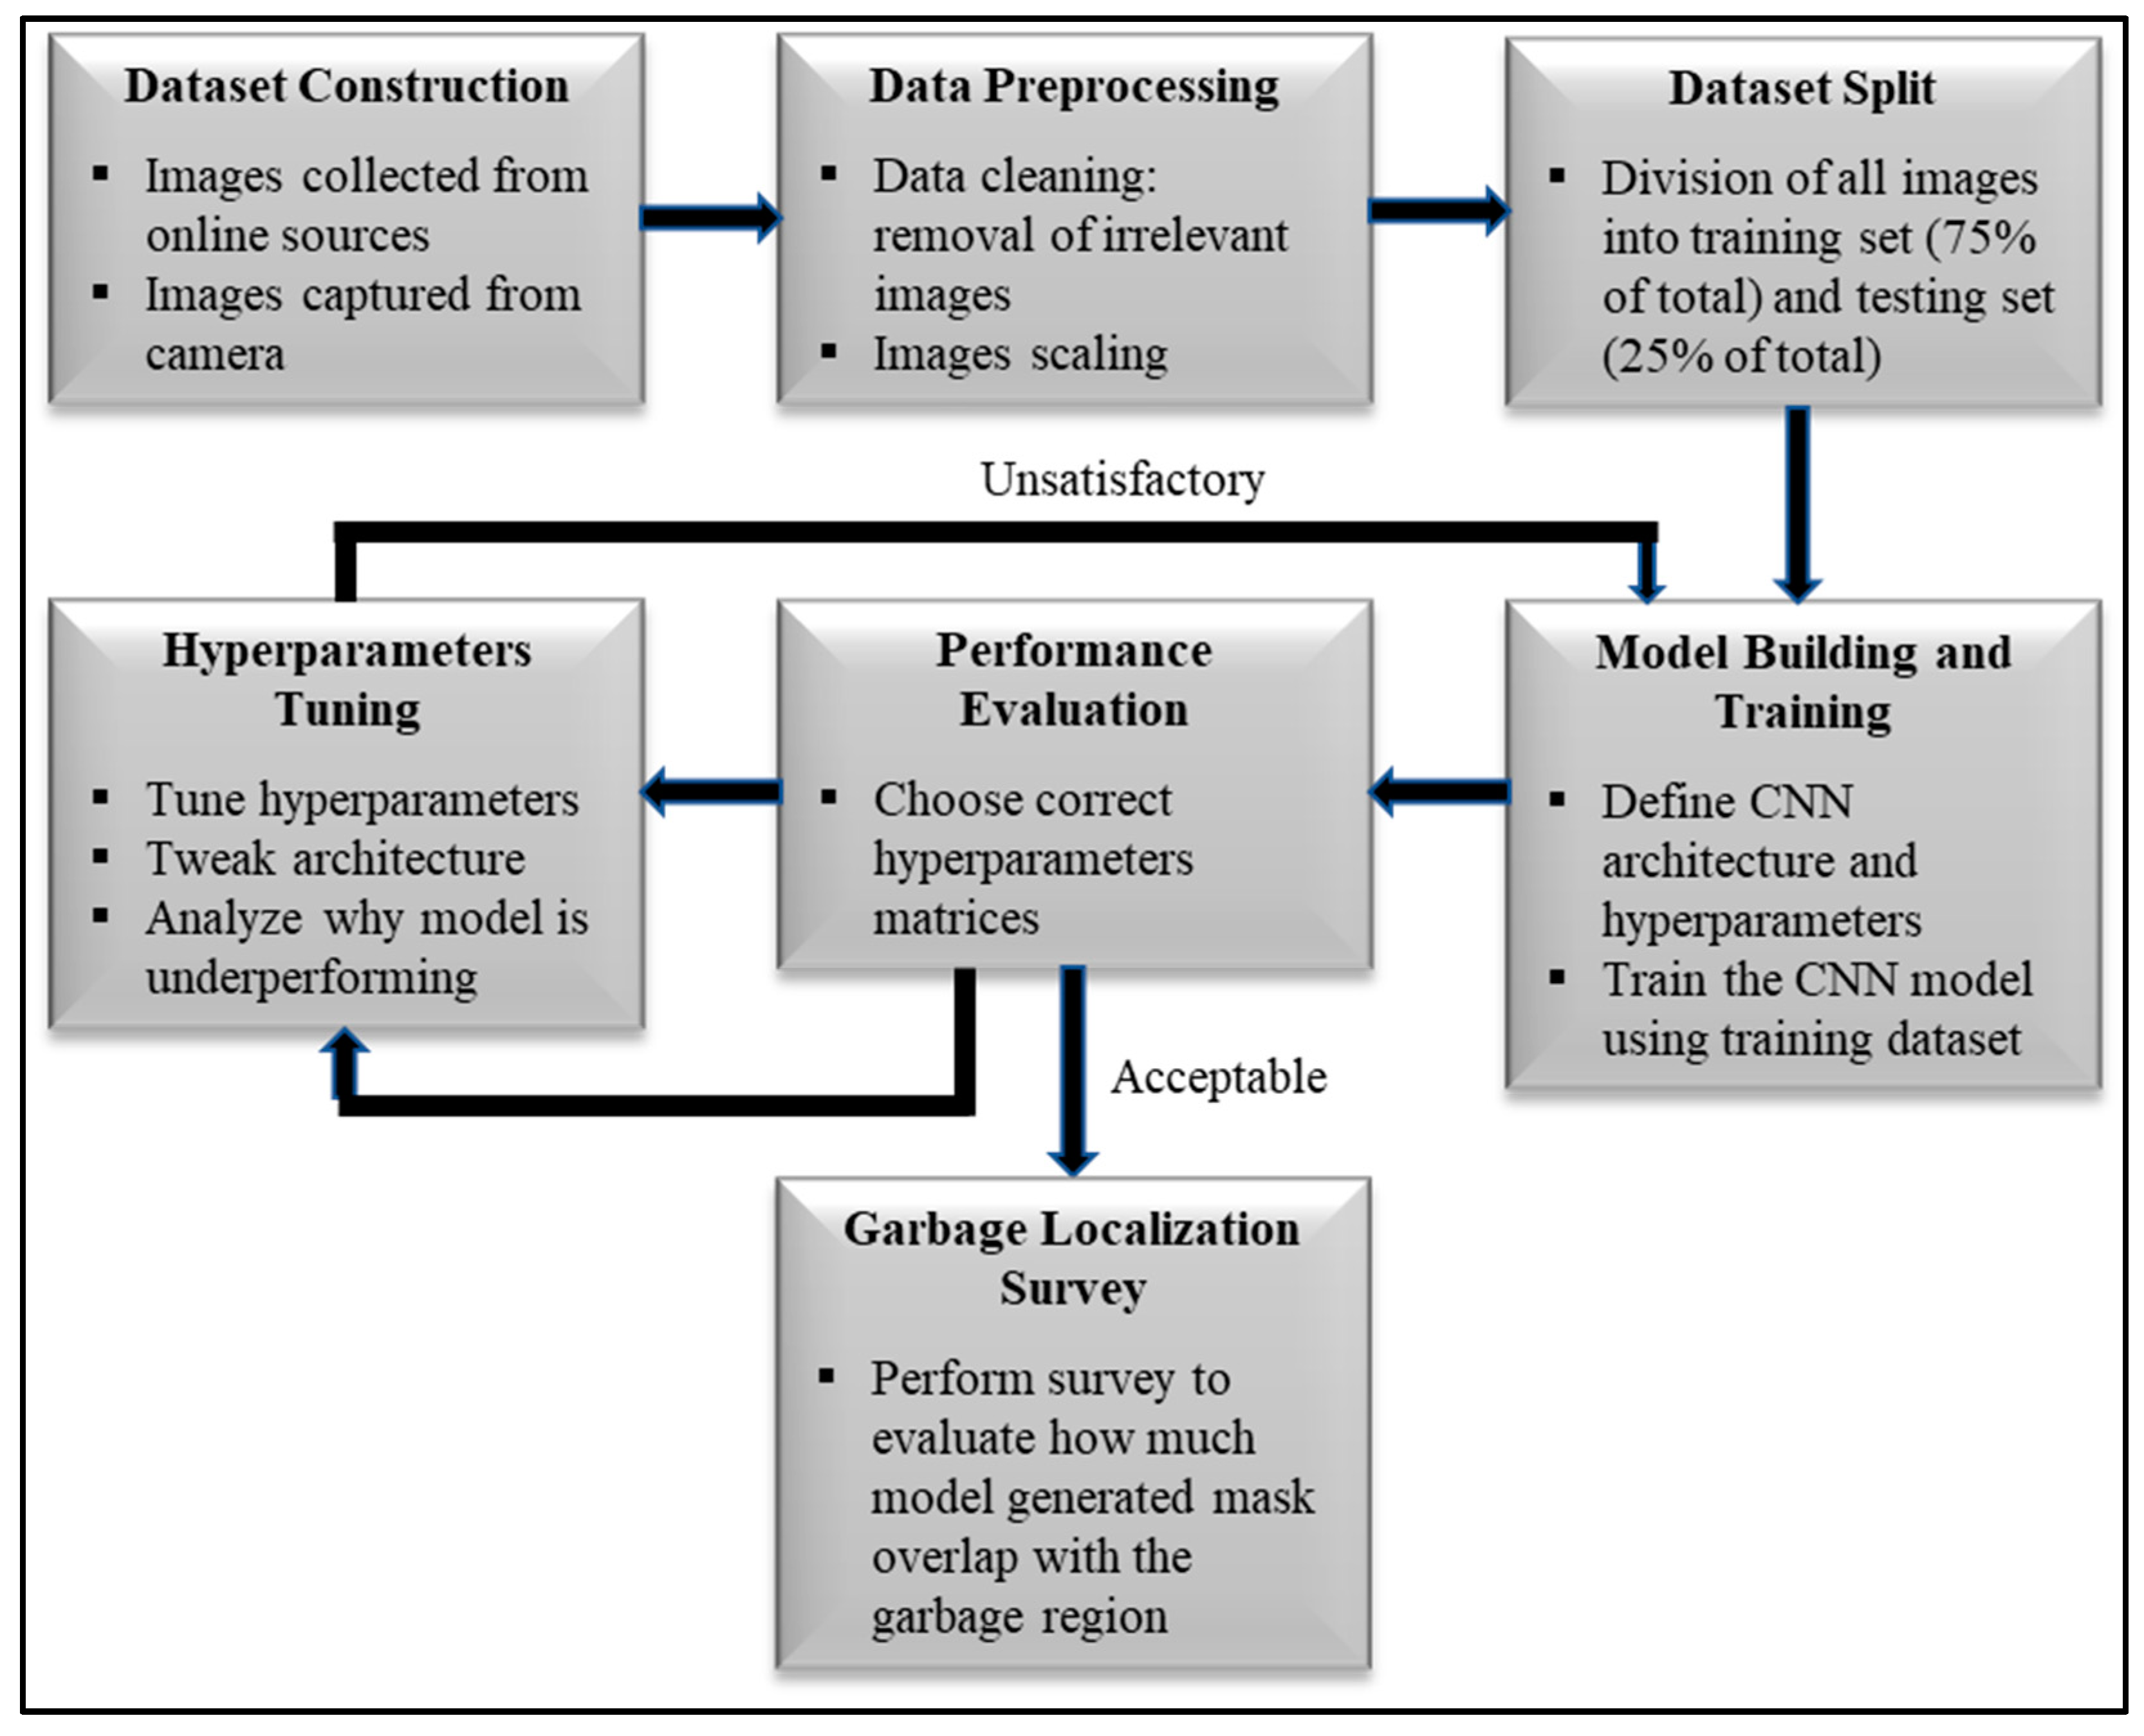
4.3. Proposed Methodology for Illegal Dump Detection

Generally, the computer vision problems like recognition and localization are solved using fully supervised learning methods. In fully supervised learning, a large number of images labelled at the pixel (data point) level are utilized for training the predictive model, in our case, mp-CNN. The pixel-level labelling means each pixel is tagged with its ground truth [85]. Suppose the fully supervised learning approach is used to solve the recognition and localization problems using mp-CNN. In that case, each pixel in all images of the studied dataset must be tagged manually with its ground truth. Manual tagging of ground truth is a highly cumbersome task which involves huge labour costs and time. Therefore, we have applied the weakly supervised learning method to overcome the above disadvantage. The mp-CNN model is trained based on the image label in this approach. Here, the label shows an individual image’s actual class (ground truth). Therefore, in our case, each image is tagged with its true classes (waste and non-waste) to construct the studied dataset. We have proposed and implemented an mp-CNN architecture to detect and localize an image’s waste regions (illegal dumps). The proposed mp-CNN is trained for two classes using a self-constructed dataset. During the testing phase, the model predicts the class of an input image by performing a global average pool over the segmented probabilities estimated by the mp-CNN. The proposed model exploits the global average pooling to enable the weakly supervised learning algorithm. We performed processing over the segmented probabilities mask generated by the model. The noisy edges were removed from the output images if the generated segment region was lesser than a predefined threshold size; in our case, it was 25 pixels. Finally, the implemented model has successfully identified the waste dumps on streets or roadsides if the input test image comprised the waste regions. The result analysis shows that the model has performed remarkably in its prescribed task. Therefore, it has a very high scope in developing smart and sustainable waste management service framework.

4.3.1. Dataset Construction

In the last two decades, a huge amount of research has been performed in image detection and recognition due to the accessibility of large annotated datasets, such as MNIST, Open Images Dataset, MS-COCO, VisualQA, ImageNet, CIFAR-10, the Street View House Numbers (SVHN), etc. Furthermore, this research has grown multi-fold in recent years due to the rejuvenation of CNNs. The main cause of the wide applicability of CNNs is the abrupt growth in computation speed and resources. The ImageNet dataset comprises approximately 10 million images with natural scenes, categorized into more than 1000 classes. This dataset is larger than the existing dataset used in machine learning research. These publicly accessible massive datasets are used as a backbone to train the CNN models. Due to these datasets, CNN models have shown significant improvement in the accuracy of object recognition and segmentation tasks [86]. The literature analysis of benchmark datasets shows that no dataset comprises a class to train the mp-CNN for waste localization in the images. Furthermore, no exclusive dataset is publicly available to perform waste recognition for illegal dump detection. Therefore, we constructed our dataset for two categories to achieve our research objectives.
We constructed a dataset to train our model. Our dataset contains 6000 images for each class (waste and non-waste), and all dataset images were gathered from various sources on the internet and captured through our camera. Both authors manually categorized all collected images, and those images were put in any of one of the classes if both agreed on the same, otherwise the image was discarded. An image was put in a waste class if it had the size of a waste region of approximately 25% or more of the total image size; otherwise, it was discarded, and no-waste images did not comprise any waste region in them. The constructed dataset is unambiguous in classification within the range of human perception of recognition. In the constructed dataset, labelling was performed at the image (instance) level, not the pixel level. The data distribution characteristic has a significant role in learning models more accurately and accurately [86]. The images in the dataset have a natural background that provides robustness in learning the model and enhances waste detection and localization accuracy. We partitioned the dataset into two sets: the training set comprises 75% images of the total for each class, while the testing set contains the remaining 25% in the same way.

4.3.2. CNN

A CNN architecture comprises three building blocks: convolution layer, pooling layer, and fully connected layer. But the convolution layer is considered the core of this architecture, as it is responsible for feature extraction. It performs linear and nonlinear operations, i.e., convolution operation and activation function. A typical CNN architecture is built by stacking multiple convolution layers and a pooling layer creating a hierarchy of features followed by one or more fully connected layers. Each convolution layer can be considered a feature extractor from its previous layer into the network to which it is connected. It takes a block of patches as input and generates out planes called feature maps. Each feature map f j connected with its weight. The computation of a feature map at any convolution layer is a three-step process which is illustrated as:
First, consider an i t h input channel x i is associated with w j , i one of the weights of that channel and a bias b j , then the feature map f j is calculated by performing the convolution operation over the channel as:
f j = i w j , i x i + b j
where denotes a convolution operation. The major reason for CNNs’ popularity is their learning process. They have the capability to learn the weights and biases for the individual features. This gives a boost to data-driven customized task learning. The gradient descent algorithm with backpropagation is applied to optimize these parameters.
Second, features are the nonlinear transformation of the input. Therefore, an element operation is performed over the outcome of the kernel convolution to obtain the features. Various functions, called activation functions, are available to perform this operation. We used three commonly used activation functions (refer to Figure 9) at different convolution layers of the proposed mp-CNN model. These activation functions and their equations are represented in Figure 9.
Third, an operation is performed over the feature maps to reduce their sizes. This is called the pooling operation, and different types of poolings are used in scenarios. Commonly used poolings are max-pooling and average pooling, and we used the global average pooling.

4.3.3. Proposed Multipath CNN Model Architecture

Based on our description of CNNs, it is understandable that a CNN is a simple architecture built through alternative stacking of convolution layer and pooling layer, finally followed by a fully connected layer. In computer vision, this type of architecture is most widely used to perform various detection tasks. However, one can create one’s own architecture appropriate for one’s problem.
The key challenges in waste dump detection using the CNN model are the irregularity in waste shape, size, and contextual characteristics. Due to these challenges, the existing simple CNN-based waste detection and localization model can face the accuracy problem. The main reason for the above issues is that the receptive field size affects in modelling of distant dependencies. Generally, fixed size receptive field (e.g., 3 × 3, 5 × 5 or 7 × 7) is used throughout the architecture to solve detection problems. This fixed receptive field size influences the contextual and visual information of neighbourhood pixels during feature extraction.
A dumping area has a large variation in its shape and size. So, to avoid the above problem in waste detection, we built an mp-CNN architecture, which consists of multiple-paths of convolution layers. These paths consider receptive fields of smaller, medium, and larger sizes, shown in Table 7. Furthermore, the design of our mp-CNN architecture comprises the concatenation of different features to improve the model prediction accuracy. The concatenation layer integrates the important features from all three paths (Fa, Fb, and Fc) that significantly improve the learning of the model for long and short-term dependencies, i.e., features in the same regions are learnt in a better way. The complete proposed mp-CNN architecture is represented in Figure 10, and parameters associated with different layers are illustrated in Table 7. This model utilizes multipath feature extraction to detect illegal dump regions efficiently in an image. This mechanism allows CNN to combine more features related to the scattered local and fine global structures. A dumping area has a large variation in its size. So, we are putting together the features from paths Fa, Fb, and Fc, which have different receptive fields and can efficiently encode the dumping region of the right size. To classify the dumping region, two convolution layers are added on top of the already made features. We do not have the segmentation map for the dumping region and only binary labels for training images. We use a global average pool operation to make a binary prediction for an image. We do not have to do the global average pool operation at the time of inference, so we can make the segmentation maps for the dumping regions. In this way, utilizing only binary class labels for the dumping region in an image, we still manage to generate the segmentation map for the same through a weekly supervised approach.

4.4. Evaluation Criteria

The implemented multipath CNN model performs two tasks. First, it performs binary classification means to classify the dataset into waste and non-wasted categories. Second, it localizes the waste regions and generates the mask in the images classified as waste. Now, model evaluation parameters are computed to measure the classification performance, while localization precision is assessed through a survey. The computation of model evaluation parameters and survey procedure are illustrated in subsequent subsections.

4.4.1. Evaluation Parameters

The model-predicted category of all test images is compared with ground truth, i.e., class: waste and non-waste. A confusion matrix is used to represent the correctly and incorrectly classified test samples. This confusion is shown in Table 8.
TP and TN denote the correctly classified instances, and FP and FN represent the incorrectly classified instances.
We calculated the following model performance evaluation parameters from the confusion matrix. These parameters are tabulated in Table 9.

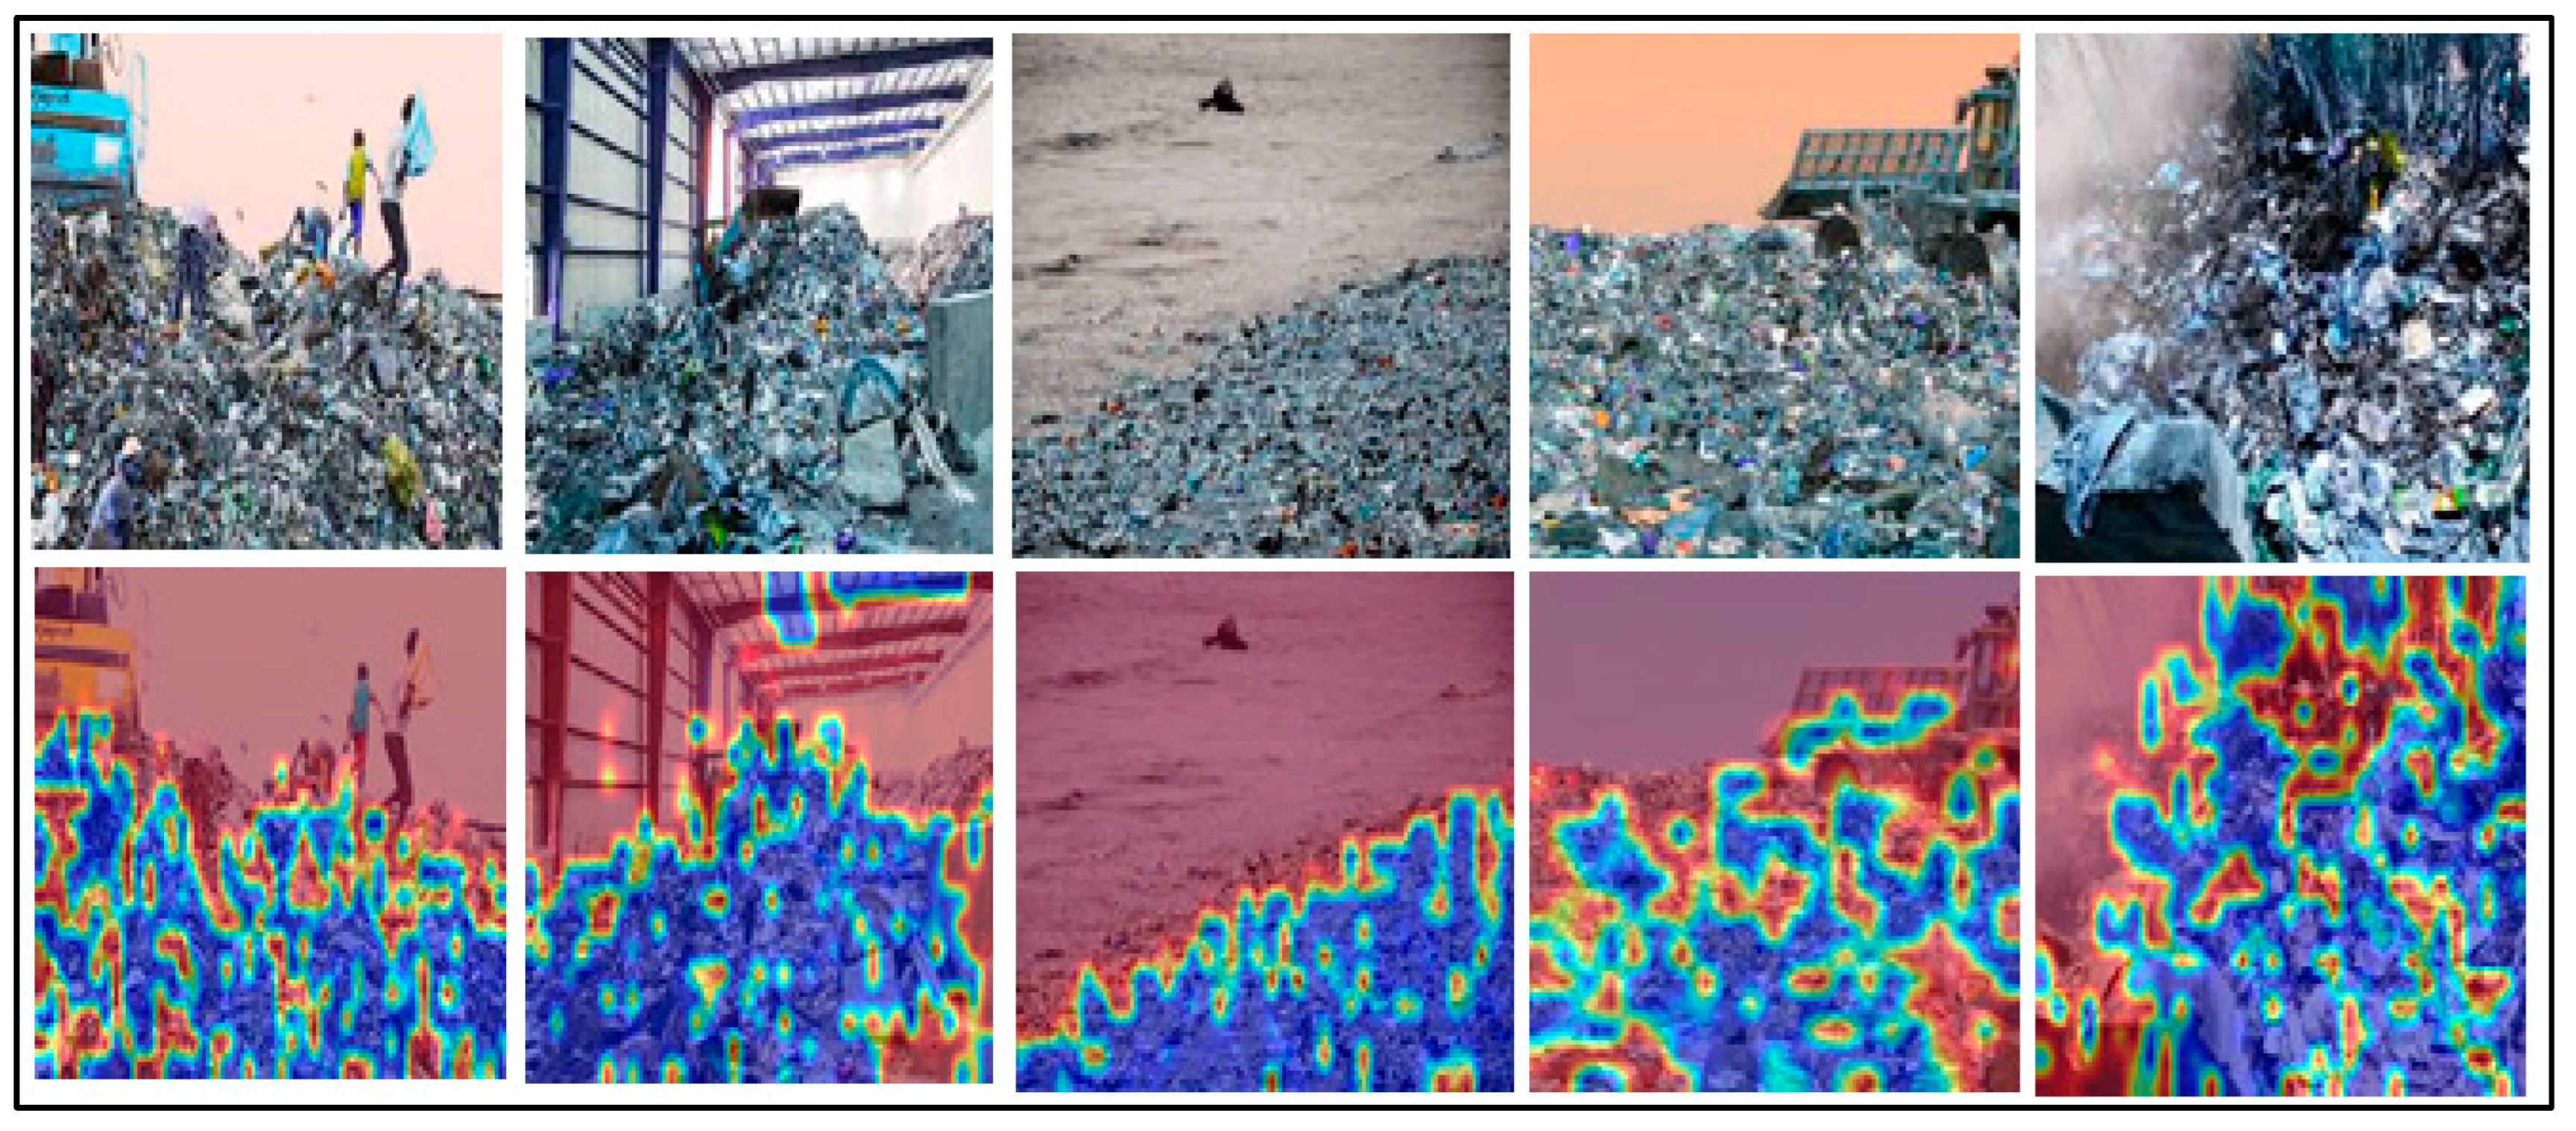
4.4.2. Survey for Localization Evaluation

Our analysis of benchmark datasets shows that no dataset comprises a class to train the mp-CNN for waste localization in the images. Furthermore, no exclusive dataset is publicly available to perform waste recognition for illegal dump detection. Consequently, the proposed mp-CNN cannot be trained and tested over benchmark datasets. Therefore, results can be represented and assessed quantitatively with ground truth. To overcome this issue, we designed a quantitative survey procedure to present the results. In this survey, manual comparison of masked images with corresponding actual images is performed to determine how much overlapping of mask over waste occurs. The overlapping was graded on the Likert scale of 5. Now, 1000 images were randomly picked from the test sample and divided into 20 sets of equal size. Each set was analysed by an individual and graded for the question: How much area of mask overlaps with the waste region in the actual image? After performing a comparison, everyone provided one of discrete grades 1, 2, 3, 4, and 5 to each instance, where 1: no overlap; 2: poor overlap; 3: moderate overlap; 4: high overlap, and 5: complete overlap. Finally, the average score was calculated to show the localization accuracy of the mp-CNN, and the bar graph was created to illustrate the number of instances graded to each grade graphically.

4.5. Dump Detection Results and Discussion

The mpCNN model was trained using 9000 images, while testing was done over 3000 images. Table 10 shows the correctly and incorrectly classified instances for both classes. The values of performance evaluation parameters are shown in Table 11. The model’s performance is exceptional, with a classification accuracy of 98.33%.
Figure 11 shows the receiver operating characteristics curve (ROC) (left) and the precision-recall curve (right) for the classification of waste and non-waste, respectively. This figure comprises the proposed mp-CNN model performance curves and a line for the random classifier. Random classifier performs the predictions without any learning and predicts the class randomly. The blue line depicts the results for the random classifier. The ROC, precision-recall curve, waste localization probabilities mask, and other evaluation parameters (refer to Table 11) validate the proposed mp-CNN’s remarkable performance for the waste classification and localisation. The high values of AUROC and precision indicate that the mp-CNN is good at waste detection and classification.
The survey outcomes are shown in Figure 12, which depicts the number of instances for each grade. The analysis of survey results shows that the proposed model failed to localize waste in only 2.3% of instances and poorly localized in 5.1%. It localizes the waste significantly well or more in the remaining 92.6% of instances, which shows the model successfully does its task. This localization accuracy is enough to implement the model in real-world situations at a massive level.
Figure 13 shows the comparison of the probability mask generated by mp-CNN instances randomly selected from the post-test data with their corresponding actual instances. From Figure 13, it is deduced that probability masks significantly overlap with the waste areas.

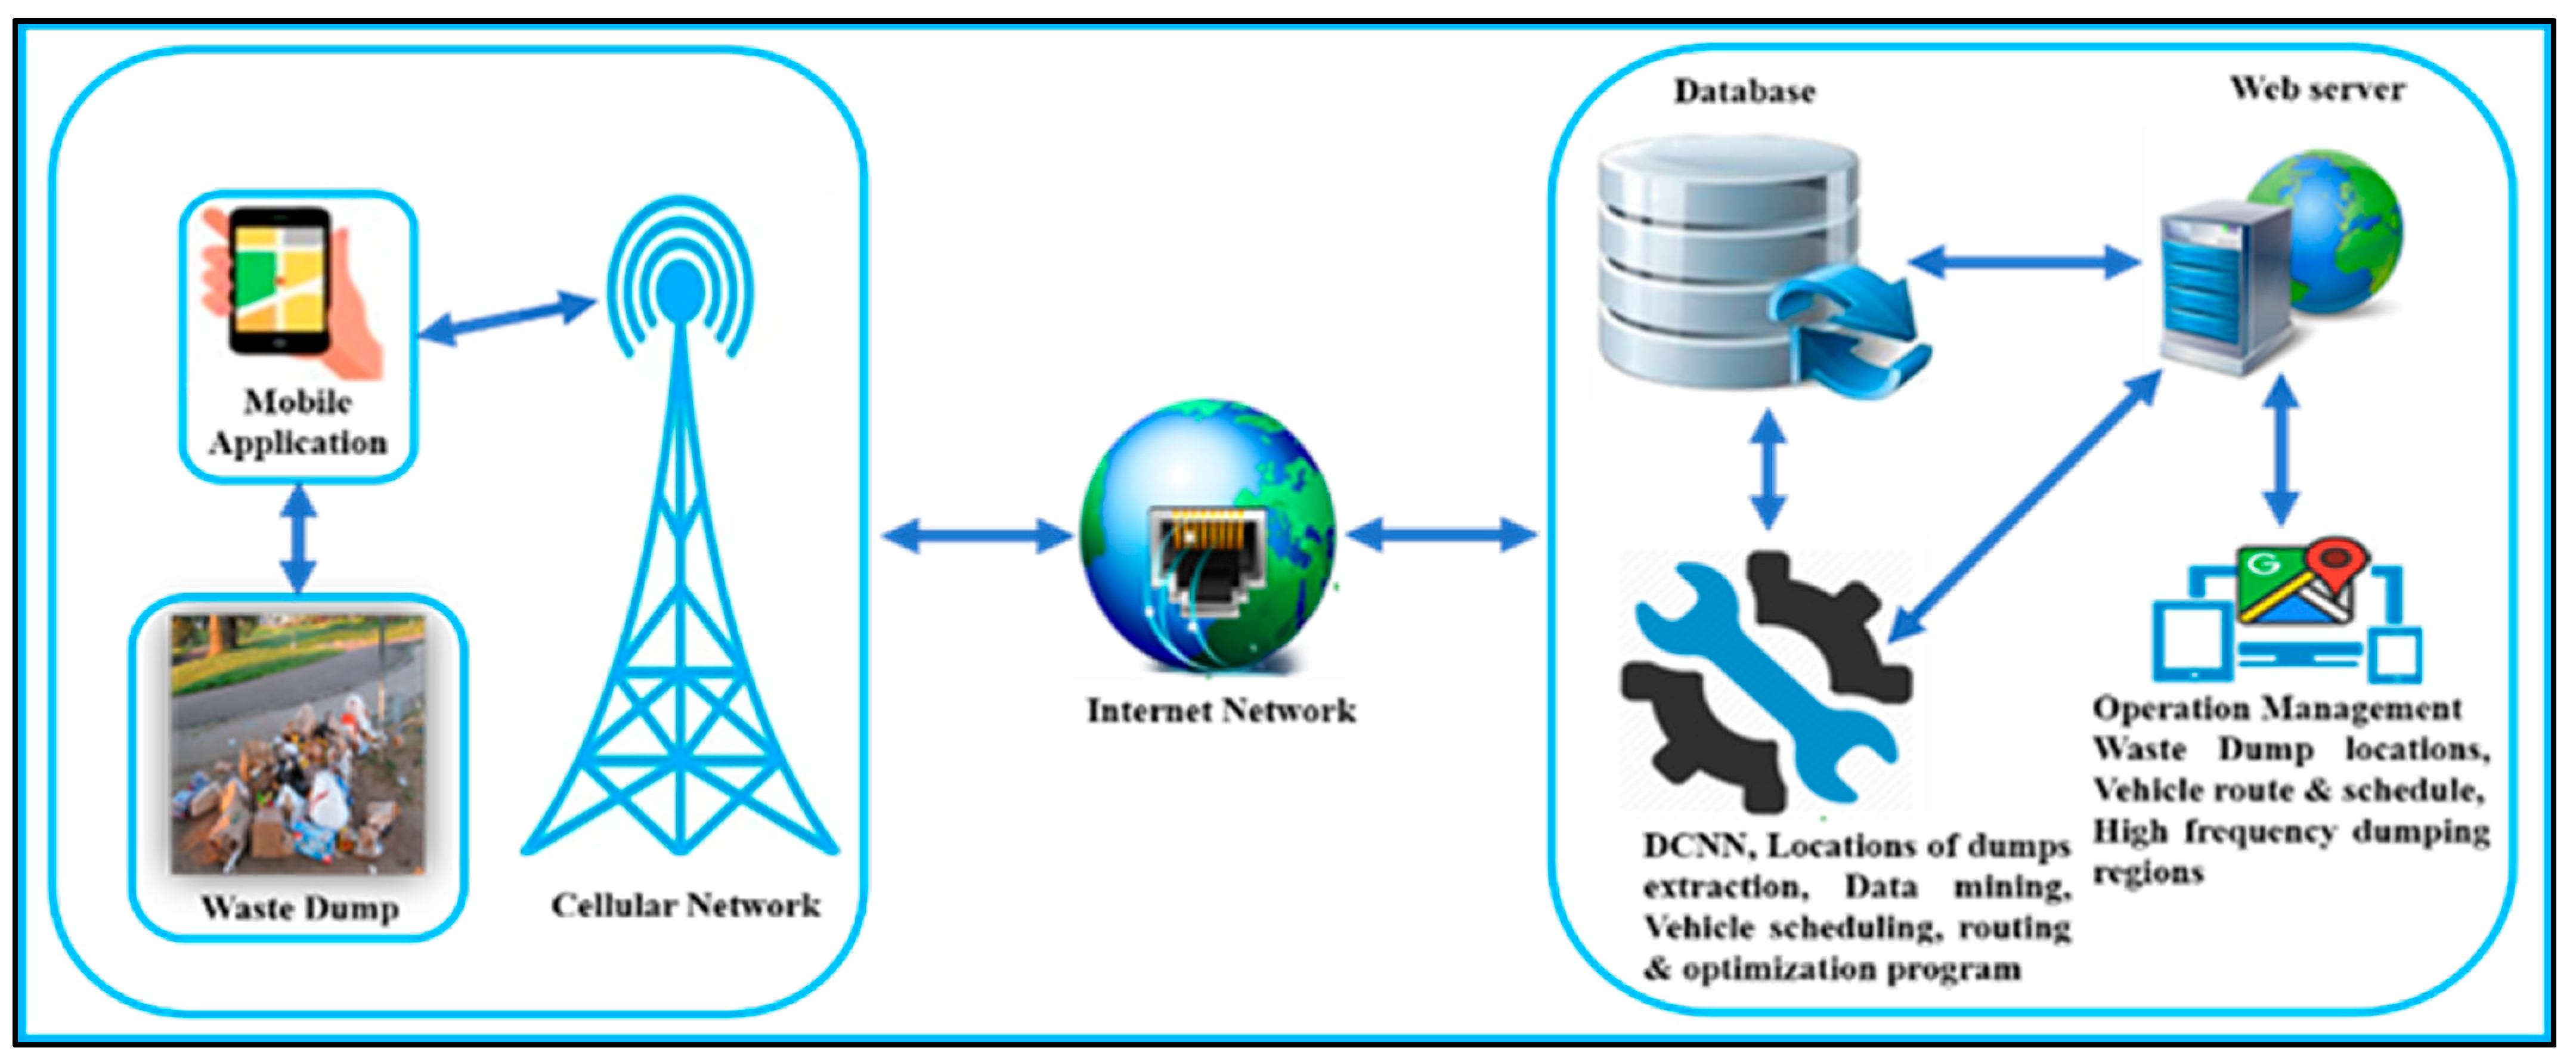
4.6. Future Practical Applications of mp-CNN Model

The implemented mp-CNN model can be effectively utilized with other platforms to lessen the practical implementation cost at a massive level. To monitor and assess street cleanliness, we have designed two conceptual frameworks to integrate the mp-CNN model with mobile devices and surveillance systems.

4.6.1. Combining with Mobile Devices: A People-Centric System

Nowadays, mobile devices are most widely used for communication and transferring data due to their rapid availability in the global market at an affordable cost. They have high computing power with a variety of useful new capabilities. The widespread fast internet connectivity and simplified user interface make these devices usable to collect and transfer data with additional information, such as the device’s real-time location. Due to this, everyone owns their mobile device and carry it all the time. The people-centric system involves the residents reporting the waste dump on the streets. The suggested conceptual framework comprises a mobile application at the front end, a waste database and an mp-CNN module at the backend of the system. The mobile application will be utilized to capture and transfer dump images with real-time location to the backend system. These images will be given as input to the mp-CNN module to detect and localize the dump. If a dump is identified in any image, then the location and address information related to this image will be extracted, and this information will be utilized to collect these identified dumps. The conceptual framework of this system is shown in Figure 14.

4.6.2. Combining with Existing City Surveillance System: An IoT-Centric System

Each smart city has a huge network of surveillance systems comprising many cameras to provide safety for citizens and infrastructure. This system is the same as the previous one except here, surveillance cameras in place of mobile will be used to capture images of different city spots while devices will be used to capture images here. The conceptual framework of this system is shown in Figure 15.
Now, the information on waste dump locations can be used further utilized for route optimization. The waste collection vehicle visits the locations to collect the dumps. This collection process can be optimized using route optimization algorithms. These locations can be used as input nodes for these algorithms. Route optimization plays a vital role in waste collection as collection efficiency, time, and energy are required to depend on the path selected. Furthermore, this data can be used to identify dumping patterns in different areas of the city. These patterns can be analysed to uncover the most frequent dumping areas, and municipal authorities can take actions like an awareness program, penalties, and more bin placements to control the dumping. These suggested frameworks can play a vital role in sustainable waste development, especially in developing countries like India, and they will indirectly contribute to maintaining city cleanliness and a clean environment.

5. Conclusions

So far, we have discussed that the paper is structured into four interrelated sections. The first section illustrated some basic definitions. The second section performed a descriptive statistical analysis to present the picture of waste generation patterns and distribution around India. We have concluded that the waste generation rate in India has increased rapidly with the proliferation of the total population and fast urbanization. The comparison of per capita per day waste generation based on population size indicates that waste generation increases with urbanization. The same comparison for the years 2002, 2012, and 2018 implies that significant growth in per capita per day waste generation has been registered in one and a half decades. Furthermore, per capita per day waste generation in India is approximately the same as the global average of lower-middle income countries. From this, it has been uncovered that India has grown from a lower-income to lower-middle-income country.
In the third section, we performed a survey in a city and an analysis of related research studies and scientific reports to assess the SWM services. Based on this survey analysis, we identified numerous issues in the existing SWM service framework. Some major issues are no real-time monitoring, poor collection efficiency, no proper locations for bins, no illegal dump monitoring, unavailability of online platforms and web portals, etc. Furthermore, one drawback related to human behaviour is identified: people have a negative attitude towards waste or a lack of awareness about the consequences of open dumping on streets and roadsides. Among all issues, we have determined that illegal dumping is one of these major concerns and needs a technological solution. We have suggested various devices and models develop technological solutions for these issues based on the research studies.
In Section 4, we designed an mp-CNN architecture to detect and localize the waste dumps in an image. We constructed our dataset due to the unavailability of a benchmark dataset for waste and non-waste classification. We applied the weakly supervised learning approach to training the model. In this approach, the mp-CNN was trained according to the image class; in our case, it is two (waste and non-waste). In the testing phase, the model showed the performance evaluation matrices 97.82% of precision, 98.86% of recall, 98.34% of F1 score, 98.33% of accuracy, and 98.63% of AUROC for this binary classification. The model evaluation parameters, ROC, precision-recall curve, and waste localization probabilities mask validate the remarkable performance of the proposed mp-CNN for the classification and localization of waste. The high values of AUROC and precision indicate that the mp-CNN is good for waste detection and classification. The mp-CNN obtained an overall classification accuracy of 98.33%, which is significantly good for the task solved. We conducted a survey to demonstrate the localization accuracy as we were restricted to present this quantitatively. We obtained a score of 3.884 on a scale of 5 for the question: how much over model generated mask over the waste region? Based on the analysis of model performance evaluation parameters, precision-recall curve, receiver characteristic operator curve, and comparison of mask generated by the model over waste with corresponding actual images show that mp-CNN performs remarkably well in detection, classification, and localization of waste regions. Finally, we have suggested two future practical applications of the implemented mp-CNN architecture in view of urban sustainable and smart city development for developing countries.

Author Contributions

Conceptualization, M.A. and S.S.; methodology, M.A. and S.S.; software, M.A. and S.S.; validation, M.A. and S.S.; formal analysis, M.A. and S.S.; investigation, M.A. and S.S.; resources, M.A. and S.S.; data curation, M.A. and S.S.; writing—original draft preparation, M.A. and S.S.; writing—review and editing, M.A. and S.S.; visualization, M.A. and S.S.; funding acquisition, S.S. All authors have read and agreed to the published version of the manuscript.

Funding

This research was supported by the Princess Nourah bint Abdulrahman University Researchers Supporting Project number (PNURSP2022R259), Princess Nourah bint Abdulrahman University, Riyadh, Saudi Arabia.

Institutional Review Board Statement

Not applicable.

Informed Consent Statement

Informed consent was obtained from all subjects involved in the study.

Data Availability Statement

Not applicable.

Acknowledgments

We would like to express our appreciation to Tofik Ali, a research scholar of computer vision at Indian Institute of Technology Roorkee, India, for his valuable and constructive suggestions during the planning and development of this research work. His willingness to give his time so generously has been very much appreciated.

Conflicts of Interest

The authors declare no conflict of interest.

References

  1. Rajesh, P. Solid Waste Management-Sustainability towards a Better Future, Role of CSR—A Review. Soc. Responsib. J. 2019, 15, 762–771. [Google Scholar] [CrossRef]
  2. Alonso, M.G.V.P.; Themelis, N. Generation and Disposition of MSW in Mexico and Potential for Improving Waste Management in Toluca Municipality. In Department of Earth and Environmental Engineering Columbia University; Columbia University: New York, NY, USA, 2011. [Google Scholar]
  3. Kaza, S.; Yao, L.C.; Bhada-Tata, P.; Van Woerden, F. What a Waste 2.0: A Global Snapshot of Solid Waste Management to 2050; World Bank Publications; The World Bank Group: Washington, DC, USA, 2018; Volume 1, ISBN 978-1-4648-1329-0. [Google Scholar]
  4. Ayilara, M.S.; Olanrewaju, O.S.; Babalola, O.O.; Odeyemi, O. Waste Management through Composting: Challenges and Potentials. Sustainability 2020, 12, 4456. [Google Scholar] [CrossRef]
  5. Census of India. Office of the Registrar General & Census Commissioner India. Provisional Population Totals, Paper 1 of 2011, Census of India 2011; Census of India: New Delhi, India, 2011.
  6. Department of Economic Affairs India. Economic Survey 2021–22; Department of Economic Affairs India: New Delhi, India, 2022.
  7. Ministry of Housing and Urban Affairs India. ANNUAL REPORT 2020–21; Ministry of Housing and Urban Affairs India: New Delhi, India, 2021.
  8. Minghua, Z.; Xiumin, F.; Rovetta, A.; Qichang, H.; Vicentini, F.; Bingkai, L.; Giusti, A.; Yi, L. Municipal Solid Waste Management in Pudong New Area, China. Waste Manag. 2009, 29, 1227–1233. [Google Scholar] [CrossRef] [PubMed]
  9. Joshi, R.; Ahmed, S. Status and Challenges of Municipal Solid Waste Management in India: A Review. Cogent Environ. Sci. 2016, 2, 1139434. [Google Scholar] [CrossRef]
  10. Rana, R.; Ganguly, R.; Gupta, A.K. Physico-Chemical Characterization of Municipal Solid Waste from Tricity Region of Northern India: A Case Study. J. Mater. Cycles Waste Manag. 2018, 20, 678–689. [Google Scholar] [CrossRef]
  11. Sharma, A.; Ganguly, R.; Gupta, A.K. Characterization and Energy Generation Potential of Municipal Solid Waste from Nonengineered Landfill Sites in Himachal Pradesh, India. J. Hazard. Toxic Radioact. Waste 2019, 23, 1–15. [Google Scholar] [CrossRef]
  12. Mani, S.; Singh, S. Sustainable Municipal Solid Waste Management in India: A Policy Agenda. Procedia Environ. Sci. 2016, 35, 150–157. [Google Scholar] [CrossRef]
  13. Central Pollution Control Board India. Annual Report on Solid Waste Management (2020–2021); Central Pollution Control Board India: New Delhi, India, 2021.
  14. Dhokhikah, Y.; Trihadiningrum, Y. Solid Waste Management in Asian Developing Countries: Challenges and Opportunities. J. Appl. Environ. Biol. Sci. 2012, 2, 329–335. [Google Scholar]
  15. Oteng-Ababio, M.; Melara Arguello, J.E.; Gabbay, O. Solid Waste Management in African Cities: Sorting the Facts from the Fads in Accra, Ghana. Habitat Int. 2013, 39, 96–104. [Google Scholar] [CrossRef]
  16. Kothari, R.; Kumar, V.; Panwar, N.; Tyagi, V. Municipal Solid-Waste Management Strategies for Renewable Energy Options. In Sustainable Bioenergy Production; CRC Press: Boca Raton, FL, USA, 2014. [Google Scholar]
  17. Menikpura, S.N.M.; Gheewala, S.H.; Bonnet, S. Sustainability Assessment of Municipal Solid Waste Management in Sri Lanka: Problems and Prospects. J. Mater. Cycles Waste Manag. 2012, 14, 181–192. [Google Scholar] [CrossRef]
  18. Worldometers Population of India. Available online: https://www.worldometers.info/world-population/india-population/ (accessed on 27 September 2022).
  19. Kumar, S.; Smith, S.R.; Fowler, G.; Velis, C.; Kumar, S.J.; Arya, S.; Rena; Kumar, R.; Cheeseman, C. Challenges and Opportunities Associated with Waste Management in India. R. Soc. Open Sci. 2017, 4, 1–11. [Google Scholar] [CrossRef]
  20. Chandra, S.; Nandi, D.; Bhattacharya, S.; Bose, S.; Batabyal, A.; Mitra, P.; Dutta, A.; Bhattacharjee, D.; Bose, S.; Goswami, J.; et al. Characterization of Municipal Solid Waste for Management and Disposal Purposes Characterization of the Solid Waste. J. Waste Manag. Dispos. 2019, 2, 1–5. [Google Scholar]
  21. Singh, B. Urbanization and Economic Development in India. Int. J. Sci. Res. Sci. Technol. 2018, 4, 1550–1555. [Google Scholar]
  22. Census Office of Registrar. General & Census Commissioner, India, Chapter 3, Size, Growth Rate and Distribution of Population; Census of India: New Delhi, India, 2011.
  23. Ministry of Housing and Urban Affairs India. Handbook of Urban Statistics 2019; Ministry of Housing and Urban Affairs India: New Delhi, India, 2019.
  24. UNFPA. State of World Population 2007; United Nations Population Fund: New York, NY, USA, 2007; Volume 2007. [Google Scholar]
  25. Annepu, R.K. Sustainable Solid Waste Management in India, Waste-to-Energy Research and Technology Council (WTERT); Columbia University: New York, NY, USA, 2012. [Google Scholar]
  26. Revi, A.; Idicheria, C.; Jain, G.; Anand, G.; Sudhira, H.S.; Seddon, J.; Srinivasan, S. Urban India 2011: Evidence. 2011. Available online: https://www.citiesalliance.org/resources/publications/cities-alliance-knowledge/urban-india-2011-evidence (accessed on 22 October 2022).
  27. PPCB. Status Report on Municipal Solid Waste in Punjab, Punjab Pollution Control Board, Patiala; Punjab Pollution Control Board: Patiala, India, 2010.
  28. Central Pollution Control Board India. Solid Waste Generation in 46 Metrocities; Central Pollution Control Board India: New Delhi, India, 2018.
  29. Central Pollution Control Board India. Status of Municipal Solid Waste Generation, Collection, Treatment and Disposal in Class I Cities; Central Pollution Control Board India: New Delhi, India, 2000.
  30. Central Pollution Control Board. Implementation of Solid Waste Management Rules, 2016 (As per Provision 24(4) of SWM Rules, 2016; Central Pollution Control Board: New Delhi, India, 2018.
  31. Central Pollution Control Board India. Annual Report on Municipal Solid Wastes (Management & Handling) Rules, 2000; Central Pollution Control Board India: New Delhi, India, 2001.
  32. Anthopoulos, L.G. The Rise of the Smart City. In Public Administration and Information Technology; Springer: Berlin/Heidelberg, Germany, 2017; Volume 22, pp. 5–45. [Google Scholar]
  33. Abdullah, N.; Alwesabi, O.A.; Abdullah, R. IoT-Based Smart Waste Management System in a Smart City; Springer International Publishing: Berlin/Heidelberg, Germany, 2019; Volume 843, ISBN 9783319990064. [Google Scholar]
  34. Medvedev, A.; Fedchenkov, P.; Zaslavsky, A.; Anagnostopoulos, T.; Khoruzhnikov, S. Waste Management as an IoT-Enabled Service in Smart Cities. In Internet of Things, Smart Spaces, and Next Generation Networks and Systems; Springer: Cham, Switzerland, 2015; Volume LNCS 9247, pp. 104–115. ISBN 978-3-319-23125-9. [Google Scholar]
  35. Alt, R.; Demirkan, H.; Ehmke, J.F.; Moen, A.; Winter, A. Smart Services: The Move to Customer Orientation. Electron. Mark. 2019, 29, 1–6. [Google Scholar] [CrossRef] [Green Version]
  36. Anjum, M.; Shahab, S.; Umar, M.S. Smart Waste Management Paradigm in Perspective of IoT and Forecasting Models. Int. J. Environ. Waste Manag. 2022, 29, 34. [Google Scholar] [CrossRef]
  37. Chand Malav, L.; Yadav, K.K.; Gupta, N.; Kumar, S.; Sharma, G.K.; Krishnan, S.; Rezania, S.; Kamyab, H.; Pham, Q.B.; Yadav, S.; et al. A Review on Municipal Solid Waste as a Renewable Source for Waste-to-Energy Project in India: Current Practices, Challenges, and Future Opportunities. J. Clean. Prod. 2020, 277. [Google Scholar] [CrossRef]
  38. Lestari, P.; Trihadiningrum, Y. The Impact of Improper Solid Waste Management to Plastic Pollution in Indonesian Coast and Marine Environment. Mar. Pollut. Bull. 2019, 149, 110505. [Google Scholar] [CrossRef]
  39. Zohoori, M.; Ghani, A. Municipal Solid Waste Management Challenges and Problems for Cities in Low-Income and Developing Countries. Int. J. Sci. Eng. Appl. 2017, 6, 039–048. [Google Scholar] [CrossRef]
  40. Sharma, A.; Ganguly, R.; Gupta, A.K. Matrix Method for Evaluation of Existing Solid Waste Management Processes in Jalandhar City, Punjab, India. In Energy, Environment, and Sustainability; Springer Nature: Berlin/Heidelberg, Germany, 2019; pp. 253–268. [Google Scholar]
  41. Sharholy, M.; Ahmad, K.; Mahmood, G.; Trivedi, R.C. Municipal Solid Waste Management in Indian Cities—A Review. Waste Manag. 2008, 28, 459–467. [Google Scholar] [CrossRef]
  42. Sharma, A.; Ganguly, R.; Gupta, A.K. Matrix Method for Evaluation of Existing Solid Waste Management System in Himachal Pradesh, India. J. Mater. Cycles Waste Manag. 2018, 20, 1813–1831. [Google Scholar] [CrossRef]
  43. Kumar, S.; Bhattacharyya, J.K.; Vaidya, A.N.; Chakrabarti, T.; Devotta, S.; Akolkar, A.B. Assessment of the Status of Municipal Solid Waste Management in Metro Cities, State Capitals, Class I Cities, and Class II Towns in India: An Insight. Waste Manag. 2009, 29, 883–895. [Google Scholar] [CrossRef] [PubMed]
  44. Sharma, A.; Ganguly, R.; Gupta, A.K. Comparative Analysis of Solid Waste Management Processes in Himachal Pradesh and Punjab. In Lecture Notes in Civil Engineering; Springer Science and Business Media Deutschland GmbH: Berlin/Heidelberg, Germany, 2019; Volume 21 LNCE, pp. 343–352. [Google Scholar]
  45. Sharma, A.; Gupta, A.K.; Ganguly, R. Impact of Open Dumping of Municipal Solid Waste on Soil Properties in Mountainous Region. J. Rock Mech. Geotech. Eng. 2018, 10, 725–739. [Google Scholar] [CrossRef]
  46. Central Pollution Control Board India. Annual Report on Solid Waste Management (2019–2020); Central Pollution Control Board India: New Delhi, India, 2020.
  47. Anjum, M.; Sarosh Umar, M.; Shahab, S. Analysis of IoT and Communication Technologies to Develop Waste Management Service Framework for Smart City. In Lecture Notes in Networks and Systems; Springer Science and Business Media Deutschland GmbH: Berlin/Heidelberg, Germany, 2022; Volume 351, pp. 691–707. [Google Scholar]
  48. Anjum, M.; Sarosh Umar, M.; Shahab, S. IoT-Based Novel Framework for Solid Waste Management in Smart Cities. In Inventive Computation and Information Technologies; Lecture Notes in Networks and Systems; Springer: Singapore, 2022; pp. 687–700. [Google Scholar]
  49. Shahab, S.; Anjum, M.; Umar, M.S. Deep Learning Applications in Solid Waste Management: A Deep Literature Review. Int. J. Adv. Comput. Sci. Appl. 2022, 13, 381–395. [Google Scholar] [CrossRef]
  50. Lu, W. Big Data Analytics to Identify Illegal Construction Waste Dumping: A Hong Kong Study. Resour. Conserv. Recycl. 2019, 141, 264–272. [Google Scholar] [CrossRef]
  51. Navarro, J.; Grémillet, D.; Afán, I.; Ramírez, F.; Bouten, W.; Forero, M.G. Feathered Detectives: Real-Time GPS Tracking of Scavenging Gulls Pinpoints Illegal Waste Dumping. PLoS ONE 2016, 11, e0159974. [Google Scholar] [CrossRef] [Green Version]
  52. Yang, W.; Fan, B.; Desouza, K.C. Spatial-Temporal Effect of Household Solid Waste on Illegal Dumping. J. Clean. Prod. 2019, 227, 313–324. [Google Scholar] [CrossRef]
  53. Glanville, K.; Chang, H.C. Remote Sensing Analysis Techniques and Sensor Requirements to Support the Mapping of Illegal Domestic Waste Disposal Sites in Queensland, Australia. Remote Sens. 2015, 7, 13053–13069. [Google Scholar] [CrossRef] [Green Version]
  54. Peters, B.G. What Is so Wicked about Wicked Problems? A Conceptual Analysis and a Research Program. Policy Soc. 2017, 36, 385–396. [Google Scholar] [CrossRef] [Green Version]
  55. Nagpure, A.S. Assessment of Quantity and Composition of Illegal Dumped Municipal Solid Waste (MSW) in Delhi. Resour. Conserv. Recycl. 2019, 141, 54–60. [Google Scholar] [CrossRef]
  56. Šedová, B. On Causes of Illegal Waste Dumping in Slovakia. J. Environ. Plan. Manag. 2016, 59, 1277–1303. [Google Scholar] [CrossRef]
  57. Sotamenou, J.; De Jaeger, S.; Rousseau, S. Drivers of Legal and Illegal Solid Waste Disposal in the Global South—The Case of Households in Yaoundé (Cameroon). J. Environ. Manag. 2019, 240, 321–330. [Google Scholar] [CrossRef] [PubMed]
  58. Abel, D.J. Perceptions on Illegal Dumping in the Ethekwini Municipality; University of the Free State: Bloemfontein, South Africa, 2014. [Google Scholar]
  59. Anjum, M.; Shahab, S.; Umar, M.S. Application of Event Detection to Improve Waste Management Services in Developing Countries. Sustainability 2022, 14, 13189. [Google Scholar] [CrossRef]
  60. Sallang, N.C.A.; Islam, M.T.; Islam, M.S.; Arshad, H. A CNN-Based Smart Waste Management System Using TensorFlow Lite and LoRa-GPS Shield in Internet of Things Environment. IEEE Access 2021, 9, 153560–153574. [Google Scholar] [CrossRef]
  61. Torres, R.N.; Fraternali, P. Learning to Identify Illegal Landfills through Scene Classification in Aerial Images. Remote Sens. 2021, 13, 4520. [Google Scholar] [CrossRef]
  62. Youme, O.; Bayet, T.; Dembele, J.M.; Cambier, C. Deep Learning and Remote Sensing: Detection of Dumping Waste Using UAV. In Procedia Computer Science; Elsevier: Amsterdam, The Netherlands, 2021; Volume 185, pp. 361–369. [Google Scholar]
  63. Kazaryan, M.; Simonyan, A.; Simavoryan, S.; Ulitina, E.; Aramyan, R. Waste Disposal Facilities Monitoring Based on High-Resolution Information Features of Space Images. In E3S Web of Conferences: Key Trends in Transportation Innovation (KTTI-2019); EDP Sciences: Julius, France, 2020; Volume 157. [Google Scholar]
  64. De Carolis, B.; Ladogana, F.; MacChiarulo, N. YOLO TrashNet: Garbage Detection in Video Streams. In IEEE Conference on Evolving and Adaptive Intelligent Systems; Institute of Electrical and Electronics Engineers Inc.: Piscatwe, NJ, USA, 2020; Volume 2020. [Google Scholar]
  65. Abdukhamet, S. Landfill Detection in Satellite Images Using Deep Learning; Shanghai Jiao Tong University Shanghai: Shanghai, China, 2019. [Google Scholar]
  66. Quesada-Ruiz, L.C.; Rodriguez-Galiano, V.; Jordá-Borrell, R. Characterization and Mapping of Illegal Landfill Potential Occurrence in the Canary Islands. Waste Manag. 2019, 85, 506–518. [Google Scholar] [CrossRef] [PubMed]
  67. Gill, J.; Faisal, K.; Shaker, A.; Yan, W.Y. Detection of Waste Dumping Locations in Landfill Using Multi-Temporal Landsat Thermal Images. Waste Manag. Res. 2019, 37, 386–393. [Google Scholar] [CrossRef] [Green Version]
  68. Jakiel, M.; Bernatek-Jakiel, A.; Gajda, A.; Filiks, M.; Pufelska, M. Spatial and Temporal Distribution of Illegal Dumping Sites in the Nature Protected Area: The Ojców National Park, Poland. J. Environ. Plan. Manag. 2019, 62, 286–305. [Google Scholar] [CrossRef]
  69. Alfarrarjeh, A.; Kim, S.H.; Agrawal, S.; Ashok, M.; Kim, S.Y.; Shahabi, C. Image Classification to Determine the Level of Street Cleanliness: A Case Study. In Proceedings of the 2018 IEEE Fourth International Conference on Multimedia Big Data (BigMM), Xi’an, China, 13–16 September 2018; pp. 1–5. [Google Scholar] [CrossRef]
  70. Anjum, M.; Umar, M.S. Garbage Localization Based on Weakly Supervised Learning in Deep Convolutional Neural Network. In Proceedings of the IEEE 2018 International Conference on Advances in Computing, Communication Control and Networking, Greater Noida, India, 12–13 October 2018; Institute of Electrical and Electronics Engineers Inc.: Piscatwe, NJ, USA, 2018; pp. 1108–1113. [Google Scholar]
  71. Angelino, C.V.; Focareta, M.; Parrilli, S.; Cicala, L.; Piacquadio, G.; Meoli, G.; De Mizio, M. A Case Study on the Detection of Illegal Dumps with GIS and Remote Sensing Images. In Earth Resources and Environmental Remote Sensing/GIS Applications IX; SPIE: Bellingham, WA, USA, 2018; Volume 10790, p. 21. [Google Scholar]
  72. Rad, M.S.; von Kaenel, A.; Droux, A.; Tieche, F.; Ouerhani, N.; Ekenel, H.K.; Thiran, J.P. A Computer Vision System to Localize and Classify Wastes on the Streets. In Lecture Notes in Computer Science (Including Subseries Lecture Notes in Artificial Intelligence and Lecture Notes in Bioinformatics); Springer: Berlin/Heidelberg, Germany, 2017; Volume 10528 LNCS, pp. 195–204. [Google Scholar]
  73. Manzo, C.; Mei, A.; Zampetti, E.; Bassani, C.; Paciucci, L.; Manetti, P. Top-down Approach from Satellite to Terrestrial Rover Application for Environmental Monitoring of Landfills. Sci. Total Environ. 2017, 584–585, 1333–1348. [Google Scholar] [CrossRef] [PubMed]
  74. Selani, L. Mapping Illegal Dumping Using a High Resolution Remote Sensing Image Case Study: Soweto Township in South Africa; University of the Witwatersrand: Johannesburg, South Africa, 2017. [Google Scholar]
  75. Begur, H.; Dhawade, M.; Gaur, N.; Dureja, P.; Gao, J.; Mahmoud, M.; Huang, J.; Chen, S.; Ding, X. An Edge-Based Smart Mobile Service System for Illegal Dumping Detection and Monitoring in San Jose. In Proceedings of the 2017 IEEE SmartWorld, Ubiquitous Intelligence & Computing, Advanced & Trusted Computed, Scalable Computing & Communications, Cloud & Big Data Computing, Internet of People and Smart City Innovation (SmartWorld/SCALCOM/UIC/ATC/CBDCom/IOP/SCI), San Francisco, CA, USA, 4–8 August 2017; pp. 1–6. [Google Scholar]
  76. Dabholkar, A.; Muthiyan, B.; Srinivasan, S.; Ravi, S.; Jeon, H.; Gao, J. Smart Illegal Dumping Detection. In Proceedings of the 2017 IEEE Third International Conference on Big Data Computing Service and Applications (BigDataService), Redwood City, CA, USA, 6–9 April 2017; pp. 255–260. [Google Scholar] [CrossRef]
  77. Mittal, G.; Yagnik, K.B.; Garg, M.; Krishnan, N.C. SpotGarbage: Smartphone App to Detect Garbage Using Deep Learning. In 2016 ACM International Joint Conference on Pervasive and Ubiquitous Computing; Association for Computing Machinery: New York, NY, USA, 2016; pp. 940–945. [Google Scholar]
  78. Lucendo-Monedero, A.L.; Jordá-Borrell, R.; Ruiz-Rodríguez, F. Predictive Model for Areas with Illegal Landfills Using Logistic Regression. J. Environ. Plan. Manag. 2015, 58, 1309–1326. [Google Scholar] [CrossRef]
  79. Jordá-Borrell, R.; Ruiz-Rodríguez, F.; Lucendo-Monedero, Á.L. Factor Analysis and Geographic Information System for Determining Probability Areas of Presence of Illegal Landfills. Ecol. Indic. 2014, 37, 151–160. [Google Scholar] [CrossRef]
  80. Viezzoli, A.; Edsen, A.; Auken, E.; Silvestri, S. The Use of Satellite Remote Sensing and Helicopter Tem Data for the Identification and Characterization of Contaminated. In Near Surface 2009-15th EAGE European Meeting of Environmental and Engineering Geophysics; European Association of Geoscientists and Engineers, EAGE: Utrecht, The Netherlands, 2009. [Google Scholar]
  81. Yonezawa, C. Possibility of Monitoring of Waste Disposal Site Using Satellite Imagery. J. Intell. Fuzzy Syst. 2009, 28, 23–28. [Google Scholar]
  82. Biotto, G.; Silvestri, S.; Gobbo, L.; Furlan, E.; Valenti, S.; Rosselli, R. GIS, Multi-Criteria and Multi-Factor Spatial Analysis for the Probability Assessment of the Existence of Illegal Landfills. Int. J. Geogr. Inf. Sci. 2009, 23, 1233–1244. [Google Scholar] [CrossRef]
  83. Notarnicola, C.; Angiulli, M.; Giasi, C.I. Southern Italy Illegal Dumps Detection Based on Spectral Analysis of Remotely Sensed Data and Land-Cover Maps. In Remote Sensing for Environmental Monitoring, GIS Applications, and Geology III; Ehlers, M., Kaufmann, H.J., Michel, U., Eds.; SPIE: Bellingham WA, USA, 2004; Volume 5239, pp. 483–493. [Google Scholar]
  84. Salleh, J.B.; Tsudagawa, M. Classification of Industrial Disposal Illegal Dumping Site Images by Using Spatial and Spectral Information Together. In Proceedings of the Conference Record—IEEE Instrumentation and Measurement Technology Conference, Anchorage, AK, USA, 21–23 May 2002; pp. 559–563. [Google Scholar]
  85. Zhou, Z.-H. A Brief Introduction to Weakly Supervised Learning. Natl. Sci. Rev. 2018, 5, 44–53. [Google Scholar] [CrossRef] [Green Version]
  86. Shin, H.C.; Roth, H.R.; Gao, M.; Lu, L.; Xu, Z.; Nogues, I.; Yao, J.; Mollura, D.; Summers, R.M. Deep Convolutional Neural Networks for Computer-Aided Detection: CNN Architectures, Dataset Characteristics and Transfer Learning. IEEE Trans. Med. Imaging 2016, 35, 1285–1298. [Google Scholar] [CrossRef] [PubMed]
Figure 1. Different stages in the SWM service framework.
Sustainability 14 15896 g001
Figure 2. Comparison of the total population with the urban population (left) and the percentage growth of the total with the urban (right).
Sustainability 14 15896 g002
Figure 3. Predicted urban population and its impact on waste generation.
Sustainability 14 15896 g003
Figure 4. Predicted population, waste generation, and land requirement for disposal.
Sustainability 14 15896 g004
Figure 5. Different income group countries’ per capita waste generation rate.
Sustainability 14 15896 g005
Figure 6. A conceptual service model of an ICT and IoT enabled the smart and sustainable city.
Sustainability 14 15896 g006
Figure 7. Schematic diagram of a smart SWM system.
Sustainability 14 15896 g007
Figure 8. Proposed methodology workflow diagram.
Sustainability 14 15896 g008
Figure 9. Used activation functions (a) Sigmoid, (b) Hyperbolic tangent function, Tanh (c) Rectified liner unit (ReLU).
Sustainability 14 15896 g009
Figure 10. Proposed multipath CNN for illegal dump detection.
Sustainability 14 15896 g010
Figure 11. The ROC (left) and precision-recall (right) curves for binary classification (waste and non-waste). RC stands for a random classifier.
Sustainability 14 15896 g011
Figure 12. The scores of masked overlapping over the waste region in surveyed instances.
Sustainability 14 15896 g012
Figure 13. Comparison of instances with probability mask with corresponding actual instances.
Sustainability 14 15896 g013
Figure 14. The conceptual framework for a citizen-centric system.
Sustainability 14 15896 g014
Figure 15. The conceptual framework for an IoT-centric system.
Sustainability 14 15896 g015
Table 1. Waste classification based on generation sources and constituent components.
Waste Category and DefinitionConstituent Components
Type: Residential/Household
Definition: This type of waste is generated in residential areas due to human and household daily activities. It is generated from family dwellings.
Food residues, paper, cardboard, plastic, textiles, glass, metals, wood, ashes, electronic items, batteries, oils, household hazardous wastes such as paints, solvents, cleaners, pesticides, etc.
Type: Commercial/Institutional
Definition: These are the wastes generated from large institutional and/or commercial activities such as marketplaces, retail stores, restaurants, hotels, academic institutions, hospitals, government and private offices and buildings, etc.
Food residues, paper, cardboard, plastic, rubber, textiles, glass, metals, wood, heavy items, batteries, oils, hazardous wastes, etc.
Type: Municipal service
Definition: These wastes are from sources like street cleaning, assemblies in parks, recreational activities, entertainment places, and relaxing places-beaches, etc.
Street cleaning, landscaping residual materials, tree trimmings and dry leaves, general wastes from parks, entertainment centres, beaches, and other recreational areas.
Table 2. Comparison of MSW generated in different states of India.
Year20002009–20112020–2021% Growth
w.r.t. * 2000
% Growth
w.r.t. *
2009–2011
StatesG: Generated, C: Collected, T: Treated, and L: Landfill are in TPD
GGCTGCTL
Andhra
Pradesh
437611,50010655365668986829113320557.63−40.02
Assam2851146807731199109141.40320.704.62
Delhi400073846796192710,99010,9905193.575533174.7548.84
GujaratNA7379674487310,373.7910,33269463385.82-40.59
Karnataka327865002100210011,08510,19868171250238.1670.54
Kerala12988338173943543964.762550-172.96−57.51
Madhya
Pradesh
2684450027009758022.57235.56472763.5198.9078.28
Maharashtra909919,20419,204208022,632.7122,584.415,056.11355.36
6221.5 †
148.7417.85
Manipur40113933282.3190.3108.681.7605.75149.82
Meghalaya35285238100107.0193.029.6483.4205.74−62.45
Orissa65522391837332132.952097.141038.311034.33225.64−4.74
Punjab12662794NANil4338.374278.861894.042384.82242.6855.27
Puducherry69380NANil504.548236446631.1632.76
Rajasthan19665037NANil6897.166720.4761210.465082.16250.8236.93
Tamil Nadu540312,50411,62660313,42212,8449430.352301.04148.427.34
Tripura3336024640333.9317.69214.0612.9911.82−7.25
Uttar
Pradesh
596011,58510,563Nil14,71014,29255200146.8126.97
West Bengal462112,557505460713,70913,356667.6202.23196.679.17
* with respect to; † Unscientifically disposed of; Sources: [9,13]; The red and blue show the highest and lowest percentage growth in waste generation while the green colour shows the negative growth (dropping).
Table 3. Waste generation and percentage growth in the top populated cities of India.
City NamePopulation (Million)
(2011)
Waste Generation (TPD)% Growth w.r.t. *
1999–2000
1999–20002004–20052010–20112015–2016
Mumbai12.4453555320650011,000105.42
Delhi11.034005922680087002075.00
Bangalore8.442001669370037001750.00
Chennai7.08312430364500500060.05
Hyderabad6.7315662187 42004000155.43
Ahmedabad5.57168313022300250048.54
Kolkata4.4936922653367040008.34
Surat4.4690010001200168086.67
Pune3.12700117513001600128.57
Jaipur3.04580904310100072.41
Luck now2.8110104751200120018.81
Kanpur2.76120011001600150025.00
Nagpur2.404435046501000125.73
Visakhapatnam2.0330058433435016.67
Indore1.96350557720850142.86
Bhopal1.7954657435070028.21
Patna1.6833051122045036.36
Vadodara1.6640035760070075.00
Ludhiana1.61400735850850112.50
Coimbatore1.60350530700850142.86
Madurai1.5637027545045021.62
Varanasi1.1241242545050021.36
* with respect to; Source [28]; The red and blue show the highest and lowest percentage growth in waste generation.
Table 4. Comparison of per capita waste generation in different size cities.
Population Size (Million)kg per Capita per Day
Waste Generation * (in 2000)Waste Generation ** (in 2001)Waste Generation *** (in 2012)Waste Generation **** (in 2018)
>20.4300.22–0.62 (13 cities)0.5500.626
1–20.3900.19–0.53 (16 cities)0.4600.520
0.5–10.3800.466
0.1–0.50.3900.22–0.59 (11 cities)0.4430.490
<0.10.3600.17–0.54 (8 cities)0.4310.520
Sources: * [9,29]; ** [19,31]; *** [9,25]; **** [19,30].
Table 5. Different technologies and their applications in the SWM service system.
CategoryExamplesPotential Applications in SWM System
Spatial
Technologies
GISDisposal sites identification and selection, bin allocation and management, route identification and optimization for waste collection
GPSBin and collection vehicle location tracking
Identification
Technologies
Barcode
Quick response (QR) code
RFID
Bin identification
Data Acquisition
Technologies
Ultrasonic and Infrared sensorWaste level measurement inside the bin
Loadcell sensorWaste weight measurement
Accelerometer and ProximityCompute the bin lid state
Bio sensor and Gas sensorDetect the hazardous gas and chemicals inside the bin to stop the diffusion in the environment
TemperatureMeasure the temperature to control the fire
HumidityMeasure the humidity inside the bin to prevent the decomposition of biodegradable material
Data Communication
Technologies
ZigBee, WiFi, BluetoothLong-range communication
VHFR, LoRa, GSMShort-range communication
Artificial Intelligence
(Artificial Neural Network)
Convolutional neural network (CNN)
Long short-term memory (LSTM)
Waste detection and classification––glass, metal, trash, cardboard, plastic, medical, recyclable, nonrecyclable, e-Waste, polyethene, organic, inorganic, battery, waste bags, waste dumps
Waste forecasting, gas prediction inside the bin
Table 6. Summary of published research with waste dump detection and location identification as a core concept. The selected studies are displayed in reverse chronological order.
YearReferenceInput DataMethodOutputModel
2021[61]Satellite aerial imagery dataResNet50 algorithm and Feature Pyramid NetworkImage classificationDL
2021[62]Unmanned aerial vehicle (UAV) imagesSingle shot detector algorithm using deep neural networkObject detectionDL
2020[63]Remote sensing (RS)—High-resolution satellite imagesA heuristic algorithm based on trace transformation using discrete orthogonal transformationsLocation identification and classificationHeuristic
2020[64]Real-time video stream from a surveillance cameraYOLOv3 algorithmObject detection and recognitionDL
2019[65]RS—Optical satellite imagesCNNObject detectionDL
2019[66]Data extracted from RS and geographic information system (GIS)Discriminant analysis technique for feature selectionLocation identification and classificationML
2019[67]RS—Thermal imagesHeuristic method using multi-temporal land surface temperature contours and overlay analysisLocation identification and classificationHeuristic
2019[68]GIS mapped previous dataHeuristic and manual analysis using ArcGIS 10.3 and Statistica 12 softwareLocation classification and predictionHeuristic
2018[69]Manually captured street datak-nearest neighbour, naive Bayes, and support vector machineImage classificationML
2018[70]Manually collected and captured street dataSupervised deep CNN model using global average poolingObject detectionDL
2018[71]RS—Optical satellite images mapped with GISMulti-features detection algorithm followed by expert photo-interpretationImage classification and predictionManual
2017[72]Manually collected and captured street dataDeep CNN model based on GoogLeNet modelObject detectionDL
2017[73]RS—Multispectral high spatial resolution data sets mapped with GISMultitemporal photo-interpretation using a multiparametric sensing platformLocation classificationManual
2017[74]RS—High-resolution image dataSupport vector machine and random forest classifierImage classificationML
2017[75]Manually collected and captured street dataVarious existing deep CNN modelsObject detection and classificationDL
2017[76]Manually collected and captured street dataGoogLeNet and AlexNet modelsObject detection and classificationDL
2016[77]Manually collected and captured street and wild dataGoogLeNet modelsObject detectionDL
2015[78]Data extracted from GIS mapped with data from different sourcesLinear regressionLocation predictionML
2014[79]GIS-mapped data with different factorsMultivariate factor analysis using a GIS geostatistical modelLocation identification and predictionML
2009[80]Data extracted from RS and GISExpert’s analysis and heuristic modelLocation predictionManual and Heuristic
2009[81]Satellite image dataExpert’s analysisLocation predictionHeuristic
2009[82]RS and GIS dataMulti-criteria spatial analysisLocation predictionML
2004[83]RS thermal mapsPrincipal component transformation and spectral signature analysis using unsupervised algorithm ISODATAImage classificationML
2002[84]Satellite image dataSpatial and spectral information analysisImage analysis and classificationML
Table 7. Parameters setup for mp-CNN.
Layer NameC11C12C21C22C23C31C32C33C41C41C51C52
Number of Kernels642561281285122562561024512204840961
Size of Kernels5 × 51 × 13 × 33 × 31 × 13 × 33 × 31 × 13 × 31 × 11 × 13 × 3
Table 8. Confusion matrix for binary classification.
CategoryGround Truth
Positive (Waste)Negative (No Waste)
PredictionPositive (Waste)True Positive (TP)False Positive (FP)
Negative (No Waste)False Negative (FN)True Negative (TN)
Table 9. Model performance evaluation parameters.
Evaluation ParameterFormula
Precision: It is also called positive predictive value for classifying the instances. It is the ratio of correctly predicted positive instances and all positive predictions. It should have a high value (1) for a good classifier. The precision has a value of 1 if and only if FP is zero. P = T P T P + F P
Recall: It is also called sensitivity or true positive rate. It is the ratio of correctly predicted positive instances and actual positive class. It should have a high value (1) for a good classifier. The recall has a value of 1 if and only if FP is zero. R = T P T P + F N
F-Score: Ideally, we need both precision and recall being one for a good classifier. This implies that FN and FP must be zero. Therefore, a matric is needed that considers both precision and recall. F-score considers both precision and recall. It is the harmonic mean of the precision and the recall to determine the overall success of the model. F-score becomes one only when precision and recall are both 1. F-score becomes high only when both precision and recall are high. It is a better measure than accuracy. F s c o r e = 2 P R P + R
Accuracy: It is the ratio of all correctly classified instances and the total instances. A c c u r a c y = T P + T N T P + F P + T N + F N
Area Under Receiver Characteristic Operator Curve (AUROC): It is an evaluation parameter which is used to compute the performance of a binary classifier. It is a curve representing the probabilistic area bounded by a true-positive rate (TPR) and a false-positive rate (FPR). TPR is the ratio of correctly predicted positive instances (TP) and actual positive class (TP + FN), i.e., recall, to correctly determine the true-positive values. Similarly, FPR is represented as the ratio of FP and FP + TN. T P R = T P T P + F N F P R = F P F P + T N
Table 10. Confusion matrix for waste and non-waste classes.
CategoryGround Truth
WasteNo Waste
PredictionWaste148333
No Waste171467
Table 11. The value of performance evaluation parameters.
ClassPrecisionRecallF-ScoreAccuracyAUROC
Waste0.97820.98860.98340.98330.9863
Publisher’s Note: MDPI stays neutral with regard to jurisdictional claims in published maps and institutional affiliations.

