Article

Effects of Climate and Land Use Change on Agricultural Water Consumption in Baicheng County

1
College of Hydraulic and Civil Engineering, Xinjiang Agricultural University, Urumqi 830052, China
2
Xinjiang Key Laboratory of Hydraulic Engineering Security and Water Disasters Prevention, Xinjiang Agricultural University, Urumqi 830052, China
3
State Key Laboratory of Desert and Oasis Ecology, Xinjiang Institute of Ecology and Geography, Chinese Academy of Sciences, Urumqi 830011, China
4
Chinese Academy of Sciences, Beijing 100049, China
*
Author to whom correspondence should be addressed.
Sustainability 2022, 14(21), 13746; https://doi.org/10.3390/su142113746
Submission received: 2 September 2022 / Revised: 11 October 2022 / Accepted: 19 October 2022 / Published: 24 October 2022

Abstract

:
Changes in climate and land type directly affect the transformation and utilization of regional water resources. To analyze the evolutionary characteristics and drivers of agricultural water consumption (AWC) in arid regions, the Baicheng County is selected as an example. Based on the meteorological and land use/cover data from 1990 to 2020, the Penman–Monteith model and sensitivity method were used for analysis. The results show that: (1) The water consumption of major crops during the growth period was increasing, which was caused by climate change and changes in agricultural planting structure. (2) The sensitivity of AWC to meteorological factors was as follows: mean temperature (1.56) > mean wind speed (0.6) > precipitation (−0.12) > sunshine duration (−0.06). Temperature and wind speed were the dominant factors contributing to increased water consumption in oasis agriculture. (3) The change in land type was more obvious, mainly in cultivated land and urban and rural residential land with obvious growth, while the area of water area, forestland, and grassland showed a decreasing trend. In the past 30 years, the increase in cultivated land has reached 24.32%. The increase in cultivated land area was an important reason for the increase in AWC.

1. Introduction

Water resources in arid zones are elements of oasis agricultural production and the key factor in determining its stability and development. The change in water abundance dominates the alternating evolution of oases in arid zones between desert and oasis processes. In 2006, the concept of blue water and green water was first proposed by Falkenmark, which provided a new perspective for water resource research and management [1]. Blue water was defined as three forms: surface runoff, soil water, and groundwater flow, while green water was defined as soil water and actual evapotranspiration. Green water is the main body of water consumption, and 80% is used for global agricultural production. For arid areas in Northwest China with a dry climate, little rain, and severe evaporation, the agricultural irrigation water accounts for more than 90% of the total water [2,3]. Agricultural activities play a crucial role in regulating climate change and ensuring food security while posing a serious threat to the sustainable development of regional water resources [4]. Therefore, in arid zones, we must study trends in agricultural water consumption (AWC) and its driving factors to maintain the stable development of oasis agriculture.
Climate change and land-use/land-cover change (LUCC) can directly or indirectly affect regional water supply and consumption by influencing surface evaporation, atmospheric precipitation, infiltration, and soil erosion by water [5,6,7]. The Working Group II of the IPCC announced the Sixth Assessment Report (AR6) “climate change 2022: Impacts, adaptation and vulnerability”; the report reveals the impact of climate change on key factors such as crop yield and suitable planting areas with abundant research results [8]. Global climate change, characterized by the increase of average temperature, dramatic rainfall changes, and frequent extreme meteorological phenomena, not only causes changes in the amount of water resources and their spatial and temporal distribution, but also increases the potential evapotranspiration of crops, affects the growth period of crops [9], and affects changes in agricultural water demand [10]. The process of crop water demand is the reflection of the comprehensive effect of its biological characteristics and environmental impact factors. Water demand ET0 is closely related to various climatic factors and is significantly affected by temperature and precipitation [11,12]. Any increase in temperature and decrease in precipitation during the growing period of crops will lead to the reduction of the agricultural water supply and an increase in agricultural water demand in the region, threatening the balance of agricultural water supply and demand in the region [13]. LUCC is characterized by high-intensity human activities, such as the expansion of cultivated land and changes in land management policies, which further aggravate the contradiction between supply and demand of agricultural water resources and affect the sustainable development of agriculture [14]. Rapid socioeconomic development coupled with climate change is likely to result in uncertainty in agricultural water use, making water resource management and regulation even more difficult [15]. Traditional methods used for allocating and regulating water resources are unable to deal with the balance and optimize water supply and demand between different sectors. A fundamental improvement is required in our current understanding of what extent climate change and human activities could reshape the hydrological processes such as precipitation, evapotranspiration, surface runoff, seepage, and water consumption.
With the recent intense human activities and climate change, there is a contradiction between agricultural water and ecological water. Predecessors have conducted research from different perspectives around the issues related to agricultural water consumption and its influencing factors. For example, the factors of climate change and irrigation technology [16]; global drought trends [17]; climate and agricultural land use change [18]; water resource availability and land use change [19]; climate change and human activities [20]; and the expansion of crop planting scales [21] should be considered. Over the years, decreased agriculture production and water quality degradation have been observed due to climatic abnormalities. Crop production is highly sensitive to the climate [22]. Therefore, accurate future climate projections at different timescales and high resolutions are necessary for rational water resource management and ecosystem sustainability [23]. In addition, the crop planting structure [24,25] and climate and land use change factors [26] also have an important impact on the characteristics of agricultural water consumption. Considering the driving effects of various influencing factors, Yang and Wang [27] discussed the action mode of driving factors of agricultural water intensity by constructing a theoretical decomposition model of water intensity. In summary, the existing research has laid a solid foundation for an in-depth understanding of the agricultural water consumption process and its impact mechanisms. However, scholars make more use of climate change to analyze agricultural water consumption; there are relatively few studies on the analysis of agricultural water consumption based on climate change and land use change, and there is also a lack of research on the sensitivity of quantitative analysis of oasis agricultural water consumption changes and their driving factors in arid areas.
In arid and semi-arid areas, water resources are extremely scarce [28]. In recent years, the rapid socioeconomic development, policy changes, population growth, and climate change in the Baicheng oasis have altered its ecosystem on a large scale; in particular, shrubs and grasslands have been reclaimed into cultivated land, resulting in a sharp increase in agricultural water demand [29]. According to the Notice of the General Office of the Ministry of Agriculture and Rural Affairs on the Identification of Seed Production Counties and Regional Seed Breeding Bases (Agricultural Office Seed (2021) No. 5), Baicheng County was selected as a national seed production county. In this context, the Baicheng oasis was selected as a typical regional representative of arid and semi-arid areas, and we analyzed the evolution characteristics of the AWC based on the blue–green water theory and explained the evolution trend and causes of agricultural water use through climate and land use changes. This study is expected to provide a reference for optimizing agricultural cropping structures, scientifically formulating agricultural water use policies in arid zones, and realizing sustainable utilization of water and soil resources in watersheds.

2. Materials and Methods

2.1. Study Area

Baicheng County is located in the mountainous basin on the northern edge of the Tarim Basin, Xinjiang (41°24′08″ N–42°38′52″ N, 80°37′39″ E–83°02′25″ E) (Figure 1), which covers an area of 19,100 km2. The proportion of the agricultural population in Baicheng County is relatively high. The means of annual temperature, precipitation, and sunshine duration were 7.51~9.55 °C, 64.4~223.7 mm, and 2989 h, respectively. The study area has a temperate continental arid climate, scarce precipitation, dry climate, large evaporation, a large temperature difference between day and night, and abundant light and heat resources.
The rivers in the study area, mainly including the Heizi River, Muzati River, Karasu River, and other water systems, are formed by Tianshan glaciers and ice melt water, which are the main sources of water for ecology, agriculture, and residents. As a typical representative of oasis agriculture in an arid area, the crops in Baicheng County mainly include wheat, cotton, corn, and oil. Recently, with the development of the social economy, the scale of agricultural planting in this area has increased gradually. Accordingly, the resulting shortage of water resources has further expanded [30].

2.2. Data Sources

In this study, historical daily meteorological data from 1990–2020 (including daily temperatures, precipitation, relative humidity, sunshine duration, and wind speed) were obtained from the China Meteorological Administration (http://data.cma.cn/). The remote sensing image data were obtained from the Resource and Environment Science Data Center of the Chinese Academy of Sciences (http://www.resdc.cn/). The LUCC data with a spatial resolution of 30 m by 30 m for 1990, 2000, 2010, and 2020 were obtained from Landsat-MSS and Landsat8 satellite images. Furthermore, system radiation and geometric corrections were applied to these Landsat images. Combining field investigation and visual inspection, this study conducted classifications on the Landsat imagery for LUCC information in the study area. As a result, there were six primary land cover types in this study: cultivated land, forestland, grassland, water area, urban and rural residential land, and unused land. The administrative zoning map was obtained from the Resource and Environment Data Cloud Platform (http://www.resdc.cn/). Other data used to estimate agricultural water consumption, such as agricultural cultivation structure and area, were obtained from the Xinjiang Statistical Yearbook.

2.3. Methods

2.3.1. Evapotranspiration of Crops

The Penman–Monteith model is a more accurate and comprehensive parameterization of ET0, recommended by The Food and Agriculture Organization (FAO) [31], and was widely applied. The detailed calculation is as follows:
E T 0 = 0.408 Δ ( R n G ) + γ 900 T + 273 u 2 ( e s e a ) Δ + γ ( 1 + 0.34 u 2 )
where ET0 is the reference crop evapotranspiration (mm day−1); Rn is the net radiation at the crop surface (MJ m−2 d−1); G is the soil heat flux (MJ m−2 d−1); u2 is the wind speed measured at 2 m height (m s−1); T is the average air temperature (°C); es is the saturation vapor pressure (KPa); ea is the actual vapor pressure (KPa); Δ is the slope of the vapor pressure curve (KPa °C−1); and γ is the psychrometric constant (KPa °C−1).
The crop evapotranspiration (ETc) [31] is calculated as follows:
E T C = E T 0 × K C
where Kc is the crop coefficient, as recommended by the International Food and Agriculture Organization (FAO) recommendations; ETc is the crop evapotranspiration (mm day−1), and the total ETc (mm) of the crop growth period can be obtained by adding the daily ETc of the crop.

2.3.2. Linear Trend Estimation Method

The linear trend estimation method [32] sets Y(x) as a certain variable and x as time and establishes a linear regression equation Y(x) with x:
Y ( x ) = a x + b
where a and b are the regression coefficients and the sign Y(x) of the a value reflects the rising or falling trend, which is called the tendency rate.

2.3.3. Land Use Transfer Matrix

Based on the characteristics and actual situation of LUCC in the study area, four land cover classification maps of Landsat images were used to classify the land use types into six categories. ArcGIS was used to calculate the area of land use types in four typical years by constructing a dynamic model of land use change [33]. Then, the land use type transfer matrix was obtained (the land use transfer matrix reflects the structural characteristics of land use change, that is, the directional and quantitative characteristics of land use change) by mapping the land use types obtained in different periods and using the method of cross-analysis.

2.3.4. Sensitivity Analysis

The sensitivity coefficient of AWC to the main meteorological elements in the study area from 2002 to 2019 was analyzed by the sensitivity method [34]. The calculation formula is as follows:
ε = F ¯ A W C ¯ · ( F i F ¯ ) · ( A W C i A W C ¯ ) ( F i F ¯ ) 2
where Fi and AWCi represent the main meteorological elements and AWC in the ith year; F ¯ , and A W C ¯ are their multiyear mean values; and ε is the sensitivity coefficient, where a positive value indicates that AWC increases with the increase of this meteorological element, and a negative value indicates that AWC decreases with increasing meteorological elements. The greater its absolute value, the stronger its sensitivity.

3. Results and Discussion

3.1. Characteristics of Changes in Agricultural Water Consumption

Green water includes green water flow and green water storage, where green water flow refers to the actual evapotranspiration, and green water storage refers to the amount of water in the soil. According to a study on green water [35], the proportion of water in the soil was relatively small, which reflects the characteristics of green water consumption and the change in evapotranspiration. To analyze the variation characteristics of regional agricultural water consumption, the total green water consumption was obtained by calculating the total water consumption during the main crops’ growth period (Figure 2) and multiplying it by the planting area of the corresponding crops (Figure 3a,b) (only reflecting the water consumption required for crop growth under normal growth conditions).
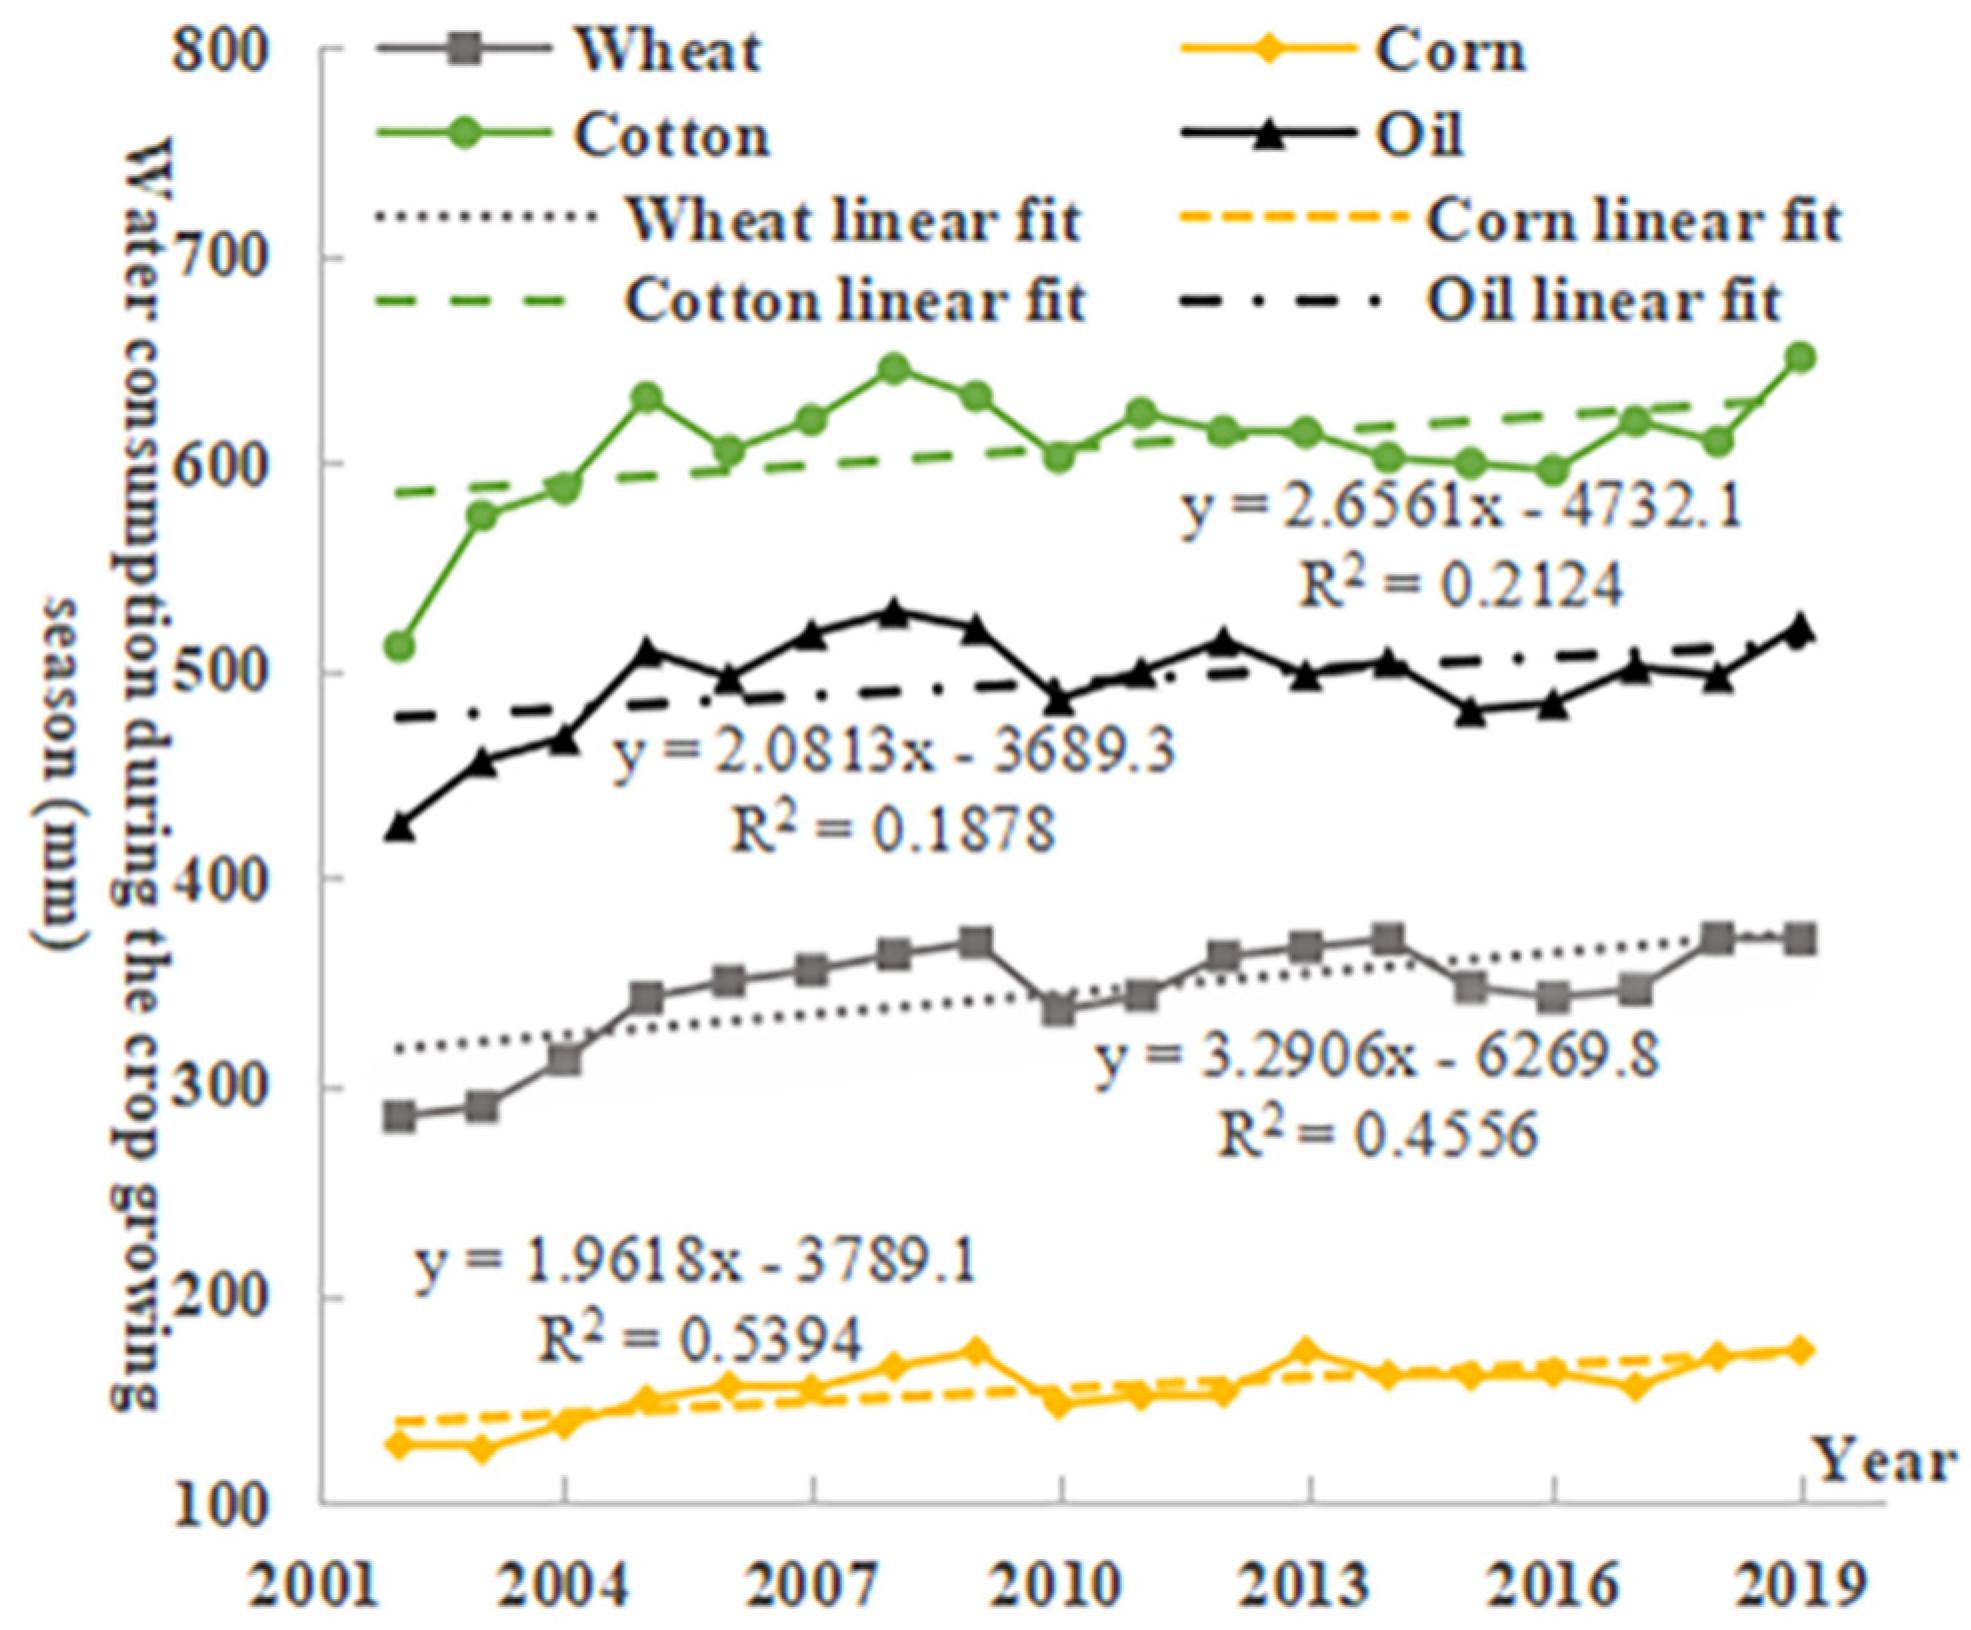
Based on the meteorological data of the study area from 2002 to 2019, the crop water consumption was calculated according to Equations (1) and (2). Crops in the study area were mainly cotton, wheat, corn, and oil, while other food crops, such as vegetables and fruit trees, accounted for a relatively small proportion. Therefore, it is assumed that the total consumption of green water was calculated based on the four main crops. The changes in water consumption of the main crops in the study area are shown in Figure 2.
Green water consumption varied widely among crops, and they all showed a trend of increasing year by year (Figure 2). The crop with the highest green water consumption in the study area was cotton, with the annual average green water consumption during the growing season being 608 mm, which is 1.76 times that of wheat (346 mm). The green water consumption in the growing season of corn was 155 mm, which was only 25.49% of that of cotton.
The planted areas of cotton and oil in the study area have shown a downward trend in recent years (Figure 3a); they decreased from 33 km2 and 67 km2, respectively, in 2002 to 0 km2 and 22 km2, respectively, in 2019. The planted areas of wheat and corn increased, with the planted area of wheat increasing from 133 km2 in 2002 to 174 km2 in 2019, representing an increase of 30%.
The total green water consumption Increased slowly from 2002 to 2008, significantly decreased from 2008 to 2011, and increased significantly from 2011 to 2019 (Figure 3b). In 2008, the green water consumption of cotton was 2.9 × 10⁷ m3. In 2011, the green water consumption of cotton was 0.13 × 10⁷ m3 as the cotton planting area decreased from 45 km2 to 2 km2. Therefore, the decrease in the total green water consumption was caused by the change in the cotton planting area, the high water-consumption crop, during these four years. From 2011 to 2019, the planting area of wheat and corn increased significantly, and the total green water consumption increased.
In summary, due to climate change, the water consumption of crops during the growth period has increased, which has greatly increased the green water consumption of crops in the study area. Simultaneously, the total consumption of green water was closely related to the agricultural planting structure and area.

3.2. The Driving Factors of the Changing Characteristics of Agricultural Water Consumption

3.2.1. Climate Change Characteristics

(1) Interannual variability characteristics of major climate elements.
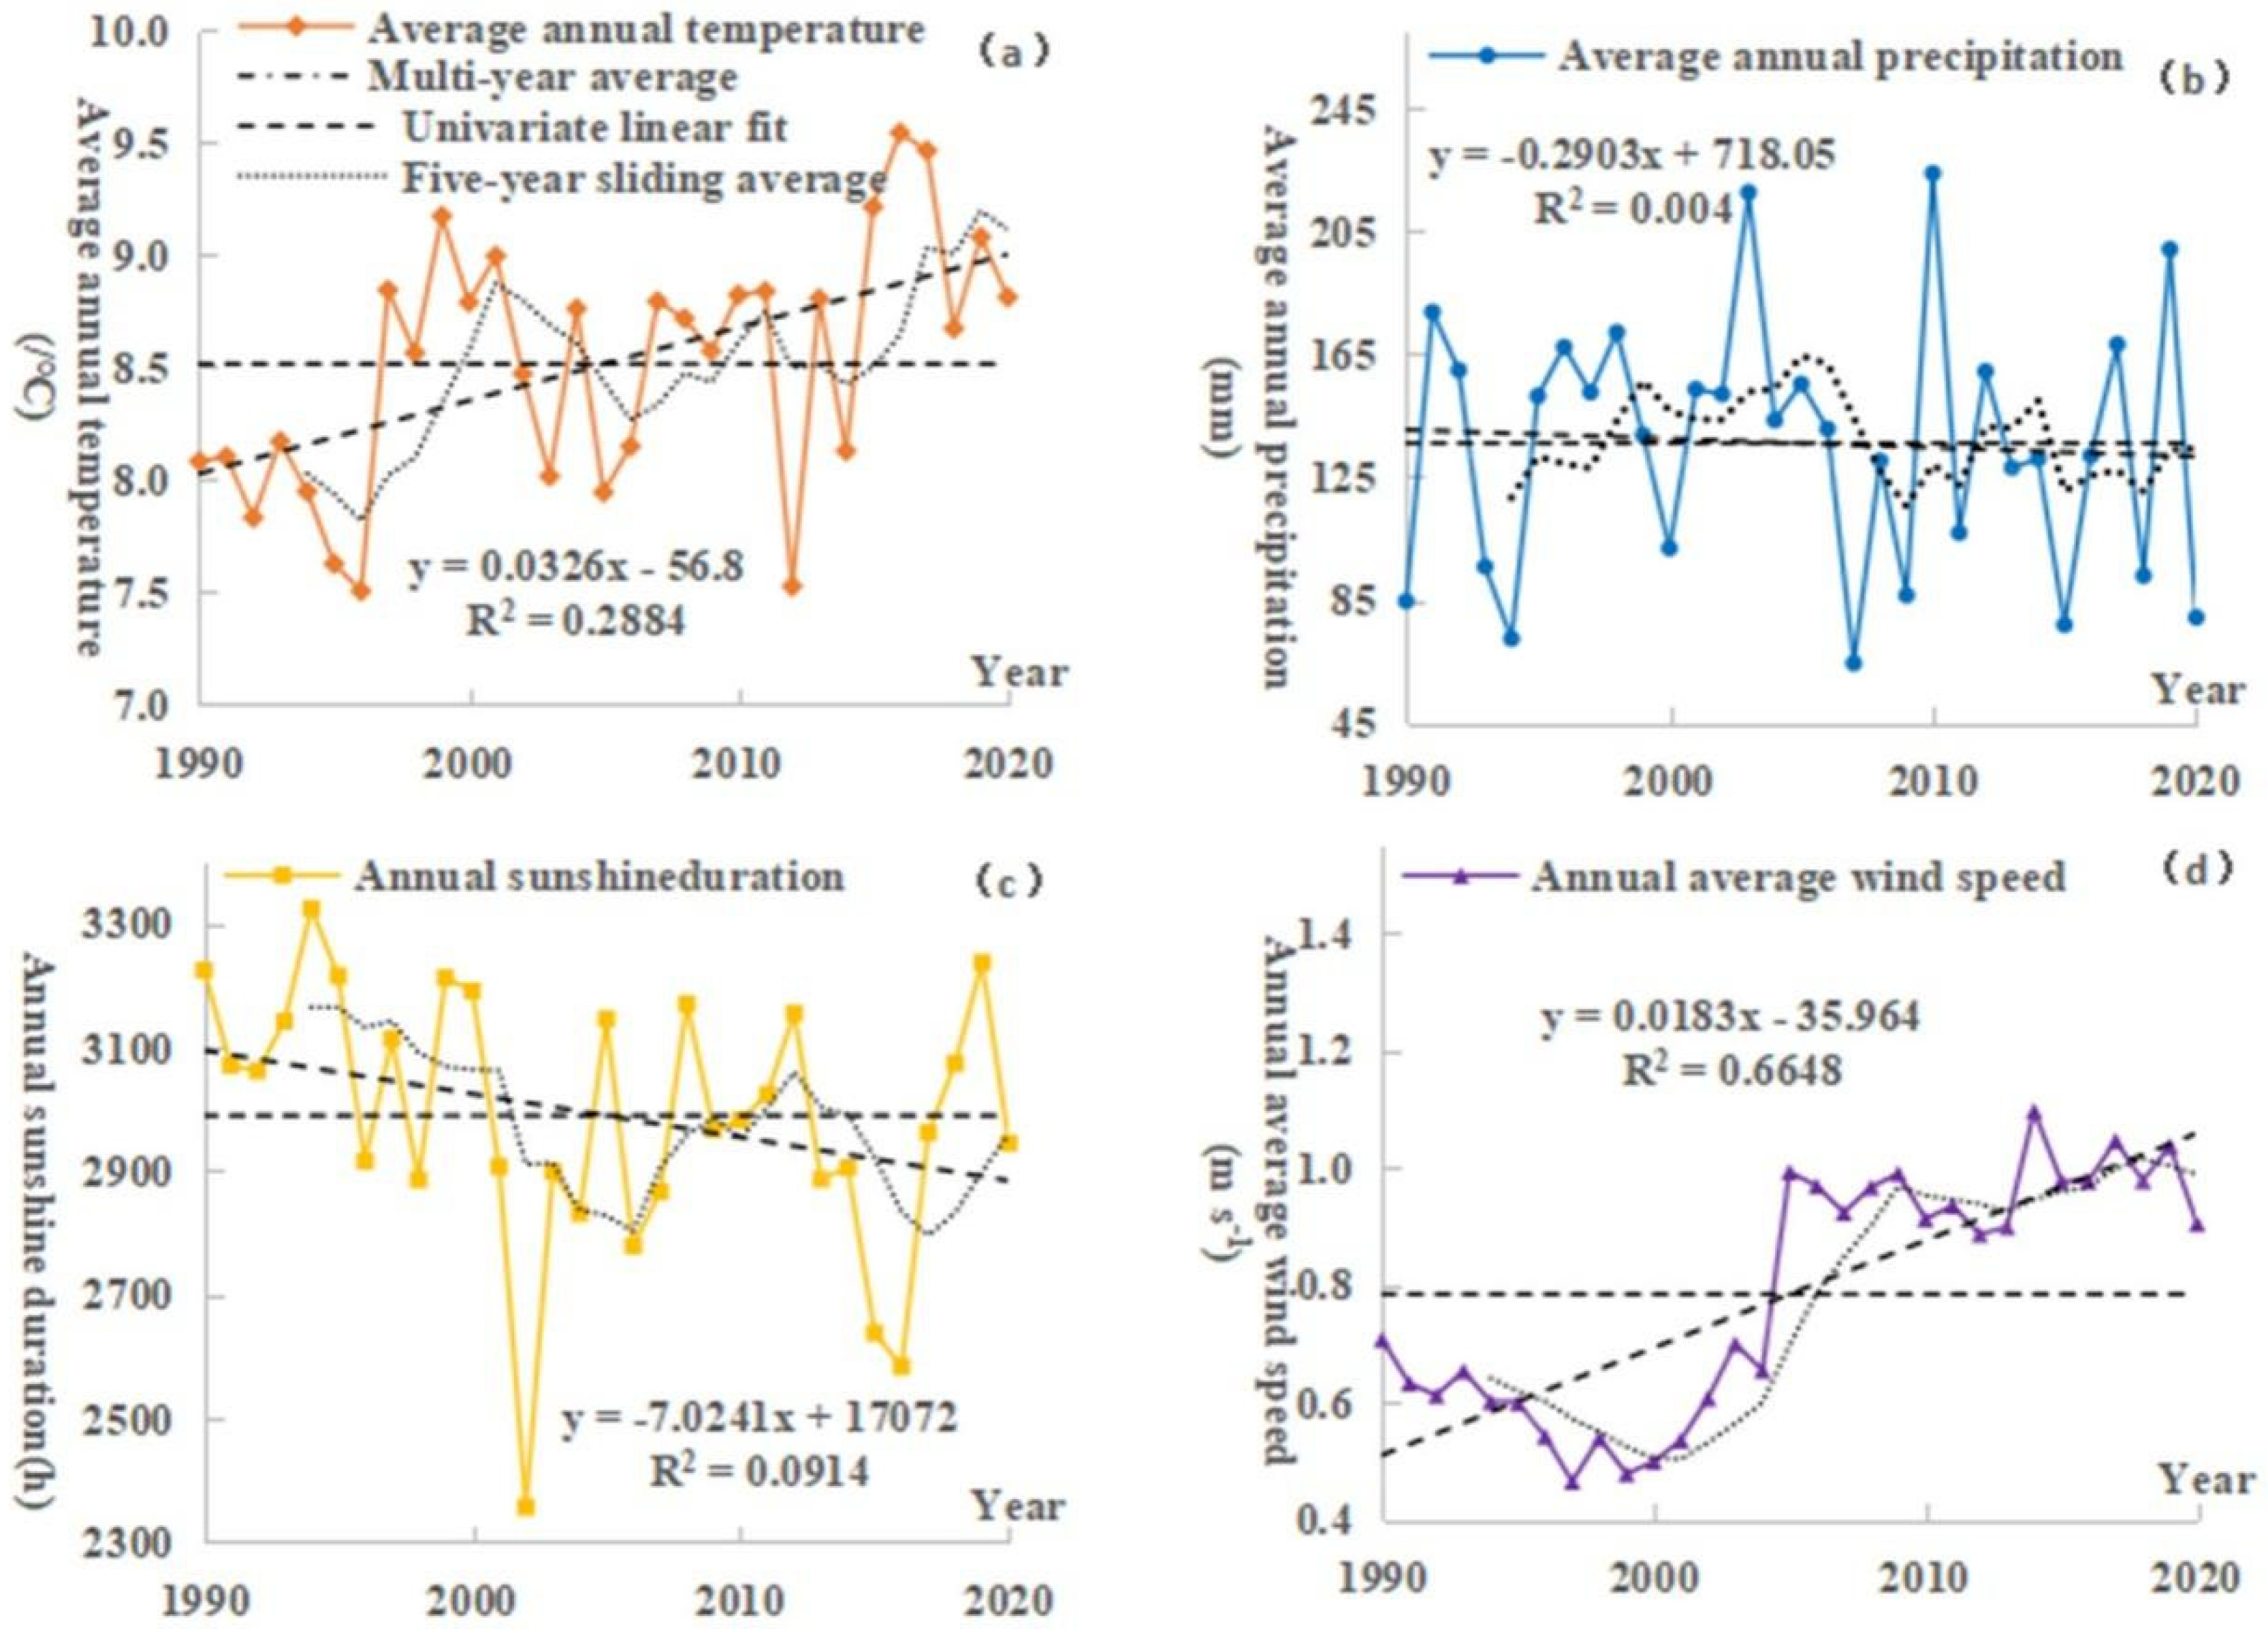
Based on the data from meteorological stations in Baicheng County from 1990 to 2020, the trends in temperature, precipitation, sunshine duration, and wind speed were analyzed (Figure 4).
The annual mean temperature in the study area has generally shown an increasing trend since the 1980s with a rate of increase of 0.32 °C/10a, and the annual mean temperature reached a maximum of 9.5 °C in 2016 (Figure 4a). The average annual precipitation in the region was only 135.95 mm, and the precipitation has been decreasing at a rate of 2.9 mm/10a in the past 31a. The precipitation peaked at 224 mm in 2010 (Figure 4b). The study area has sufficient sunshine, and the average sunshine duration for many years was 2989 h. The tendency rate of −70.24 h/10a decreased during the study period (Figure 4c). Because the study area is located in the southwestern part of Xinjiang and the southern foot of the middle section of the Tianshan Mountains, cold air from the northwestern direction cannot reach it directly. The annual average wind speed in the study area was low, only 0.73 m/s. From 1990 to 1997, the annual mean wind speed showed an obvious downward trend. From 1999 to 2005, the annual mean wind speed showed a significant increasing trend and changed slightly after 2006 (Figure 4d).
(2) Interdecadal variability characteristics of major climate elements.
The interdecadal variability in the main climatic elements in the intermountain basin oasis of Baicheng County was generally consistent with the interannual variability (Table 1). Temperature and wind speed showed an increasing trend, while sunshine duration and precipitation showed a decreasing trend. According to each element, the annual average temperature in the 1990s was the lowest among all generations, i.e., 8.26 °C, which was lower than the multiyear average of 8.52 °C, and the temperature gradually tended to increase. The precipitation showed an increasing–decreasing trend, with the lowest value of 127.30 mm during 2011–2020 and the highest value of 146.69 mm during 2001–2010. The annual average wind speed was the smallest in the 1990s, only 0.51 m/s, which was close to the minimum value of all years and then gradually increased.

3.2.2. Land Use Type Change Characteristics

The development and use of land are directly affected by water resources, which are an important constraint on socioeconomic development. Conversely, LUCC is bound to cause the redistribution of water resources in oases. To analyze the changes and interconversion of land use types occurring in the study area during the last 30 years, GIS analysis tools were used to produce land use type distribution maps of the study area in 1990, 2000, 2010, and 2020 (Figure 5), and the statistical results of the area of each land use type in the above four periods (Table 2) and the land use transfer matrix were calculated (Table 3).
The land use/land cover of the study area was dominated by cultivated land, grassland, and unused land, which accounted for more than 82% of the total area of the study area. Cultivated land is mainly distributed in the southern part of the study area, grassland is mainly distributed in the central part, and waters are mainly glacial and snow in the north. From 1990 to 2020, the forestland and grassland mainly distributed in the central region were gradually replaced by cultivated land and urban and rural residential land. During the study period, forestland, grassland, and water area all showed a decreasing trend; the area percentages of forestland, grassland, and water decreased from 4.02%, 38.51%, and 7.10% to 2.62%, 38.18%, and 4.62%, respectively. However, cultivated land and urban and rural residential land both showed an increasing trend. The newly cultivated land generally showed a trend of expansion from the center of the oasis to the periphery, and the scale of cultivated land expanded significantly. The process of urbanization has accelerated, spatially spreading around the original towns and cities, with a consequent increase in urban and rural residential land. The outer edge of the oasis shows a trend of reclamation and arable land. (Figure 5) (Table 2).
From 1990 to 2000, cultivated land, water area, and urban and rural residential land were transformed from grassland and unused land and increased yearly. From 2000 to 2010, the cultivated land area increased by 164.81 km2, accounting for 15.35%, and the main source of land transformation was grassland, with an area of 198.99 km2. The area of forestland decreased by 196.51 km2, and the main transformation types were grassland and cultivated land, with transformed areas of 395.61 km2 and 4.37 km2, respectively. The water area decreased by 377.16 km2, and the main transformation types were grassland, cultivated land and unused land (Table 3). The results showed that the encroachment of cultivated land on grassland, forestland, and water areas occurred in the agricultural development period. With the development of urbanization and population growth, the most direct manifestation was that urban and rural residential land continuously encroached on the surrounding grassland and unused land with an increase of 26.55 km2, accounting for 55.84%. From 2010 to 2020, under the influence of the ground slope and temperature, the suitable grassland and unused land in the study area were transformed into newly cultivated land, and the transformed area was 65.71 km2. Urban and rural residential land was converted from grassland, cultivated land, and unused land, with a net increase of 37.85 km2, accounting for 51.08%.

3.3. Influencing Factors of Agricultural Water Consumption in the Oasis

3.3.1. Impact of Climate Change on Water Consumption in Agriculture

Precipitation can directly affect the storage and distribution of water resources. Temperature, sunshine duration, wind speed, and other factors can affect the consumption and utilization of water resources in agricultural production by causing changes in evaporation and relative humidity to increase crop evapotranspiration. According to the sensitivity analysis method introduced above (Section 2.3.4), the sensitivity coefficients between AWC and four meteorological elements, including temperature, precipitation, sunshine duration, and wind speed, were calculated (Table 4).
The sensitivity coefficients of AWC to precipitation and sunshine duration were negative, indicating that the increase in precipitation and sunshine duration would inhibit the increase in AWC under the condition that other meteorological factors remain. The sensitivity coefficients of AWC to temperature and wind speed were positive, indicating that AWC would increase with increasing temperature and wind speed. Temperature and wind speed were the key factors causing the increase in AWC (Table 4).
Comparing the absolute values of the sensitivity coefficients, the sensitivity of AWC to meteorological factors was as follows: mean temperature > mean wind speed > precipitation > sunshine duration.

3.3.2. Impact of Land Use Change on Water Consumption in Agriculture

To analyze the driving effect of land use type shifts on the evolution of water consumption in oasis agriculture, the ArcGIS 10.7 spatial overlay analysis function was used to extract the locations where land use type shifts were generated.
In the past 40 years, the LUCC changed significantly between 2000 and 2010 (Figure 6). Combined with the research results in Section 3.2.2, with the greatest increase in cultivated land and urban and rural residential land from 6.45% and 0.27% of the total area in 1990 to 8.03% and 0.71% in 2020, respectively, the cultivated land area increased by nearly 250 km2, urban and rural residential land increased by 68.7 km2 (Table 2). The significant increase in the cultivated land area has led to increased agricultural water consumption and the burden of water resource development and utilization. The leading industry of the Baicheng County oasis is agriculture, the plantation industry is dominant, and surface water is the main source of irrigation water. Above all, LUCC change is one of the important factors affecting water resource utilization in the oasis, and the increase in arable land area is the main reason for the increase in agricultural water consumption.

4. Conclusions

The evolution characteristics of the AWC in the Baicheng oasis and the main driving factors were studied. The main conclusions are as follows:
(1)
From 2002 to 2019, the water consumption of the main crops during the growth period from high to low was cotton (512–645 mm), oil (426–529 mm), wheat (285–369 mm), and corn (125–173 mm). The total green water consumption of the Baicheng County oasis showed an increasing trend. This was caused by climate change and changes in agricultural planting structure.
(2)
The sensitivity of AWC to meteorological factors was as follows: mean temperature (1.56) > mean wind speed (0.6) > precipitation (−0.12) > sunshine duration (−0.06). Temperature and wind speed were the dominant factors that increased the evapotranspiration of oasis crops, resulting in an increasing trend of agricultural water consumption in the study area.
(3)
The overall cultivated land area in the Baicheng County oasis increased from 1024.37 km2 in 1990 to 1273.50 km2 in 2020, an increase of 24.32%. Agricultural irrigation in the study area mainly depended on surface water, and the increase in cultivated land area directly led to the increase in agricultural water consumption. The increase in cultivated land area was the main reason for the increase in agricultural water consumption in the study area.
In addition, in the future, with the increasing impact of climate change and human activities, agricultural water security in irrigation areas will face greater challenges. Therefore, in future research, on the one hand, it is important to comprehensively study the impact mechanisms of various meteorological factors on crop water demand and quantitatively analyze the contribution of various meteorological factors to agricultural water consumption. This provides a technical basis for guiding the precision irrigation of crops in irrigation areas in response to climate change. On the other hand, we should pay attention to the research on the mechanisms and transformation laws of water cycle elements in irrigation areas under changing environments, clarify the temporal and spatial variation laws of agricultural water resources in irrigation areas, and guarantee the safe water use of crops.

Author Contributions

Idea and methodology, C.Y. and Q.Z.; data acquisition, Q.Z.; formal analysis, C.Y.; writing—original draft preparation, Q.Z.; writing—review and editing, C.Y., Q.Z., Y.L. and X.H. All authors have read and agreed to the published version of the manuscript.

Funding

This research was funded by the graduate scientific research innovation project of Xinjiang Agricultural University (Grant No. XJAUGRI2021012).

Institutional Review Board Statement

Not applicable.

Informed Consent Statement

Informed consent was obtained from all subjects involved in the study.

Data Availability Statement

Not applicable.

Conflicts of Interest

The authors declare no conflict of interest.

References

  1. Falkenmark, M. The New Blue and Green Water Paradigm: Breaking New Ground for Water Resources Planning and Management. J. Water Resour. 2006, 132, 129–132. [Google Scholar] [CrossRef]
  2. Xie, Z.; Zhu, K.; Lu, F.; Xu, Y.; Song, X. Trend analysis for blue and green water resources in Chaobai river basin based on hydrologic cycle simulation. J. China Hydrol. 2019, 39, 32, 44–49. [Google Scholar]
  3. Nan, J.; Wang, Y.; Shang, H.; Zhao, X.; Wu, P.; Ma, X.; Xiao, J. Investigation and developing count measures on current water using situation for agriculture in Heihe River Basin. China Rural Water Hydrol. 2010, 7, 37–40. [Google Scholar]
  4. Gao, X.; Cheng, W.; Wang, N.; Liu, Q.; Ma, T.; Chen, Y.; Zhou, C. Spatio-temporal distribution and transformation of cropland in geomorphologic regions of China during 1990–2015. J. Geogr. Sci. 2019, 29, 180–196. [Google Scholar] [CrossRef] [Green Version]
  5. Yang, L.; Feng, Q.; Yin, Z.; Wen, X.; Si, J.; Li, C.; Deo, R.C. Identifying separate impacts of climate and land use/cover change on hydrological processes in upper stream of Heihe River, Northwest China. Hydrol. Process. 2017, 31, 1100–1112. [Google Scholar] [CrossRef]
  6. Nian, Y.; Li, X.; Zhou, J.; Hu, X. Impact of land use change on water resource allocation in the middle reaches of the Heihe River Basin in northwestern China. J. Arid Land 2014, 6, 273–286. [Google Scholar] [CrossRef] [Green Version]
  7. Borrelli, P.; Robinson, D.A.; Panagos, P.; Lugato, E.; Yang, J.E.; Alewell, C.; Wuepper, D.; Montanarella, L.; Ballabio, C. Land use and climate change impacts on global soil erosion by water (2015–2070). Proc. Natl. Acad. Sci. USA 2020, 117, 21994–22001. [Google Scholar] [CrossRef]
  8. IPCC. Climate Change 2022: Impacts, Adaptation and Vulnerability [M/OL]. 2022. Available online: https://www.ipcc.ch/report/sixth-assessment-report-working-group-ii/ (accessed on 27 February 2022).
  9. Tao, F.; Yokozawa, M.; Liu, J.; Zhang, Z. Climate–crop yield relationships at provincial scales in China and the impacts of recent climate trends. Clim. Res. 2008, 38, 83–94. [Google Scholar] [CrossRef]
  10. Zhang, J. Action of National Water Conservation highlights impact of climate change. China Water Resour. 2018, 6, 11–13. [Google Scholar]
  11. Liu, C.; Zhang, D.; Liu, X.; Zhao, C. Spatial and temporal change in the potential evapotranspiration sensitivity to meteorological factors in China (1960−2007). J. Geogr. Sci. 2012, 22, 3–14. [Google Scholar] [CrossRef]
  12. Suat, I.; Isa, K.; Kari, E.S.; Denis, M. Trend and magnitude of changes in climate variables and reference evapotranspiration over116-yr period in the Platte River Basin, central Nebraska-USA. J. Hydrol. 2012, 420–421, 228–244. [Google Scholar]
  13. Mougou, R.; Mansour, M.; Iglesias, A.; Chebbi, R.Z.; Battaglini, A. Climate change and agricultural vulnerability: A case study of rain-fed wheat in Kairouan, Central Tunisia. Reg. Environ. Change 2010, 11, 137–142. [Google Scholar]
  14. Tong, L.; Kang, S.; Zhang, L. Temporal and spatial variations of evapotranspiration for spring wheat in the Shiyang river basin in northwest China. Agric. Water Manag. 2007, 87, 241–250. [Google Scholar] [CrossRef]
  15. Mahsa, M.; Ali, N.; Amir, S.d.; Malekian, A. Sustainable Water Supply and Demand Management in Semi-arid Regions: Optimizing Water Resources Allocation Based on RCPs Scenarios. Water Resour. Manag. 2021, 35, 5307–5324. [Google Scholar]
  16. Wu, P.; Jin, J.; Zhao, X. Impact of climate change and irrigation technology advancement on agricultural water use in China. Clim. Change 2010, 100, 797–805. [Google Scholar] [CrossRef]
  17. Lu, Y.; Cai, H.; Jiang, T.; Sun, S.; Wang, Y.; Zhao, J.; Yu, X.; Sun, J. Assessment of global drought propensity and its impacts on agricultural water use in future climate scenarios. Agric. For. Meteorol. 2019, 278, 107623. [Google Scholar] [CrossRef]
  18. Sun, S.; Zhou, T.; Wu, P.; Wang, Y.; Zhao, X.; Yin, Y. Impacts of future climate and agricultural land-use changes on regional agricultural water use in a large irrigation district of northwest China. Land Degrad. Dev. 2019, 30, 1158–1171. [Google Scholar] [CrossRef]
  19. Lopes, T.R.; Zolin, C.A.; Mingoti, R.; Vendrusculo, L.G.; Almeida, F.T.d.; Souza, A.P.d.; Oliveira, R.F.d.; Paulino, J.; Uliana, E.M. Hydrological regime, water availability and land use/land cover change impact on the water balance in a large agriculture basin in the Southern Brazilian Amazon. J. S. Am. Earth Sci. 2021, 108, 103224. [Google Scholar] [CrossRef]
  20. Tang, Y.H.; Luan, X.B.; Sun, J.X.; Zhao, J.F.; Yin, Y.L.; Wang, Y.B.; Sun, S.K. Impact assessment of climate change and human activities on GHG emissions and agricultural water use. Agric. For. Meteorol. 2021, 296, 108218. [Google Scholar] [CrossRef]
  21. Lai, J.; Li, Y.; Chen, J.; Niu, G.-Y.; Lin, P.; Li, Q.; Wang, L.; Han, J.; Luo, Z.; Sun, Y. Massive crop expansion threatens agriculture and water sustainability in northwestern China. Environ. Res. Lett. 2022, 17, 034003. [Google Scholar] [CrossRef]
  22. Srivastav, A.L.; Dhyani, R.; Ranjan, M.; Madhav, S.; Sillanpaa, M. Climate-resilient strategies for sustainable management of water resources and agriculture. Environ. Sci. Pollut. Res. 2021, 28, 41576–41595. [Google Scholar] [CrossRef]
  23. Stefanidis, S. Ability of Different Spatial Resolution Regional Climate Model to Simulate Air Temperature in a Forest Ecosystem of Central Greece. J. Environ. Prot. Ecol. 2021, 22, 1488–1495. [Google Scholar]
  24. Meng, J.; Yao, X.; Yang, X.; Luo, J.; Shen, Y. Spatial and temporal evolution of agricultural planting structure and crop water consumption in groundwater overdraft area. Trans. CSAM 2020, 51, 302–312. [Google Scholar]
  25. Sun, S.K.; Wu, P.T.; Wang, Y.B.; Zhao, X.N. Impact of changing cropping pattern on the regional agricultural water productivity. J. Agric. Sci. 2014, 153, 767–778. [Google Scholar] [CrossRef]
  26. Du, M.; Li, L.; Luo, G.; Dong, K.; Shi, Q. Effects of climate and land use change on agricultural water consumption in Yutian Oasis. Bull. Soil Water Conserv. 2020, 40, 2, 103–109. [Google Scholar]
  27. Yang, F.; Wang, X. Impact of irrigation water price and technological progress on agricultural water intensity-an empirical study based on three major staple foods. Agric. Mod. Res. 2021, 42, 735–744. [Google Scholar]
  28. Castellini, M.; Di Prima, S.; Stewart, R.; Biddoccu, M.; Rahmati, M.; Alagna, V. Advances in Ecohydrology for Water Resources Optimization in Arid and Semi-Arid Areas. Water 2022, 14, 1830. [Google Scholar] [CrossRef]
  29. Ke, Y.; Sheng, Z.; Bai, J.; Li, J.; Chang, C.; Xu, Z. Suitable scale of arable land in the Weigan River Basin under the constraints of water resources. Arid Zone Res. 2020, 37, 551–561. [Google Scholar]
  30. Cheng, D.; Yang, D.; Tang, H.; Zhang, Y.; Xia, W. Agricultural water consumption intensity and effecting factors in Ogan River Basin. Arid Land Geogr. 2014, 37, 509–519. [Google Scholar]
  31. Allen, R.; Pereira, L.S.; Raes, D.; Smith, M. Crop evapotranspiration: Guidelines for computing crop water requirements. Food Agri. Org. United Nations Irrig. Drain 1998, 56, 300. [Google Scholar]
  32. Wu, S.; Zhao, W.; Yao, J.; Jin, J.; Zhang, M.; Jiang, G. Precipitation variations in the Tai Lake Basin from 1971 to 2018 based on innovative trend analysis. Ecol. Indic. 2022, 139, 108868. [Google Scholar] [CrossRef]
  33. Yang, W.; Jiang, X. Evaluating the influence of land use and land cover change on fine particulate matter. Sci. Rep. 2021, 11, 17612. [Google Scholar] [CrossRef]
  34. Zheng, H.; Zhang, L.; Zhu, R.; Liu, C.; Sato, Y.; Fukushima, Y. Responses of streamflow to climate and land surface change in the headwaters of the Yellow River Basin. Water Resour. Res. 2009, 45, 7. [Google Scholar] [CrossRef]
  35. Li, X. Key scientific issues for green water research in the watershed. Adv. Earth. Sci. 2008, 23, 707–712. [Google Scholar]
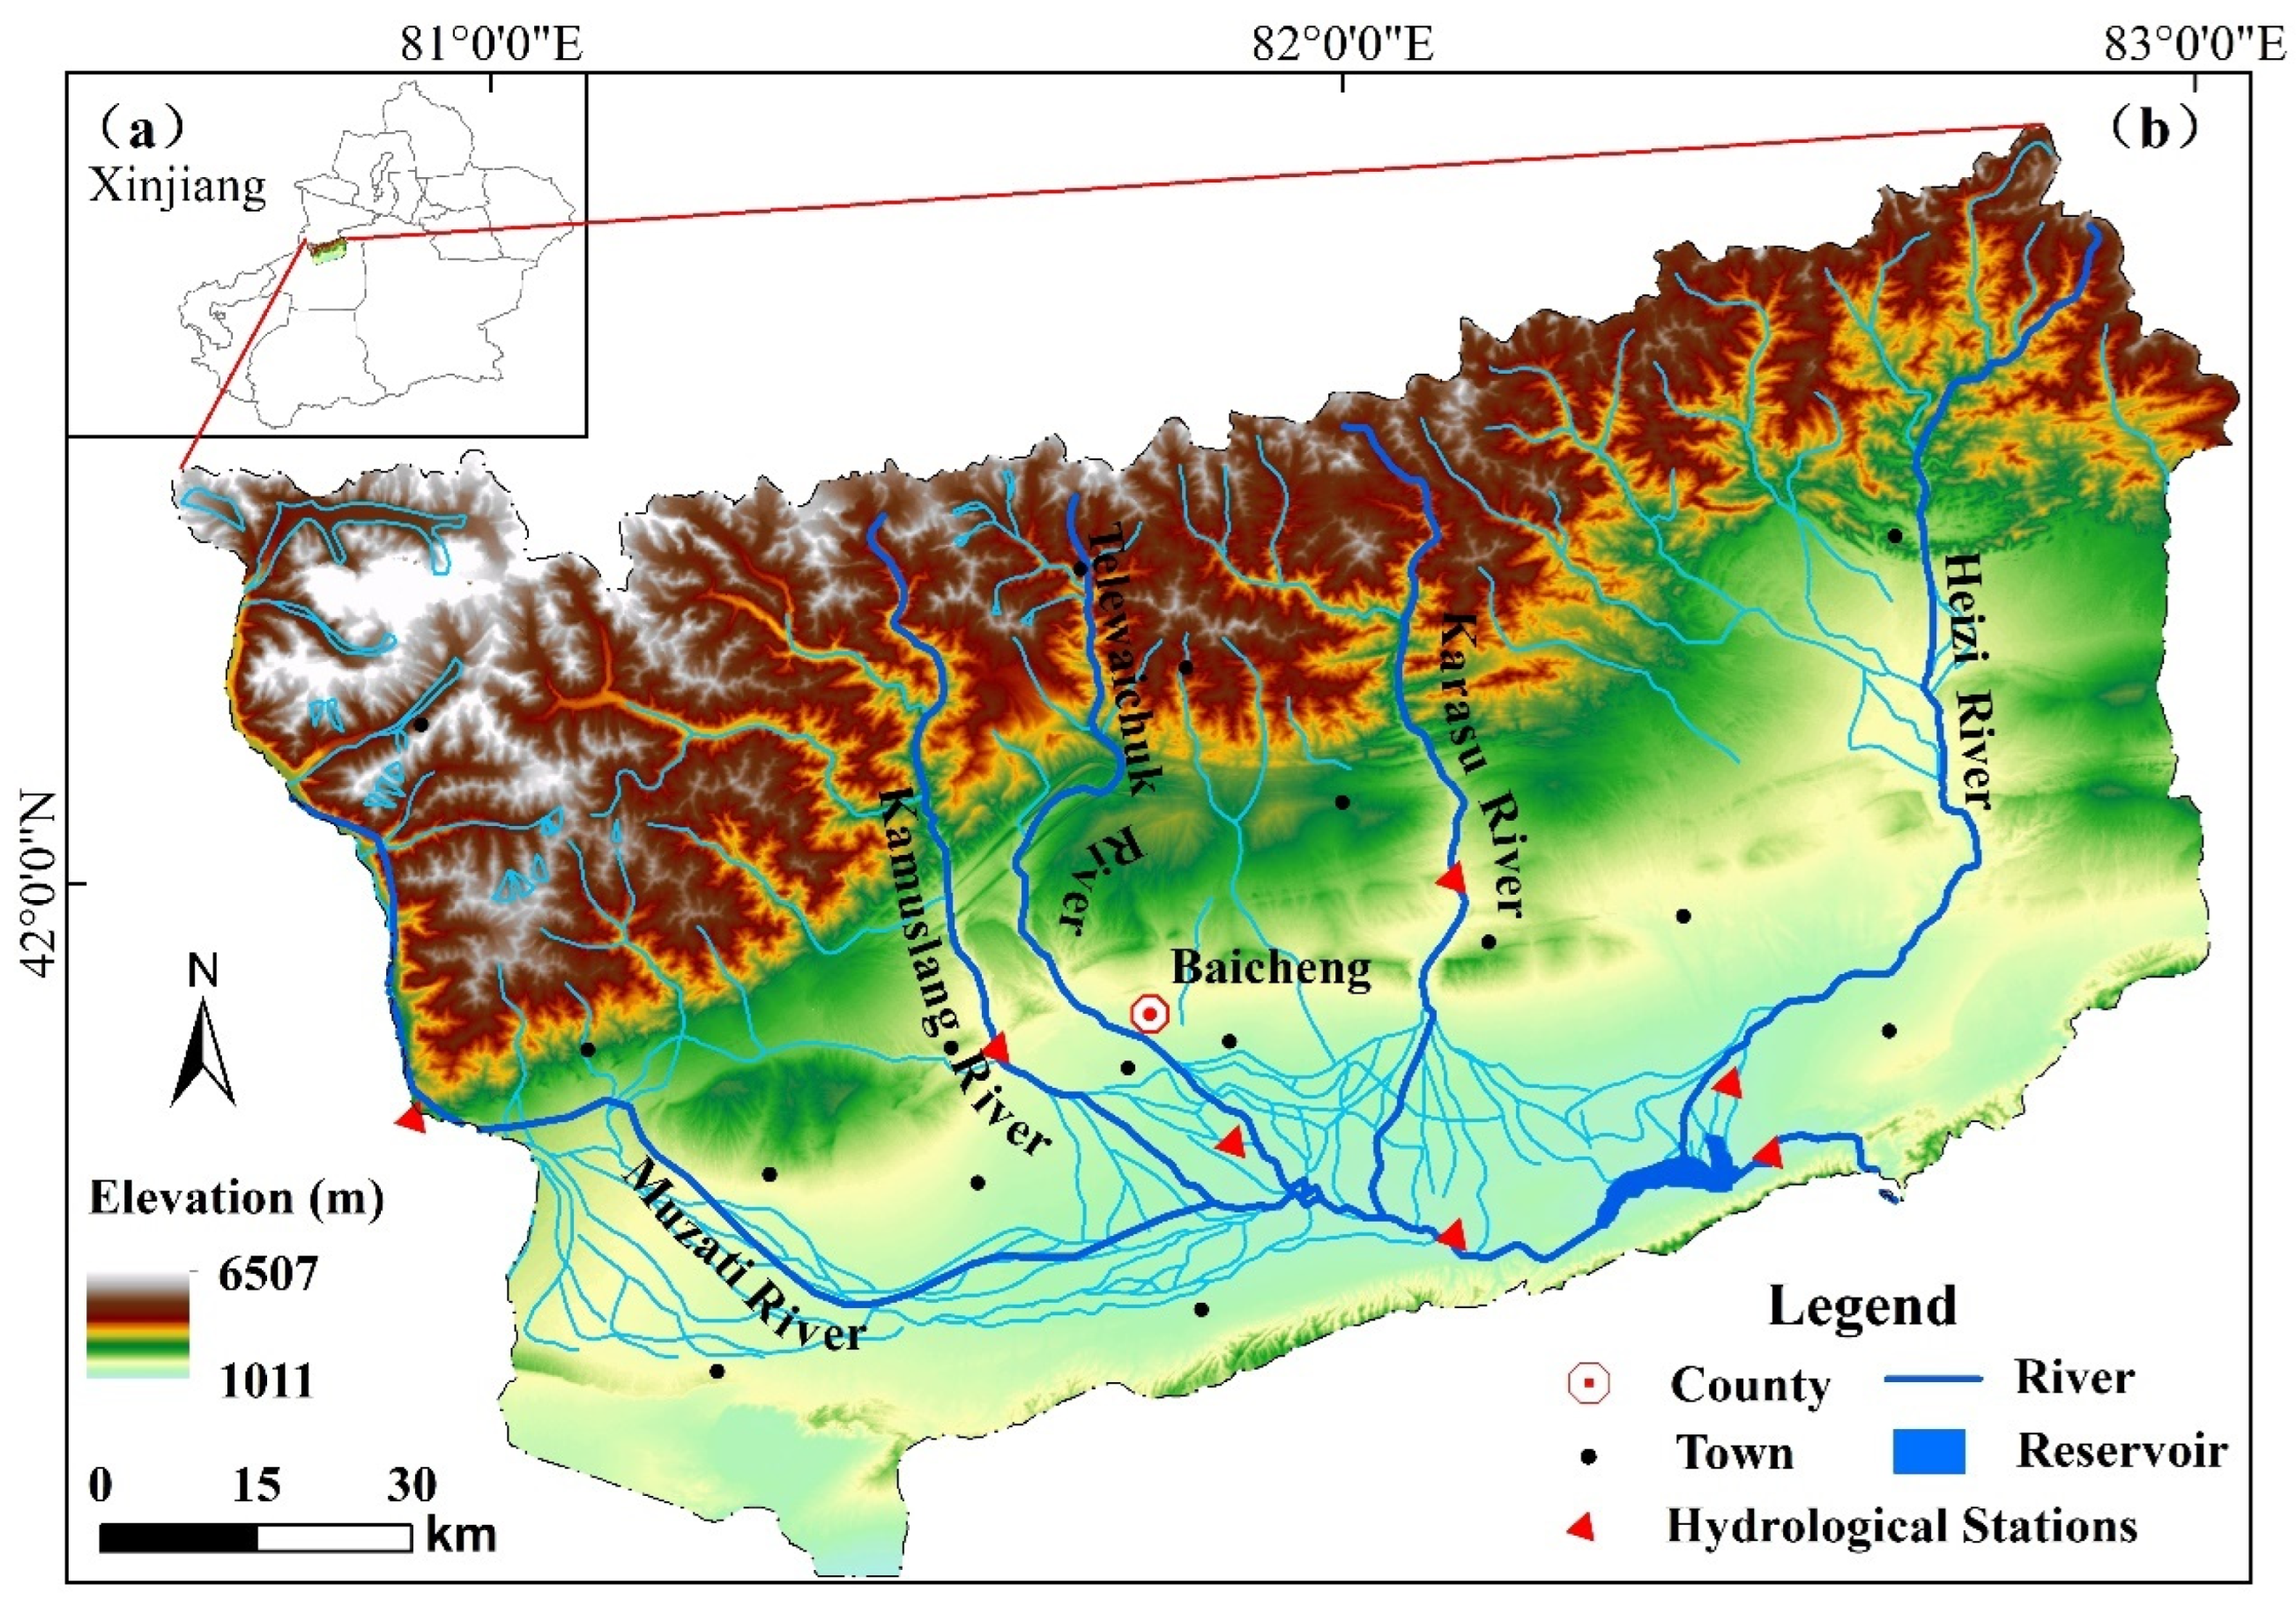
Figure 1. (a) Location of the study area, and (b) the spatial distribution of rivers in Baicheng basin.
Sustainability 14 13746 g001
Figure 2. Annual change in the green water consumption of the main crops in the Baicheng oasis.
Sustainability 14 13746 g002
Figure 3. Change trend of the main crop planting area (a) and the change trend of total green water consumption from 2002 to 2019 (b).
Sustainability 14 13746 g003
Figure 4. Annual change curve of the main meteorological elements in the Baicheng oasis from 1990 to 2020. (a) Average annual temperature. (b) Average annual precipitation. (c) Annual sunshineduration. (d) Annual average wind speed.
Sustainability 14 13746 g004
Figure 5. Land use maps of the study area for (a) 1990, (b) 2000, (c) 2010, and (d) 2020.
Sustainability 14 13746 g005
Figure 6. Spatial–temporal change distribution of land use types. (A) 1990–2000. (B) 2000–2010. (C) 2010–2020.
Sustainability 14 13746 g006
Table 1. Interdecadal changes in climatic factors in the Baicheng oasis.
YearAnnual Mean Temperature (°C)Annual Precipitation (mm)Annual Sunshine Duration (h)Annual Mean Wind Speed (m s−1)
1991–20008.26138.9931130.51
2001–20108.53146.6928900.77
2011–20208.81127.3029410.93
Table 2. Land use type area statistics for 1990, 2000, 2010, and 2020.
Land Use
Type
Area (km2)Percentage (%)Area of Change (km2)
199020002010202019902000201020201990–20002000–20102010–2020
Cultivated land1024.371068.641233.451273.506.456.737.778.03+44.27+164.81+40.05
Forest land638.05638.46441.95416.514.024.022.792.62+0.41−196.51-25.44
Grassland6112.346073.636042.916057.7938.5138.2638.0838.18−38.71−30.72+14.88
Water area1126.531135.16758.00732.957.107.154.784.62+8.63−377.16−25.05
Urban and rural residential land43.2447.5574.1111.950.270.300.470.71+4.31+26.55+37.85
Unused land6926.536909.857316.967274.6843.6443.5346.1145.85−16.68+407.11−42.28
Table 3. Land use transition matrix for 1990–2000, 2000–2010, and 2010–2020 in the study area (area unit: km2).
YearLand Use TypeGrasslandUrban and Rural Residential LandCultivated LandForest LandWater AreaUnused Land
1990–2000Grassland6021.790.4729.770.192.1319.48
Urban and rural residential land0.6539.026.350.000.001.53
Cultivated land63.643.67977.640.012.1521.55
Forest land0.330.000.17637.840.000.11
Water area17.880.054.610.001107.575.28
Unused land8.050.025.830.0014.786878.58
2000–2010Grassland3936.952.3256.22395.6152.271599.71
Urban and rural residential land9.4214.6139.340.050.739.96
Cultivated land198.9927.22869.594.3712.83120.49
Forest land180.691.9135.67217.280.645.77
Water area124.900.8823.814.2493.83110.91
Unused land1622.690.6144.0116.95574.875060.01
2010–2020Grassland5959.080.3211.3846.7624.8615.38
Urban and rural residential land10.0269.5411.740.690.1419.82
Cultivated land32.573.851199.092.122.7333.14
Forest land21.750.122.26392.150.130.10
Water area3.970.102.870.13714.0411.84
Unused land15.500.166.110.1116.127236.68
Table 4. The sensitivity coefficient of AWC to different influencing factors.
Climate Impact FactorAnnual Mean Temperature (°C)Annual Precipitation (mm)Annual Sunshine Duration (h)Annual Mean Wind Speed (m s−1)
Sensitivity factor1.56−0.12−0.060.60
Publisher’s Note: MDPI stays neutral with regard to jurisdictional claims in published maps and institutional affiliations.