Abstract
In this paper, the use of geotechnical centrifuge and numerical modeling techniques to investigate the influence of geogrid reinforcement and EPS interlayer on the lateral earth pressure and the backfill surface settlements behind gravity abutment and pile-supported abutment is reported. According to the principle of equal strain, the abutment back structure, foundation, backfill material, grid and interlayer material were simulated, and the centrifugal model test for two types of abutments was carried out with a model scale of n = 62.5, 40, respectively. The tests showed that the reinforcement of the geogrid could reduce the surface settlement of backfill and the lateral earth pressure of the backfill on the back of abutment. After setting the EPS interlayer, the influence of abutment displacement on earth pressure could be eliminated, and the earth pressure of the backfill material on the abutment back was significantly reduced. The “interlayer + geogrid” structure further reduced the earth pressure of backfill material on the abutment back. The existence of the EPS interlayer adjusted the strain distribution of the reinforced material, significantly increasing the strain of the reinforced material near the abutment, which was conducive to the reinforcement effect. The above research conclusions could provide a basis for the design and practical application of abutment backfill materials.
1. Introduction
With the rapid increase in infrastructure, such as highways and railways, bridges have been increasingly used. Problems associated with bridges are gaining more attention worldwide, one of which is “the bump at the end of the bridge” [1,2,3,4]. Bumps result from differential settlement at the interface between abutments and backfills, mainly due to the different rigidity of foundations. In addition, climatic conditions, including temperature changes and heavy rainfall, may also cause bumps [5]. The seasonal temperature change generates expansion and contraction on bridge girders, which induces soil movement in the backfill behind the abutments. When the abutment moves away from the backfill, typical backfill (especially cohesionless soil) cannot maintain its own stability without support from the integral abutment. As a result, the backfill material slumps downward and is laterally compressed in the bottom layers, increasing the surface settlement and lateral earth pressures of the backfill when the abutment moves toward the backfill during the following summer. This situation becomes progressively worse over time and causes two widespread problems associated with bridge abutments, i.e., excessive backfill surface settlement and high lateral earth pressures behind the abutment, which can cause abutment movement and bridge-head jumping, and we need to take measures to solve these two problems.
In order to solve this problem, in addition to the foundation treatment, it is particularly important to select the appropriate backfill material and take appropriate structural measures. In recent years, placement of geosynthetics within the backfill has become an important technology to solve the two abovementioned widespread problems. Geosynthetics widely used in abutment backfill mainly include geogrid, geocell, geotextile, etc. Geosynthetic reinforcement exerts its tensile strength, improves the lateral modulus of soil, forms soil arch effects between each layer of reinforced material and restrains the lateral deformation of soil by the friction between reinforcement and soil, so as to improve the bearing capacity and shear strength of soil, and reduce the horizontal lateral pressure of soil. Especially for geogrids, the mutual friction between the geogrid and the soil and the special interlocking effects of the geogrid mesh limit the lateral deformation of the upper and lower soil, improve the shear strength of the reinforced soil, and enhance the stability of the soil [6,7]. Jelušič, P. and Žlender, B. [8] carried out field tests on geosynthetic reinforced soil abutments on soft soil foundations. The test results showed that more than 50% of the total strain in the geogrid was generated during the construction of the abutment, which fully exerted the reinforcement effect of the geogrid and reduced the surface settlement of backfill. According to the analysis of construction costs, the cost of traditional reinforced concrete abutment may be five times that of optimized reinforced soil abutment. Won, M. S. and Langcuyan, C. P. [9] presented the effects of geosynthetic reinforced soil (GRS) in the bridge abutment with full height rigid (FHR) facing and the effects of geosynthetic reinforcement length on the deformation behavior of the GRS–IB (integral bridge). The results showed that the GRS–IB model exhibited the least lateral displacements at the wall face compared to those of the IB model without geosynthetic reinforcement, and the effect of the reinforcement length on the wall vertical displacements was minimal compared to the effect on the wall lateral displacements. In addition, the application of geocell in abutment backfill also has a good effect. The friction between the geocell and the backfill causes the stress of the soil around the geocell to be redistributed, and the strength and modulus of the soil were enhanced during the remodeling of the soil. Zadehmohamad, M. and Bazaz, J. B. [10] studied the reinforcement effect of geocell backfill soil on the integral abutment. The test results showed that the geocell reinforced soil significantly reduced the peak lateral soil coefficient (K peak) of the soil behind the abutment. Changizi et al. [11] evaluated the effect of geocell as reinforcement on the bearing capacity of the backfill soil, the footing settlement and the horizontal displacement of the wall facing of the GRS abutment wall through a physical modeling test. The experimental results showed that the increase in the equivalent circular area diameter of the geocell pocket led to an increase in the horizontal displacement of the wall and a decrease in the bearing capacity of the GRS abutment. A conclusion can be drawn from the above research results, the frictional resistance between the geosynthetics reinforcement and the soil restricts the lateral deformation of the soil and reduces the pressure of the soil on the wall. At the same time, due to the role of the reinforcement, the wall panel and the soil into a whole, thereby increasing the friction between the wall back and the soil, resulting in a corresponding reduction in soil lateral pressure coefficient.
It is important to study the reinforcement mechanism of geosynthetics to study the change in tensile stress of reinforcements at different burial depths. Yang et al. [12] carried out field tests on the integral panel geogrid reinforced earth retaining wall and tested the deformation of the tensile reinforcement at different burial depths. The test results showed that the strain of each layer of the reinforced soil retaining wall increased with the increase in the thickness of the overlying filling. The strain of the upper reinforcement of the wall showed a single peak distribution along the reinforcement length. The maximum strain was far away from the panel at the top of the wall and gradually approached the panel downward. The tensile strain at the lower part of the wall was bimodal in distribution. Sun et al. [13] measured the strain of a geogrid-reinforced retaining wall with different filling heights. The test results showed that with the increase of filling thickness, the strain of the geogrid increased, but the increasing rate decreased gradually. When the filling thickness changed, the distribution law of each layer of reinforcement strain along the long direction of the reinforcement remained roughly unchanged. Zhao et al. [14] analyzed the distribution law of strain in the reinforced geogrid through field tests. The test results showed that the strain of reinforcement increased with the increase of the thickness of upper filling, but the increasing rate gradually decreased, and the strain of the geogrid was nonlinearly distributed. It can be concluded from the above test results that the strain of the reinforcement increased with the increase of the buried depth of the geogrid from the top of the wall, but the increase rate gradually decreased.
In the past several years, some researchers have used EPS (expanded polystyrene) and geosynthetics to treat the filling behind the abutment and have achieved good results. Rollins et al. [15] conducted large-scale passive force tests with and without EPS geofoam inclusion acting as a barrier between the backfill soil and a simulated bridge abutment. The presence of the geofoam inclusion reduced the passive force by 70% relative to the sand backfill alone, and the test results also suggested that the geofoam acted to reduce the interface friction between the wall and the backfill sand, thereby reducing the passive resistance. Ge Z. S. and Huang X. M. [16] studied the influence of the thickness of EPS plate on the mechanical behavior of abutment-pile foundation–soil interaction. The test results showed that the EPS plate could effectively reduce the lateral pressure of the backfill on the abutment back of the abutment, and the maximum could be reduced by 31%. At the same time, it can also reduce the lateral deformation of the fill, which gradually decreases with the increase in EPS thickness. Liu et al. [5] carried out earth pressure and deformation tests after placing a geogrid in the abutment backfill soil and foamed polystyrene (EPS) behind the abutment. The test results showed that geogrid reinforcement produced higher maximum lateral earth pressure under the same abutment displacement, but the use of a geogrid significantly reduced the settlement within the fill. The combination of EPS foam and a geogrid can minimize the increase in lateral earth pressure and backfill settlement. In order to study the effect of the combination of foamed polystyrene (EPS) blocks and geogrids, Kyokawa et al. [17] conducted a series of 1 g shaking table tests on the reduced scale model of cantilever abutment and backfill soil. The experimental results showed that the foundation sliding and inclination of the wall can be further reduced by replacing part of the backfill with EPS blocks and combining it with the use of a geogrid. In addition, the combination of EPS and a geogrid could reduce the relative settlement between the backfill soil and the wall interface. These research results provide technical support for the reinforcement backfill treatment engineering practice. Fiorentino et al. [18] experimentally investigated the potential benefits of adding compressible inclusions (CIs) between the abutment and the backfill and explored the influence of different types of connection between the abutment and the pile foundation. Results indicate that the CI reduces the acceleration on the bridge deck and the settlements in the backfill. The above research results show that embedding the EPS plate behind the abutment can effectively reduce the lateral displacement of the fill behind the abutment.
Although the full-scale model test has some applications in engineering, it is difficult to obtain the ideal mechanical response of the whole process due to the high cost and the limitation of boundary conditions, and the research results are relatively few. The centrifugal model test has made many achievements, but there are still problems that need to be studied further. The centrifugal geotechnical model test involves placing the model in a special centrifuge and using a 1/n scale model to test in the ng centrifugal acceleration field [19,20,21,22,23], which implies that a 1/n scale model would behave like its full-scale prototype if subjected to a centrifugal acceleration of n times g. Since the inertial force was absolutely equivalent to gravity and the high acceleration does not change the properties of engineering materials, the stress and strain of the model and the prototype were equal, the deformation was similar, and the failure mechanism was the same, which could reproduce the prototype characteristics. In theory, the geotechnical centrifuge model test was the only physical model test method that could fully meet the model similarity law in the geotechnical field. Among the various studies reported in the field of geotechnical centrifuge model testing in the past, the studies on retaining walls, embankments and reinforced retaining walls or embankments are relatively abundant, while the studies directly on the backfill of highway abutments were fewer.
Most previous investigation methods of geosynthetics and EPS in abutment backfill have focused on full-scale model tests and shaking table tests; however, very few have dealt with the centrifuge model test and numerical analyses. By combining numerical analyses with the centrifugal model test results, the validity of the centrifugal model test results can be verified, and the reliability of the numerical method can be verified. In this paper, nine physical model tests were conducted in this study to evaluate the benefits of geogrids and the EPS interlayer to mitigate the lateral earth pressures behind the abutment and backfill surface settlement, and the numerical analysis was carried out to verify the validity of the centrifugal model test results. The research results can provide a basis for the design and practical application of EPS and geogrid reinforced abutment back backfill materials.
2. Centrifugal Model Test Design
2.1. Testing Instrument
The test was carried out on a 50 g·t large geotechnical centrifuge of the Nanjing Institute of Water Resources. Figure 1 showed the main components of the centrifugal model testing machine used in the test. The beam centrifuge had a maximum radius of 2.25 m and was capable of generating a maximum acceleration of up to 250 g at a load capacity of 200 kg. The SCR (silicon-controlled rectifier) electrodeless speed control mode, which refers to the control mode for rotary loading of centrifuges, was adopted, and the advanced closed-circuit monitoring system and data acquisition system were assembled. The model was placed inside a box made of aluminum plates of 15 mm thickness with inner dimensions of 685 × 450 × 200 mm (width × depth × height), and the side was loaded and unloaded with organic glass, which was the monitoring window of the model in the experiment. Subgrade surface settlement was measured by a high-precision laser sensor. The sensor was manufactured by the German WENGLOR company, its measurement range was 0~50 mm, its reaction time was 5 ms, and its measurement resolution was better than 20 μm.
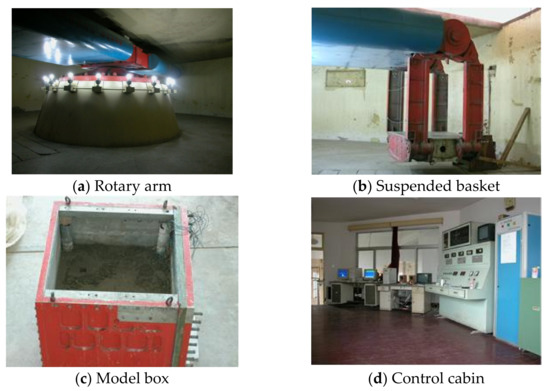
Figure 1.
Centrifugal model testing machine used in the test.
2.2. Model Layout and Preparation
2.2.1. Model Layout
The geometric scale of the gravity abutment model was 1/62.5, and the model height was 320 mm, which was equivalent to the gravity abutment of the prototype at 20 m high. The layout of soil and displacement sensors in each part of the model is detailed in Figure 2. Different from gravity abutment backfill, the foundation of pile-supported abutment backfill was a soft soil layer, and the height of the abutment back was small. The scale of the test model was determined to be 1/40 and the model layout is shown in Figure 3. The thickness of the backfill soil layer of the prototype was 6 m, and the thickness of the soft soil layer was 9.5 m.
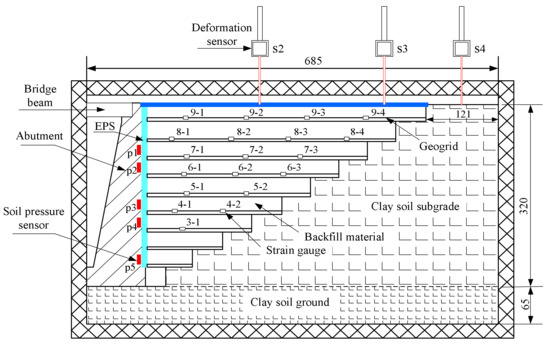
Figure 2.
Layout of model test for study on backfill characteristics of gravity abutment (unit: mm).
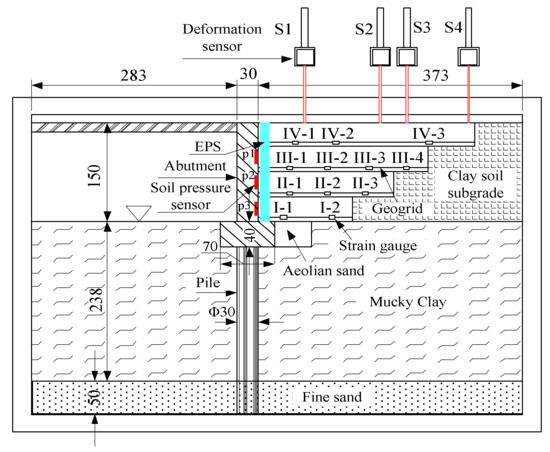
Figure 3.
Layout of backfill model for the pile-bearing platform.
2.2.2. Test Plan
The centrifugal model test was conducted to investigate the effects of geogrid reinforcement and the deformation-prone EPS interlayer between the abutment and the backfill on the surface settlement of the backfill and the lateral earth pressure behind the abutment. Because the test project site was rich in aeolian sand, considering the economy of the project, the actual project was more inclined to use aeolian sand as the abutment back backfill, and the clay was used for test comparison. Therefore, in the test design, the EPS interlayer was not set between the abutment and the clay backfill material. The relevant test content is shown in Table 1, including two abutment structures and two types of backfill.

Table 1.
Centrifugal model test design.
2.2.3. Model Preparation
Each model needed to prepare three parts of soil: foundation soil, adjacent subgrade soil and backfill, including a geogrid placed within it and an EPS plate with a thickness of 10 mm between the abutment and the backfill. The production process and control indicators are described as follows:
- Production procedures and control indicators of layered compaction and vibration molding:
- Preparation of soil materials. The same dry density as in triaxial and compression tests was used to configure soil. Since the compaction work of the mold was less than that of the modified Proctor test, the corresponding optimal moisture content was larger than that obtained by the modified Proctor test, so the moisture content of the prepared soil was controlled to be slightly higher than that obtained by the modified Proctor test, and the soil sample was easy to prepare.
- Forming by the layered compaction method. According to the specified compactness and moisture content, the wet density of mold making was calculated, and the wet soil mass required for each layer was calculated. For subgrade and adjacent subgrade, the filling layer thickness was 55 mm; for the backfill area, the filling layer thickness was 32 mm.
- Soil forming of adjacent subgrade. After the adjacent subgrade soil was prepared as a whole, it was cut into steps and the backfill area was left.
- Curing of backfill materials. Lime soil and ceramsite fly ash concrete were tested after curing for 7 days.
- 2.
- Production procedure and control index of the consolidation method:
- Soil material configuration. For the soil layer of the muddy soft soil foundation, it was prepared by the consolidation method. After the soil was air dried, it was crushed and sieved (1 mm), and mixed with water to form a slurry.
- Consolidation by applying pressure step by step. For the foundation samples in the pile-supported abutment model, the graded consolidation loads were 5 kPa, 10 kPa, 20 kPa, 30 kPa, 40 kPa, 80 kPa, 120 kPa, and finally the homogeneous foundation soil with an undrained strength of 17 kPa was formed.
- 3.
- Single-hole funnel sand rain method with equal drop height:
The aeolian sand backfill material was prepared by the single-hole funnel rain sand method with an equal drop height, and the drop height was controlled at 1.00 m. The dry density of the sand sample was 1.70 g/cm3, and the relative density Dr = 0.62.
- 4.
- Embedding of geogrids:
Because the selected backfill material was clay and aeolian sand, and the particle size was small, according to the existing research results, an 8 mm × 8 mm pre-tensioned geogrid was selected to simulate the prototype geogrid, the tensile strength was Tm = 1.0 kN/m, and the initial tensile modulus was Ei,m = 7.0 kN/m. The burial of the pre-stretched geogrid and the layering of the soil in the backfill area were carried out simultaneously, and buried and paved in layers according to the specified depth.
- 5.
- Embedding of EPS interlayer
In the model test, an EPS plate with a density of 14 kg/m3 was used as interlayer material between abutment back and backfill material. Before the backfill soil was filled, EPS plate was placed between the wall back and backfill material.
3. Numerical Simulation of Abutment Backfill
Centrifugal model tests were carried out according to gravity abutment structure and clay backfill, gravity abutment structure and aeolian sand backfill, and pile-supported abutment structure and aeolian sand backfill to discuss the influence of geogrid reinforcement and EPS interlayer on settlement, earth pressure and strain. The numerical analysis software ABAQUS was used to establish a numerical analysis model similar to the geometric size of the centrifugal model, and the numerical simulation results were used to verify the results of the centrifugal model test. The steps of numerical simulation were divided into geometric modeling (Part), meshing (Mesh), material property setting (Property), assembly, defining analysis (Step), interaction (Interaction), applying boundary conditions and loads (Load), submitting operations (Job) and post-processing (Visualization). Since the abutment was a typical plane strain problem, the plane strain model was used in the modeling calculation. The type of finite element used in the numerical simulation was a mechanical element, and the soil element mesh was divided by the high-order plane strain 8-node shear contraction integral element CPE8R the plane strain 8-node shear-shrinkage integral hybrid element CPE8RH was used for the grid division of the abutment structure and soil foundation element, and Geostatic step was used in the ABAQUS finite element calculation to judge the balance of the initial state of the foundation. In the process of numerical simulation, the interaction between structure, geogrid and fill was often described by a contact surface model, and ABAQUS used “Contact Pair” to simulate the contact between the surface and the surface. It could consider the extrusion, shear and displacement in the corresponding direction when the surface interacted with the surface, and could also simulate the separation between the surface and the surface. Moreover, ABAQUS surface-to-surface contact was based on the Coulomb friction theory, and the friction coefficient μ was used to represent the friction behavior between the contact surfaces. When the contact shear stress was equal to or greater than the ultimate friction μp, sliding occurred between the contact surfaces. Because it was difficult to simulate the ideal friction behavior, ABAQUS used the “elastic sliding” penalty friction formula to approximate it, and ABAQUS automatically selected the penalty stiffness (dashed slope). In short, the contact algorithm of ABAQUS was based on the Newton–Raphson iteration technique, and ABAQUS checked the state of all contact pairs before each increment started to determine whether the slave node was disconnected or closed, then ABAQUS iterated and calculated the correction to change the configuration of the model until the iteration result satisfied the convergence condition.
3.1. Geometric Model
The prototype model of back filling in the centrifugal model test was simulated. The size, boundary conditions and materials of the geometric model were completely the same as those of the prototype model in the centrifugal model test.
3.1.1. Calculation Model of Gravity Abutment Backfill
The gravity abutment was calculated by the plane strain model shown in Figure 4. The abutment was simplified as a rigid structure without deformation. The plane size of the model was: the height of the abutment and embankment was 20 m; the thickness of the foundation soil was 4.06 m; the range of backfill area was 2 m in the bottom and 29 m at the top along the route; the top length of the adjacent embankment was 7.56 m. The constraint conditions were: x, y direction constraint of the foundation bottom; the left and right sides of the foundation, x direction constraint; the right side of the embankment was x direction constraint; and the x direction constraint of the abutment. Consider the contact between the right side and the bottom of the abutment and backfill material and foundation. The foundation material of the gravity abutment was clay with 85% compactness; the adjacent embankment material was 90% compacted clay; and the backfill materials included: 85% compacted clay and aeolian sand. The treatment measures were: geogrid reinforcement and EPS interlayer.
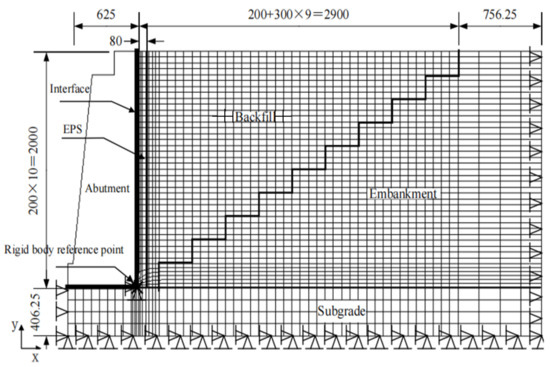
Figure 4.
Numerical calculation model of gravity abutment backfill (unit: cm).
3.1.2. Calculation Model of Pile-Supported Abutment
Figure 5 is a schematic view of the pile-supported abutment which was calculated by the two-dimensional model. Figure 5 also showed the material and size of the model. The main dimensions of the model were: the height of the abutment and embankment was 6 m; the length of the bottom of the backfill area along the route was 2 m, and the length of the top was 11.88 m; the length of the embankment top was 3.04 m; the thickness of silt soft soil was 9.52 m and the thickness of the fine sand layer was 2 m. The constraint conditions were: the left and right sides of the foundation were y direction constraints; the front and rear sides of the foundation were constrained in x direction; the bottom surface of the foundation was constrained in x and y directions; the right side of the embankment was the constraint in the y direction; the front side of backfill material and embankment was constrained in x direction; the x and y direction constraints of the abutment. The contact conditions were: the contact between the right side of the abutment and the backfill material, the contact between the side and bottom of the abutment and the foundation, and the contact between the pile body and the foundation. The materials of each part of the model were as follows: the foundation material was muddy soft soil and fine sand, and the undrained strength of soft soil was 17 kPa; the embankment material was 90% compacted clay; backfill materials included: 85% compacted clay and aeolian sand. The treatment measures were: geogrid reinforcement and EPS interlayer.
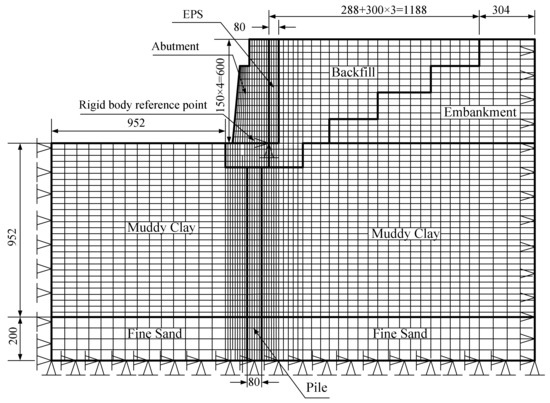
Figure 5.
Numerical calculation model of pile-supported abutment on soft foundation (unit: cm).
3.1.3. Loading Duration
Figure 6 showed the loading duration curve of the model, which was basically consistent with the construction progress of the project supported by this study. The filling time of embankment and backfill materials was 3 months, and the maximum preloading time was 8 months. In the actual calculation, ABAQUS automatically adjusted the consolidation time according to the stability of pore water pressure change; that is, when the dissipation value of pore water pressure in each increment step was less than 0.005 kPa, the consolidation calculation was completed.
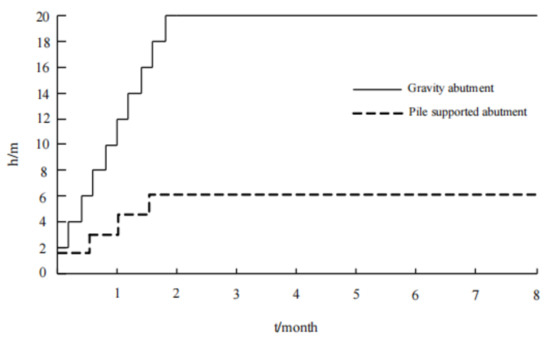
Figure 6.
Loading duration curve.
3.1.4. Selection of Calculation Parameters and Material Constitutive Relation
In the calculation process, the pile was regarded as an isotropic linear elastic material, and the pile element built into the software was used to simulate it. In order to simulate the interaction between the concrete structure and the subgrade filling and the foundation soil in the transition section, the interface unit was set up between the back and back filling of the platform and the cap and the foundation soil. In order to better simulate the constitutive relationship of soil, the Drucker–Prager ideal elastic-plastic model was used to simulate the foundation soil. Material parameters were obtained by laboratory tests, and the relevant parameters of foundation soil and subgrade filling are shown in Table 2.
Table 2.
Main parameters of material constitutive relation.
4. Analysis of Centrifugal Model Test Results and Simulation Results
According to the given test conditions in Table 1, the finite element simulation analysis was carried out by using ABAQUS large-scale calculation software. The numerical results were compared with the measured values, and the rationality and effectiveness of the calculation model were verified.
4.1. Application of Geogrid in Clay Backfill of Gravity Abutment Structure
The compactness of the two groups of models, GA1st and GA2nd, of the gravity abutment structure clay backfill was very close. The former backfill had nine layers of geogrid, and the latter was plain soil backfill. The surface settlement distribution of backfill is shown in Figure 7.
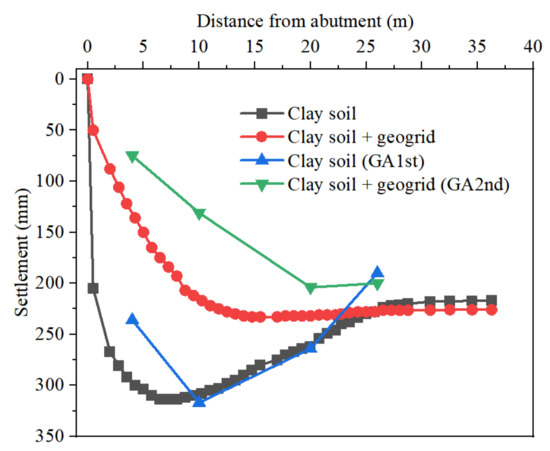
Figure 7.
Influence of geogrid on settlement distribution of backfill surface.
As can be seen from Figure 7, the surface settlement of backfill with nine layers of geogrid was obviously less than that of unreinforced clay backfill. After reinforcement, the average settlement of the clay backfill surface was 15.39 cm, which was 61.31% of that before reinforcement and decreased by 38.69%. In addition, it could also be found from Figure 7 that the distribution characteristics of the two kinds of surface settlement were also significantly different. The surface settlement of GA1st backfill was a saddle-shaped distribution, and the maximum settlement position was s2 (see Figure 2). The surface settlement of the model GA2nd backfill presented a funnel-shaped distribution, and the maximum settlement position was the s3 measuring point, and the settlement value of the s3 measuring point was almost the same as that of s4.
In short, the reinforcement effect of the geotechnical grid adjusted and improved the settlement distribution of the backfill surface. In terms of this test, the maximum inclinations of the pavement, which equaled the differential settlement of the backfill surface divided by the length of the bridgehead approach slab without and with geogrid, were 2.7% and 0.9%, respectively, which indicated that the effect of geogrid reinforced clay on vehicle bump at the bridgehead was quite remarkable.
4.2. Application of Geogrid + EPS Interlayer in Aeolian Sand Backfill of Gravity Abutment Structure
The backfill materials of the gravity abutment models, GA3rd, GA4th, GA5th and GA6th, were all aeolian sand. The density of backfill is basically the same, and the treatment measures were different. The model GA3rd had no treatment measures, and the model GA4th adopted grid reinforcement; the model GA5th contained an EPS interlayer, and the model GA6th contained an EPS interlayer and adopted geogrid reinforcement, as shown in Table 1.
4.2.1. Comparative Analysis of Surface Settlement of Backfill
Figure 8 shows the distribution curve of backfill surface settlement corresponding to different treatment measures. Table 3 shows the numerical results and test results of the mean surface settlement of backfill corresponding to different treatment measures. For comparison, the ratio of the surface settlement after treatment to that before treatment was also calculated.
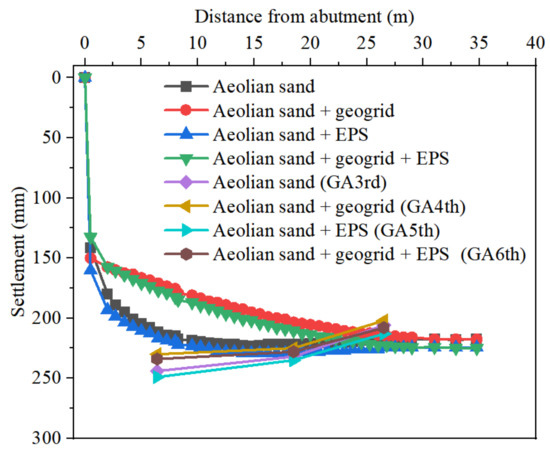
Figure 8.
Distribution curve of surface settlement of aeolian sand backfill corresponding to different treatment measures.
Table 3.
Numerical results and test results of mean surface settlement of gravity abutment backfill.
From Figure 8, it can be seen that the settlement of the backfill area was larger than that of the adjacent embankment, mainly due to the low relative density of aeolian sand. From Table 3, after setting the EPS interlayer, the surface settlement of the aeolian sand backfill for test results increased by 1.89%, which was attributed to the greater lateral deformation of the backfill caused by the EPS interlayer; at the same time, the surface settlement of the aeolian sand backfill decreased by 1.47% by using the EPS interlayer and geogrid reinforcement. It showed that the EPS interlayer had little effect on the surface settlement of aeolian sand backfill. By comparing the test results of Figure 7 and Figure 8, it was found that the average surface settlement of the aeolian sand backfill after reinforcement was only reduced by 3.42%, which was far less than the change in surface settlement of reinforced clay, indicating that the effect of geogrid-reinforced materials on the adjustment and improvement in surface settlement of the aeolian sand backfill was not obvious. Therefore, for aeolian sand, a fine particle and granular backfill, it was recommended to use high-strength woven geotextile or woven fabric with good encapsulation, or to use geogrid with ordinary woven fabric to solve the encapsulation problem, which was conducive to improving the reinforcement effect. In addition, it could also be seen from Figure 8 and Table 3 that when only the EPS interlayer was set at the abutment, the settlement of the backfill surface increased compared with that without treatment measures, and the results of finite element calculation are slightly larger than those of the centrifugal model test (2.87% > 1.89%). When the EPS interlayer was set at the abutment and the geogrid was used for treatment, the settlement of the backfill surface was reduced compared with that without treatment measures, and the result of finite element calculation was more reduced than that of the centrifugal model test (7.41% > 1.47%), which may be that the constitutive models used for numerical analyses might not have accurately simulated the real behavior of materials including backfill, geogrid and EPS.
4.2.2. Comparative Analysis of Earth Pressure
Figure 9 shows the comparison curves between the numerical results and test results of the lateral earth pressure on the back of the gravity abutment corresponding to different treatment measures. Table 4 gives the numerical results and experimental results of the earth pressure resultant force corresponding to different treatment measures.
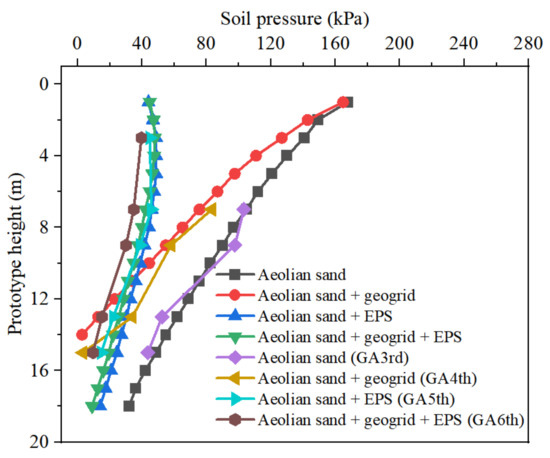
Figure 9.
Influence of the geogrid and the EPS interlayer on lateral earth pressure on abutment back.
Table 4.
Comparison of numerical results and test results of earth pressure resultant force behind different treatment measures.
Figure 9 and Table 4 showed that the earth pressure resultant force of reinforced aeolian sand was only 64.26% of that of aeolian sand, which was reduced by 35.74%. The main reason was that the application of reinforced materials improved the strength of backfill materials, thereby reducing the lateral earth pressure on the back of the abutment. After the EPS interlayer was set between the abutment and the backfill, the lateral displacement of the backfill material was allowed, and the earth pressure behind the abutment was in an active state. At this time, the earth pressure was only 40.62% of the aeolian sand, which was reduced by 59.38%. In addition, when the grid reinforcement was combined with the easily deformed EPS interlayer, the resultant force of earth pressure acting on the back of the abutment was only 35.47% of that of aeolian sand, which was reduced by 64.53%.
4.2.3. Comparative Analysis of Geogrid Strain
In the design and calculation of geogrid reinforced abutment, the control of geogrid strain is an important parameter choice, which directly determines the safety and economy of the reinforced abutment. Figure 10 and Figure 11 give the measured tensile strain values of geogrids for the models GA4th and GA6th at the target acceleration (62.5 g). It could be seen from Figure 10 and Figure 11 that when only the geogrid was placed in the backfill, the maximum strain of the same layer of the geogrid occurred on the right side, indicating that the tensile strain of the geogrid near the interface between the backfill and the adjacent embankment was large, and the tensile force was also the largest. However, after the deformation-prone EPS interlayer was placed between the backfill and the abutment back, the tensile strain in the reinforced layer of the geogrid was characterized by a large distribution at both ends and a relatively small distribution in the middle, indicating that the tensile strain of the geogrid was large in the area near the EPS plate and at the junction between the backfill and the adjacent embankment section. At the same time, it indicated that the existence of the EPS interlayer could adjust the strain distribution in the geogrid. In addition, the existence of the EPS interlayer increased the tensile strain of the geogrid in the same layer, which was conducive to the reinforcement effect of the geogrid (especially the geogrid near the abutment). It could also be found from Figure 11 that the deeper the position of the geogrid reinforced layer in the backfill was, the greater the maximum tensile strain of the layer was. The measured maximum tensile strain was 3.13%, which occurred at the first measuring point on the 3rd layer geogrid with a larger burial depth (8 m).
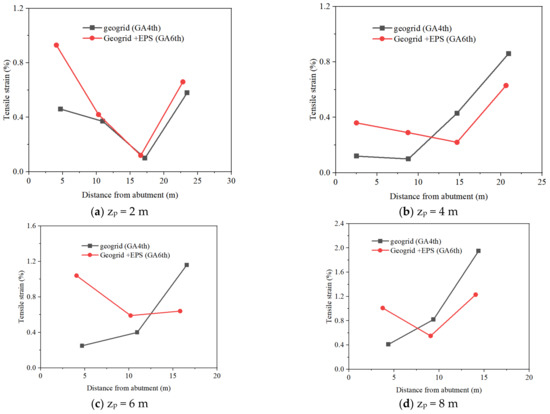
Figure 10.
Tensile strain of geogrid with different distance from abutment for different burial depths.
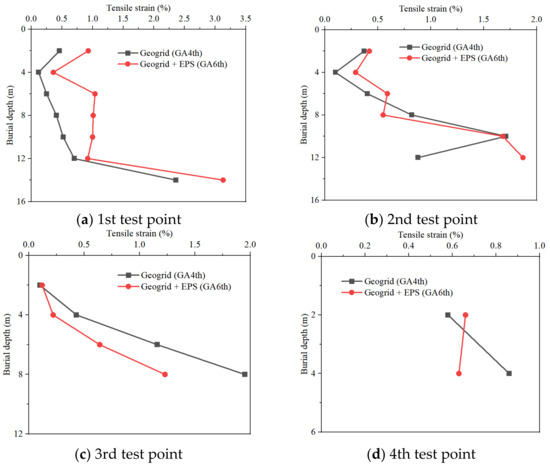
Figure 11.
Tensile strain of geogrid at different burial depths for different test points.
4.3. Application of Geogrid + EPS Interlayer in Aeolian Sand Backfill of Pile-Supported Abutment Structure
4.3.1. Surface Settlement Analysis of Backfill
The backfill materials of the models GA7th, GA8th and GA9th of pile-supported abutment were aeolian sand. The density of the backfill was basically the same, but the treatment measures were different. The model GA7th had no treatment measures, and the model GA8th adopted geogrid reinforcement; while the model GA9th contained an EPS interlayer and adopted grid reinforcement. The application of geosynthetics in concrete backfill was shown in Table 1. Figure 12 shows the distribution curve of backfill surface settlement corresponding to different treatment measures. Table 5 shows the numerical numerical results and test results of the mean surface settlement of backfill corresponding to different treatment measures. As a comparison, the ratio of the surface settlement after treatment to that before treatment was also calculated.
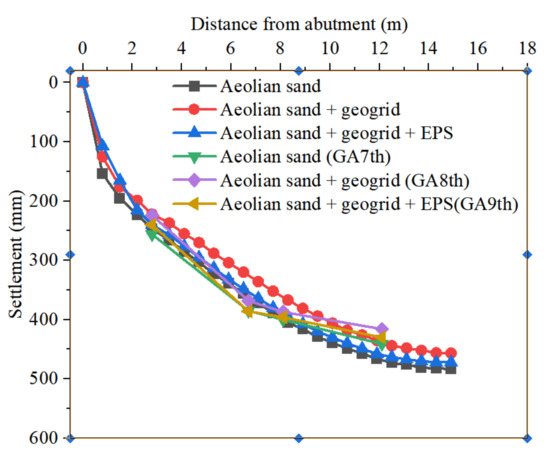
Figure 12.
Influence of geogrid and EPS on surface settlement distribution in backfill of pile-supported abutment.
Table 5.
Numerical results and test results of mean surface settlement of the backfill of a pile-supported abutment.
Figure 12 and Table 5 illustrated that the surface settlement of the backfill presented a gentle slope distribution, and the closer the measuring point was to the back of the abutment, the smaller the settlement measured value was. The main reason was the lateral restriction of the abutment and wing wall. In addition, similar to the gravity abutment, the effect of reinforcement on the improvement and adjustment of backfill surface settlement was not obvious due to the poor encapsulation of the geogrid for aeolian sand. At the same time, the surface settlement of aeolian sand backfill decreased by 3.32% by using an EPS interlayer and geogrid reinforcement, indicating that the EPS interlayer had little effect on the surface settlement of aeolian sand backfill.
4.3.2. Comparative Analysis of Earth Pressure
Figure 13 shows the earth pressure distribution curves of three cases of backfill acting on the back of a pile-supported abutment.
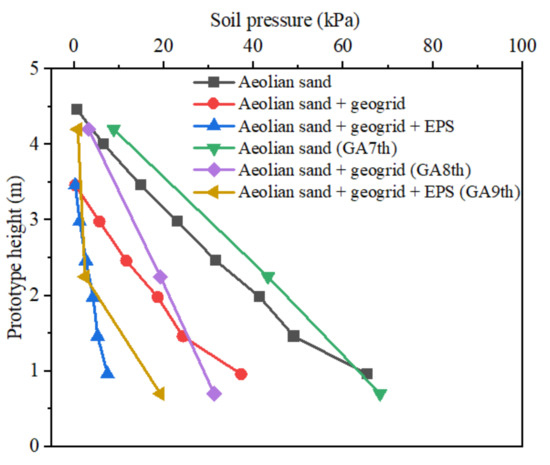
Figure 13.
Effect of setting the geogrid and the EPS interlayer in the backfill of the pile-supported abutment on the lateral earth pressure on the back of the abutment.
As shown from Figure 13, when the backfill does not use geosynthetics, the lateral earth pressure was between 2 kPa and 68 kPa, and at the lower part of the abutment back was the largest. After the geogrid was laid, the earth pressure on the back of the abutment was significantly reduced, and the maximum value was 37 kPa, which was reduced by 45.6%. After the EPS interlayer was set between the back of the abutment and the backfill, the earth pressure on the back of the abutment was further reduced, especially in the part above 1/2 of the wall height, the earth pressure value was close to 0, which was almost negligible.
4.3.3. Comparative Analysis of Geogrid Strain
Figure 14 and Figure 15 give the measured tensile strain values of geogrids for the models GA8th and GA9th at the target acceleration (40 g).
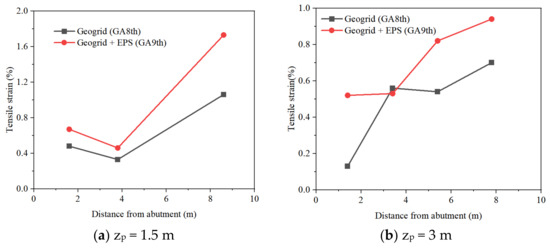
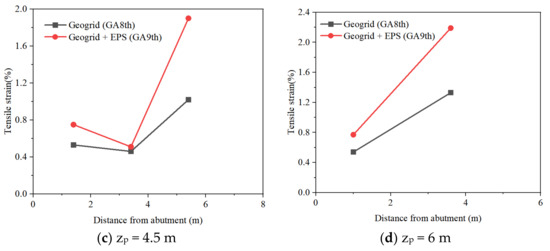
Figure 14.
Tensile strain of geogrid with different distance from abutment for different burial depths.
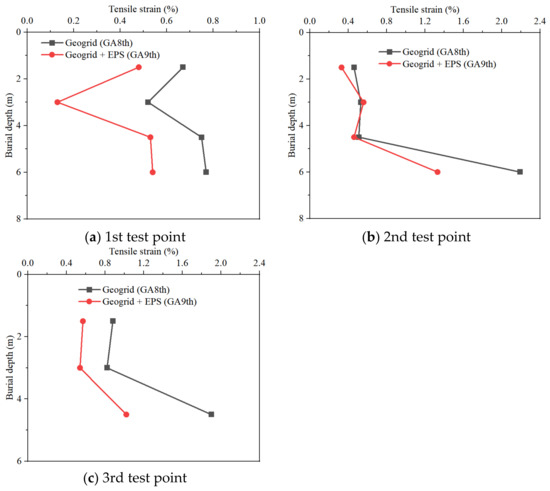
Figure 15.
Tensile strain of geogrid with different burial depths at different test points.
From the strain values of GA8th and GA9th geogrids in Figure 14 and Figure 15, it can be seen that when there was no EPS interlayer, the strain of geogrid near the interface between backfill and adjacent embankment sections was the largest, which reached 2.2%, and the tensile force was also the largest. In addition, the deeper the geogrid was buried, the larger the tensile strain was. After adding an EPS interlayer between the abutment back and the backfill, the strain of geogrid increased generally. At the same time, in terms of spatial distribution, the strain in the geogrid presented the distribution characteristics of being large at both ends and low in the middle overall (especially zp = 1.5, zp = 3.0). For the case without an EPS plate, the geogrid-reinforced layer only had large tensile strain on one side of the backfill and adjacent subgrade. This strain spatial distribution feature was the same as that of gravity abutment with an EPS interlayer.
4.4. Coordination Effect of EPS Interlayer on Horizontal Displacement of Abutment Structure
For bridges with expansion joints, the horizontal displacement of bridges caused by seasonal temperature changes generally does not lead to the horizontal movement of abutments. However, the new integral bridge is an integral structure without expansion joints, and the seasonal temperature stress will inevitably cause the horizontal displacement of the platform back structure. In summer, due to the expansion of the bridge concrete structure, the abutment moves towards the filling direction, which increases the earth pressure on the abutment back and affects the stability and safety of the structure.
The finite element numerical results of earth pressure corresponding to different displacements are shown in Figure 16. In the figure, when the displacement was −0.1 m, 0 m, +0.1 m or +0.2 m, the distribution of earth pressure along the height of the abutment back was compared (the displacement towards the direction of filling was defined as a positive value, and vice versa). When the displacement was +0.2 m, the EPS interlayer with a thickness of 80 cm and a modulus of E = 1500 kPa was set between the abutment back and the backfill material (aeolian sand).
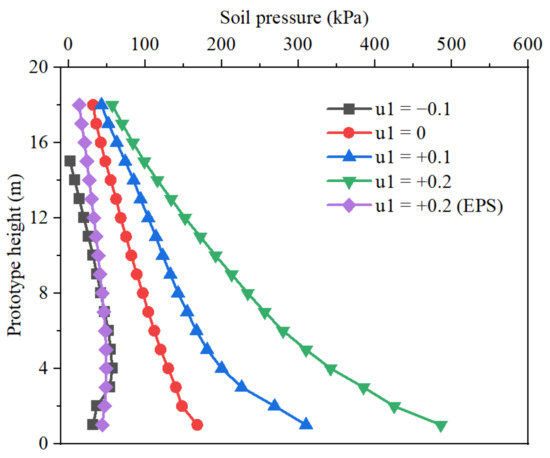
Figure 16.
Influence of abutment back displacement on earth pressure.
It can be seen from Figure 16 that the displacement of the abutment back had a significant impact on the earth pressure. When the active displacement of the abutment back away from the filling direction occurred, the earth pressure was significantly reduced, which decreased from 490 kPa to 55 kPa when u1 decreased from +0.2 m to −0.1 m. On the contrary, when the passive displacement of the platform back towards the filling direction occurred, the earth pressure increased significantly. If no measures were taken, the stability and safety of the structure would be threatened. However, after setting an EPS interlayer with a modulus of 1500 kPa, the earth pressure on the back of the platform decreased significantly. In the middle and lower part of the abutment back, the earth pressure on the platform back under +0.2 m passive displacement was even smaller than the active earth pressure with displacement of −0.1 m. Therefore, an EPS interlayer with low modulus and easy deformation could eliminate the influence of the back displacement on earth pressure and ensure the stability and safety of the structure.
5. Conclusions
Through centrifugal model tests and finite element numerical simulation, the backfill behaviors of gravity abutments and pile-supported abutments under the treatment measures of geogrid reinforcement and EPS interlayer were studied. The following conclusions are drawn:
- Geogrid reinforcement decreases the surface settlement of different backfills and reduces the lateral earth pressure acting on the back of the abutment.
- The reinforcement effect of geosynthetics behind the abutment can be improved by increasing the length of bottom reinforced material.
- Centrifuge model tests show that the earth pressure of abutments with EPS inclusion is reduced markedly, and the settlement of backfill without geogrid is increased.
- The earth pressure on the back of the abutment with both geogrid reinforcement and EPS inclusion is further reduced, and the differential settlement between the abutment and the backfill becomes smaller, and the tensile stress of the geogrid is obviously increased, which is very beneficial to the effect of geogrid reinforcement.
Author Contributions
Investigation, Z.S.; Methodology, L.F. All authors have read and agreed to the published version of the manuscript.
Funding
The research was sponsored by the National Science Foundation of China (Grant No.41172239) and the Research Foundation of Nanjing Institute of Technology (Grant No. CKJB202004).
Institutional Review Board Statement
Not applicable.
Informed Consent Statement
Not applicable.
Data Availability Statement
All data, models, and code generated or used during the study appear in the submitted article.
Acknowledgments
Authors sincerely thank the respected reviewers for their valuable comments on improving the quality of the paper. The authors also express their gratitude to the staff for their support in carrying out laboratory experiments in the Nanjing Institute of Water Resources, China.
Conflicts of Interest
The authors declare no conflict of interest.
References
- Haiwei, T. Analysis of Highway Vehicle Jumping at Bridge-head between Pavement and Abutment of Express Highway. In Proceedings of the 2012 International Conference on Computer Distributed Control and Intelligent Environmental Monitoring, Zhangjiajie, China, 5–6 March 2012; IEEE: New York, NY, USA, 2012; pp. 131–136. [Google Scholar] [CrossRef]
- Ibrahim, A.; Ahmad, F.; Hassan, Z.A.; Ali, F. Strenght of expanded polystyrene (EPS)-sand as lightweight material in geotechnical engineeering. Mal. J. Fund. Appl. Sci. 2017, 9, 566–577. [Google Scholar] [CrossRef][Green Version]
- Liu, H.; Han, J.; Jawad, S.; Parsons, R.L. Literature review of causes and mitigation techniques for bumps at ends of bridges. In Proceedings of the Geo-Congress 2020, Geotechnical Earthquake Engineering and Special Topics, Minneapolis, MN, USA, 25–28 February 2020; pp. 862–872. [Google Scholar] [CrossRef]
- Xu, J.Q.; Yan, Z.B.; Wang, Y.T.; Liao, J.F.; Mao, Z.P.; Wang, Y. Study on the effect of reinforcing method of inclined jet grouting pile to control the uneven settlement of soft soil subgrade. In Proceedings of the International Conference on Smart Transportation and City Engineering, Chongqing, China, 26–28 October 2021; SPIE: Bellingham, WA, USA, 2021; pp. 839–851. [Google Scholar] [CrossRef]
- Liu, H.; Han, J.; Parsons, R.L. Mitigation of seasonal temperature change-induced problems with integral bridge abutments using EPS foam and geogrid. Geotext. Geomembr. 2021, 49, 1380–1392. [Google Scholar] [CrossRef]
- Chen, J.; Zhang, D.; Huang, H.; Shadabfar, M.; Zhou, M.; Yang, T. Image-Based segmentation and quantification of weak interlayers in rock tunnel face via deep learning. Automat. Constr. 2020, 120, 103371. [Google Scholar] [CrossRef]
- Chen, J.; Zhou, M.; Huang, H.; Zhang, D.; Peng, Z. Automated extraction and evaluation of fracture trace maps from rock tunnel face images via deep learning. Int. J. Rock. Mech. Min. 2021, 142, 104745. [Google Scholar] [CrossRef]
- Jelušič, P.; Žlender, B. Experimental study of a geosynthetic-reinforced soil bridge abutment. Geosynth. Int. 2021, 28, 479–490. [Google Scholar] [CrossRef]
- Won, M.S.; Langcuyan, C.P. A Study of the Effects of Geosynthetic Reinforced Soil and Reinforcement Length on GRS Bridge Abutment. Appl. Sci. 2021, 11, 11226. [Google Scholar] [CrossRef]
- Zadehmohamad, M.; Bazaz, J.B. Cyclic behaviour of geocell-reinforced backfill behind integral bridge abutment. Int. J. Geotech. Eng. 2017, 13, 1–13. [Google Scholar] [CrossRef]
- Changizi, F.; Razmkhah, A.; Ghasemzadeh, H.; Amelsakhi, M. Behavior of geocell-reinforced soil abutment wall: A physical modeling. J. Mater. Civil. Eng. 2022, 34, 04021495. [Google Scholar] [CrossRef]
- Yang, G.Q.; Lv, P.; Pang, W.; Zhao, Y. Field test of reinforced soil high retaining wall with wrapped geogrid. J. Rock. Geotech. Mech. 2008, 29, 517–522. (In Chinese) [Google Scholar]
- Sun, J.S.; Yang, C.F.; Dou, Y.M.; Hao, S.W. Measurement and finite element analysis of the strain of geogrid reinforced retaining wall. Inn. Mong. Highw. Transp. 2008, 3, 4–7. (In Chinese) [Google Scholar]
- Zhao, Z.H.; Xue, X.H.; Zhou, Y.T.; Guo, Y.Y. Field test analysis of block geogrid-reinforced earth retaining wall. Sichuan Build. Sci. 2011, 37, 134–138. (In Chinese) [Google Scholar]
- Rollins, K.M.; Scott, E.; Marsh, A. Geofoam inclusions for reducing passive force on bridge abutments based on large-Scale tests. In Proceedings of the Geotechnical Frontiers 2017, Orlando, FL, USA, 12–15 March 2017; pp. 59–68. [Google Scholar]
- Ge, Z.S.; Huang, X.M. Centrifugal Modeling of Abutment Backfill with EPS Inclusion and Reinforcement. EPS 2006, 9, 447–452. [Google Scholar]
- Kyokawa, H.; Yamazaki, Y.; Koseki, J.; Konami, T.; Nishi, T.; Kubota, T. Shaking table tests on bridge abutments reinforced by EPS and geogrid. Geosynth. Int. 2021, 29, 163–173. [Google Scholar] [CrossRef]
- Fiorentino, G.; Cengiz, C.; De Luca, F.; Mylonakis, G.; Karamitros, D.; Dietz, M.; Dihoru, L.; Lavorado, D.; Briseghella, B.; Nuti, C. Integral abutment bridges: Investigation of seismic soil-structure interaction effects by shaking table testing. Earthq. Eng. Struct. Dyn. 2021, 50, 1517–1538. [Google Scholar] [CrossRef]
- Schofield, A.N.; Steedman, R.S. Recent Development of Dynamic Model Testing in Geotechnical Engineering; Cambridge University Engineering Department: Cambridge, UK, 1988; pp. 124–136. [Google Scholar]
- Yu, Y.Z.; Chen, Z.F. A review on development of shaking table system for geotechnical centrifuge. Water. Res. Hydropower Eng. 2005, 36, 19–21. (In Chinese) [Google Scholar] [CrossRef]
- Higo, Y.; Lee, C.W.; Doi, T.; Kinugawa, T.; Kimura, M.; Kimoto, S.; Oka, F. Study of dynamic stability of unsaturated embankments with different water contents by centrifugal model tests. Soils Found. 2015, 55, 112–126. [Google Scholar] [CrossRef]
- Cabrera, M.A.; Wu, W. Experimental modelling of free-surface dry granular flows under a centrifugal acceleration field. Granul. Matter 2017, 19, 1–10. [Google Scholar] [CrossRef]
- Miao, F.; Wu, Y.; Török, Á.; Li, L.; Xue, Y. Centrifugal model test on a riverine landslide in the Three Gorges Reservoir induced by rainfall and water level fluctuation. Geosci. Front. 2022, 13, 101378. [Google Scholar] [CrossRef]


Publisher’s Note: MDPI stays neutral with regard to jurisdictional claims in published maps and institutional affiliations. |
© 2022 by the authors. Licensee MDPI, Basel, Switzerland. This article is an open access article distributed under the terms and conditions of the Creative Commons Attribution (CC BY) license (https://creativecommons.org/licenses/by/4.0/).