Article

The Coupling and Coordination Characteristics and Influencing Factors of Green Innovation Efficiency (GIE) and Economic Development Levels in China

1
School of Management, Chongqing University of Technology, Chongqing 400054, China
2
Rural Revitalization and Regional High-Quality Development Research Center, Chongqing University of Technology, Chongqing 400054, China
3
College of Business Administration, Chongqing Technology and Business University, Chongqing 400054, China
*
Author to whom correspondence should be addressed.
Sustainability 2022, 14(21), 14085; https://doi.org/10.3390/su142114085
Submission received: 16 September 2022 / Revised: 24 October 2022 / Accepted: 25 October 2022 / Published: 28 October 2022

Abstract

:
Green innovation exchanges low emissions, low pollution and low output for economic development. At the same time, economic development can provide important economic support for green innovation, and managing the connection between green innovation and economic development is significant for the balanced development of a region. There is no unified definition of green innovation efficiency in academic circles, but the definitions can be divided into three types: innovation aimed at minimizing environmental damage; innovation of environmental performance; and innovation for environmental development or environmental improvement. Based on relevant data from 30 provinces and cities in China from 2008 to 2019, this paper uses the coupling coordination model and spatial autocorrelation analysis to investigate the coordination status of green innovation efficiency (GIE), the economic development standard, and their evolution over time and space. We also use the Tobit model to analyze influential factors in coupling coordination. The results show that the overall development trend of coupling coordination is rising, and the gap between the coordination standard between the east and west is obvious. Considering the spatial correlation pattern, the high innovation area is mainly centered in the east. It is empirically demonstrated through the Tobit model that patented technology facilitates the balanced development of regional GIE and economic development. These conclusions provide a new viewpoint for the projection of green innovation policies, help to combine green innovation with economic development, and afford an academic foundation for the government to mark out future development directions and policies.

1. Introduction

Since the industrial revolution, technological innovation has been regarded as the core force of economic development and development, and China’s scientific and technological innovation process is also moving forward. Although conventional technological innovation has brought rapid advancement to China’s economy, it has also caused harm to the common environment [1]. The world is now facing the dilemmas of ecological environment degradation, global warming, and resource shortages. Therefore, in this era of the green economy, all countries regard green technology innovation as a new force to promote economic development. As the largest developing country, China enjoys the largest economic scale and has a large population. The environmental problems it faces are more serious. Hence, there is a fundamental need to modify the mode of economic development in China. Green innovation efficiency (GIE) is the greening degree of local innovation efficiency, a measure of innovation development capability after comprehensive consideration of environmental contamination and energy depletion, a green indicator of innovation capability, and a reflection on the benefits of innovation activities on resources and the environment. Economic development and green innovation are inseparable. The continuous improvement of green innovation capability can stimulate increased economic development. In turn, economic development can achieve better green innovation [2].
At present, the research on the GIE at home and abroad is relatively mature. Bauhardt [3] believes that green innovation is the basis of economic success, and the key to maintainable social development is green innovation, which effectively illustrates the importance of green innovation. Mirata and Emtairah [4] considered the indicators of social and economic development, environmental protection, and sustainable development when examining green innovation, whereas Beise and Rennings [5] only considered ecological construction and economic development. The former provides a more comprehensive perspective on the study of green innovation. Oltra and Jean [6] comprehensively considered the environment and innovation policy, developed a sectoral framework based on three elements (technology regime, demand conditions, environment and innovation policies), then measured the GIE. Halila and Rundquist [7] believe that green innovation includes three aspects, which are developed under the joint action of ecological environment, sustainable development, and innovation activities. This provides a new perspective for the study of green innovation. Gema and Antonio [8] put forward an intermediary model to analyze the direct and indirect relationships and concluded that improving the GIE is conducive to achieving higher economic benefits. The link between green innovation and economic development is effectively established. Zhang et al. [9] believe that scientific and effective evaluation of the GIE of regional industrial companies is crucial to improving the overall green innovation capacity of a country. Wang et al. [10] took the green innovation of networked municipal agglomerates as the research object and analyzed the effect of network structure features (such as network size and network structure holes) on the green innovation of the Changsha–Zhuzhou–Xiangtan region. Their results showed that the overall GIE of the Changsha –Zhuzhou–Xiangtan urban agglomeration was stable. In the course of innovation, economic development had an advantageous impact on green innovation and promoted the entire efficacy of the techno-innovation network structure. Luo et al. [11] believe that, based on environmental issues, the development rate of GIE varies greatly, and its improvement depends entirely on technological progress and regional GIE. This provides a direction for research on the factors influencing green innovation efficiency. Jie [12] believes that scientific and technological innovation may be a noteworthy indicator in measuring the competitive strength of the current economy and society. They can also serve as a stimulus to regional economic development. The study of the overall optimization model of the efficiency and performance of green technology innovation is of great significance to China’s technological innovation and sustainable economic development. Lv et al. [13] believe that economic development efficiency can promote the improvement of GIE. Based on the results of the SBM-DEA model, Ruan [14] concluded that the average level of GIE of industrial enterprises in China is low, and the regional contrast is apparent; this method provides a reliable approach for this article. The GIE decreases from east to west according to a regional pattern. Zhao et al. [15] built the Tobit regression model to discover the effect of the green economy and ecological procedures on GIE in different regions and found that the green economy has a significant impact on GIE in eastern China. The SBM model is a non-ray model and is a relatively complete DEA extension model. This paper also uses this method to analyze the efficiency of green innovation. Grounded on the analysis of the SBM model considering undesirable output, Zhao et al. [16] concluded that the average value of GIE in the upper, center, and lower reaches of the Yangtze River economic zone gradually increased; the imbalance between regions was improved first and then intensified, and the spatial polarization effect of urban GIE gradually expanded. Wang et al. [17] believe that in order to solve the increasingly serious environmental problems, we ought to recognize the value of innovation from the environmental perspective, instead of simply analyzing the significance of innovative development from the viewpoint of economic value. Building GIE is key to achieving economic transformation and green development. The importance of studying the efficiency of green innovation is emphasized again. Liu [18] believes that green innovation is significantly associated with economic development of high quality and ecological sustainability. The industrial GIE in China has increased step by step from the northwest to the southeast. The efficient areas are centralized in the eastern coastal areas, and there is an obvious balanced development trend towards the central and western districts. Peng et al. [19] believe that green innovation with spatial spillover effects is a significant approach to improving the conversion of the economy, upgrading urban economic structures, and realizing the sustainable development of Chinese cities. It illustrates the significance of green innovation to urban development in China. Li et al. [20] believe that green technological innovation has a critical positive effect on high quality economic development. Compared with the GIE and economic development level in the eastern districts, those in the central and western districts of China are weak, which affords important ideas for the research of this paper.
The correlation between green innovation and economic development has been extensively investigated. The mutual effect between green innovation and economic development has a significant effect on the sustainable and healthy development of society and technological progress. It is fundamental to consider the inherent relationship between green technological innovation and economic development. The above literature is of great significance to the study of this paper. However, studies on the coupling and coordination characteristics and influencing factors of green innovation efficiency (GIE) and the economic development level in China need to be increased. Building on previous studies, this paper mainly addresses the following problems: (1) What is the coupling coordination degree between green innovation efficiency and the economic development levels of provinces and cities in China? What are the differences? (2) What are the spatial and temporal distribution characteristics of green innovation efficiency and economic development levels? (3) When the existing coupling coordination degree is analyzed by agglomeration analysis, what is the direction of coordinated development between the green innovation efficiency and economic development level? (4) What are the factors influencing coupling and coordination between green innovation efficiency and economic development levels in China? This paper investigates and discusses these problems, so as to provide a reference for the coordinated development of environmental protection and the economy in China.

2. Data Sources and Research Methods

2.1. Index Selection and Data Source

Using the relevant research results of GIE and economic development levels, and following the index selection principles of comprehensiveness, hierarchy, comparability, and representativeness, a GIE valuation index system and economic development level valuation index system [21] are constructed (see Table 1). GIE has three dimensions: green technological innovation input, green technological innovation expected output, and green technological innovation unexpected output from the input–output variable. The economic development level system includes four dimensions: economic strength, living standards, development structure, and public service expenditure. This paper uses 2008 as its starting point in the research period. This data mainly comes from local statistical yearbooks, national statistical yearbooks, national economic and social development statistical bulletins, and other official channels from 2008 to 2019. A small number of data points are missing, so they are approximated utilizing the average development rate of the adjacent three years. In addition, considering that there are many factors in the indicator system, the entropy method is used to objectively weigh the livelihood capacity indicators [22].

2.2. Research Methods

2.2.1. Coupling Degree and Coupling Coordination Degree Model

The coupling degree model is an important method to describe a system’s degree of interaction and cooperation. It is grounded on the ability coupling system model in physics. The coupling degree model is only utilized to gauge the degree of mutual effect between systems; it cannot reflect the development level of systems. The coupling coordination model is a harmonious and virtuous correlation between systems or elements. The coupling coordination degree model reflects the degree of coordination of internal conditions [23,24]. In order to reveal the coupling coordination relationship between green innovation efficiency and economic development level, the coupling coordination model is calculated. Accordingly, this paper builds a coupling coordination degree model to estimate the coupling coordination level of GIE and economic development. The model is organized as follows [25,26]:
C = { f ( x ) g ( y ) [ ( f ( x ) + g ( y ) / 2 ) ] 2 } h
t = (f(x) + g(y))/2
C d = C t
In Formula (1), f(x) and g(y) represent the integrated evaluation indexes of GIE and the economic development level, respectively. The coupling coordination degree value is Cd ∈ [0, 1]. When Cd = 1, the two systems are closely coordinated. When Cd = 0, the two systems are in an independent state. The value h is the adjustment coefficient, and the greater the value of h, the higher the discrimination. Because the importance of the two systems is the same, h = 2 is selected. According to the calculated coupling coordination value, the level of coupling coordination degree can be divided into stages, as shown in Table 2 [27,28].

2.2.2. SBM-DEA Model

DEA is a research model which is widely utilized for multi-objective decision-making problems. It utilizes longitudinal formulation to study the efficacy of the same style of unit input–output index. The DEA model has been extensively used and gradually improved since it was proposed by American operational research experts in 1978. Non-radial and non-angular SBM models, based on slack variables, are used to solve the slack problems of input and output. Directly incorporating the slack variables of every input and output into the objective function, the method addresses the effect of the slack variables on the measured values. The equations are as follows [29]:
ρ = m i n ( 1 1 m k = 1 m s b k x b k o ) / ( 1 + 1 n r = 1 n s g r y g r o )  
s . t . { x b o = X b λ + s b y g o = Y g λ s g s b 0 s g 0 λ l 0   l = 1 , 2 , k  
where ρ represents the efficiency value, m and n separately represent the amount of input and output indicators, Sb and Sg represent the slack degree of input-output indicators, Sbk and Sgr separately represent the slack of kth input indicator and rth output indicators, and λ represents the intensity vector, λ = (λ1, λ2, …, λk). Among them, the k represents the number of units to evaluate, and the Xb and Yg are matrices of input and output values, respectively. The objective function ρ is absolutely monotonically decreasing with respect to Sb, Sg and 0 < ρ < 1.

2.2.3. Global Spatial Autocorrelation

Spatial autocorrelation is a strategy utilized to analyze the relationship between information in space, clarify the relationship features of spatial disposition information, and determine its coacervation characteristics in space. This paper utilizes Moran’s I index to discover the relevance between provincial GIE and the economic development level in China. The global Moran’s I index is usually applied in geography to investigate the spatial autocorrelation of a certain particularity in a specific district, and researchers also use it to analyze the resemblance of adjoining units in space. The detailed criterion is as follows [30]:
I = n × i = 1 n j 1 n W i j ( x i x ¯ ) ( x j x ¯ ) ( i = 1 n j = 1 n W i j ) × i = 1 n ( x i x ¯ ) 2  
where I is the Moran index; n is the number of research areas; xi and xj are the ecological efficiency in district I and j, respectively; x ¯ is the mean value of ecological efficiency; and Wij represents the community correlation between regions i and j. When i and j are adjoining, Wij = 1. If not, it is zero. The numerical value of global Moran’s I is in the interval [1, 1], and a value larger than 0 indicates active spatial relevance. The larger the value, the more self-evident the spatial relationship. A numerical value less than 0 indicates negative spatial relevance, and the lower the numerical value, the larger the spatial distinction. If the value is zero, the space is random.

2.2.4. Local Spatial Autocorrelation

A local spatial autocorrelation investigation is used for detailed assessment of the particular circumstances of local spatial agglomeration of GIE in China’s provinces. It analyzes the instability in a local space to discover the spatial heterogeneity of GIE in China’s regions. The particular calculation expression of local Moran’s I index is as follows [31]:
I j = ( x i x ¯ ) m 0 j W i j ( x j x ¯ )
In the above equation, xi represents the GIE of the province; x ¯ represents the average value of GIE in all regions; Ii > 0 represents the spatial agglomeration of observed values similar to the GIE in this region (H–H or L–L); and Ii < 0 represents the spatial agglomeration of observed values that are not similar to the GIE in this region.

2.2.5. Tobit Model

Our basic objective is to uncover the critical factors influencing the coupling and coordination degree of GIE and economic development levels. Testing for the influential factors can further change the descriptive results into explanatory results, which is helpful to truly grasp what the real influential factors are. This can be significant to making viable progress in GIE and economic development levels. The basic requirement for the method is that the value of the subordinate variable of the model cannot be narrowed by any measurement. Nevertheless, the dependent variable is gauged by the DEA model (the coupling and coordinating degree of GIE and economic development levels), whose value range is between 0 and 1. In these conditions, if using the least square method to test the influencing limitations of the coupling coordination degree, the regression result may be biased toward 0; that is, the calculation result is incorrect.
Therefore, the Tobit model is chosen to perform the calculation more accurately to meet the aims of this paper [32]. This is because the Tobit model is additionally known as a truncated regression model. A premise of this model is that the dependent variable is generally set between 0 and 1. From this, taking the coupling coordination degree of the GIE and economic development level as the attributive variables, the number of patents as an independent variable, education levels, logarithm of total energy consumption and openness as control variables, and GOV government support as an intermediary variable, we establish a basic Tobit model that reflects the connection between the two. Its elementary equation is as follows:
Y i * = α + β 1 X 1 + β 2 X 2 + β 3 X 3 + β 4 X 4 + ε i t { Y i = Y i *   ( i f   Y i * < 1 ) Y i = 1   ( i f   Y i * 1 )
where Yit represents the observed variable in the Tobit model, and Y*it represents the latent variable in the model. X1, X2, X3, and X4 represent the number of patents, education level, the logarithm of total energy consumption, and the openness, respectively; β1, β2, β3, and β4 represent the coefficients of each independent variable, and their numerical values indicate the inherent correlation between every influencing factor and the coupled and coordinating degree. εit represents the random disturbance term in this method.
On this basis, a mediation model is constructed, and its fundamental formula is as follows:
Y i * = α + β 1 X 1 + β 2 X 2 + β 3 X 3 + β 4 X 4 + β 5 X 5 + ε i t { Y i = Y i *   ( i f   Y i * < 1 ) Y i = 1   ( i f   Y i * 1 )

3. Analysis on Coupling Coordination Degree of GIE and Economic Development

3.1. Measurement of GIE and Economic Development Levels

3.1.1. Analysis of GIE Results

Utilizing the SBM-DEA model [33,34] to gauge the GIE of 30 provinces and cities on the Chinese mainland from 2008 to 2019 was found to be effective. As shown in Figure 1, the starting year, end year and intermediate years in the study period are selected as representatives to analyze the GIE results of the research area. It can be seen that in 2008, the efficiencies of Gansu, Hebei, Qinghai, Shanxi, Xinjiang, and Inner Mongolia were below 0.3; Inner Mongolia was only 0.008. By 2011, the efficiency value of Henan and Heilongjiang had dropped to below 0.3, but that of Gansu increased to more than 0.3. In 2015, the national green science and technology efficiency showed an upward trend, and a low efficiency level below 0.3 only remained in Inner Mongolia. By 2019, although the efficiency of Inner Mongolia was still less than 0.3, it had significantly improved. Other regions were also above 0.5. On the whole, the GIE of the country is constantly improving, and the overall level is high. Nevertheless, problems such as the specific development situation of each province and city, the regional green innovation policies, and the allocation of green innovation resources can make substantial differences to the level of GIE in each province and city.

3.1.2. Result Analysis of Economic Development Level

The global entropy weight method [35] is utilized for calculating the integrated index of the economic development level, and the weighted results are shown in Table 3. The starting year, end year and intermediate years in the study period are selected as representatives to analyze the scores of economic development level (see Table 3). From 2008 to 2019, the economic development level in the research areas has improved to varying degrees. In 2008, the comprehensive index of economic development level of other places was below 0.2, with the exception of Beijing, Tianjin, and Shanghai. In 2011, the integrated index of Beijing, Tianjin, and Shanghai was still the highest in the whole country. The comprehensive index of about half of the provinces and cities rose to above 0.2; Beijing reached 0.407. By 2015, all the provinces had reached the level of 0.2 or above. Beijing had risen above 0.5, and the comprehensive index of Jiangsu, Shandong, and Zhejiang has increased above 0.3. In 2019, Chongqing, Zhejiang, Jiangsu, and Fujian also entered the level of 0.4 to 0.5. On the whole, the comprehensive index which indicates the national economic development level has improved step-by-step, but the development of the east and the west shows different rates. The comprehensive index of the economic development level of the eastern coastal regions has increased rapidly, and the comprehensive indexes of Beijing and Shanghai are in the forefront of the country at different times.

3.2. Coupling Coordination Degree of GIE and Economic Development Levels

3.2.1. Analysis of Coupling Coordination Degree between the GIE and Economic Development Levels of Provinces and Cities

Utilizing the coupling coordinating model to gauge the coupling coordinating degree of GIE and economic development levels is logical. The average level of coupling coordination degree is classified in Table 4 [36]. From this table it can be observed that there are several differences in the degree of coupling coordination among provinces and cities, but most provinces and cities are concentrated in the three stages of basic, moderate, and high coordination. There are twelve provinces and cities in the high coordination stage, eight in the elementary coordination stage, and seven in the medium coordination stage. Highly coordinated provinces and cities have great potential to develop into high-quality coordination, and there is space for improvement in the future. Beijing, Shanghai, and Tianjin have attained the high-quality coordination stage, and there are no provinces or cities in the low-level coordination stage. The level of all the research areas is mainly in the upper-middle stage. Although there are no low-level coordination provinces and cities, there are many provinces and cities with basic and medium coordination. In the future, we should strengthen the green innovation and economic development of provinces and cities in the basic and medium coordination stages by improving their coupling and coordination. Thereby their overall level in the whole country can be improved, enabling more provinces and cities to move toward the high-quality coordination stage. At the same time, we should not neglect the continuous development of highly coordinated provinces and cities, so that they can enter the ranks of high-quality coordinated provinces and cities as soon as possible.
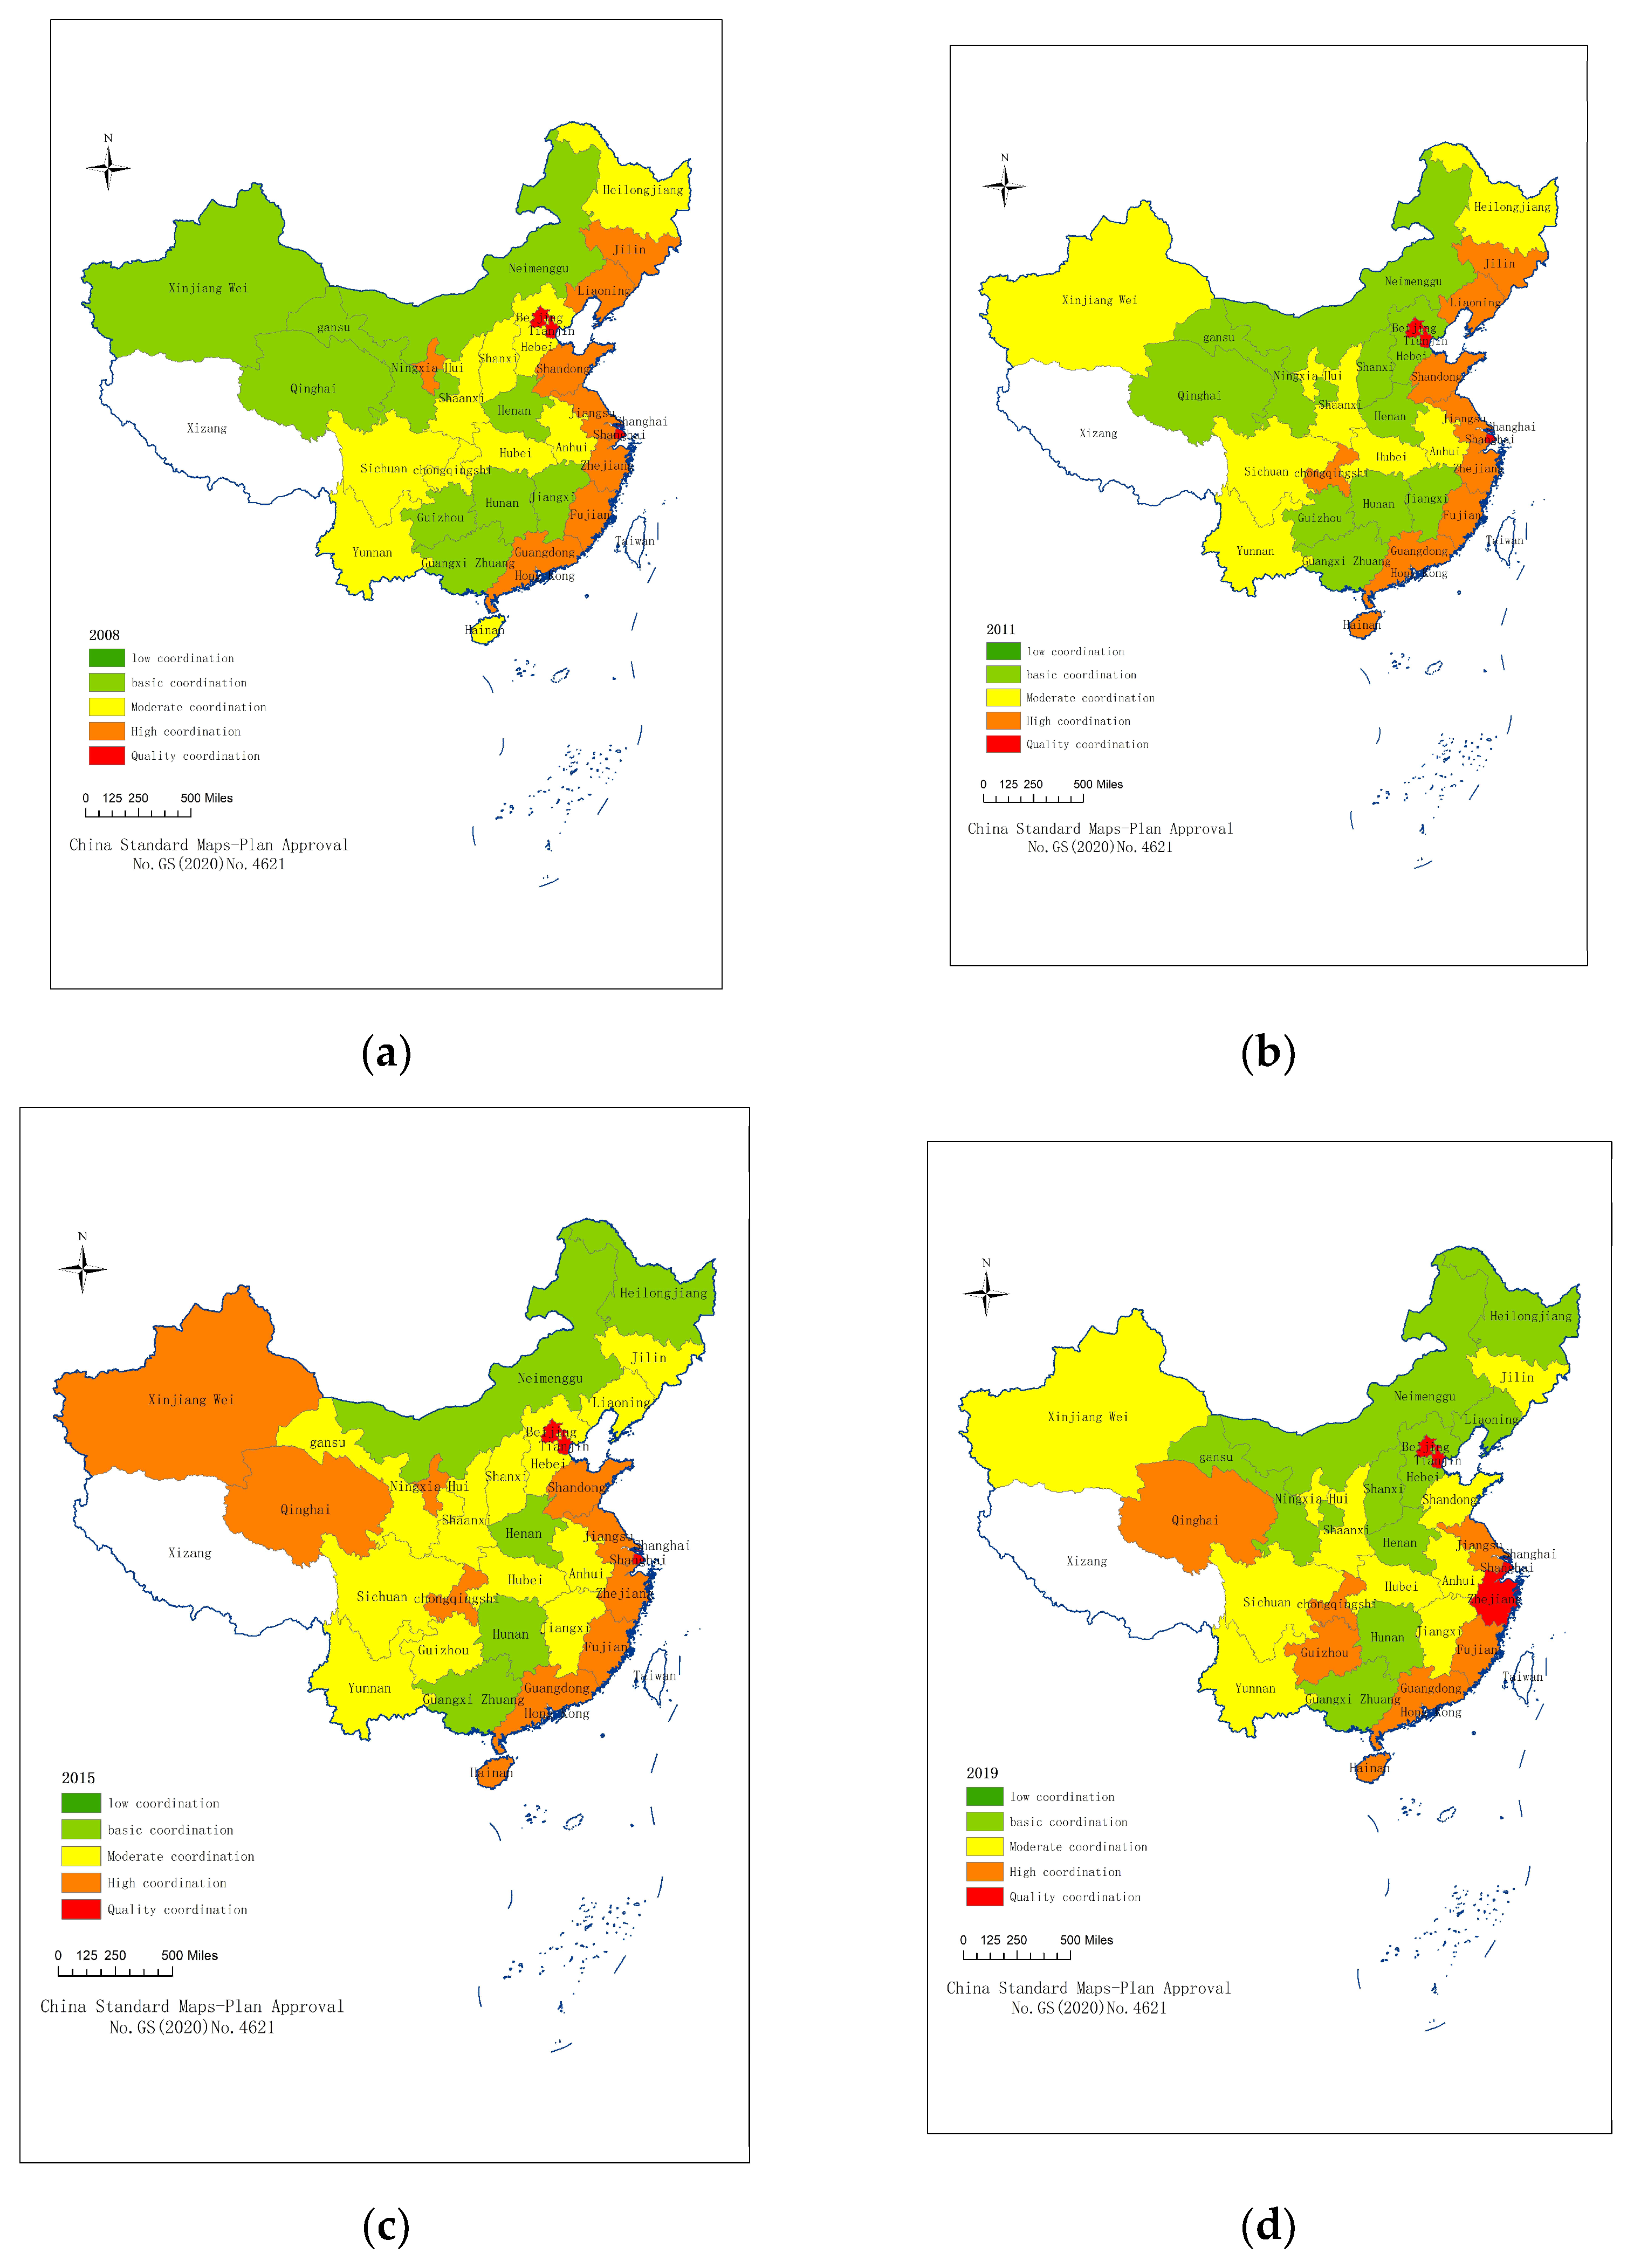
To investigate the spatiotemporal evolutionary traits of the coupling coordinating degree of GIE and the economic development level, the starting year, end year and intermediate years in the research period are selected as representatives (i.e., the years 2008, 2011, 2015, and 2019). The coupling coordination degree is visualized using ArcGIS technology, and the results are presented in Figure 2. The coupling and coordinating degree of GIE and the economic development level of the research areas has shown an overall upward trend. The correlation between GIE and economic development has continuously improved because the two systems gradually changed from low-level coordination to high-quality coordination. In the main, the eastern regions are better than western regions; the separation between east and west is obvious.
In 2008, Beijing, Shanghai, and Tianjin achieved high-quality coordination, and the western provinces and cities, except Sichuan, Chongqing, and Shaanxi, were all at or below the moderate coordination level. In 2011, Xinjiang moved into the moderate coordination range, but Shanxi, Hebei, and Guizhou all dropped from moderate to basic coordination. There was no significant change in provinces and cities with high coordination and high-quality coordination. In 2015, there was a significant increase in highly coordinated and high-quality coordinated provinces and cities. There was no low-level coordination anywhere in the country. The number of provinces and cities with basic coordination was decreasing, and the number of provinces and cities transitioning to the medium coordination stage was increasing. This reflects the changing characteristics of increasing coordination in the coupling process; the coordination of GIE and the economic development level was enhanced in the coupling process stage by stage. In 2019, although the number of highly coordinated provinces and cities decreased, the number of high-quality coordinated provinces and cities increased, and Zhejiang entered the high-quality coordination range. Considering the spatial variability, the values in the eastern regions are always higher than those of other regions. In the coastal provinces and cities, the timing of coupling coordination is always ahead of the whole country.

3.2.2. Analysis on Location Factors of GIE and the Economic Development Level

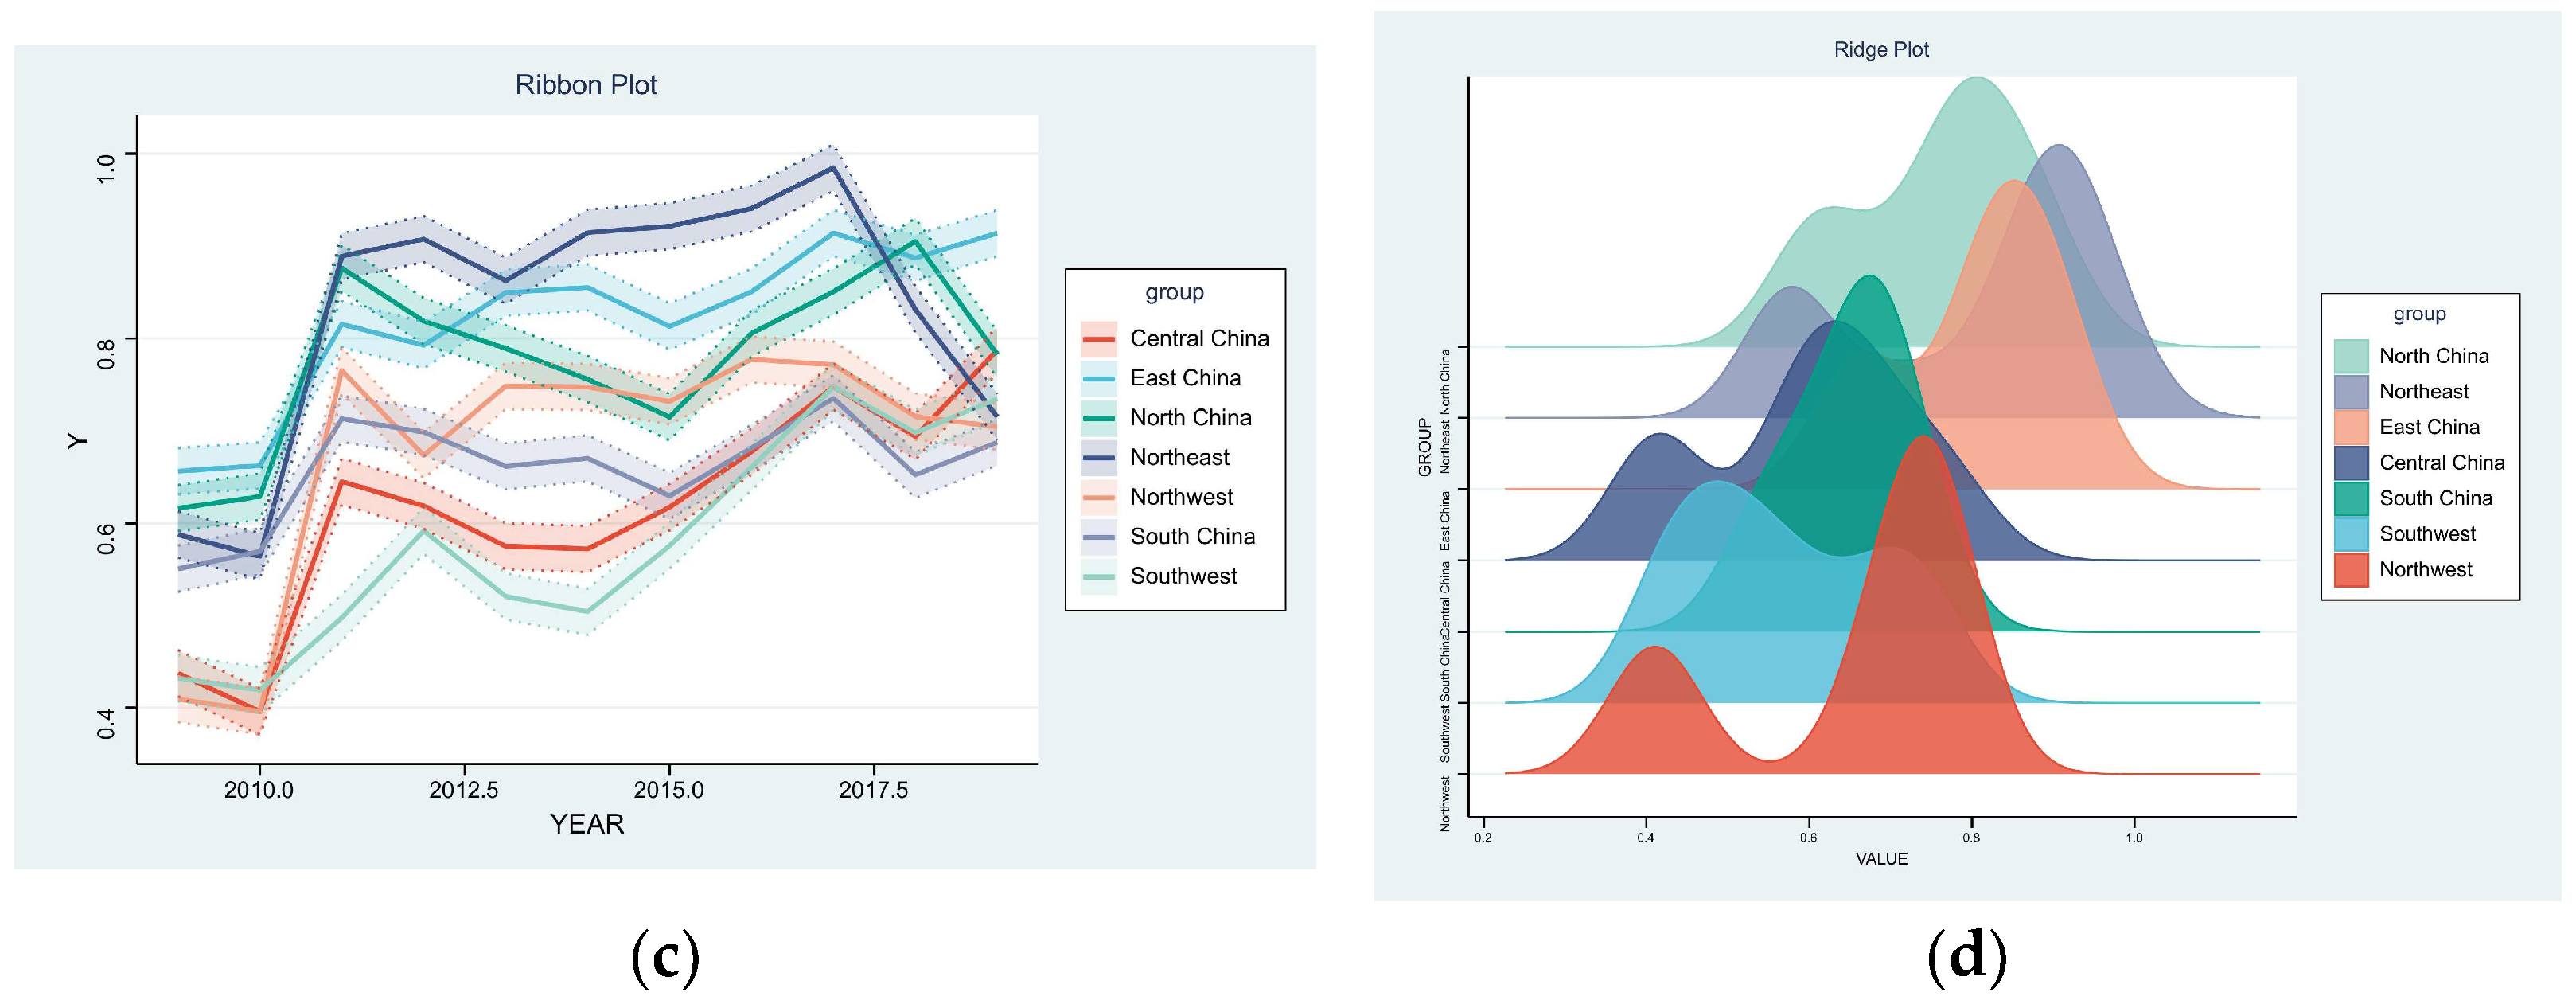
To explore the location factors and the coupling coordination degree of GIE and the economic development level, a point map and ridge map of the coupling coordination degree of GIE and the economic development level of every province and city are drawn to show the diversity in coupling coordination degree of individual regions, as shown in Figure 3 [37].
Overall, there is a phenomenon of unbalanced development among the various regions [38]. From high to low, the degree of regional coupling and coordination is northeast, east, north, northwest, south, central, and southwest. Specifically, the coupling and coordinating level in the eastern, northern, and northeast districts is the highest. The reason may be that these regions have strong technological innovation capacity and strong environmental protection, which can attract high-quality talent to participate in innovation. This is conducive to improving the GIE that continuously builds the connection between green innovation and the economic development level and the coupling and coordination between GIE and the economic development level. The southwest and central regions have the lowest level of coupling coordination, which may be due to the complex terrain, large areas of plateau mountains, lack of technical resources, and the dominance of traditional industries with high energy depletion and heavy contamination. The intensity of scientific research input is insufficient, resulting in low GIE and hindering the improvement of coupling coordination.
Considering the distribution of provinces and cities in each zone, the coupling coordination degree of provinces and cities in the northern district is quite different. The coupling and coordination degree of Beijing and Tianjin is much higher than that of Hebei, Shanxi, and Inner Mongolia, with the largest difference being 0.75. There are also large gaps among the provinces and cities in the eastern region. The coupling coordination degree between the GIE and economic development level in Shanghai is the largest in this district, and that in Zhejiang fluctuates slightly every year but is maintained at the same level. The differences among the three provinces in northeast China are small, with Heilongjiang being the lowest, but the whole region is improving. There is a small gap between different regions in northwest China. The coupling and coordination degree of Qinghai province fluctuates sharply every year, as does that of Xinjiang. In the southern region, Guangxi Province has the lowest coupling cooperative dispatching, and Guangdong Province has the highest, with small annual fluctuations. The coupling and coordination degree of the three provinces and cities in the central zone fluctuates slightly every year but is generally low. The coupling and coordination degree in southwest China is small, and the values for the other three provinces and cities, except Guizhou, fluctuate less. In recent years, Guizhou has gradually grown from the lowest coupling coordination degree to exceed Sichuan and Yunnan provinces, and Chongqing has always been in the highest position.

4. Spatial Correlation Pattern Analysis of Coupling Coordination Degree

According to the geographical spatial relationship of the 30 provinces and cities based on the distance spatial weight, the global Moran’s I is computed using GeoDa software [39]. The results are shown in Table 5. The global Moran’s I are all positive numbers larger than 0, and all pass the once percent significance test, which demonstrates that the Moran’s I is crucial. It has a prominent positive spatial autocorrelation feature.
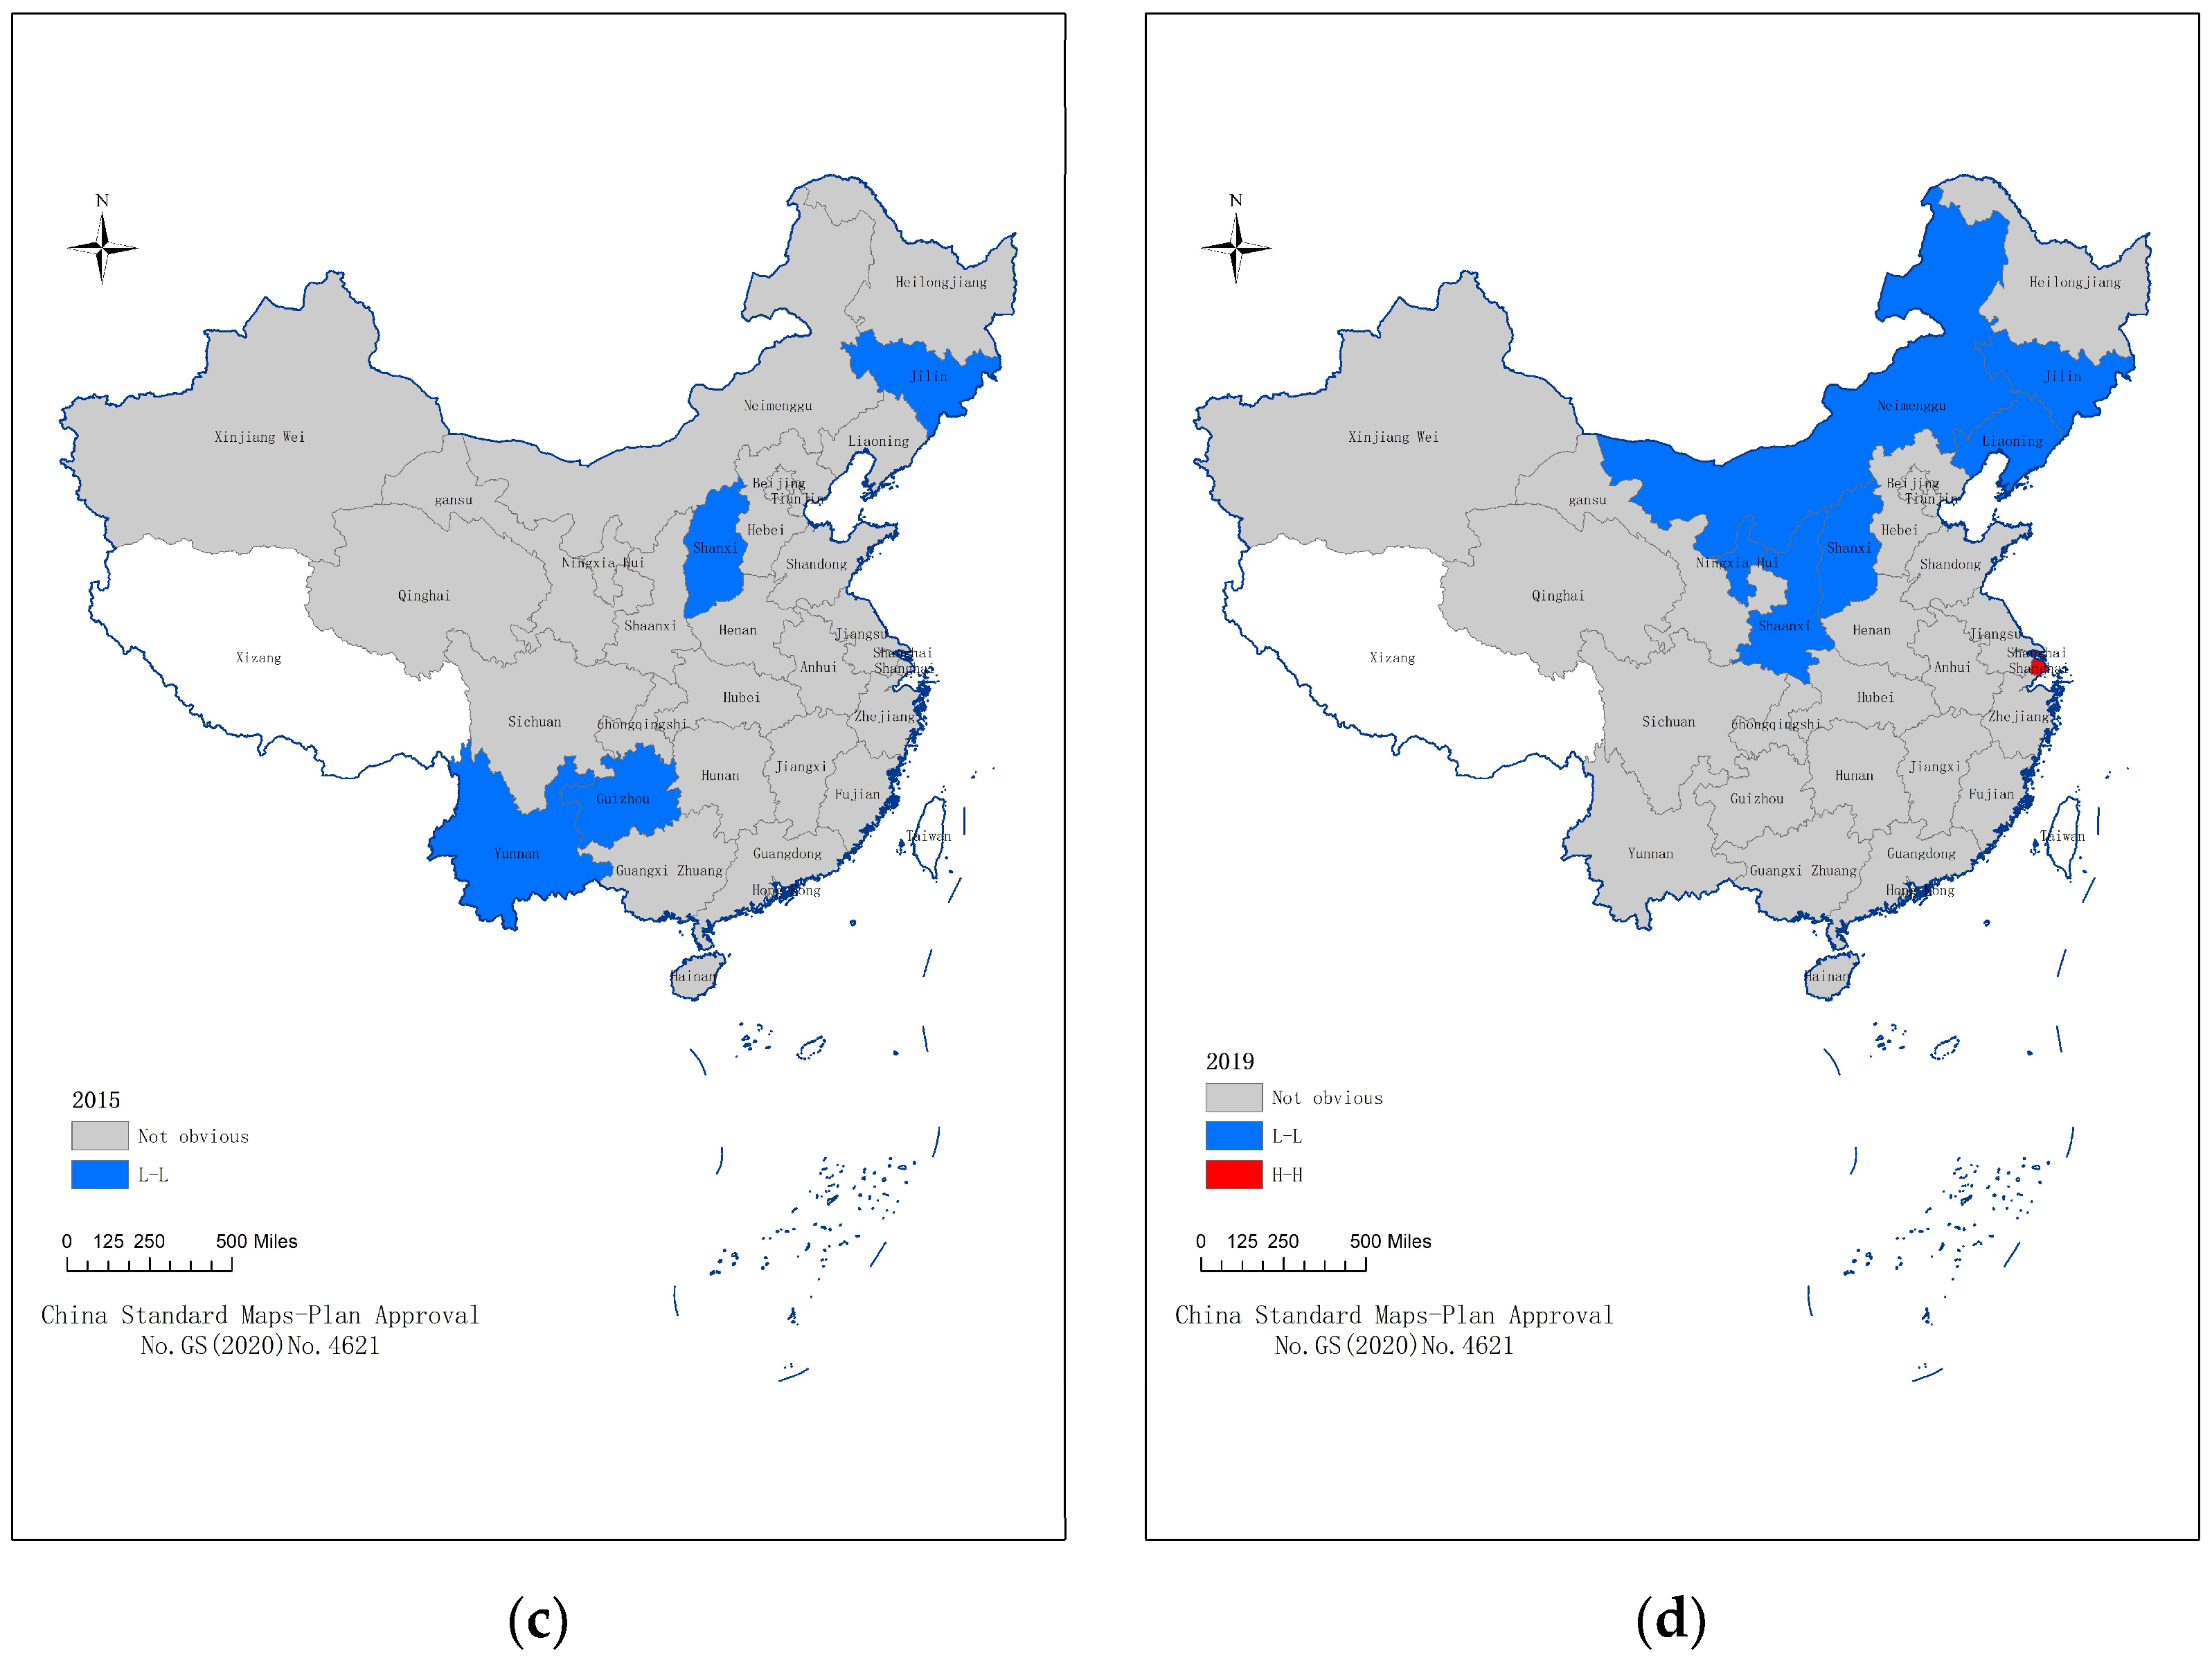
Through local spatial autocorrelation, four years are analyzed: 2008, 2011, 2015, and 2019. The regional spatial autocorrelation index is utilized to further assess the characteristics of spatial agglomeration and regional correlation degree of the 30 provinces and cities. As is shown in Figure 4, the clustering results were spatially processed by ArcGIS software to acquire the LISA clustering map of coupling coordination degree, which more intuitively shows the spatial heterogeneity of coupling coordination degree.
High–high agglomeration area (H–H). The coupling coordination degree between this district and its surrounding ranges is high, and there is little internal spatial differentiation. As shown in the figure, there were provinces and cities of this type in 2011 and 2019. In general, there are, at most, two provinces and cities with high concentration, with a small number. In 2011, there were two provinces and cities, Jiangsu, and Shanghai, but in 2019, only Shanghai was categorized as a high–high agglomeration area. In terms of its distribution, the high–high convergence areas are all located in the east, which is consistent with the change in GIE. The GIE of the provinces and cities categorized as high–high concentration areas have been at a high efficiency stage for a long time, which suggests that the level of GIE has a crucial influence on the level of coupling coordination.
Low–low agglomeration area (L–L). The degree of coupling coordination between these districts and their surrounding areas is low, and the internal spatial differences are large. As shown in the figure, except for in 2011, there are provinces and cities of this type in the other three times. The provinces and cities of this type are dispersed in the central and western districts. In 2008 and 2015, there were two and four provinces and cities, respectively, and in 2019, they increased to six. This type of province or city has a low degree of coupling and coordination, which corresponds to a low level of coordinated development between regions, but it can also indicate that there is a large potential for progress in the development of these provinces and cities. For the purpose of improving the level of coupled and coordinated development of such provinces and cities, it is necessary to enhance exchanges and cooperation with surrounding districts and set a path for development suitable to their own actual conditions.
From the overall evolution pattern, compared with 2008, the number of low–low concentration areas in 2015 and 2019 has increased. By 2019, the number of high–high concentration areas had decreased, and Jiangsu had withdrawn from the high–high concentration areas so that only Shanghai remained in this group. Every year, the provinces and cities in the low–low concentration areas change significantly. In 2008, they were Gansu and Sichuan, and in 2015, they were Yunnan, Guizhou, Shanxi, and Jilin. In 2019, Inner Mongolia, Liaoning, Ningxia, and Shaanxi were included on the basis of 2015, while Yunnan and Guizhou withdrew. Considering the spatial patterns, the high–high convergence regions are mainly in the east, and the low–low convergence regions are basically distributed in the central and western districts. To improve the level of regional coupling and coordination, we ought to take full advantage of the radiation and the driving effect of high and low concentration areas to transform low–low concentration regions into low and high concentration regions. Low–low concentration regions should be the primary focus for development to build the level of coupling coordination.

5. Analysis of Factors Affecting the Coupling Coordination Degree between the GIE and the Economic Development Level

Based on the constructed Tobit model, stata12.0 was used to carry out a full sample test on the significance of each influencing factor. The specific estimation consequences of every independent variable coefficient are presented in Table 6 [40]. It can be seen that, after controlling for the influence of other variables, the positive effect of the number of patents is still significant at one percent. Among the control variables, the degree of openness and the level of education have an important positive effect on the coupling co-scheduling of GIE and the economic development level at one percent, and the entire energy consumption has an important negative effect on the coupling co-scheduling of GIE and economic development level at one percent.
Further, an intermediary effect test was carried out, and the stepwise test of regression coefficient was used. After adding the variable of government support, the effect of the number of patents on the coupling and coordination degree of the GIE and the economic development level is no longer significant, which indicates that government support influences the number of patents effect on the dependent variable in an intermediary role. It can be seen that government support is crucial for patent’s influence on the coupling and coordination of the GIE and the economic development level. Without the government’s support, even if the number of regional patents is large, it may not be high.
It is observed from the above that there exist important discrepancies in GIE, economic development levels, and coupling coordination degrees in the eastern, central, and western regions of China. Therefore, a subregional test was conducted to analyze the influencing factors. The results are presented in Table 7 below. It is observed that patents in the eastern district have a positive influence on the coupling and coordination between GIE and the economic development level, and government support plays an intermediary role between the two. Patents in central China have a negative effect on the coupling and coordination between the GIE and the economic development level, and government support plays an intermediary role between them. Patents in the western region play a positive role, but the intermediary effect of government support is not significant, mainly because government support in the western area has no important impact on it. This may be caused by the large difference and weak strength of government support in the western region. In general, the regression results of eastern, central, and western China are mostly similar, showing that patents have a crucial effect on the coupling and coordination of GIE and economic development levels. It is clear that patent technology promotes the coordinated development of regional GIE and economic development levels and advances steadily. In the eastern and central districts, government support plays a significant intermediary role in the influence path of the patent on the coupling and coordination degree of regional GIE and economic development levels. Government support enables the patent technology to better serve the coordinated development.

6. Conclusions and Suggestions

6.1. Conclusions

Based on the relevant data of 30 provinces and cities in China from 2008 to 2019, this paper uses the coupling coordination model to calculate the coupling co-scheduling of GIE and economic development levels and utilizes the Tobit model to analyze the influencing factors and test intermediary effects. This paper studies the coupling and coordination characteristics and influencing factors of green innovation efficiency and economic development levels of provinces and cities in China, which addresses the following areas and makes a certain contribution to the literature. The paper explores the coupling coordination degree of green innovation efficiency and economic development levels of provinces and cities in China and the differences between them. It shows the spatial and temporal distribution characteristics of green innovation efficiency and economic development levels. Based on the agglomeration analysis of the existing coupling coordination degree, the direction of coordinated development between green innovation efficiency and economic development level is studied. Finally, we determine the coupling coordination factors of green innovation efficiency and economic development level in China. The research summaries are as follows.
(1) The GIE and the level of economic development of all provinces and cities in the country have shown a rising trend. Throughout the study period, Beijing, Hainan, Zhejiang, and Tianjin are at the forefront of the country. Before 2011, the GIE values of Hebei, Xinjiang, Shanxi, and Qinghai were low, but by 2019, they had improved significantly, except for the GIE of Inner Mongolia. From the perspective of economic development, all provinces and cities have developed to varying degrees. Beijing, Tianjin, and Shanghai continue to lead. In 2019, the economic development level of coastal areas such as Zhejiang and Jiangsu were significantly improved. Overall, the GIE and economic development level of each province and city are constantly improving, but there are still significant differences between the east and the west.
(2) There are distinct changes in the coupling and coordination degree between GIE and economic development levels in different provinces and cities. Over time, the number of highly coordinated and high-quality provinces and cities is rising, and the number of basic coordinated provinces and cities is also gradually decreasing. In terms of spatial layout, there is a distribution form of high in the east and low in the west. Especially in the coastal area, the coupling coordination degree and development rates are higher than those in other areas. Due to various reasons, such as geographical location, resource endowment, and policy support, the economic development of coastal districts is better than that of inland areas. Naturally, more funds and resources are invested in green innovation. Green innovation can improve industrial technology and social productivity and reduce production costs, feeding economic development. Therefore, the coupling coordination degree of green innovation and economic development in the eastern and coastal districts are relatively high, whereas those in the western district are comparatively low due to location, resource endowment, and other reasons.
(3) Patents and government support are important opportunities which affect the coupling coordination degree of GIE and economic development levels, and government support plays a significant and complete intermediary role in the influence path of patents. Thus, the important transmission influence of government support is that only when government support is strong can patent technology better serve the coordination of GIE and economic development levels. When further exploring the influence factors by region, it was found that in the east, central, and west of China, patents are still an important factor. In the highly competitive market economy, patents provide technical support for regional green innovation and economic development and facilitate the balanced development of the two systems. In the meantime, in the eastern and central districts, government support has a significant influence on facilitating system coordination and enables patented technology to stimulate balanced development of GIE and economic development levels.

6.2. Suggestions

(1) Identify the essential elements of balanced development and facilitate the coordinated development of green innovation and the economy [41]. First, all provinces and cities should improve their own green innovation ability, optimize the green innovation environment, and gather green innovation talent and innovation capital. We should enhance investment in R&D, accelerate the construction of innovation platforms, and provide important support for cultivating innovative talents and gathering innovative resources. Furthermore, we need to implement new development concepts which include performing well in collaborative innovation and coordination. We need to be green, open, and share resources. It is necessary to integrate low-carbon environmental protection development theory into green innovation development. Economic development can provide R&D capital and other important support for green innovation. Green innovation is also a significant source of improved economic efficiency. We should embrace the goal of economic development, actively cultivate and develop emerging green industries, create strong provinces with green technological innovation, and promote the common development of green innovation capability and economic development levels.
(2) Implement a regional differentiation strategy and efficiently build the green innovation capacity of different regions [42]. Green innovation and economic development are not opposing development processes, but coordinated development processes. Green innovation is not only the endogenous power of economic development but also the booster of economic development. All provinces and cities should, according to their own development conditions and using their own resource advantages, combine with the surrounding provinces and cities to generate synergies between green innovation and economic development. In doing so, they can create new value in the region and reduce the consumption of energy and environmental resources. Regions must effectively improve their green innovation capability, thus facilitating the conversion and accretion of economic structures, optimizing industrial structures, and exploring emerging green industries.
(3) Strengthen cross-regional cooperation and enhance overall coordinated development. A series of policies have been promulgated to encourage cooperation between cities with high-level green innovation and other cities. This can be achieved by promoting inter-regional patent R&D, inter-regional patent rights transfer transactions, establishing innovation alliances between universities and research institutions, and strengthening innovation R&D cooperation among enterprises. This will improve the radiation of urban green technological innovation and promote the spatial optimization of green innovation resources.
(4) Optimize legal and policy environments for promoting green innovation and strengthen the enforcement of intellectual property protection. The government should play an important coordinating role in this process by constantly improving the relevant laws and policy systems, such as local science and technology awards, patent subsidies, intellectual property protection, economic and tax support. The effectiveness of laws and regulations lies in their implementation, and it is necessary to constantly strengthen the level of judicial protection of intellectual property and improve the enforcement of laws and policies. We should improve the environmental regulation policy system and encourage enterprises to strengthen the R&D of green technology innovation through a sequence of environmental regulation policies, such as environmental conservation tax, sewage charges, clean production standards, emission rights trading, and carbon emission trading. Pilot projects to develop low-carbon cities, and ecological civilization construction can promote the Potter effect and realize the green transformation of the economy.

Author Contributions

Conceptualization, G.Y.; data curation, Q.G. and S.C.; methodology, S.C.; resources, Q.G.; writing—review and editing, X.C.; visualization, Q.G.; project administration, G.Y.; funding acquisition, G.Y. All authors have read and agreed to the published version of the manuscript.

Funding

This research was funded by the Science and Technology Research Program of Chongqing Municipal Education Commission (Grant No. KJQN202101122 and No. KJQN201904002), Chongqing Higher Education Society Project (Grant No. CQGJ21B057), Chongqing Postgraduate Education and Teaching Reform Research Project (Grant No. yjg223121), Chongqing University of Technology Higher Education Research Project (Grant No. 2022ZD01), Undergraduate Education Reform Project of Chongqing University of Technology (Grant No. 2021YB21), Strategy Research on Campus Culture Construction of Chongqing University of Technology (2022DJ307), China National Business Education Subjects 14th Five-Year Plan 2022 (Grant No. SKKT-22015) and Chongqing University of Technology Graduate Innovation Project (gzlcx20222030).

Institutional Review Board Statement

Not applicable.

Informed Consent Statement

Not applicable.

Data Availability Statement

The data used to support the findings of this study are available from the corresponding author upon request (e-mail: [email protected]).

Acknowledgments

The authors would like to thank the anonymous reviewers for their valuable comments on drafts of this paper.

Conflicts of Interest

The authors declare no conflict of interest.

References

  1. Ke, H.; Dai, S.; Yu, H. Effect of green innovation efficiency on ecological footprint in 283 Chinese Cities from 2008 to 2018. Environ. Dev. Sustain. 2022, 24, 2841–2860. [Google Scholar] [CrossRef]
  2. Xu, S.; Wu, T.; Zhang, Y. The spatial-temporal variation and convergence of green innovation efficiency in the Yangtze River Economic Belt in China. Environ. Sci. Pollut. Res. 2020, 27, 26868–26881. [Google Scholar] [CrossRef]
  3. Bauhardt, C. Solutions to the crisis? The Green New Deal, Degrowth, and the Solidarity Economy: Alternatives to the capitalist growth economy from an ecofeminist economics perspective. Ecol. Econ. 2014, 102, 60–68. [Google Scholar] [CrossRef]
  4. Mirata, M.; Emtairah, T. Industrial symbiosis networks and the contribution to environmental innovation: The case of the Landskrona industrial symbiosis programme. J. Clean. Prod. 2005, 13, 993–1002. [Google Scholar] [CrossRef]
  5. Beise, M.; Rennings, K. Lead markets and regulation: A framework for analyzing the international diffusion of environmental innovations. Ecol. Econ. 2005, 52, 5–17. [Google Scholar] [CrossRef]
  6. Oltra, V.; Jean, M.S. Sectoral systems of environmental innovation: An application to the French automotive industry. Technol. Forecast. Soc. Chang. 2009, 76, 567–583. [Google Scholar] [CrossRef]
  7. Halila, F.; Rundquist, J. The development and market success of eco-innovations. Eur. J. Innov. Manag. 2011, 14, 278–302. [Google Scholar] [CrossRef]
  8. Albort-Morant, G.; Leal-Millán, A.; Cepeda-Carrión, G. The antecedents of green innovation performance: A model of learning and capabilities. J. Bus. Res. 2016, 69, 4912–4917. [Google Scholar] [CrossRef]
  9. Zhang, Y.; Chen, H.; He, Z. Regional green innovation efficiency and dynamic evolution of Chinese industrial enterprises: A three-stage super-efficiency DEA method based on cooperative game. Environ. Sci. Pollut. Res. 2022, 1–24. [Google Scholar] [CrossRef]
  10. Wang, L.; Ye, W.; Chen, L. Research on Green Innovation of the Great Changsha-Zhuzhou-Xiangtan City Group Based on Network. Land 2021, 10, 1198. [Google Scholar] [CrossRef]
  11. Luo, X.; Zhang, W. Green innovation efficiency: A threshold effect of research and development. Clean Technol. Environ. Policy 2020, 23, 285–298. [Google Scholar] [CrossRef]
  12. Jie, H. Overall optimization model of efficiency and performance of green technology innovation. Sustain. Comput. Inform. Syst. 2020, 30, 100501. [Google Scholar] [CrossRef]
  13. Lv, C.; Shao, C.; Lee, C.-C. Green technology innovation and financial development: Do environmental regulation and innovation output matter? Energy Econ. 2021, 98, 105237. [Google Scholar] [CrossRef]
  14. Ruan, J. An Empirical Study on the Efficiency of Green Innovation of Industrial Enterprises in China. In Proceedings of the 14th International Conference on Innovation Management, Tokyo, Japan, 7–10 February 2017; pp. 582–587. [Google Scholar]
  15. Zhao, T.; Zhou, H.; Jiang, J.; Yan, W. Impact of Green Finance and Environmental Regulations on the Green Innovation Efficiency in China. Sustainability 2022, 14, 3206. [Google Scholar] [CrossRef]
  16. Zhao, B.; Zhong, T.; Zhong, M. Research on Urban Green Innovation Efficiency Measurement and Spatial-temporal Differentiation in Yangtze River Economic Belt Based on DEA-ESDA. In Proceedings of the 8th International Conference on Social Science and Education Research (SSER 2018), Xi’an, China, 18–20 May 2018; pp. 792–798. [Google Scholar]
  17. Wang, K.-L.; Zhang, F.-Q. Investigating the Spatial Heterogeneity and Correlation Network of Green Innovation Efficiency in China. Sustainability 2021, 13, 1104. [Google Scholar] [CrossRef]
  18. Liu, P.; Zhang, L.; Tarbert, H.; Yan, Z. Analysis on Spatio-Temporal Characteristics and Influencing Factors of Industrial Green Innovation Efficiency—From the Perspective of Innovation Value Chain. Sustainability 2021, 14, 342. [Google Scholar] [CrossRef]
  19. Peng, W.; Yin, Y.; Kuang, C.; Wen, Z.; Kuang, J. Spatial spillover effect of green innovation on economic development quality in China: Evidence from a panel data of 270 prefecture-level and above cities. Sustain. Cities Soc. 2021, 69, 102863. [Google Scholar] [CrossRef]
  20. Li, C.; Wan, J.; Xu, Z.; Lin, T. Impacts of Green Innovation, Institutional Constraints and Their Interactions on High-Quality Economic Development across China. Sustainability 2021, 13, 5277. [Google Scholar] [CrossRef]
  21. Li, X.; Lu, Z.; Hou, Y.; Zhao, G.; Zhang, L. The coupling coordination degree between urbanization and air environment in the Beijing(Jing)-Tianjin(Jin)-Hebei(Ji) urban agglomeration. Ecol. Indic. 2022, 137, 108787. [Google Scholar] [CrossRef]
  22. He, D.; Hou, K.; Wen, J.F.; Wu, S.Q.; Wu, Z.P. A coupled study of ecological security and land use change based on GIS and entropy method—A typical region in Northwest China, Lanzhou. Environ. Sci. Pollut. Res. 2021, 29, 6347–6359. [Google Scholar] [CrossRef]
  23. Li, L.; Fan, Z.; Feng, W.; Yuxin, C.; Keyu, Q. Coupling coordination degree spatial analysis and driving factor between socio-economic and eco-environment in northern China. Ecol. Indic. 2022, 135, 108555. [Google Scholar] [CrossRef]
  24. Wan, J.; Li, Y.; Ma, C.; Jiang, T.; Su, Y.; Zhang, L.; Song, X.; Sun, H.; Wang, Z.; Zhao, Y.; et al. Measurement of Coupling Coordination Degree and Spatio-Temporal Characteristics of the Social Economy and Ecological Environment in the Chengdu–Chongqing Urban Agglomeration under High-Quality Development. Int. J. Environ. Res. Public Health 2021, 18, 11629. [Google Scholar] [CrossRef] [PubMed]
  25. Yang, G.; Gui, Q.; Zhang, F.; Gong, G.; Yang, Y. The Temporal and Spatial Characteristics and Influencing Factors of Low-Carbon Economy Efficiency and Science and Technology Development Level in China’s Provinces from the Perspective of Uncoordinated Coupling. Front. Environ. Sci. 2022, 10. [Google Scholar] [CrossRef]
  26. Yang, G.; Zhang, F.; Zhang, F.; Ma, D.; Gao, L.; Chen, Y.; Luo, Y.; Yang, Q. Spatiotemporal changes in efficiency and influencing factors of China’s industrial carbon emissions. Environ. Sci. Pollut. Res. 2021, 28, 36288–36302. [Google Scholar] [CrossRef] [PubMed]
  27. Liu, T.-L.; Song, Q.-J.; Lu, J.; Qi, Y. An integrated approach to evaluating the coupling coordination degree between low-carbon development and air quality in Chinese cities. Adv. Clim. Chang. Res. 2021, 12, 710–722. [Google Scholar] [CrossRef]
  28. Guo, P.; Dong, S.C. Coupling Coordinative Degree of Tourism-Economy-Environment System—Take Resource-Based Cities in Shanxi Province as a Case. Appl. Mech. Mater. 2014, 522–524, 1798–1805. [Google Scholar] [CrossRef]
  29. Yang, G.; Yang, Y.; Gong, G.; Gui, Q. The Spatial Network Structure of Tourism Efficiency and Its Influencing Factors in China: A Social Network Analysis. Sustainability 2022, 14, 9921. [Google Scholar] [CrossRef]
  30. Yang, G.; Gong, G.; Gui, Q. Exploring the Spatial Network Structure of Agricultural Water Use Efficiency in China: A Social Network Perspective. Sustainability 2022, 14, 2668. [Google Scholar] [CrossRef]
  31. Yang, G.; Gong, G.; Luo, Y.; Yang, Y.; Gui, Q. Spatiotemporal Characteristics and Influencing Factors of Tourism–Urbanization–Technology–Ecological Environment on the Yunnan–Guizhou–Sichuan Region: An Uncoordinated Coupling Perspective. Int. J. Environ. Res. Public Health 2022, 19, 8885. [Google Scholar] [CrossRef]
  32. Qiu, Y.; Song, H.; Sheng, J. An Research on Influencing Factors of Urban Land Use Efficiency Based on Tobit Model. IOP Conf. Ser. Earth Environ. Sci. 2021, 768, 012108. [Google Scholar] [CrossRef]
  33. Xiong, G.; Chen, G.; Wu, J.; Wang, Z.; Yu, H.; Fu, T.; Liu, W.; Xu, X.; Hou, G.; Yang, Y.; et al. Identifying the characteristics and potential risk of seawater intrusion for southern China by the SBM-DEA model. Sci. Total Environ. 2022, 844, 157205. [Google Scholar] [CrossRef] [PubMed]
  34. Chang, Y.-T.; Park, H.-S.; Jeong, J.-B.; Lee, J.-W. Evaluating economic and environmental efficiency of global airlines: A SBM-DEA approach. Transp. Res. Part D Transp. Environ. 2014, 27, 46–50. [Google Scholar] [CrossRef]
  35. Li, S.; Du, S. An Empirical Study on the Coupling Coordination Relationship between Cultural Tourism Industry Competitiveness and Tourism Flow. Sustainability 2021, 13, 5525. [Google Scholar] [CrossRef]
  36. Li, J.; Sun, W.; Li, M.; Meng, L. Coupling coordination degree of production, living and ecological spaces and its influencing factors in the Yellow River Basin. J. Clean. Prod. 2021, 298, 126803. [Google Scholar] [CrossRef]
  37. Miao, C.-L.; Duan, M.-M.; Zuo, Y.; Wu, X.-Y. Spatial heterogeneity and evolution trend of regional green innovation efficiency—An empirical study based on panel data of industrial enterprises in China’s provinces. Energy Policy 2021, 156, 112370. [Google Scholar] [CrossRef]
  38. Li, L.; Lei, L.; Han, D. Regional Green Innovation Efficiency in High-End Manufacturing. J. Coast. Res. 2018, 82, 280–287. [Google Scholar] [CrossRef]
  39. Kumari, M.; Sarma, K.; Sharma, R. Using Moran’s I and GIS to study the spatial pattern of land surface temperature in relation to land use/cover around a thermal power plant in Singrauli district, Madhya Pradesh, India. Remote Sens. Appl. Soc. Environ. 2019, 15, 100239. [Google Scholar] [CrossRef]
  40. Albertini, F.; Gomes, L.P.; Grondona, A.E.B.; Caetano, M.O. Assessment of environmental performance in building construction sites: Data envelopment analysis and Tobit model approach. J. Build. Eng. 2021, 44, 102994. [Google Scholar] [CrossRef]
  41. Wang, W.; Zhang, H. Evaluation of Low Carbon Economy Development in China’s Provinces: Based on Entropy-OWA Algorithm and Grey Correlation Improvement TOPSIS. IOP Conf. Ser. Earth Environ. Sci. 2019, 371, 032028. [Google Scholar] [CrossRef]
  42. Wang, Q.; Ren, S. Evaluation of green technology innovation efficiency in a regional context: A dynamic network slacks-based measuring approach. Technol. Forecast. Soc. Chang. 2022, 182, 121836. [Google Scholar] [CrossRef]
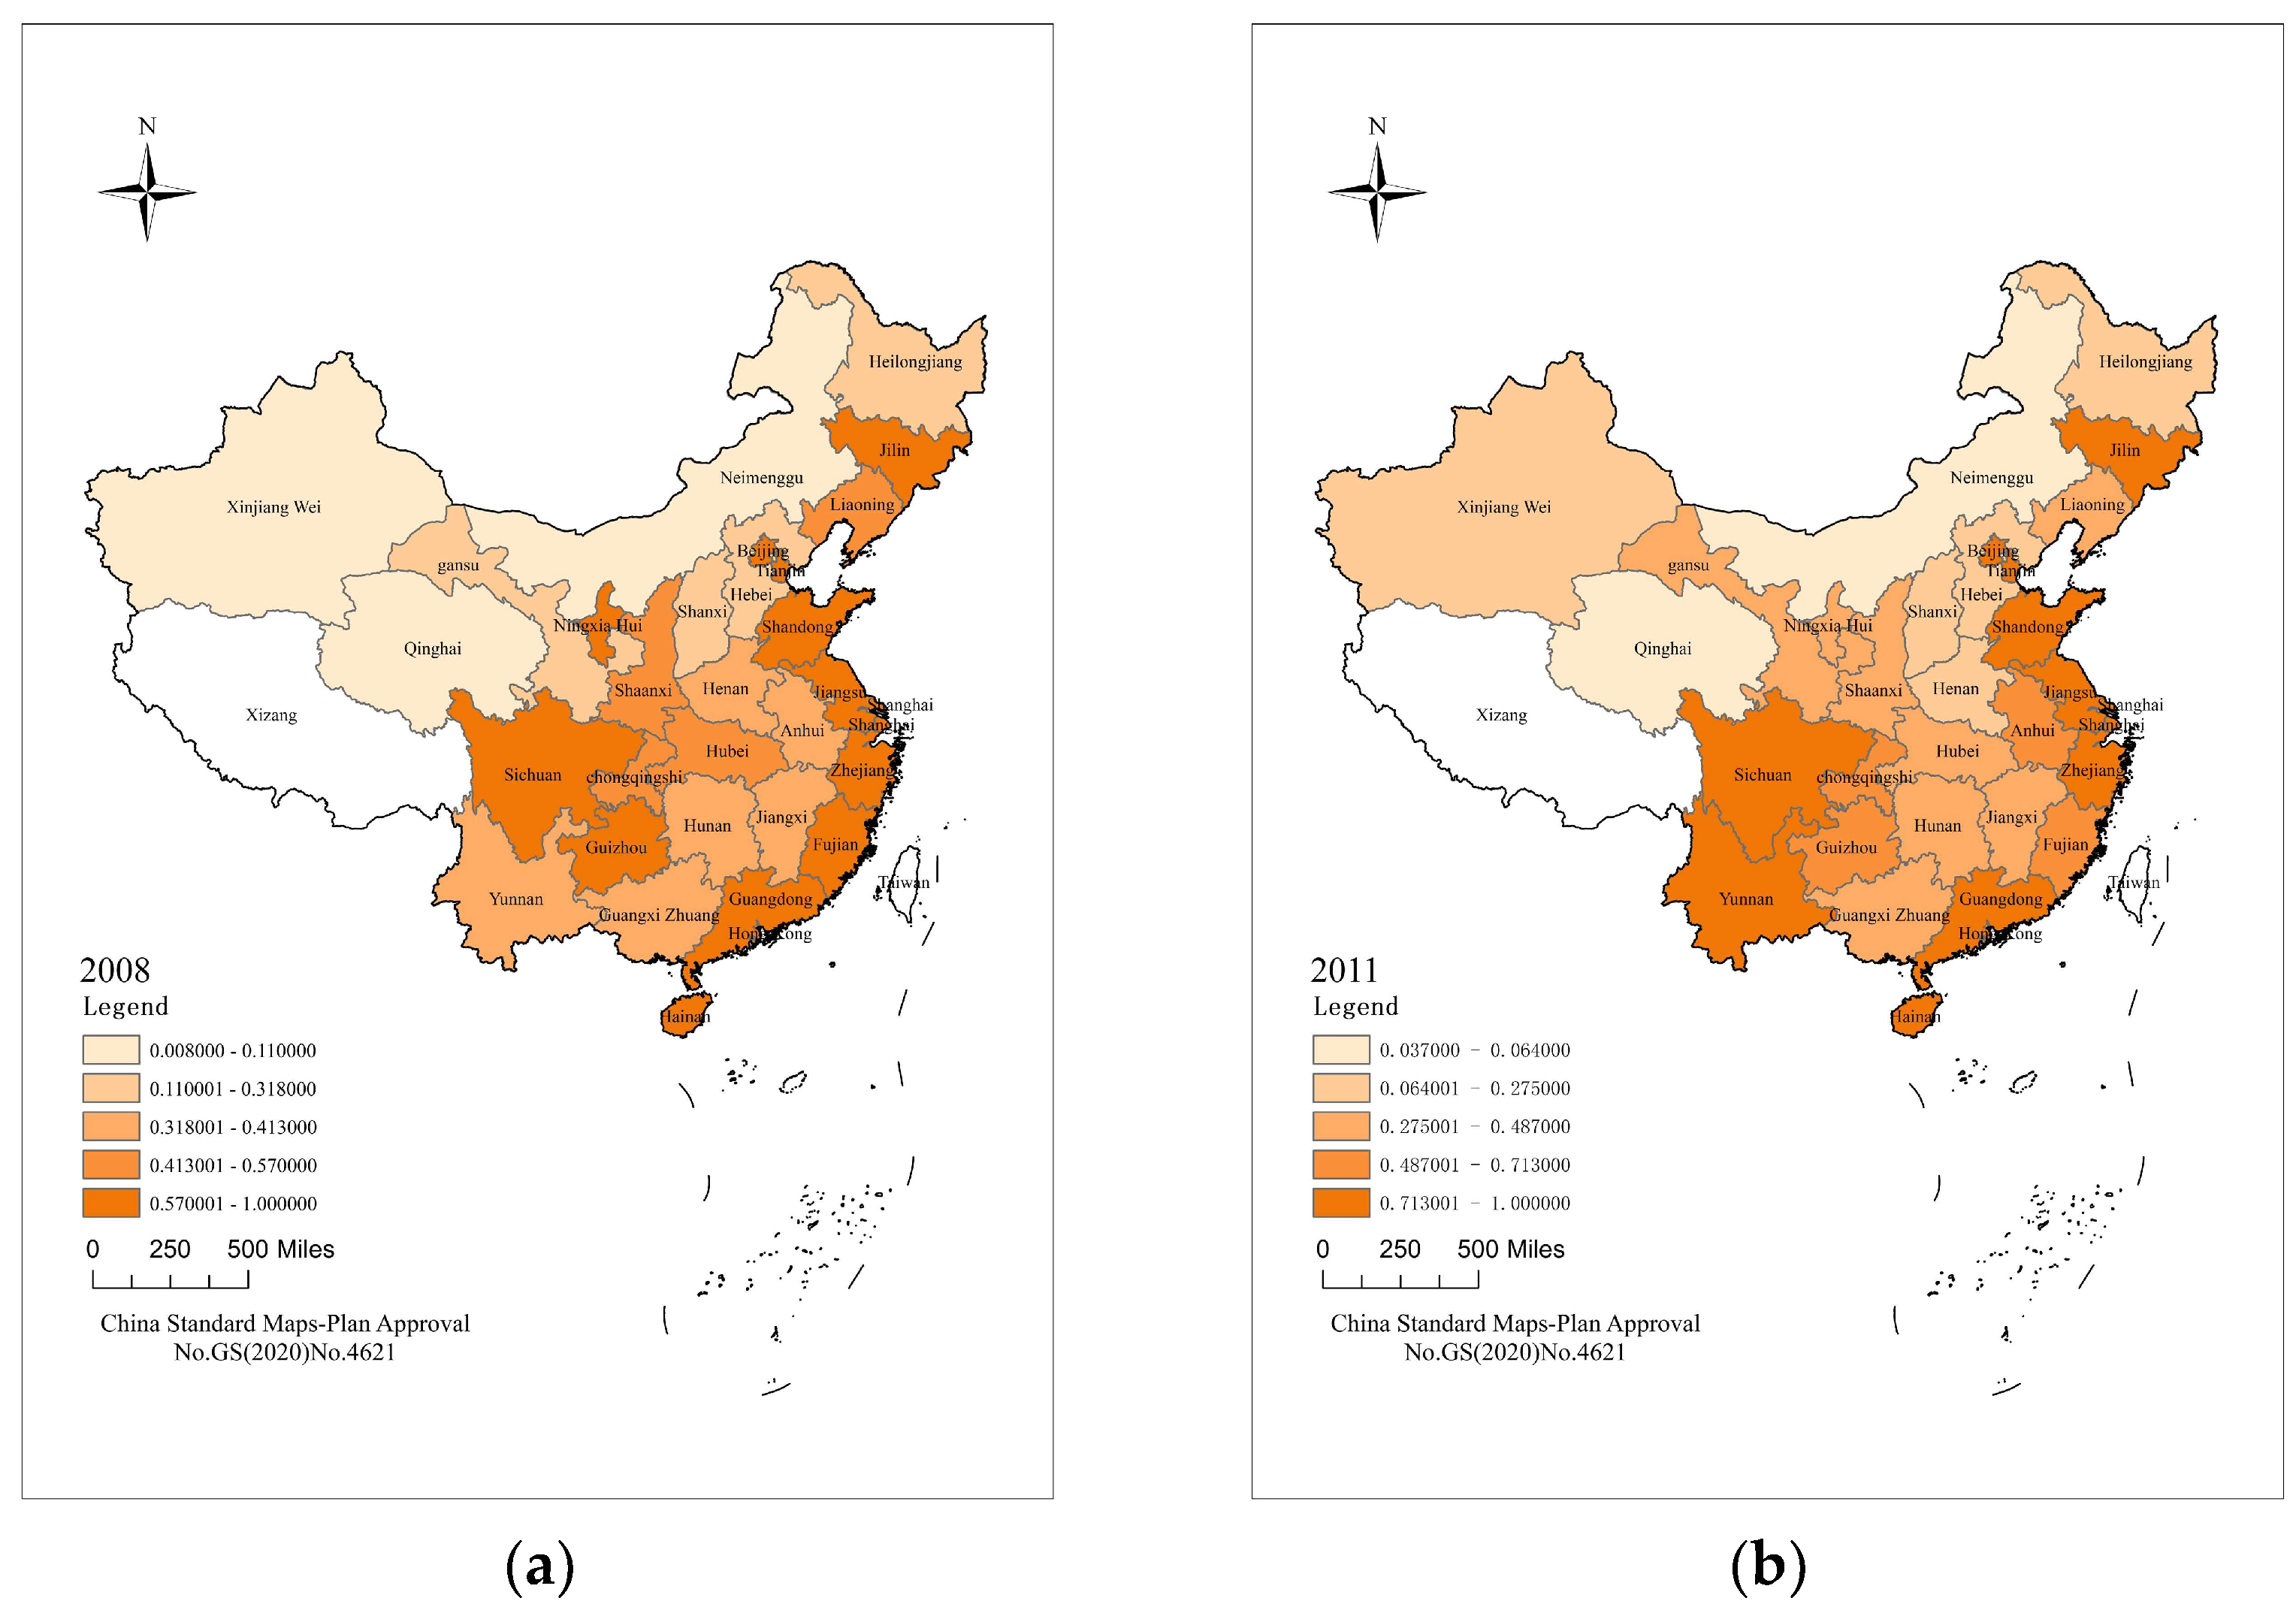
Figure 1. Results for GIE in 30 provinces and cities on the Chinese mainland in the main years. (a) Results for GIE in 2008. (b) Results for GIE in 2011. (c) Results for GIE in 2015. (d) Results for GIE in 2019.
Sustainability 14 14085 g001aSustainability 14 14085 g001b
Figure 2. Spatial and temporal distribution of coupling coordination degree between GIE and the economic development level in 30 provinces and cities on the Chinese mainland in the main years. (a) Spatial and temporal distribution of coupling coordination degree between GIE and the economic development level in 2008. (b) Spatial and temporal distribution of coupling coordination degree between GIE and the economic development level in 2011. (c) Spatial and temporal distribution of coupling coordination degree between GIE and the economic development level in 2015. (d) Spatial and temporal distribution of coupling coordination degree between GIE and the economic development level in 2019.
Sustainability 14 14085 g002
Figure 3. Schematic diagram of coupling coordination degree between GIE and the economic development levels in various regions of China. (a) DotChart Plot of coupling coordination degree between GIE and the economic development levels in various regions of China. (b) Rose Chart of coupling coordination degree between GIE and the economic development levels in various regions of China. (c) Ribbon Plot of coupling coordination degree between GIE and the economic development levels in various regions of China. (d) Ridge Plot of coupling coordination degree between GIE and the economic development levels in various regions of China.
Sustainability 14 14085 g003aSustainability 14 14085 g003b
Figure 4. LISA concentration diagram of coupling coordination degree in the main years. (a) LISA concentration diagram of coupling coordination degree in 2008. (b) LISA concentration diagram of coupling coordination degree in 2011. (c) LISA concentration diagram of coupling coordination degree in 2015. (d) LISA concentration diagram of coupling coordination degree in 2019.
Sustainability 14 14085 g004aSustainability 14 14085 g004b
Table 1. Index system of GIE and economic development levels.
Target LayerCriterion LayerIndicator Layer
GIEGreen innovation investmentNumber of research and development (R&D) institutions
Full-time equivalent of R&D personnel (person/year)
Internal expenditure of R&D funds (10,000 yuan)
Expected output of green innovationNumber of patent authorizations (items)
Number of R&D projects (subjects)
Sales income of new products of high-tech industry (CNY 10,000)
Number of new product development projects in high-tech industry
Unexpected output of green innovationIndustrial wastewater discharge (10,000 tons)
Industrial waste gas emission (100 million standard cubic meters)
Industrial solid waste discharge (10,000 tons)
Economic
development level
Economic strengthPer capita GDP (CNY)
Per capita local fiscal revenue (CNY)
Per capita fixed assets investment (CNY)
Living standardsTotal retail sales of consumer goods per capita (CNY)
Per capita disposable income of urban residents (CNY)
Development structureProportion of output value of secondary industry (%)
Proportion of output value of tertiary industry (%)
Public service expenditurePer capita medical and health expenditure (CNY)
Per capita education expenditure (CNY)
Per capita social security and employment expenditure (CNY)
Table 2. Coupling coordination levels.
CdLevel
0.00–0.20Low coordination
0.20–0.40Basic coordination
0.40–0.50Moderate coordination
0.50–0.80High coordination
0.80–1.00High quality coordination
Table 3. Measurement results of economic development level.
Year2008201120152019
Province
Anhui0.1220.1830.2550.370
Beijing0.3130.4070.5230.761
Fujian0.1630.2330.3240.469
Gansu0.1200.1720.2400.292
Guangdong0.1720.2270.3210.421
Guangxi0.1120.1700.2290.303
Guizhou0.1060.1570.2400.353
Hainan0.1190.1930.2720.371
Hebei0.1320.1820.2450.309
Henan0.1210.1670.2360.313
Heilongjiang0.1350.1890.2460.295
Hubei0.1290.1900.2860.391
Hunan0.1200.1710.2470.331
Jilin0.1520.2150.2850.324
Jiangsu0.1780.2610.3640.482
Jiangxi0.1160.1720.2490.358
Liaoning0.1810.2640.3000.333
Inner Mongolia0.1730.2770.3400.391
Ningxia0.1410.2140.2870.363
Qinghai0.1590.2690.3500.479
Shandong0.1540.2160.3080.357
Shanxi0.1460.1980.2570.328
Shaanxi0.1390.2120.2890.383
Shanghai0.3120.3810.4630.714
Sichuan0.1200.1760.2520.331
Tianjin0.2420.3590.4570.525
Xinjiang0.1350.1980.2770.347
Yunnan0.1170.1670.2320.332
Zhejiang0.1930.2650.3560.502
Chongqing0.1380.2140.2950.410
Table 4. Average level of coupling coordination degree of various provinces and cities from 2007 to 2019.
LevelLow CoordinationBasic CoordinationModerate CoordinationHighly CoordinatedHigh-Quality Coordination
ProvinceNoneGansu, Guangxi, Hebei, Henan, Heilongjiang, Hunan, Inner Mongolia, ShanxiAnhui, Guizhou, Hubei, Jiangxi, Qinghai, Sichuan, YunnanFujian, Guangdong, Hainan, Jilin, Jiangsu, Liaoning, Ningxia, Shandong, Shaanxi, Xinjiang, Zhejiang, ChongqingBeijing
Shanghai
Tianjin
Table 5. Global Moran’s I index of coupling coordination degree.
YearMoran’s IE(I)Z Scorep Value
20080.3455−0.03573.08650.004
20110.3427−0.03573.10650.004
20150.3531−0.03573.32190.004
20190.3328−0.03573.14680.005
Table 6. Regression results of the full sample Tobit model.
Explanatory VariableExplained Variable: GIE and Economic Development Level Coupled Co-Scheduling
Model 1 (Full Sample)
Openness0.1149 ***
(0.0078)
0.0814 ***
(0.0083)
0.0908 ***
(0.0079)
0.0718 ***
(0.0080)
0.0414 ***
(0.0077)
Education level 0.6921 ***
(0.0862)
0.7209 ***
(0.0808)
0.5296 ***
(0.0821)
0.3655 ***
(0.0740)
Total energy consumption (logarithm) −0.7095 ***
(0.0998)
−1.3300 ***
(0.1347)
−0.9867 ***
(0.1233)
Patent 0.4642 ***
(0.0719)
0.1115
(0.0721)
Government support 0.1656 ***
(0.0162)
Likelihood153.8485183.4931207.1553226.9016272.6794
Note: *** represent the significance levels of 1%.
Table 7. Regression results of Tobit model in different regions.
Explanatory VariableExplained Variable: GIE and Economic Development Level Coupled Co Scheduling
Eastern RegionCentral RegionWestern Region
Openness0.0090
(0.0096)
−0.0083
(0.0145)
−0.0030
(0.0144)
Education level0.1610 **
(0.0715)
0.4514 ***
(0.1470)
0.4471 ***
(0.1522)
Total energy consumption (logarithm)−0.9868 ***
(0.1327)
−1.2003 ***
(0.2341)
−1.2286 ***
(0.2540)
Number of patents0.1822 *
(0.0975)
−0.4270 ***
(0.1209)
0.3395 ***
(0.0971)
Government support0.2336 ***
(0.0187)
0.1494 ***
(0.0253)
0.0324
(0.0389)
Likelihood172.8835111.150192.3918
Note: *, **, and *** represent the significance levels of 10%, 5% and 1%, respectively.
Publisher’s Note: MDPI stays neutral with regard to jurisdictional claims in published maps and institutional affiliations.