Abstract
This study aims to examine the impact of using basalt macro-fibers (BMF) on characteristics of concrete made with recycled concrete aggregates (RCA). Test variables included the initial concrete grade (normal- and high-strength concrete (NSC and HSC)), RCA replacement percentage (30 and 60%), and BMF volume fraction (νf = 0.5 to 1.5%). The compressive strength reduction in the plain concrete caused by RCA was sensitive to the RCA replacement percentage rather than the initial concrete grade. The splitting and flexural strength reductions of the plain HSC caused by RCA were more significant than those of their NSC counterparts. The use of BMF compromised the concrete workability. Such a detrimental effect increased with the BMF content and was more pronounced for the HSC with 60% RCA. Reinforcing of RCA-based concrete with BMF tended to improve the mechanical properties. In some instances, the use of BMF at νf > 1% caused a decay in the strength gain. The addition of BMF to RCA-based concrete had a potential to fully restore the original splitting and flexural strengths of plain concrete mixtures made with natural aggregates (NA). The increase in the compressive strength of the RCA-based concrete caused by BMF was, however, not sufficient to fully restore the original strength of the NA-based plain concrete. The resistances to water penetration and abrasion of the RCA-based concrete improved by up to 17% and 47%, respectively, due to the addition of BMF. Idealized tensile softening laws were established for RCA-based concrete reinforced with BMF.
1. Introduction
Partial or full demolition of old reinforced concrete (RC) structures produces excessive amounts of construction and demolition waste (CDW) [1]. Successful reuse of RCA obtained from CDW in construction supports the concepts of circular economy and environmental sustainability [2,3,4,5,6]. Replacement of NA with RCA would, however, produce concrete with inferior properties [7,8]. Different types of fibers have a potential to offset the probable strength degradation caused by RCA [9,10,11,12,13,14,15,16,17,18,19,20]. Surface corrosion of steel fibers is considered a drawback that might diminish the sustainability of RC structures in harsh environments [11]. In such a case, nonmetallic fibers, such as nylon (NF), polypropylene (PPF), glass (GF), and basalt fibers (BF), could be considered a viable alternative [21,22,23].
The workability of RCA-based concrete reinforced with nonmetallic fibers is inferior to that of their plain counterparts [12,13]. Fang et al. [12] reported a 65% reduction in the slump of concrete with 50% RCA due to the addition of BF with a length (l) of 18 mm, diameter (d) of 15 µm, and Young’s modulus (Ef) of 89 GPa, at a volume fraction (νf) of 0.2%. Wang et al. [13] reported that the inclusion of BF (l = 32 mm, d = 15 µm, Ef = 100 GPa) into concrete with 50% RCA at νf of 0.1% resulted in a 33% slump reduction.
In terms of the compressive strength, Wang et al. [13] reported an 18% strength gain for concrete with 50% RCA due to the inclusion of BF at νf of 0.1%. No additional compressive strength gain was recorded at higher BF volume fractions. Katkhuda & Shatarat [14] observed a 9% compressive strength gain for concrete with 20% RCA due to the addition of BF (l = 18 mm, d = 16 µm, Ef = 89 GPa) at νf of 1%. Ali et al. [15] observed that the inclusion of GF (l = 6–18 mm, d = 14 µm, Ef = 72 GPa) at νf of 0.5% enhanced the compressive strength of concrete with 100% RCA by 9%. According to Lee [16], the compressive strength of concrete made with 100% RCA increased by 86%, when NF (l = 19 mm, d = 23 µm, Ef = 5 GPa) were added at νf of 0.12%. Meesala [18] found that the addition of woolen fibers (l = 50 mm, d = 1 mm) at νf of 0.18% increased the compressive strength of concrete with 50% RCA by 20%. Ahmed et al. [24] reported 10–25% compressive strength gains for concrete made with 50% RCA due to the addition PPF (l = 12 mm, Ef = 3–3.5 GPa) at νf of 0.15–0.6%. Contrarily, Fang et al. [12] observed that the inclusion of BF slightly decreased the compressive strength of concrete made with 50% RCA.
Some researchers [15,16,18] reported an improvement in the splitting tensile strength (fsp) of RCA-based concrete due to the addition of nonmetallic fibers, whereas others [12,19] reported a strength reduction. Ali et al. [15] reported that the inclusion of GF at νf of 0.25 and 0.5% enhanced fsp of concrete with 100% RCA by 18 and 23%, respectively. A higher GF content of νf = 0.75% did not result in an additional improvement in fsp. According to Lee [16], adding NF at νf of 0.12% enhanced fsp of concrete made with 100% RCA by 88%. Meesala [18] reported that the use of GF at νf of 0.16% raised fsp of concrete made with 50% RCA by 18%. On the other hand, Fang et al. [12] reported 7–16% reductions in fsp of concrete made with 100% RCA due to the addition of BF at νf of 0.05–0.2%. Dong et al. [19] also reported a 33% reduction in fsp of concrete made with 50% due to the inclusion of BF (l = 15–19 mm, d = 13 µm, Ef = 93 GPa) at νf of 0.1%.
Conflicting results have been reported on the effect of nonmetallic fibers on the flexural (rupture) strength (fr) of concrete made with RCA. Wang et al. [13] reported a detrimental effect of BF (νf = 0.1%) on fr, where a reduction of up to 18% was recorded for concrete made with 50% RCA. Katkhuda and Shatarat [14] reported an increase in fr of 4–61% for concrete with 20% RCA due to the addition of BF at νf of 0.1–1.5%. Ali et al. [15] found that adding GF at νf of 0.25 improved fr of concrete with 100% RCA by 34%. A declining trend of fr was recorded at higher νf values of 0.5 and 0.75%, noting that a 28% strength gain was maintained at νf of 0.75%. Das et al. [20] also found that adding PPF (l = 12 mm, d = 25–40 µm, Ef = 4 GPa) to concrete with 100% RCA at νf of 0.5% improved fr by 17%, whereas only 9 and 1% strength gains were recorded νf of 0.5 and 0.75%, respectively.
The ultrasonic pulse velocity (UPV) test is useful to estimate the quality of concrete, where higher UPV values indicate less voids [25]. Lee [16] reported a 24% increase in the UPV of concrete made with 100% RCA when NF were added at νf of 0.12%. Das et al. [20] reported that the addition of PPF had no noticeable effect on the UPV of RCA-based concrete. Artificial neural network can be used to predict the mechanical characteristics of sustainable concrete mixtures such as those containing supplementary cementitious materials based on test data [26]. Numerical simulation and analysis of RC structures made with RCA and nonmetallic fibers not only requires characteristic strength data but also information about the tensile softening behavior. Such a tension function can be obtained through an inverse analysis of flexural test data of tested concrete specimens [27,28,29,30,31,32].
Despite the large number of studies on the behavior of concrete made with RCA and nonmetallic fibers, the interaction between the initial concrete grade, the RCA replacement percentage, fiber content, and properties of the concrete has received little attention. Little effort has been devoted to the development of a tensile softening law for concrete with RCA and BMF. An idealized relationship that can describe the post-cracking behavior of concrete made with RCA and different BMF volume fractions is needed.
2. Research Significance
This research offers new characterization test data for concrete made with RCA and BMF. New idealized tensile softening laws for RCA-based concrete reinforced with BMF are developed. Findings of this study would assist practitioners and researchers in simulating the behavior of BMF-reinforced structural members made with RCA. Outcomes of this study would contribute to the widespread use of RCA in the construction industry, thus promoting the concepts of the circular economy and environmental sustainability.
3. Experimental Program
Eighteen concrete mixtures were prepared (Table 1). The mix design method of ACI 211.1 [33] was utilized to obtain proportions of the NA-based NSC and HSC mixtures at target cylinder compressive strengths (f’c) of 30 and 50 MPa, respectively. Trail mixes were then examined with different dosages of superplasticizer (SP), obtained from BASF, Abu Dhabi, UAE, to achieve a slump of approximately 200 mm for the NA-based NSC and HSC. The mixtures were divided into two groups based on the concrete grade. Other test variables were the RCA replacement mass percentage (30 and 60%) and the BMF volume fraction (0.5, 1.0, and 1.5%). The concrete mixtures were identified as x-Ry-B-z, where x represents the concrete grade (N for NSC and H for HSC), Ry refers to an RCA replacement percentage of y%, B refers to BMF, and z denotes the value of νf (%). For example, N-R30-B-1.0 denotes a mixture from the NSC group with 30% RCA and νf of 1.0%.

Table 1.
Mixture proportioning.
3.1. Materials
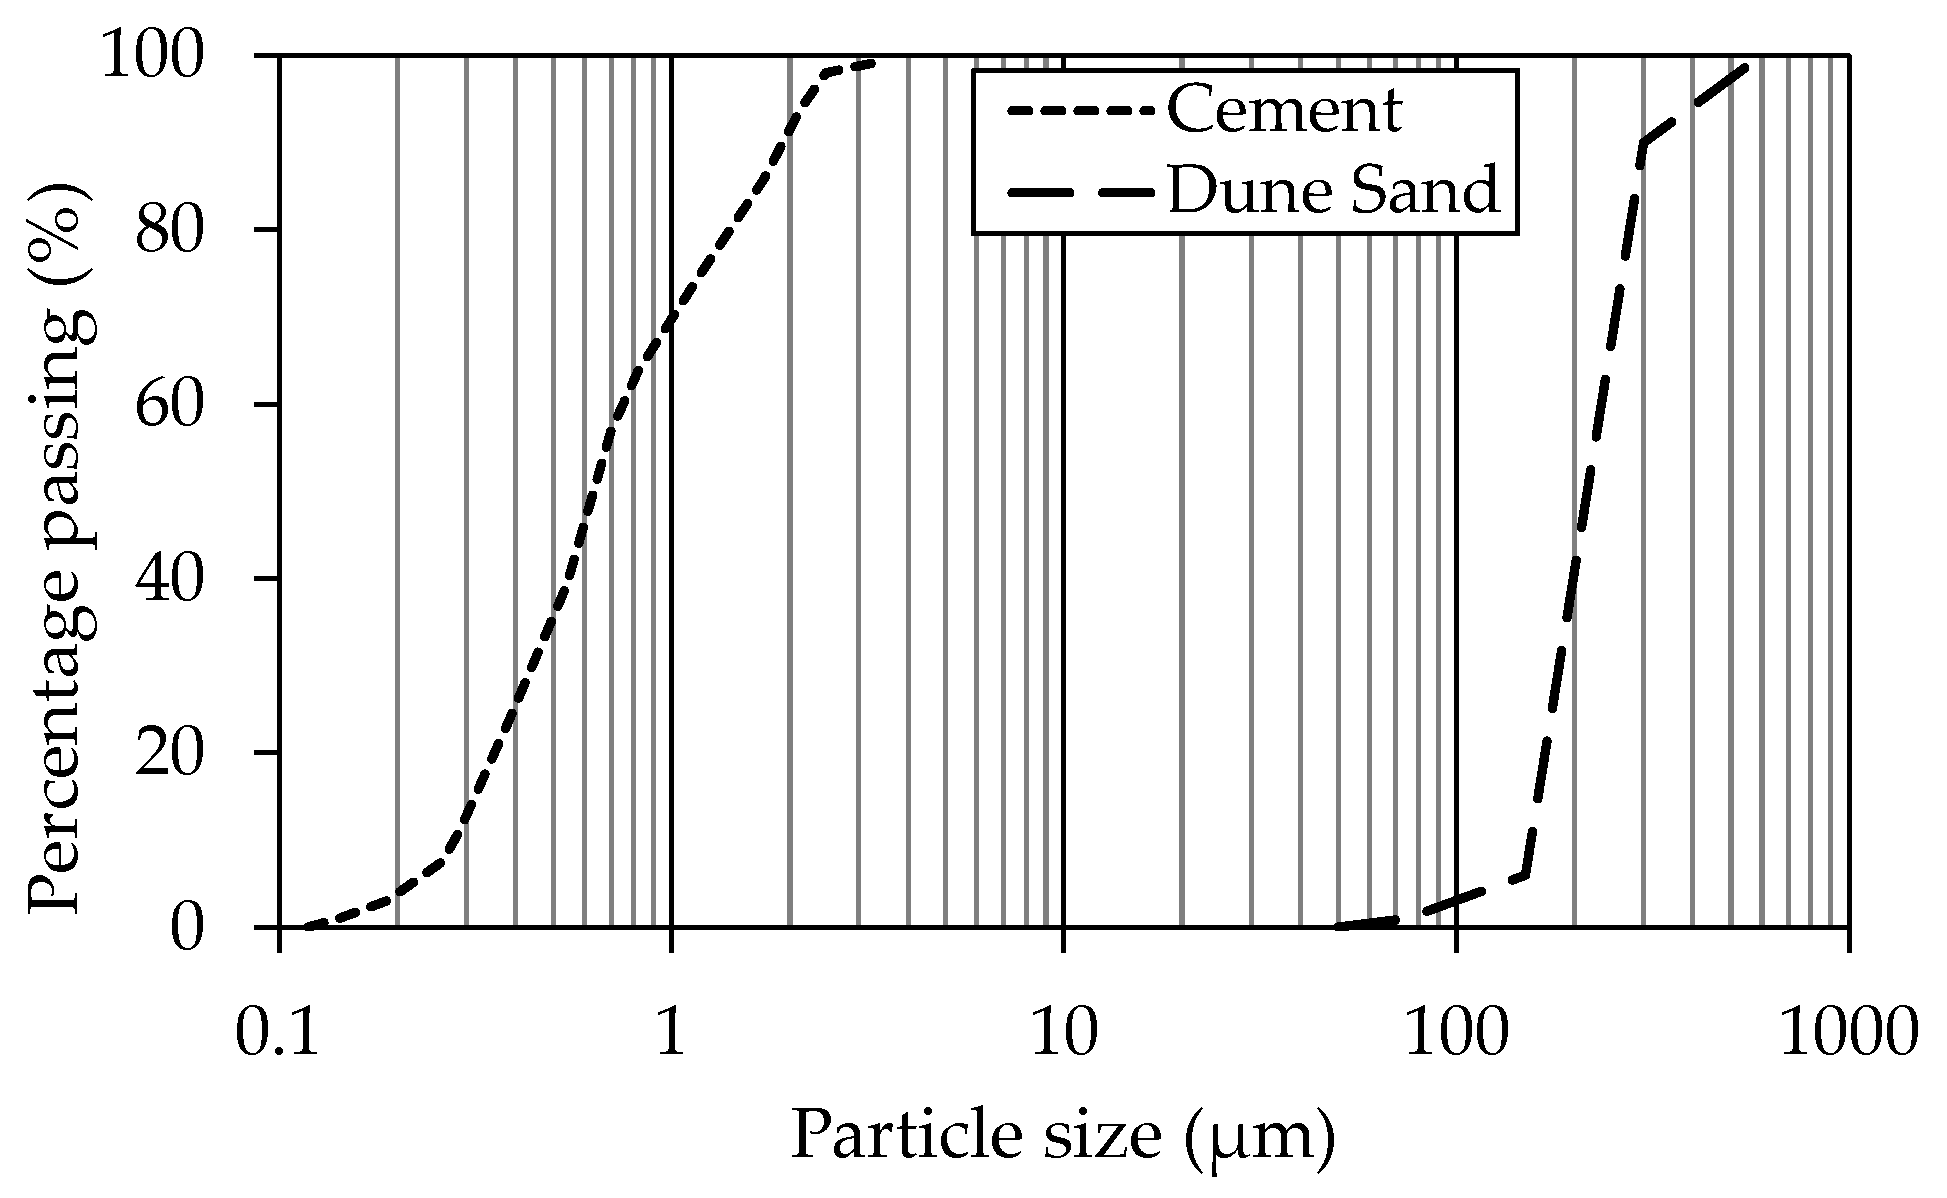
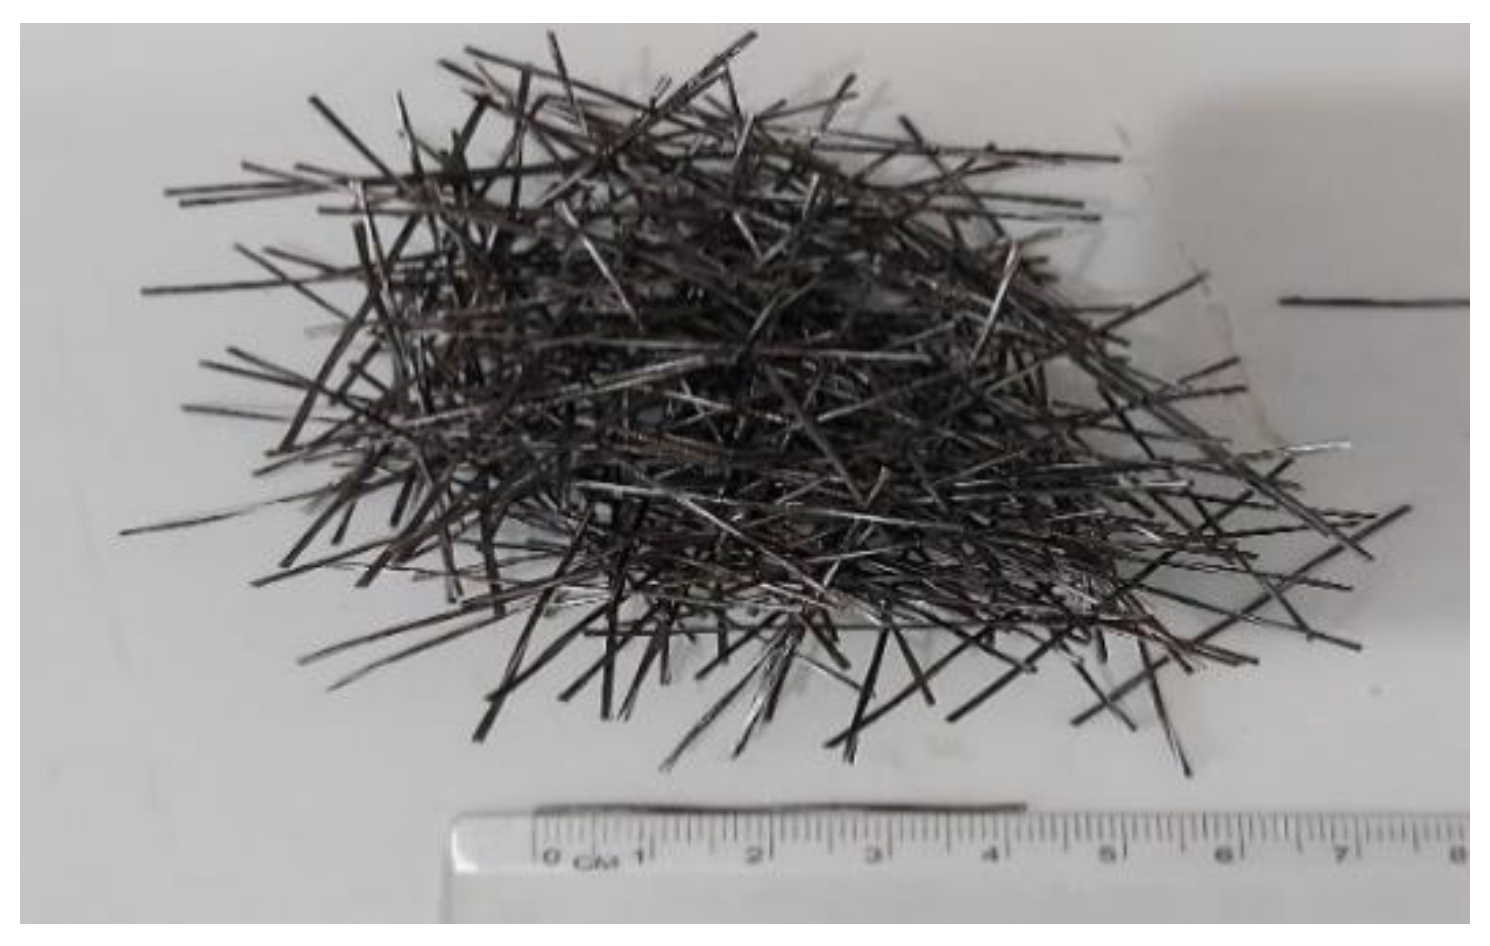
The cementitious material used in the concrete mixtures was ASTM Type-I Ordinary Portland Cement [34], obtained from Emirates Cement Factory in Al Ain, UAE. As sustainable fine aggregates, desert dune sand (DS), obtained from Al Ain Municipality in Al Ain, UAE, was used. Figure 1 depicts grain size analysis curves of the cement and DS. The grain size analysis of the cement was done using Beckman Coulter Particle Size Analyzer (LS 13 320 XR), manufactured by BECKMAN COULTER, Brea, CA, USA. The NA, obtained from Stevin Rock in Ras Al Khaimah, UAE, included crushed dolomitic limestone with a nominal maximum size (NMS) of 19 mm. The RCA, obtained from Al Dhafra Recycling Plant, Abu Dhabi, UAE, had an NMS of 25 mm. The recycling plant utilizes concrete of demolished structures with an unknown concrete strength to produce RCA. Table 2 lists the physical properties of the aggregates. The water absorption, soundness volume change, and abrasion mass loss of the RCA were higher than those of the NA by 16.5, 2.3, and 2.0 folds, respectively. The inferior properties of the RCA are owed to the presence of old adhered porous mortar around the virgin aggregate that weakened their soundness and increased their porosity. The specific gravity, fineness modulus, surface area, and dry-rodded density of the RCA and those of the NA were slightly different (difference < 9%). The BMF, obtained from ReforceTech AS, Ryken, Norway, had a length of 43 mm, diameter of 0.72 mm, density of 2.10 g/cm3, elastic modulus of 44 GPa, and tensile strength of 900 MPa [35]. Basalt fibers are made from melted volcanic basalt rocks, transformed into filaments, then assembled into twisted chopped basalt strands [35]. Basalt fibers have a high temperature and alkaline resistance, higher tensile strength than that of the E-glass and greater failure strain than that of the carbon fibers [36,37]. They are cheaper than their counterpart glass and carbon fibers [38]. Basalt fibers are light, non-corrosive, non-magnetic, non-conductive, non-toxic, and ecofriendly [38,39]. Such properties make them suitable for a sustainable construction. The physical appearance of the aggregates and BMF are shown in Figure 2 and Figure 3, respectively.
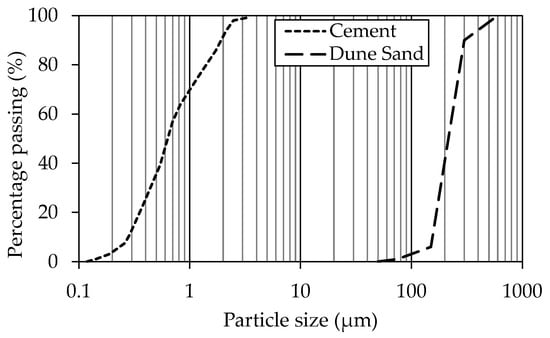
Figure 1.
Grain size analysis curves of cement and dune sand.

Table 2.
Physical properties of materials.

Figure 2.
Physical appearance of aggregates: (a) NA; (b) RCA; (c) DS.
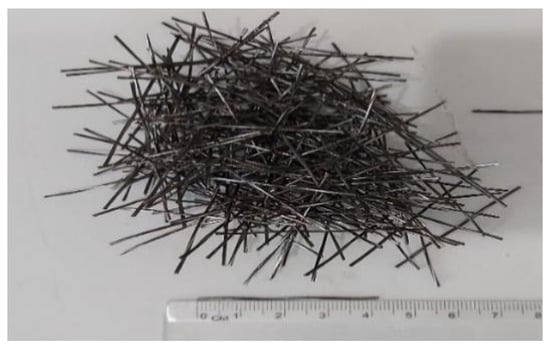
Figure 3.
Physical appearance of BMF.
3.2. Mixture Procedure and Testing Methods
The RCA were placed in a saturated surface dry (SSD) condition into the mixer. The DS, cement, and NA (SSD condition) were then added and mixed with the RCA for 3 min. Three minutes later, tap water containing SP was added and mixed with the ingredients. The last step included adding and mixing of the BMF with other components. The concrete samples were cast into the molds as per ASTM C 31 [45]. The molds were vibrated for 5 s after placing each concrete layer using an electrical vibrating table. The specimens were covered with polyethene plastic sheets and demolded after 24 h, then subjected to water curing for 28-days. The investigated characteristics, testing standards, specimen details, and apparatus features are provided in Table 3. Mechanical properties tests were conducted on 3–5 replicate specimens, whereas the water absorption and abrasion durability tests were conducted on 3 replicates. The workability and other durability characteristic tests were conducted on one sample. Figure 4 and Figure 5 show typical mechanical and durability tests in progress.

Table 3.
Testing method and specimen details.

Figure 4.
Typical mechanical tests in progress: (a) cube compression test; (b) cylinder compression test; (c) splitting tensile test; (d) flexural test.

Figure 5.
Typical durability tests in progress: (a) Los Angeles abrasion; (b) ultrasonic pulse velocity.
4. Results
4.1. Workability
Figure 6 and Figure 7 show the effect of the BMF on the workability of the NSC and HSC, respectively. The slump and vebe time of the plain NSC mixture with 30 and 60% RCA were insignificantly different from those of the benchmark mixture N-R0-B-0.0. The plain HSC mixtures with 30 and 60% RCA exhibited, however, slump reductions of 12 and 26%, relative to those of the NA-based mixture H-R0-B-0.0. The vebe time value of the HSC with 60% RCA was 17% higher than that of H-R0-B-0.0. It is evident that the slump decreased and the vebe time increased with an increase in νf for both NSC and HSC. Figure 6a shows that the slump of the BMF-reinforced NSC with 30 and 60% RCA reduced almost at the same rate. Similarly, the rate of increase in the vebe time of the BMF-reinforced NSC was at 30 and 60% RCA was marginally different (Figure 6b). The slump of the HSC with 60% RCA tended, however, to reduce at a higher rate when BMF were added at νf > 0.5 (Figure 7a). The vebe time of the BMF-reinforced HSC mixtures with 60% RCA was higher than that of their counterparts with 30% RCA (Figure 7b). The slump reductions of the NSC and HSC with 30% RCA caused by BMF were in the range of 5–32% and 11–26%, respectively. At 60% RCA, the respective slump reductions were 24–51% and 13–84%.

Figure 6.
Effect of BMF on workability of NSC: (a) slump; (b) vebe time.

Figure 7.
Effect of BMF on workability of HSC: (a) slump; (b) vebe time.
4.2. Mechanical Characteristics
4.2.1. Compressive Strength and Modulus
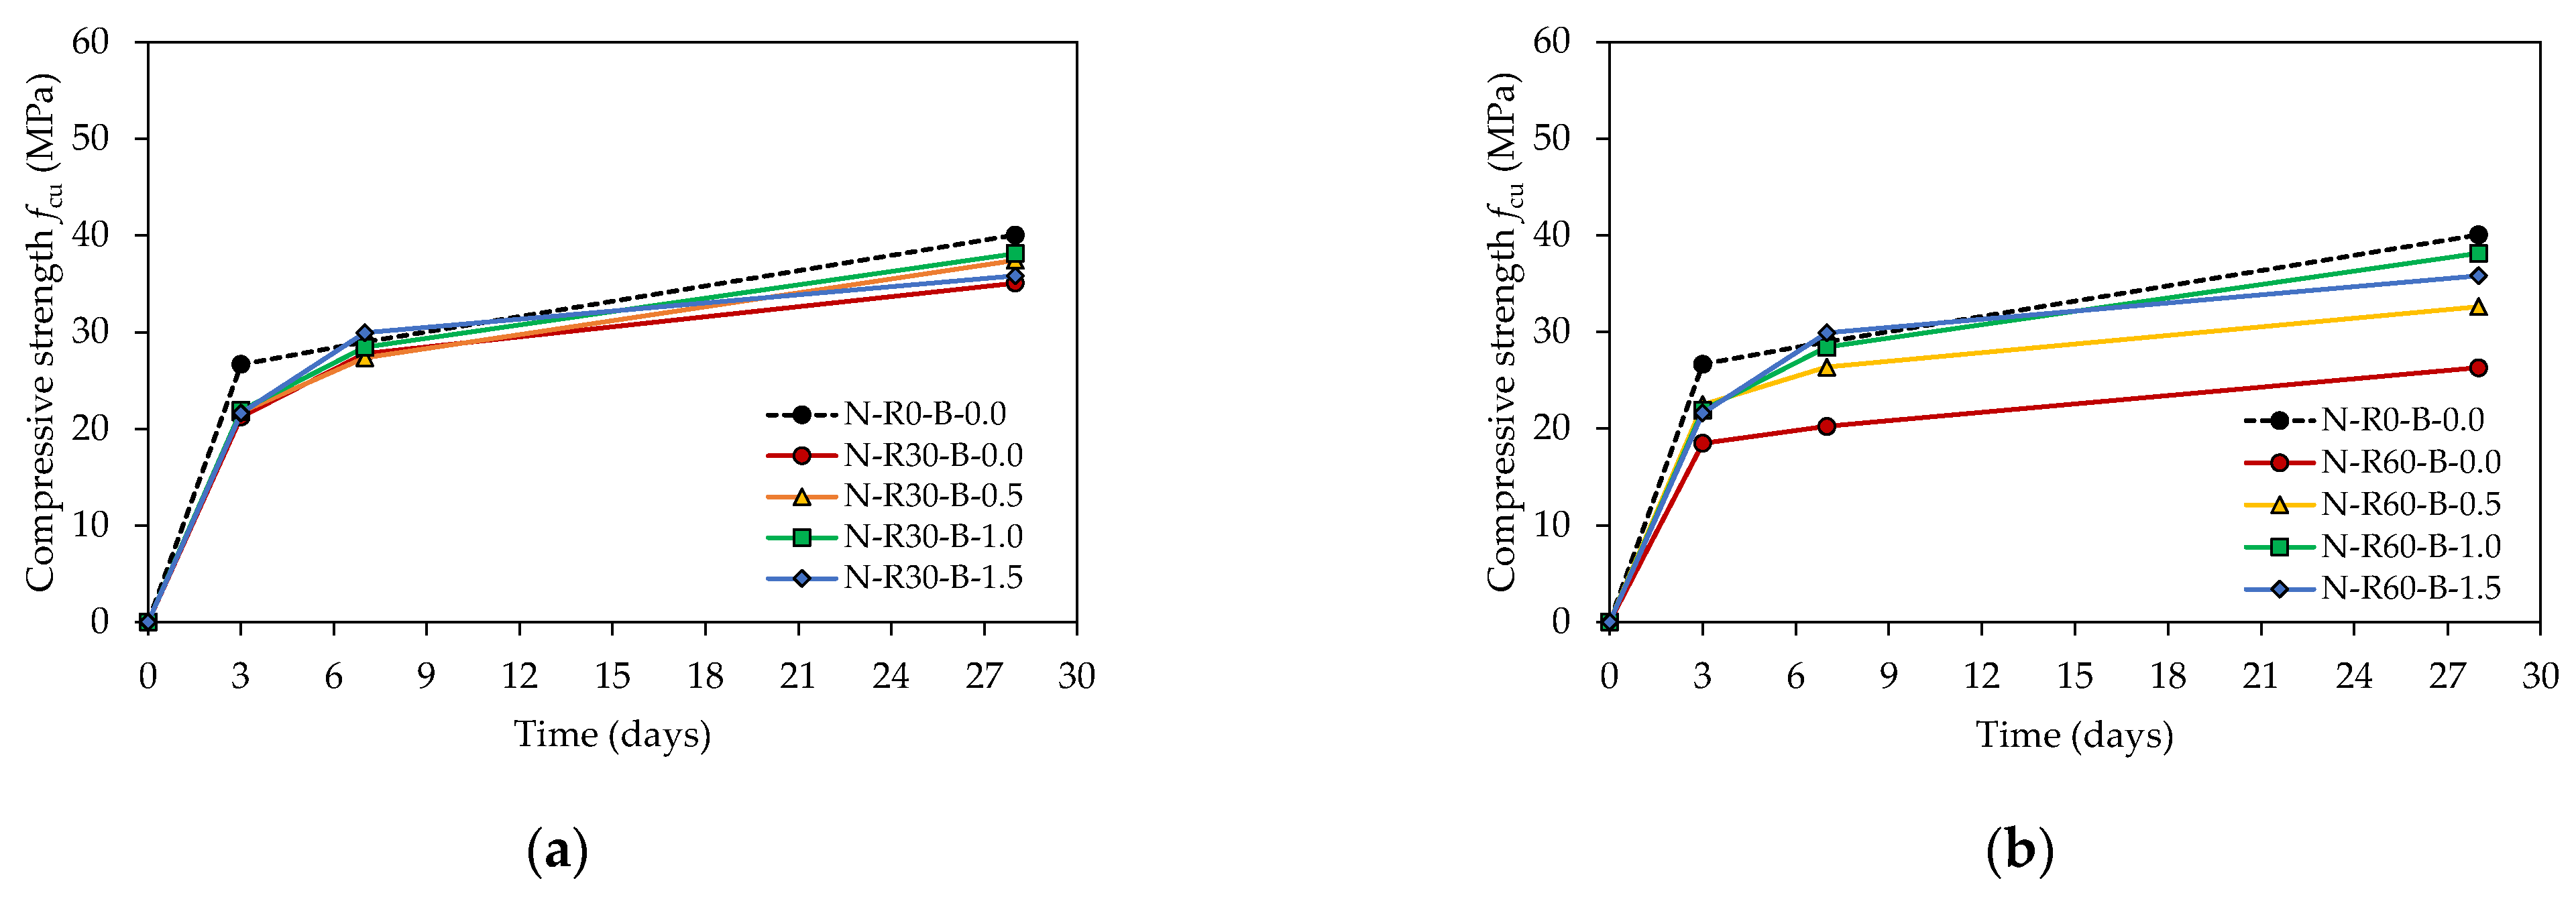
Figure 8 shows pictures of tested cube specimens. The plain cube specimens with RCA tended to show concrete spalling and disintegration at failure (Figure 8a). The specimens reinforced with BMF exhibited signs of cracks at failure but did not disintegrate into the chips (Figure 8b). Figure 9 illustrates the development of the cube compressive strength for the NSC mixtures at 3, 7, and 28 days. At 30% RCA, all concrete mixtures exhibited a similar strength after 3 days of curing that was 19% lower than that of N-R0-B-0.0 (Figure 9a). As the time progressed, the plain concrete mixture with 30% RCA (N-R30-B-0.0) showed a lower cube compressive strength than that of their counterparts with BMF. At 28 days of curing, the cube compressive strength of N-R30-B-0.0 was approximately 12% lower than that of N-R0-B-0.0. The BMF-reinforced NSC with 30% RCA exhibited a maximum strength gain of 9% at νf of 1.0% relative to that of N-R30-B-0.0, after which a declining trend of the cube compressive strength was recorded. The strength of all BMF-reinforced mixtures with 30% was still lower than that of N-R0-B-0.0 made with NA. In fact, a maximum of 95% of the strength of NA-based mixture N-R0-B-0.0 was restored by N-R30-B-1.0. The plain NSC concrete with 60% RCA showed a reduced cube compressive strength at all ages, relative to that of their counterparts reinforced with BMF (Figure 9b). The 28-day cube compressive strength of N-R60-B-0.0 was 34% lower than that of N-R0-B-0.0. The respective strengths of BMF-reinforced mixtures N-R60-B-0.5 and N-R60-B-1.0 were 24 and 26% higher than that of N-R60-B-0.0. The higher BMF volume fraction of 1.5% resulted in a reduced strength gain of 17% only. Despite the improvement caused by the addition of BMF, a maximum of 83% of the strength of the NA-based mixture N-R0-B-0.0 was restored by N-R60-B-1.0.

Figure 8.
Typical failure mode of cube specimens: (a) plain mixture (H-R30-B-0.0); (b) BMF-reinforced mixture (H-R30-B-0.5).
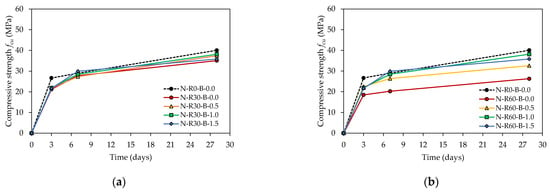
Figure 9.
Development of NSC cube compressive strength with time: (a) N-R30; (b) N-R60.
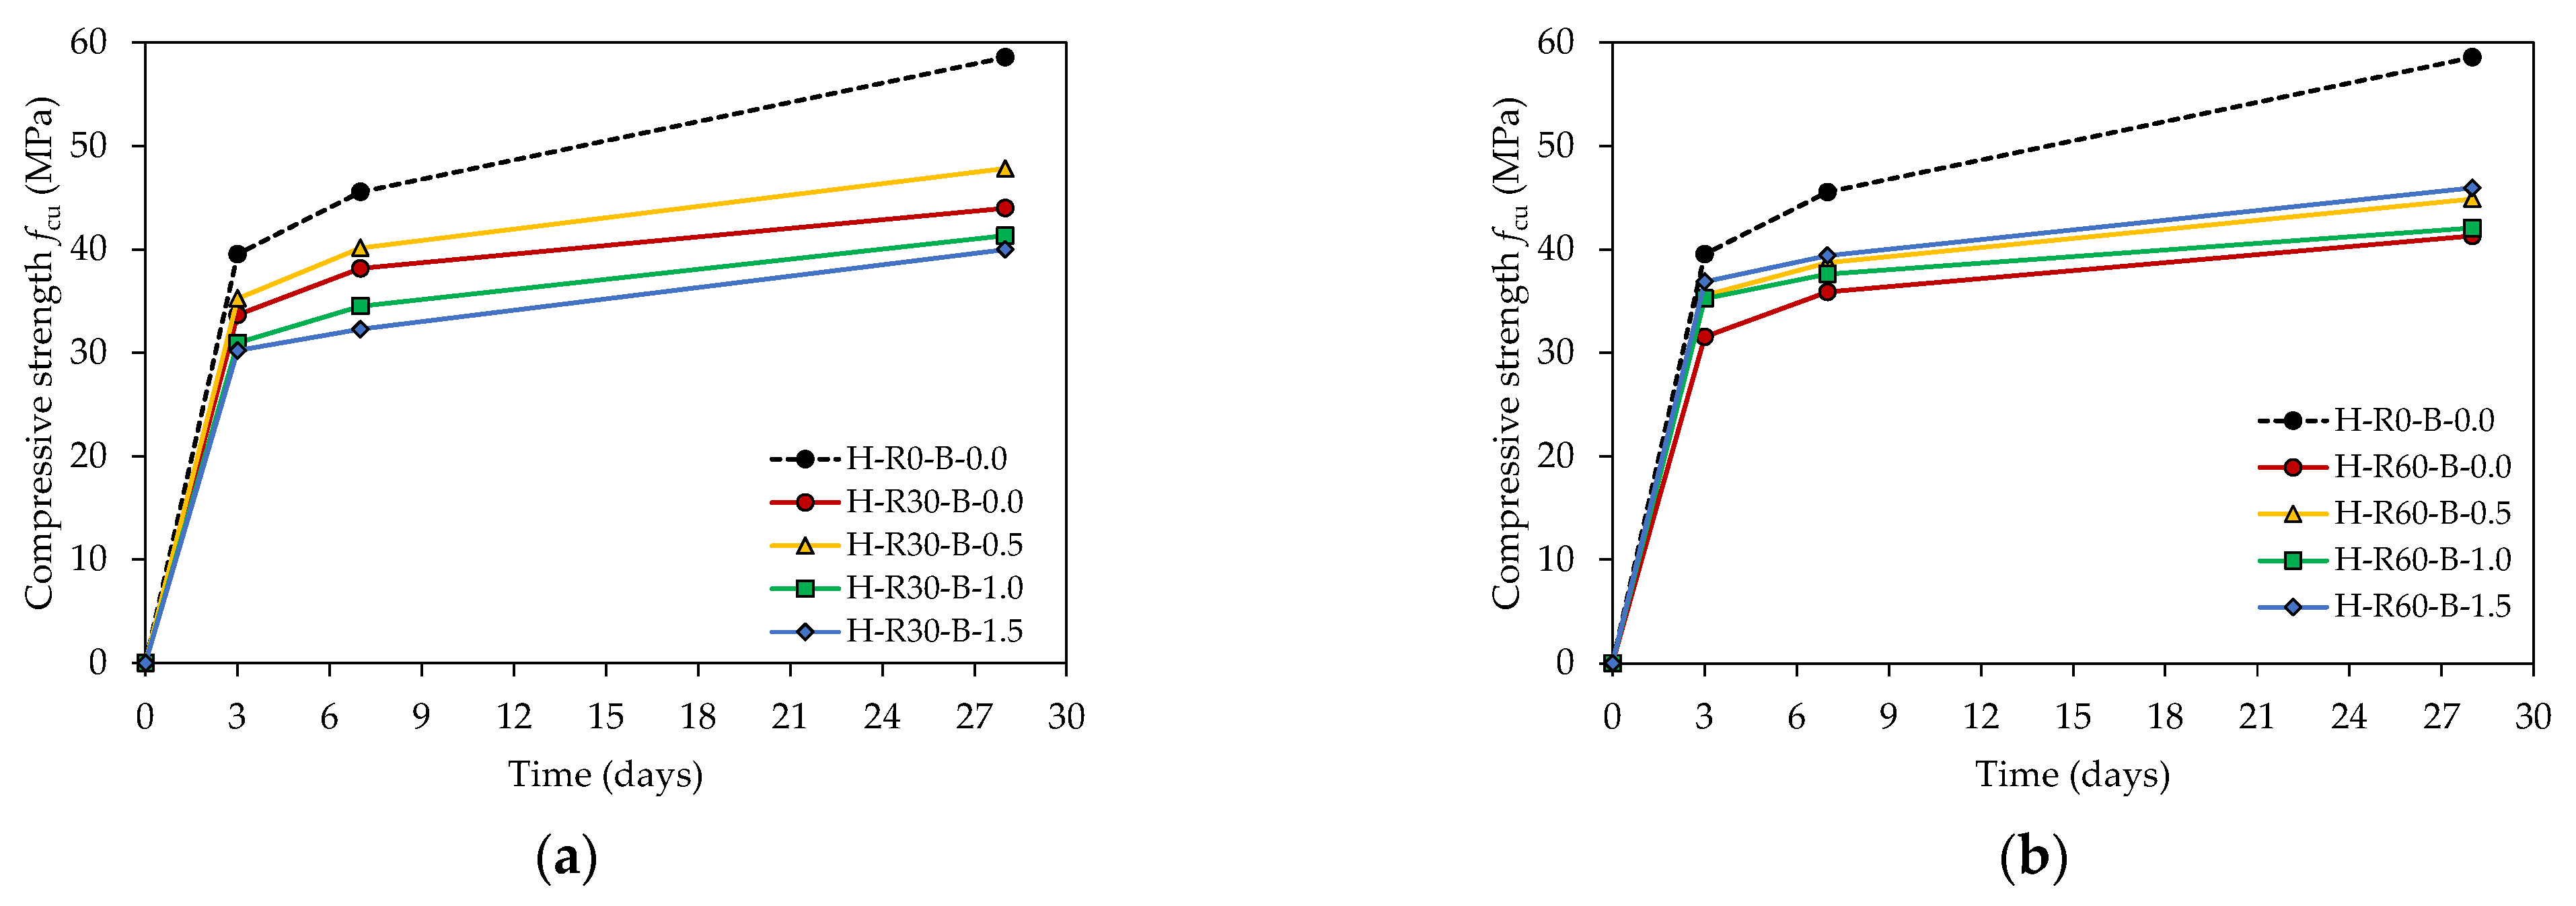
Figure 10 shows the progression of the cube compressive strength of the RCA-based HSC mixtures with time. At 30% RCA, the plain concrete mixture H-R30-B-0.0 showed a lower cube compressive strength than that of its NA-based counterpart H-R0-B-0.0 at all ages of curing (Figure 10a). Eventually, a 25% strength reduction was recorded by H-R30-B-0.0 at 28 days, relative to that of H-R0-B-0.0. The addition of BMF at νf of 0.5% improved the strength at all ages, with a maximum of 9% strength gain at 28 days. The cube compressive strength decreased at the higher BMF volume fractions of 1.0 and 1.5%. In fact, the cube compressive strength of the HSC mixtures with 30% RCA and νf of 1.0 and 1.5% was, on average, 8% lower than that of H-R30-B-0.0. These results emphasize the possibility of occurrence of a strength decay when BMF are added at high volume fractions. At 60% RCA, the plain HSC mixture H-R60-B-0.0 showed a reduced cube compressive strength after 3 days of curing, relative to that of their counterparts reinforced with BMF (Figure 10b). At 28 days, the cube compressive strength of H-R60-B-0.0 was 30% lower than that of the NA-based mixture H-R0-B-0.0 and approximately 6% lower than that of its counterparts reinforced with BMF. The cube compressive strength of the mixtures with BMF was, on average, 76% of that of H-R0-B-0.0.
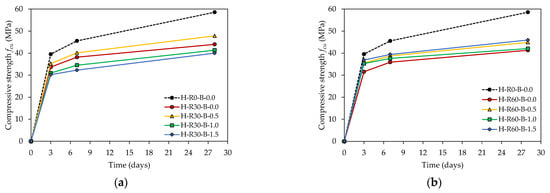
Figure 10.
Development of NSC cube compressive strength with time: (a) H-R30; (b) H-R60.
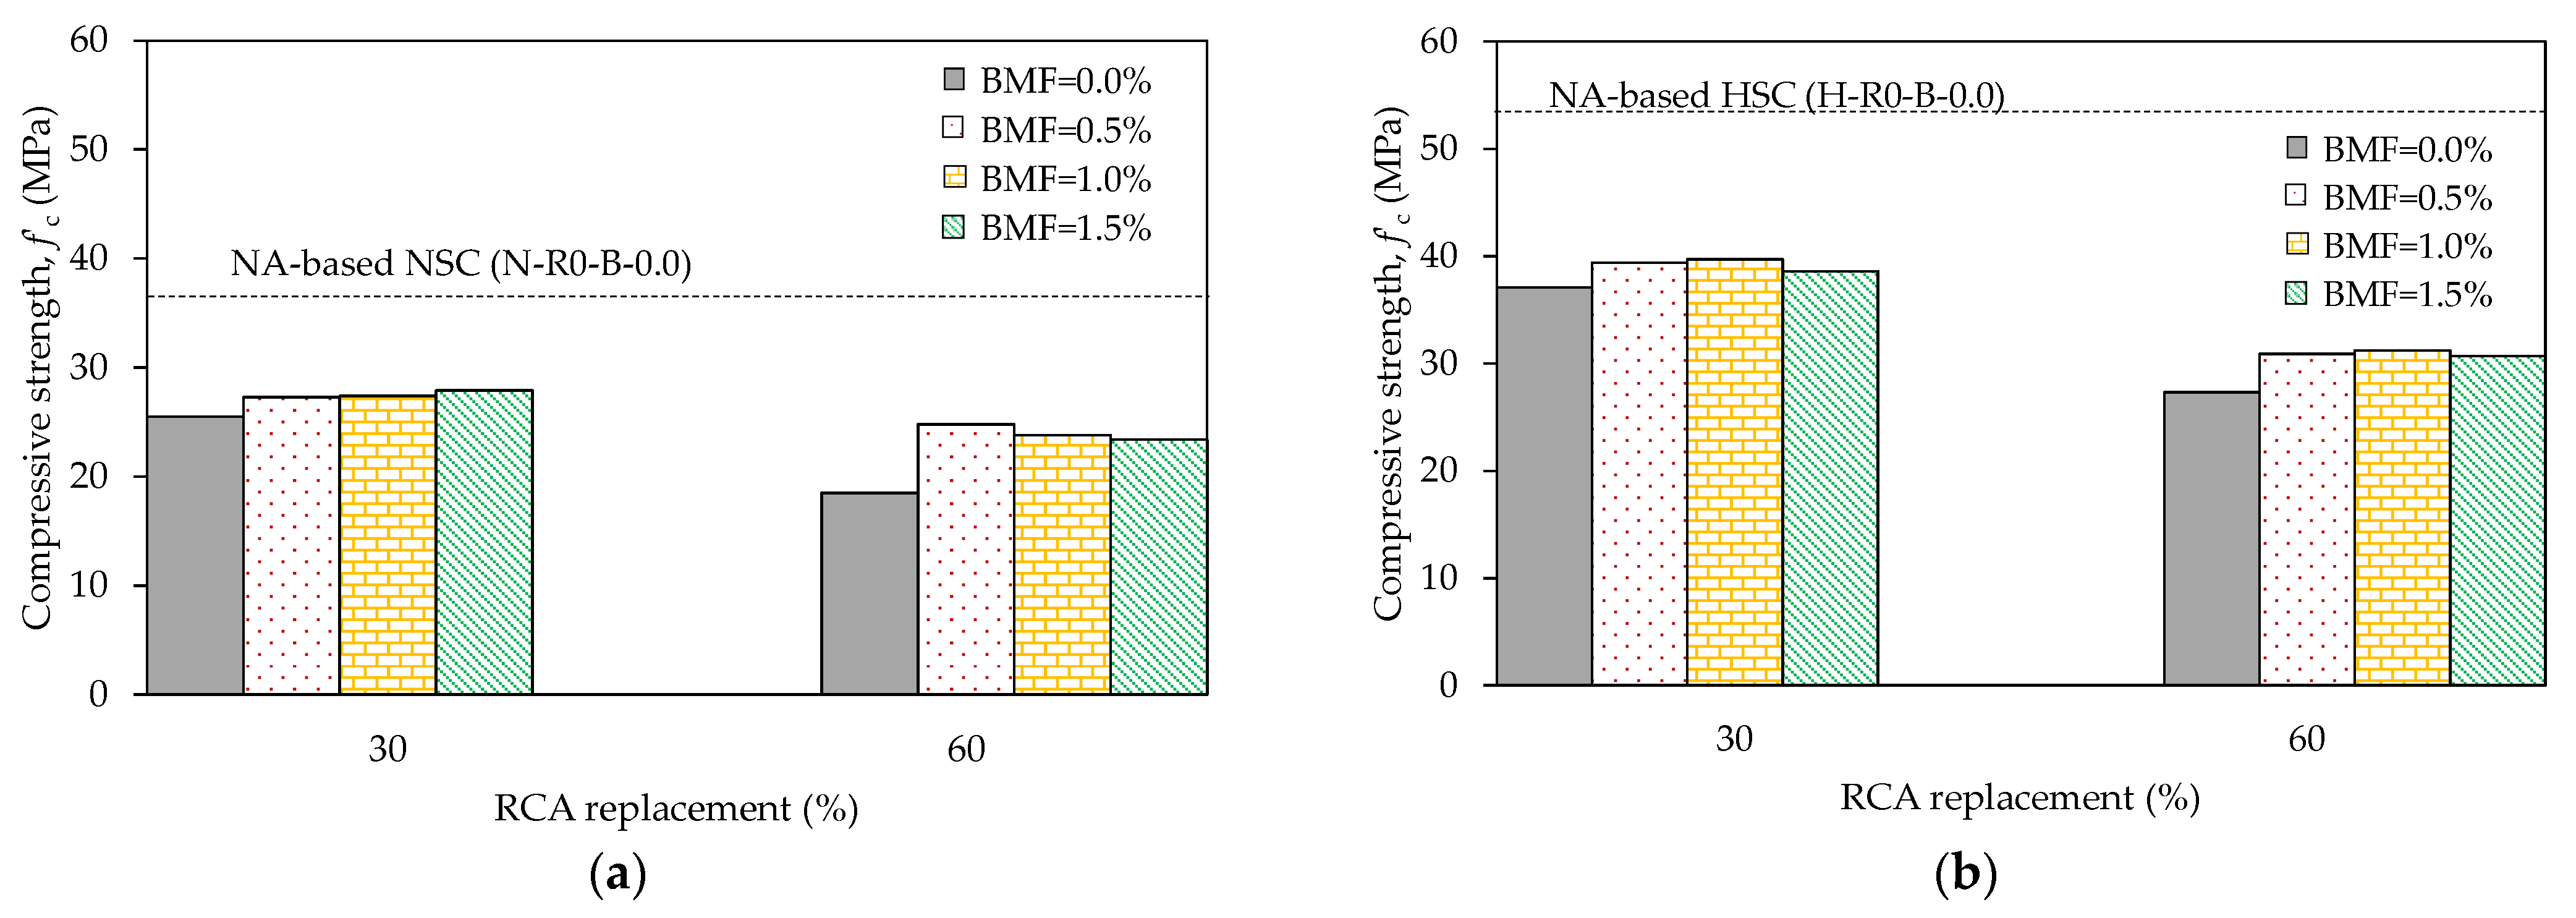
Figure 11a,b shows the effects of RCA replacement and BMF inclusion on f’c for the NSC and HSC, respectively. The strengths of the NA-based benchmark mixtures are included for the purpose of comparison. Figure 11a shows that the plain NSC with 30 and 60% RCA exhibited f’c reductions of 30 and 49%, respectively, relative to that of the NA-based mixture N-R0-B-0.0. Their HSC counterparts exhibited respective reductions of 31 and 49%, relative to that of H-R0-B-0.0 (Figure 11b). These results indicate that the reduction in f’c of plain concrete caused by RCA was sensitive to the RCA replacement percentage and the slenderness ratio, but not affected by the initial concrete grade. The addition of BMF at νf of 0.5% increased f’c of the NSC with 30 and 60% RCA by 7 and 34%, respectively. The HSC with νf of 0.5% exhibited respective increases in f’c of 6 and 13%. Further increase in νf resulted in no or an insignificant reduction in the strength gain. At 30% RCA, values of f’c for the of NSC and HSC reinforced with BMF were, on average, 75 and 73% of that of the NA-based mixtures N-R0-B-0.0 and H-R0-B-0.0, respectively. The respective values at 60% RCA were 66 and 58%.
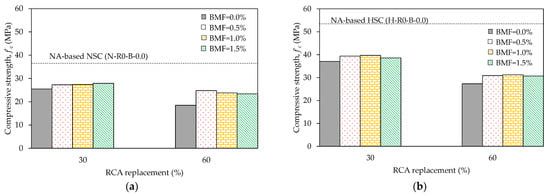
Figure 11.
Effect of RCA and BMF on cylinder compressive strength: (a) NSC; (b) HSC.
Table 4 summarizes the 28-day cube (fcu) and cylinder (f’c) compressive strength results along with values of the concrete Young’s modulus (Ec). The plain NSC and HSC mixtures with RCA exhibited reduced values of f’c/fcu, relative to that of their NA-based counterparts. This behavior indicates that, under compression loading, plain concrete mixtures made with RCA were more sensitive to the slenderness ratio than their NA-based counterparts. The concrete mixtures made with RCA and BMF tended to exhibit a slightly higher values of f’c/fcu, than that of their plain counterparts, indicating a slightly improved resistance to the slenderness effect. The Young’s moduli of the plain NSC concrete mixtures N-R30-B-0.0 and N-R60-B-0.0 were 13 and 24% lower than that of their NA-based counterpart N-R0-B-0.0, respectively. Similarly, the plain HSC concrete mixtures H-R30-B-0.0 and H-R60-B-0.0 exhibited 27 and 31% reductions in their Young’s modulus, respectively, relative to that of their NA-based counterpart H-R0-B-0.0. The addition of BMF did not improve the Young’s modulus of the concrete. It should be noted that the Young’s modulus of the concrete represents the slope of the linear part of the stress-strain response of the concrete as per ASTM C469 [50]. Since the fibers start to contribute to the concrete resistance after crack initiation, it might be reasonable not to anticipate an improvement in the Young’s modulus of concrete reinforced with BMF.

Table 4.
Compression test results of concrete mixtures.
4.2.2. Splitting Tensile Strength
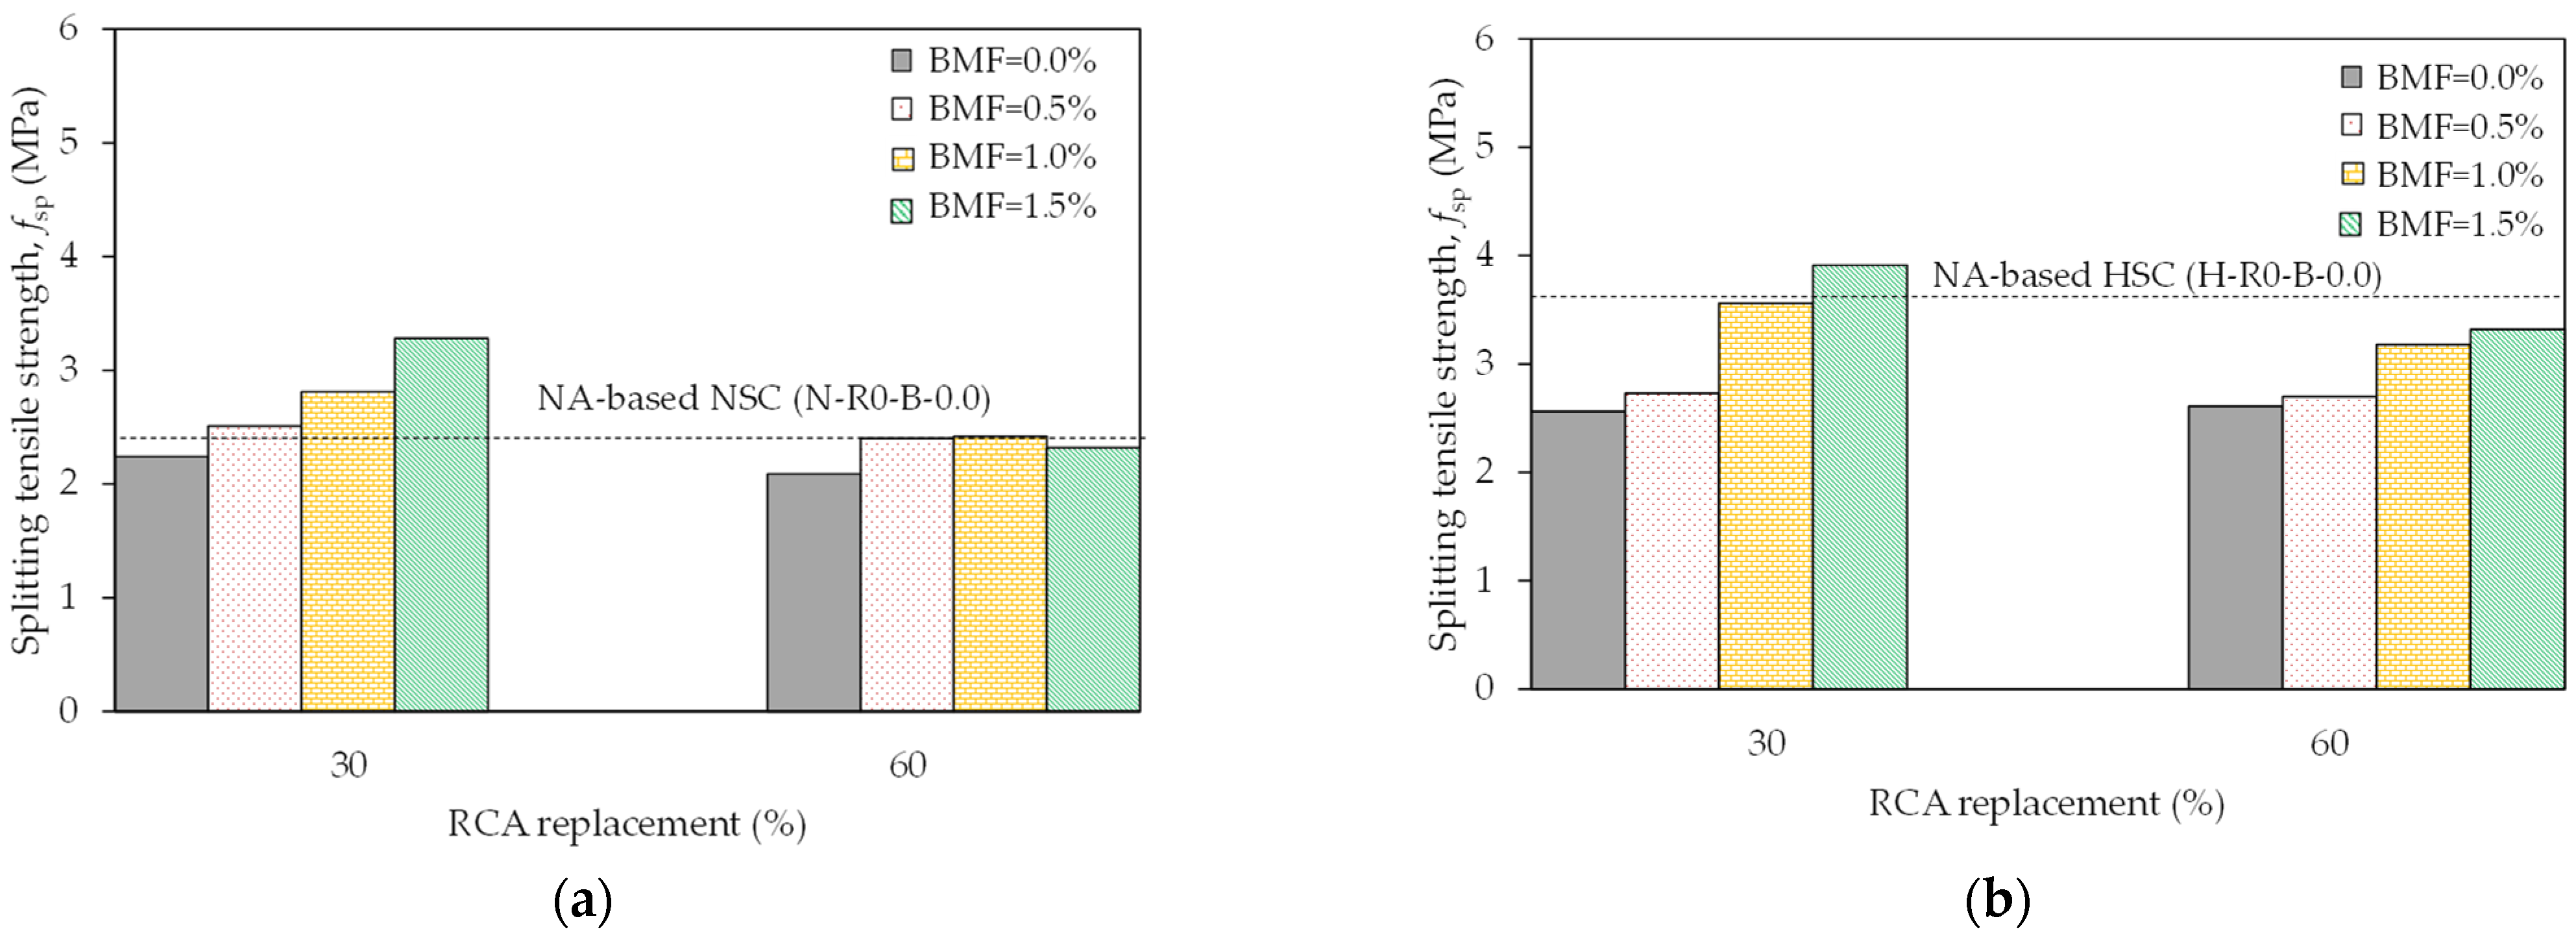
Figure 12 shows pictures of specimens after conducting the splitting tensile strength test. The plain NSC with RCA exhibited a longitudinal splitting crack that was widened very rapidly upon its initiation causing a sudden failure. Comparable HSC specimens broke into two halves indicating a brittle mode of failure. A fine splitting crack appeared in the NSC and HSC specimens reinforced with BMF during the test. This crack widened gradually with an increase in load, but the specimens remained intact after failure. Figure 13a,b shows the effect of RCA and BMF on fsp of the NSC and HSC, respectively. The strengths of the NA-based mixtures are included in the figures for the purpose of comparison. The plain NSC with 30 and 60% RCA exhibited reductions in fsp of 6 and 13%, respectively (Figure 13a), relative to that of the NA-based mixture N-R0-B-0.0. The decrease in the fsp caused by RCA was more significant for the HSC, where 29 and 28% reductions were recorded at 30 and 60% RCA, respectively, relative to that of H-R0-B-0.0 (Figure 13b). Figure 13a shows that the inclusion of BMF at νf of 0.5% fully restored the splitting tensile strength of the NA-based NSC mixture. The splitting tensile strength of the mixtures with 30% RCA further increased with increasing the BMF volume fraction. In contrast, increasing the BMF volume fraction in the NSC mixtures with 60% RCA did not result in an additional increase in fsp. It seems that fsp of the NSC with 60% RCA was too weak to show an effect for the additional increase in the BMF volume fraction. Figure 13b shows that it was necessary to use νf of 1.0% in the HSC mixtures with 30% RCA to restore fsp of the NA-based mixture H-R0-B-0.0. The use of a higher νf of 1.5% in H-R30-B-1.5 increased fsp by 10%, compared with that of H-R30-B-1.0. Although the addition of BMF improved fsp of the HSC mixtures with 60% RCA, a maximum of 92% of the strength of the NA-based mixture H-R0-B-0.0 was restored, when the BMF were added at νf of 1.5%.

Figure 12.
Sample pictures of specimens after the splitting tensile test: (a) N-R60-B-0.0; (b) H-R30-B-0.0; (c) N-R60-B-1.5; (d) H-R30-B-1.5.
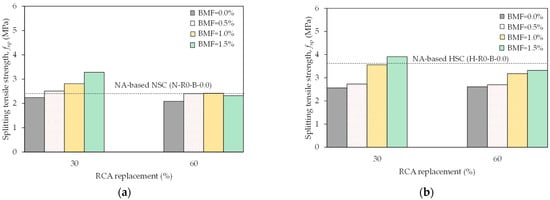
Figure 13.
Splitting tensile strength results: (a) NSC; (b) HSC.
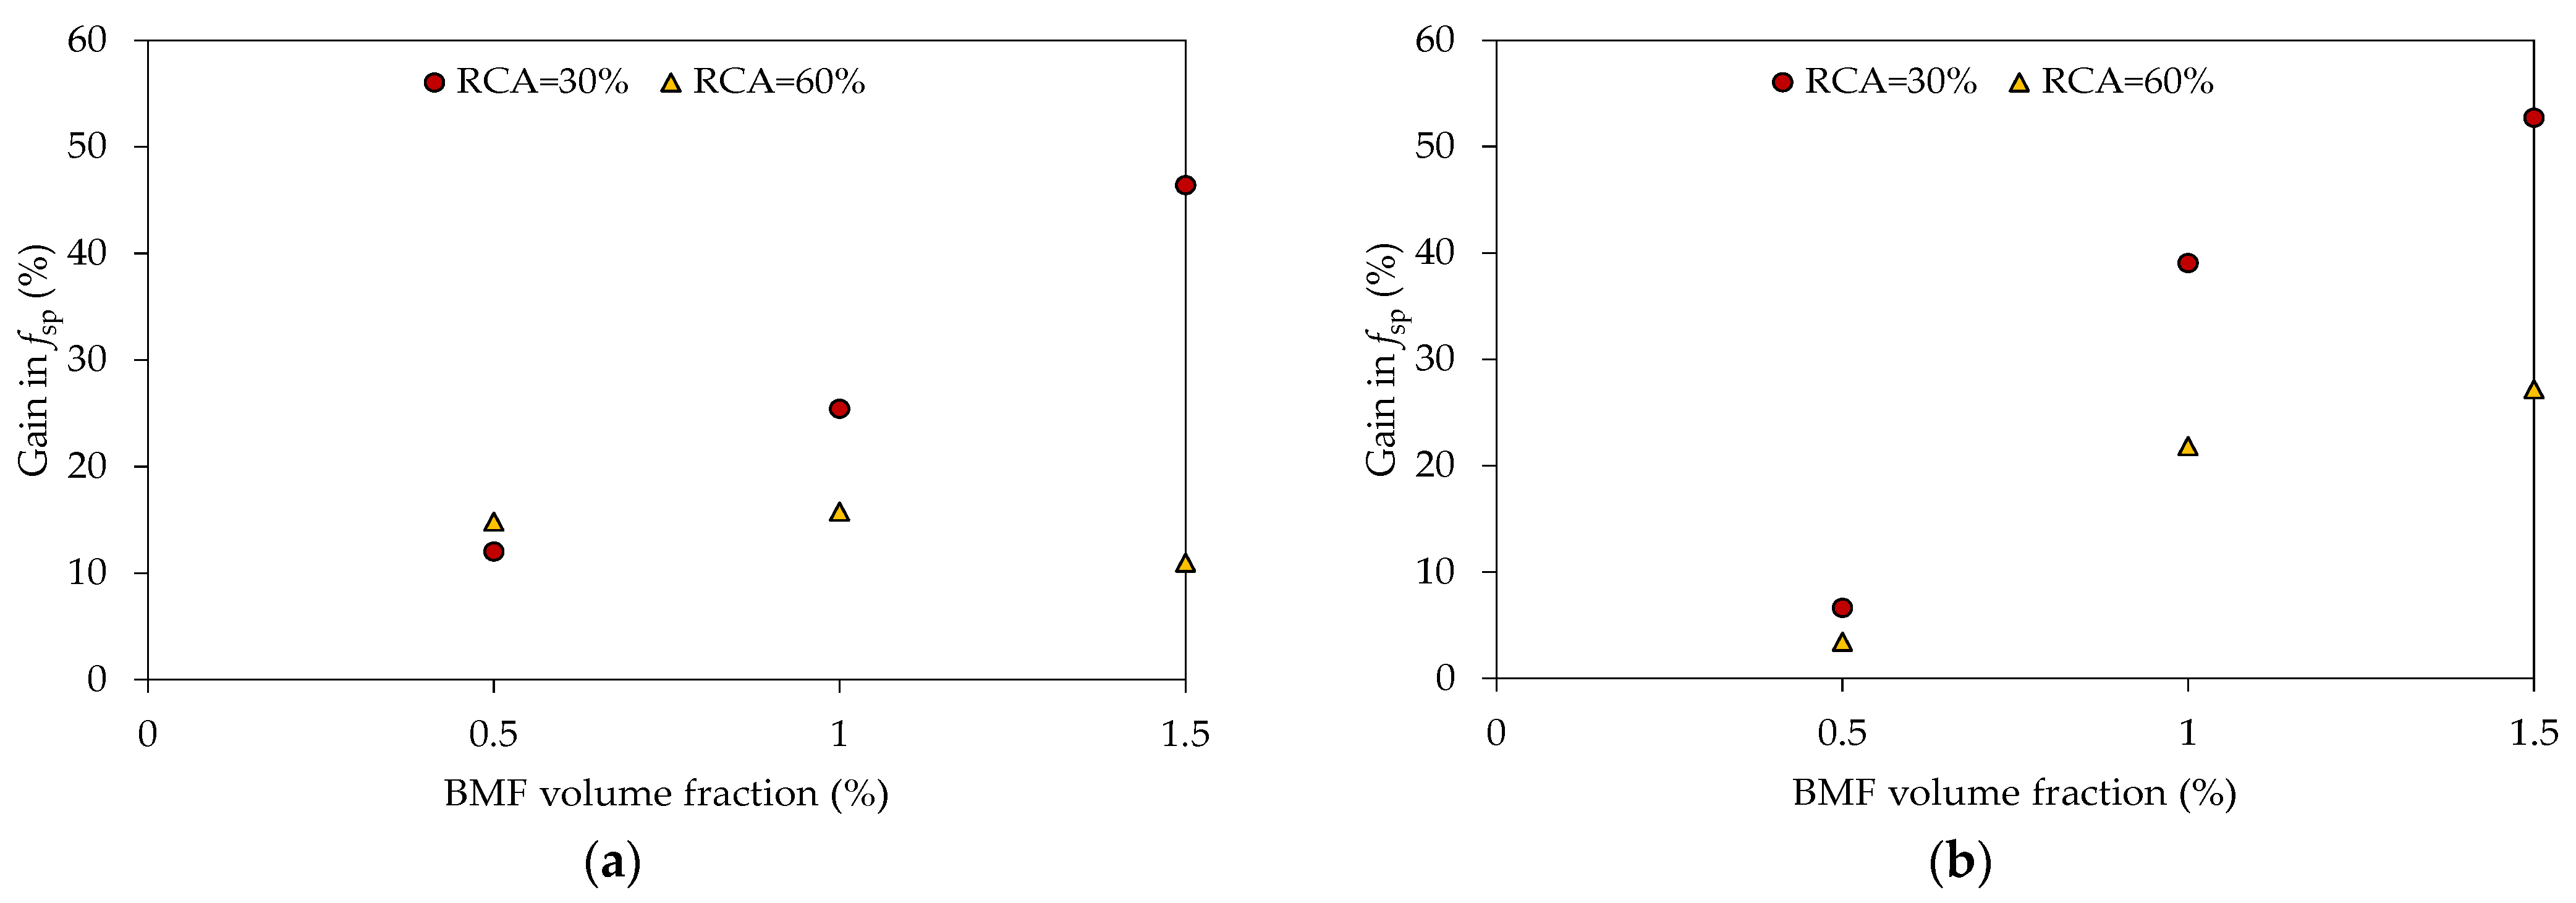
The addition of BMF increased fsp of the RCA-based mixtures, but the strength gain was dependent on the RCA replacement percentage and the BMF volume fraction. Figure 14a,b shows the relationship between the gain in fsp and the BMF volume fraction for the NSC and HSC, respectively. At 30% RCA, the strength gains of the NSC and HSC mixtures with BMF were computed relative to those of N-R30-B-0.0 and H-R30-B-0.0, respectively. Similarly, fsp values of N-R60-B-0.0 and H-R60-B-0.0 were considered as baselines for the calculation of the strength gain of the NSC and HSC mixtures with 60% RCA, respectively. It can be seen that the strength gain of the BMF-reinforced NSC and HSC mixtures with 30% RCA increased almost linearly at the same rate with increasing the BMF volume fraction. At 30% RCA, the gain in fsp of the BMF-reinforced NSC was in the range of 12 to 46%, whereas that of their HSC counterparts was in the range of 7 to 53%. The gain in fsp for the mixtures with 60% RCA was dependent on the initial concrete grade and the BMF volume fraction. At νf of 0.5%, the strength gain of the NSC and HSC mixtures with 60% RCA was insignificantly different from that of their counterparts with 30% RCA. The gain in fsp of the NSC with 60% RCA remained almost unaltered at the higher BMF volume fractions. This behavior could be attributed to the significant weakness of the NSC having 60% RCA that could have hastened the failure after initial cracking, thus limiting the contribution of the BMF to the splitting tensile resistance. Failure of the concrete at the onset of crack initiation does not allow the BMF to contribute to the resistance of the splitting tensile forces. In contrast, the strength gain of the BMF-reinforced HSC with 60% RCA continued to increase with an increase in the BMF content. The strength gain of the BMF-reinforced HSC mixtures with 60% RCA (3–27%) was, however, less pronounced, relative to that of their counterparts with 30% RCA.
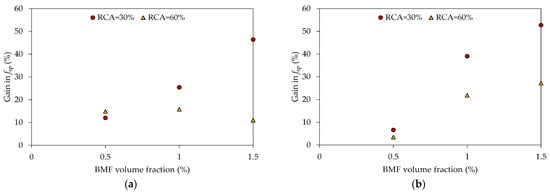
Figure 14.
Relationship between the splitting tensile strength gain and the BMF volume fraction: (a) NSC; (b) HSC.
4.2.3. Flexural Performance
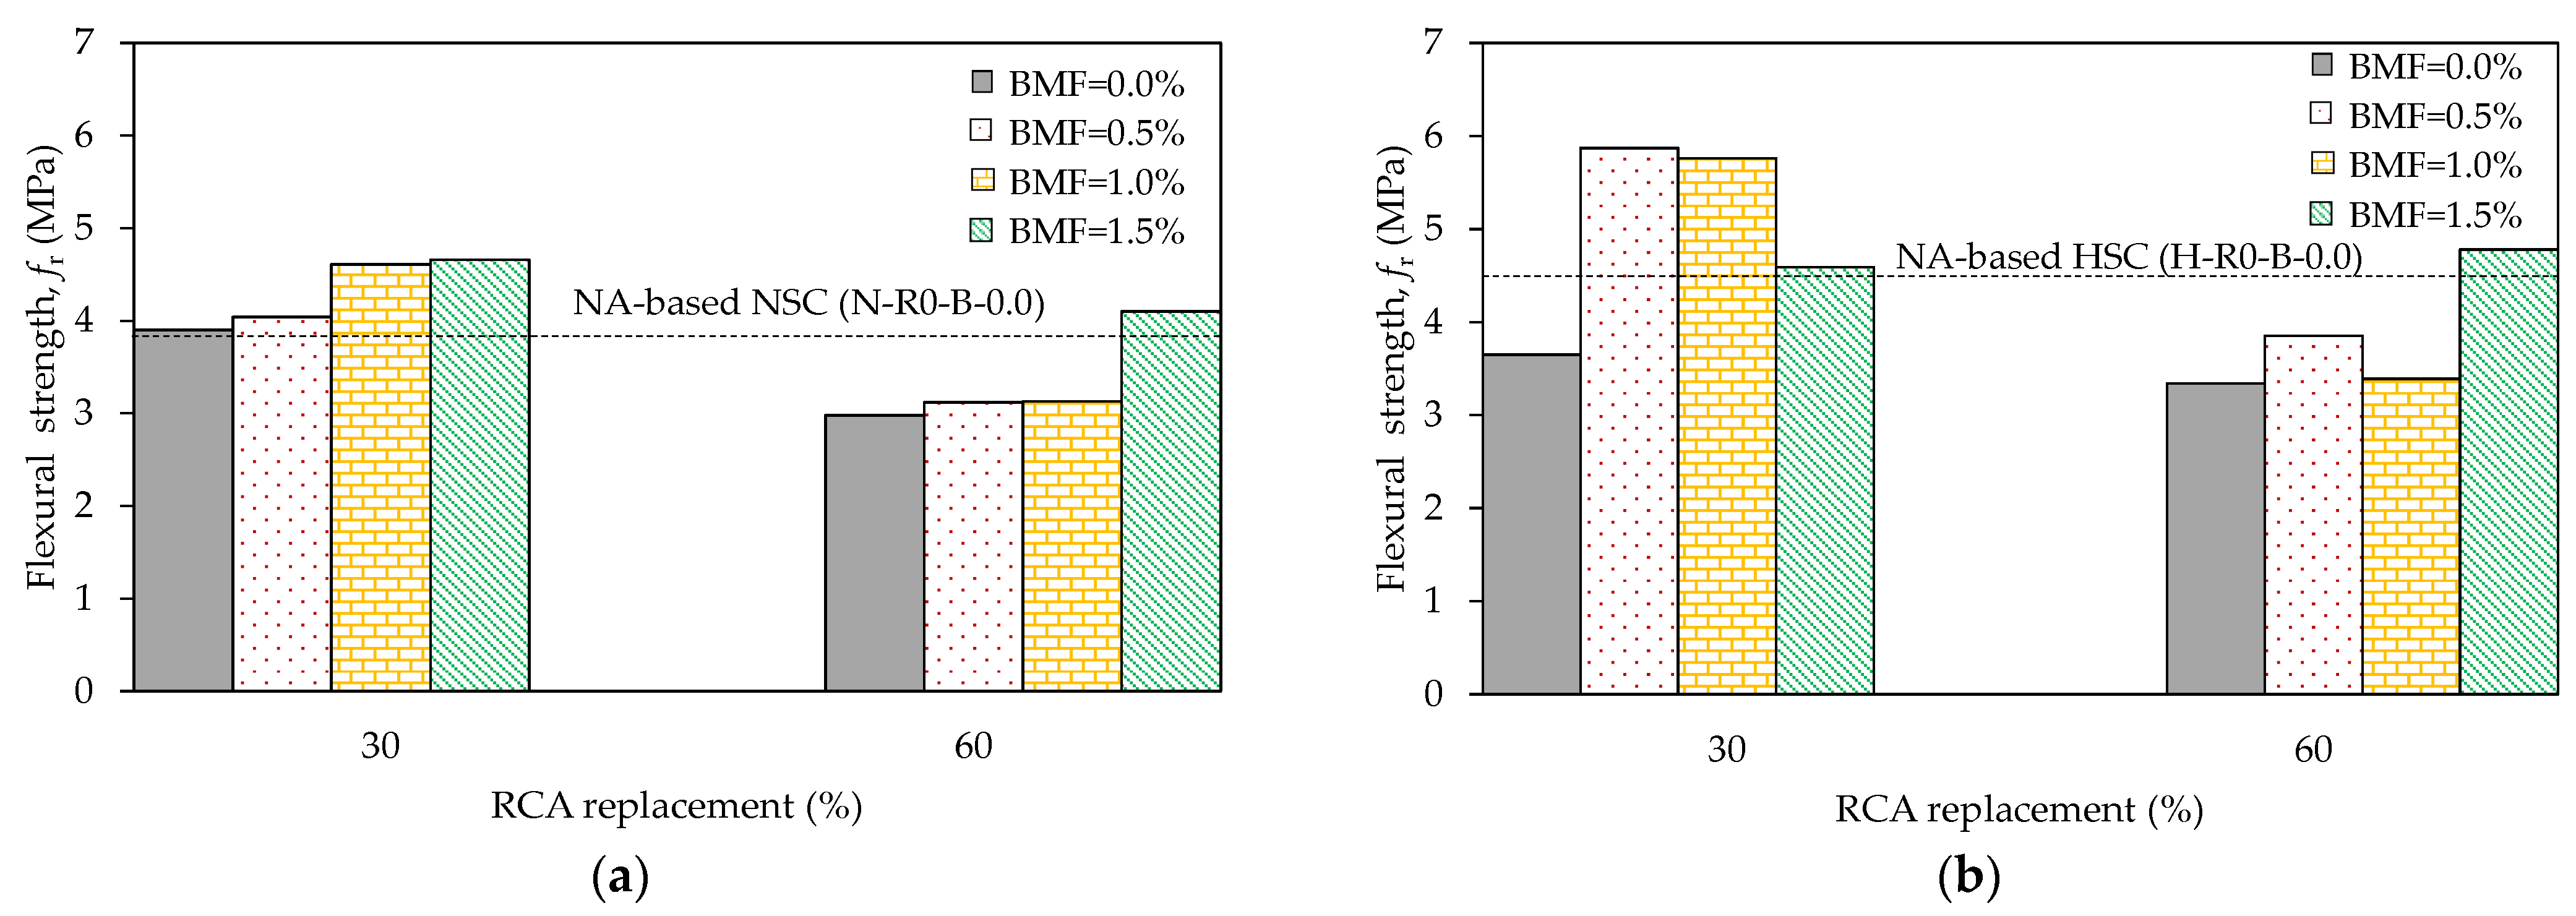
Figure 15 shows pictures of specimens failed in flexure. The plain concrete specimens failed in a brittle manner at the onset of cracking at nearly zero deflection, leaving them with no residual flexural strength nor toughness. As such, they exhibited a complete fracture along the section depth at failure. Most of the specimens reinforced with BMF did not split into two parts after a complete failure took place due to the bridging action of the BMF. This behavior can be ascribed to an enhancement in the concrete’s tension stiffening due to the addition of BMF. The effects of RCA and BMF on fr of the NSC and HSC are shown in Figure 16a,b, respectively. The flexural strengths of the NA-based mixtures are included in the figures for the purpose of comparison. Figure 16a shows that the use of 30% RCA did not reduce fr of the plain NSC mixture, whereas a 22% reduction was recorded for its counterpart with 60% RCA, relative to that of the NA-based mixture N-R0-B-0.0. The value of fr of the BMF-reinforced concrete with 30% RCA increased with an increase in the BMF content, until a flexural strength gain of 18% was reached at νf of 1.0%, after which no further strength gain was recorded. The inclusion of BMF at νf ≤ 1% was not effective in improving the flexural strength of the NSC mixture made with 60% RCA. Meanwhile, at νf of 1.5%, the flexural strength of the NSC mixture with 60% RCA was 38 and 7% higher than those of its plain counterparts N-R60-B-0.0 and N-R0-B-0.0, respectively. Figure 16b shows that the inclusion 30 and 60% RCA reduced fr of the plain HSC mixtures by 19 and 26%, respectively, relative to that of the NA-based mixture H-R0-B-0.0. The use of BMF at νf of 0.5 and 1.0% resulted in a similar strength gain of 59%, on average, relative to that of H-R30-B-0.0. However, the strength gain was only 26% at the higher νf of 1.5%. At 60% RCA, the inclusion of BMF in the HSC mixtures at νf of 0.5 and 1.0% resulted in no or insignificant improvement in fr. For the HSC with 60% RCA, it was necessary to use BMF at νf of 1.5% to restore fr of the NA-based mixture H-R0-B-0.0.

Figure 15.
Sample pictures of specimens after the flexural test: (a) N-R60-B-0.0; (b) N-R60-B-1.0; (c) H-R60-B-0.0; (d) H-R60-B-1.0.
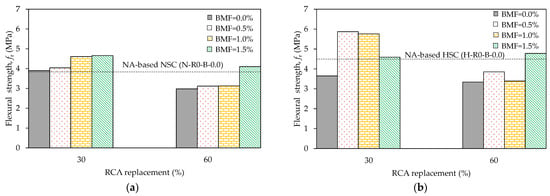
Figure 16.
Flexural strength results: (a) NSC; (b) HSC.
The mixtures with BMF exhibited a tensile softening response after reaching the peak load. The load-deflection responses of representative RCA-based NSC and HSC specimens with BMF are depicted in Figure 17 and Figure 18, respectively. Figure 17a shows that the deflection responses of the NSC mixtures with 30% RCA and different BMF volume fractions were insignificantly different, although a slightly improved response was recorded at νf of 1.0%. The flexural performance of the BMF-reinforced NSC mixtures with 60% RCA (Figure 17b) was inferior relative to that of their counterparts made with 30% RCA (Figure 17a). At 60% RCA (Figure 17b), the deflection response of the NSC mixtures with νf of 1.0 and 1.5% was almost identical. An improved flexural response was, however, recorded for the NSC with 60% RCA at νf of 1.5%. Figure 18a, shows that the response of H-R30-B-1.5 with the higher νf of 1.5% was inferior to those of H-R30-B-0.5 and H-R30-B-1.0. The effectiveness of using higher BMF volume fractions to further improve the flexural response was, however, evident for the HSC mixtures made with 60%, as shown in Figure 18b.

Figure 17.
Load-deflection response of RCA-based NSC with BMF: (a) 30% RCA; (b) 60% RCA.

Figure 18.
Load-deflection response of RCA-based HSC with BMF: (a) 30% RCA; (b) 60% RCA.
Detailed results of the four-point bending flexural tests are presented in Table 5, where Pmax denotes the peak load. According to ASTM C1609 [52], f600D and f150D are the residual strengths at deflection values of L/600 and L/150, respectively, and T150D is the flexural toughness based on the area enclosed under the load-deflection response until a deflection of L/150 (i.e., 3 mm), where D is the depth of the concrete prism (100 mm) and L is the length of the prism between the center of the supports (450 mm). As explained earlier, plain NSC and HSC mixtures did not show residual flexural strength nor toughness because of the sudden failure that occurred at the onset of cracking. The bridging effect of the fibers allowed the BMF-reinforced NSC and HSC flexural test specimens to exhibit a softening behavior after cracking. Specimens N-R30-B-1.0 and H-R30-B-1.0 with 30% RCA and νf of 1.0% exhibited a higher residual strength and toughness than those of their respective counterparts N-R30-B-0.5 and H-R30-B-0.5 with νf of 0.5%. Generally, further increase in the BMF content to νf of 1.5% did not result in a further improvement in the residual strength nor the toughness of the NSC and HSC with 30% RCA. Flexural test results of the HSC with 60% RCA tended to show a trend similar to that of their counterparts made with 30% RCA. A continual increase in the residual strength and toughness with increasing the BMF content was evident for the NSC mixtures made with 60% RCA.

Table 5.
Four-point flexural results.
4.3. Durability Properties
4.3.1. Water Absorption and Sorptivity
Table 6 summarizes the durability test results. The plain NSC with 30 and 60% RCA exhibited 21 and 52% increases in the water absorption, respectively, relative to that of N-R-B-0.0. Their HSC counterparts HSC showed respective increases of 14 and 72%, relative to that of H-R0-B-0.0. The increased water absorption values of the plain concrete with RCA are indicative of their increased porosity, particularly at the higher RCA replacement percentage of 60%. The NSC with 30 and 60% RCA having νf of 1.0% exhibited 4 and 9% reductions in the water absorption, compared with those of N-R30-B-0.0 and N-R60-B-0.0, respectively. Higher BMF volume fractions did not change the percent reduction in the water absorption of the NSC. The HSC with BMF exhibited 3–11% and 13–17% reductions in the water absorption at 30 and 60% RCA, respectively, relative to those of their plain counterparts. The BMF may have obstructed some routes in the concrete, which could have reduced the water migration. The sorptivity of the plain NSC with 30 and 60% RCA increased by 65 and 62%, respectively, relative to that of N-R0-B-0.0. Their counterpart HSC mixtures exhibited respective increases of 51 and 53%, relative to that of H-R0-B-0.0. These results indicate that the effect of increasing the RCA replacement percentage from 30 to 60% on the rate of water migration was less evident in the results of the sorptivity test, although was pronounced in the water absorption test. Overall, the inclusion of BMF tended to reduce the sorptivity of RCA-based NSC and HSC mixtures. The reduction in the sorptivity of the NSC and HSC with BMF was in the same range of 3–10% at 30% RCA and 6–15% at 60% RCA, relative to those of their plain counterparts.

Table 6.
Durability characteristics test results.
4.3.2. Abrasion Resistance
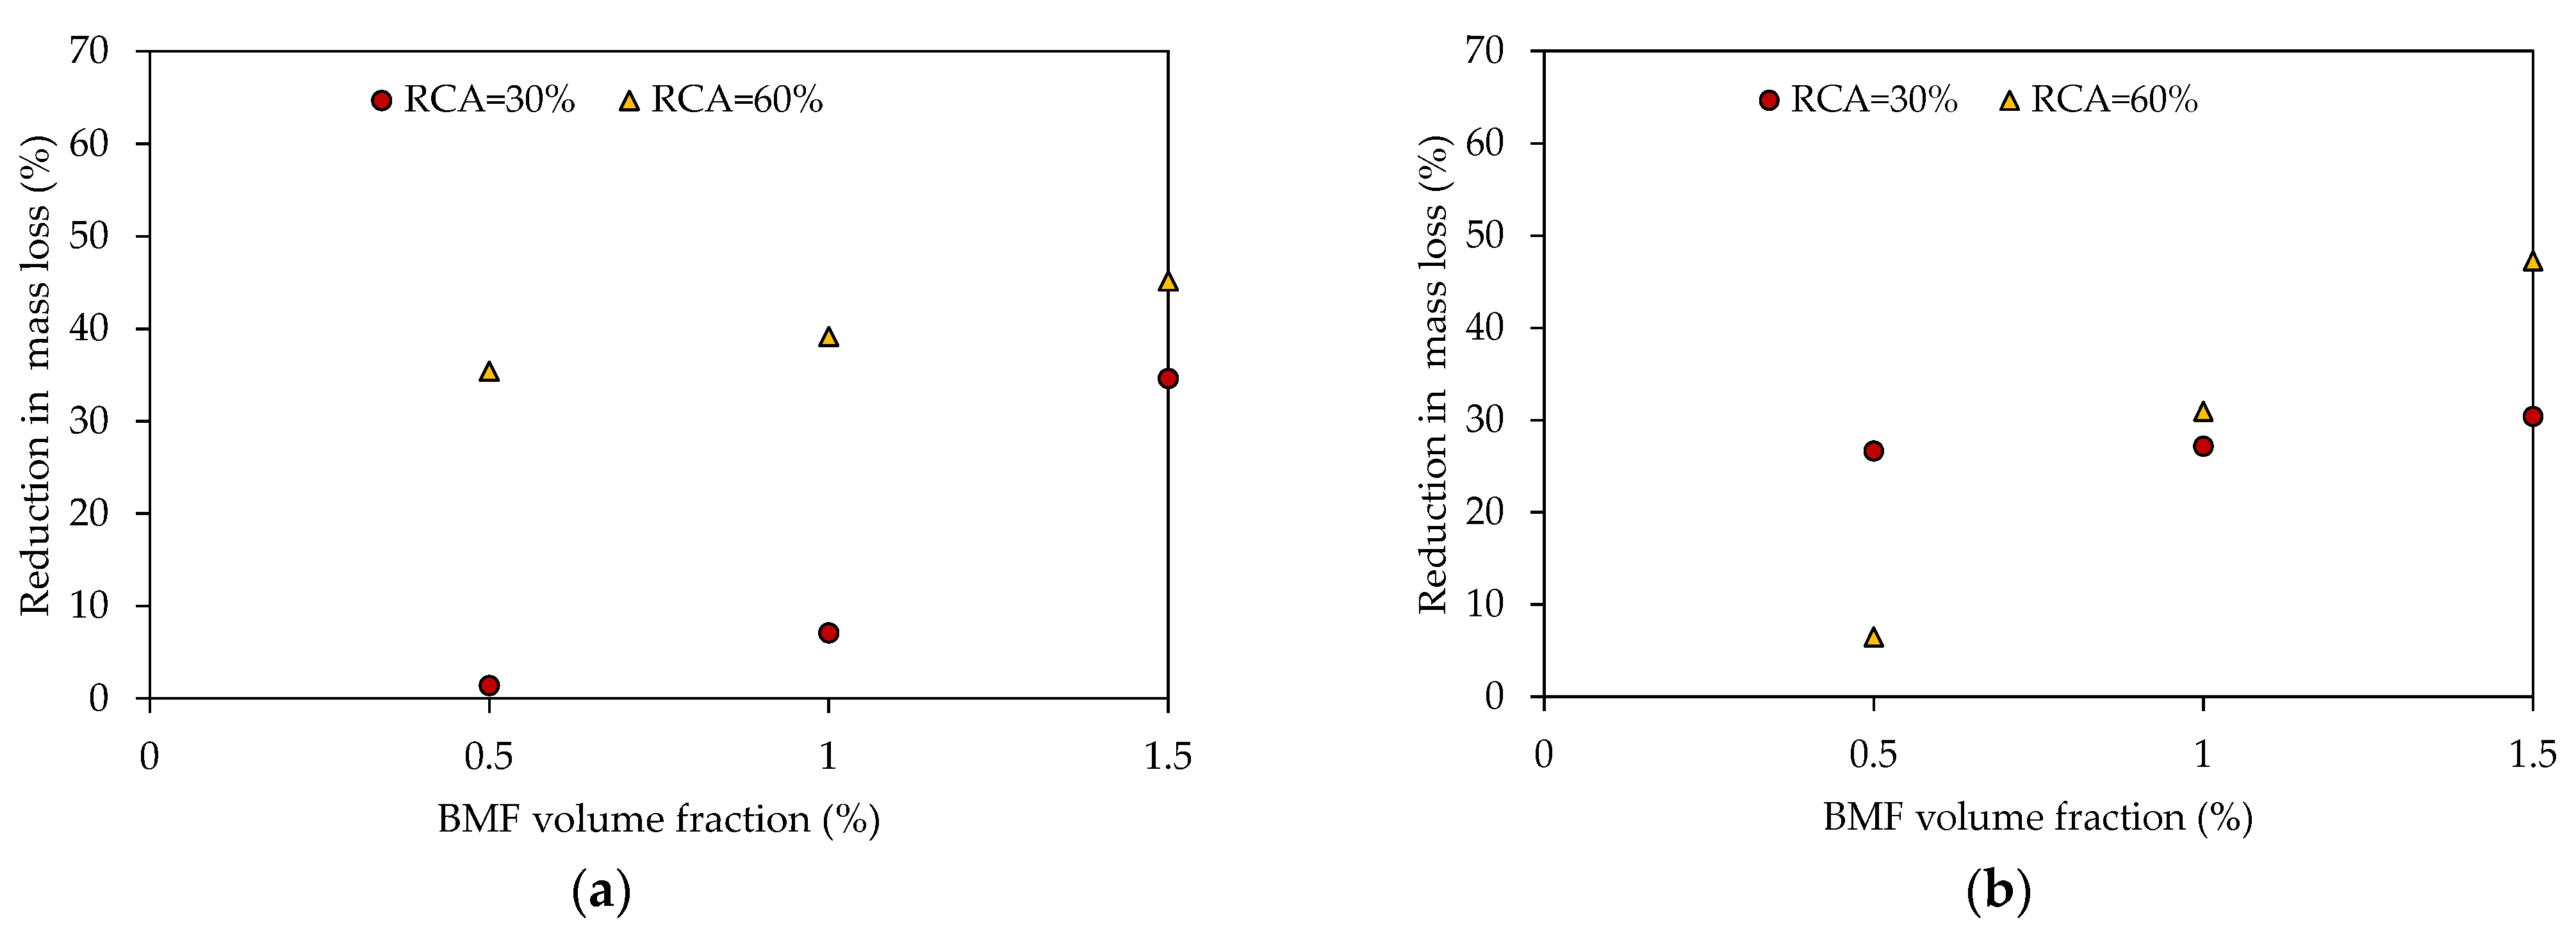
Table 6 shows that the use of 30 and 60% RCA increased the abrasion mass loss of the plain NSC mixture by about 1.5 and 5 folds, respectively, relative to that of N-R0-B-0.0. The 30 and 60% RCA replacement percentages increased the abrasion mass loss of the HSC by about 2.5 and 3 folds, respectively, relative to that of H-R0-B-0.0. The results demonstrated that the increase in the abrasion mass loss of the plain NSC was sensitive to the RCA replacement percentage, whereas that of the plain HSC with 30 and 60% RCA was insignificantly different. The addition of BMF reduced the abrasion mass loss. Figure 19a,b shows the reduction in the abrasion mass loss caused by the addition of BMF for NSC and HSC, respectively. For the BMF-reinforced NSC with 30 and 60% RCA, the reduction in the abrasion mass loss was 1–35% and 35–45%, respectively (Figure 19a). These results indicate that the addition of BMF had a more pronounced effect on improving the abrasion resistance at 60% RCA. Figure 19b shows that the reduction in the abrasion mass loss caused by the addition of BMF to HSC with 30% RCA was almost constant at a value of about 30%, irrespective of the BMF volume fraction. Their counterparts with 60% RCA were affected by the BMF volume fraction, where 6, 31, and 47% reductions in the abrasion mass loss were recorded at νf of 0.5, 1.0, and 1.5%, respectively.
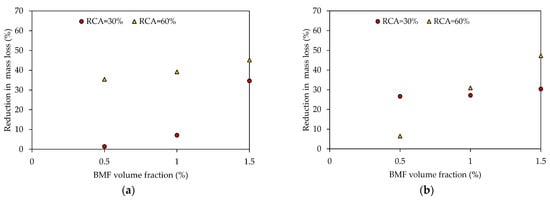
Figure 19.
The reduction in the abrasion mass loss versus the BMF volume fraction relationship: (a) NSC; (b) HSC.
4.3.3. Ultrasonic Pulse Velocity
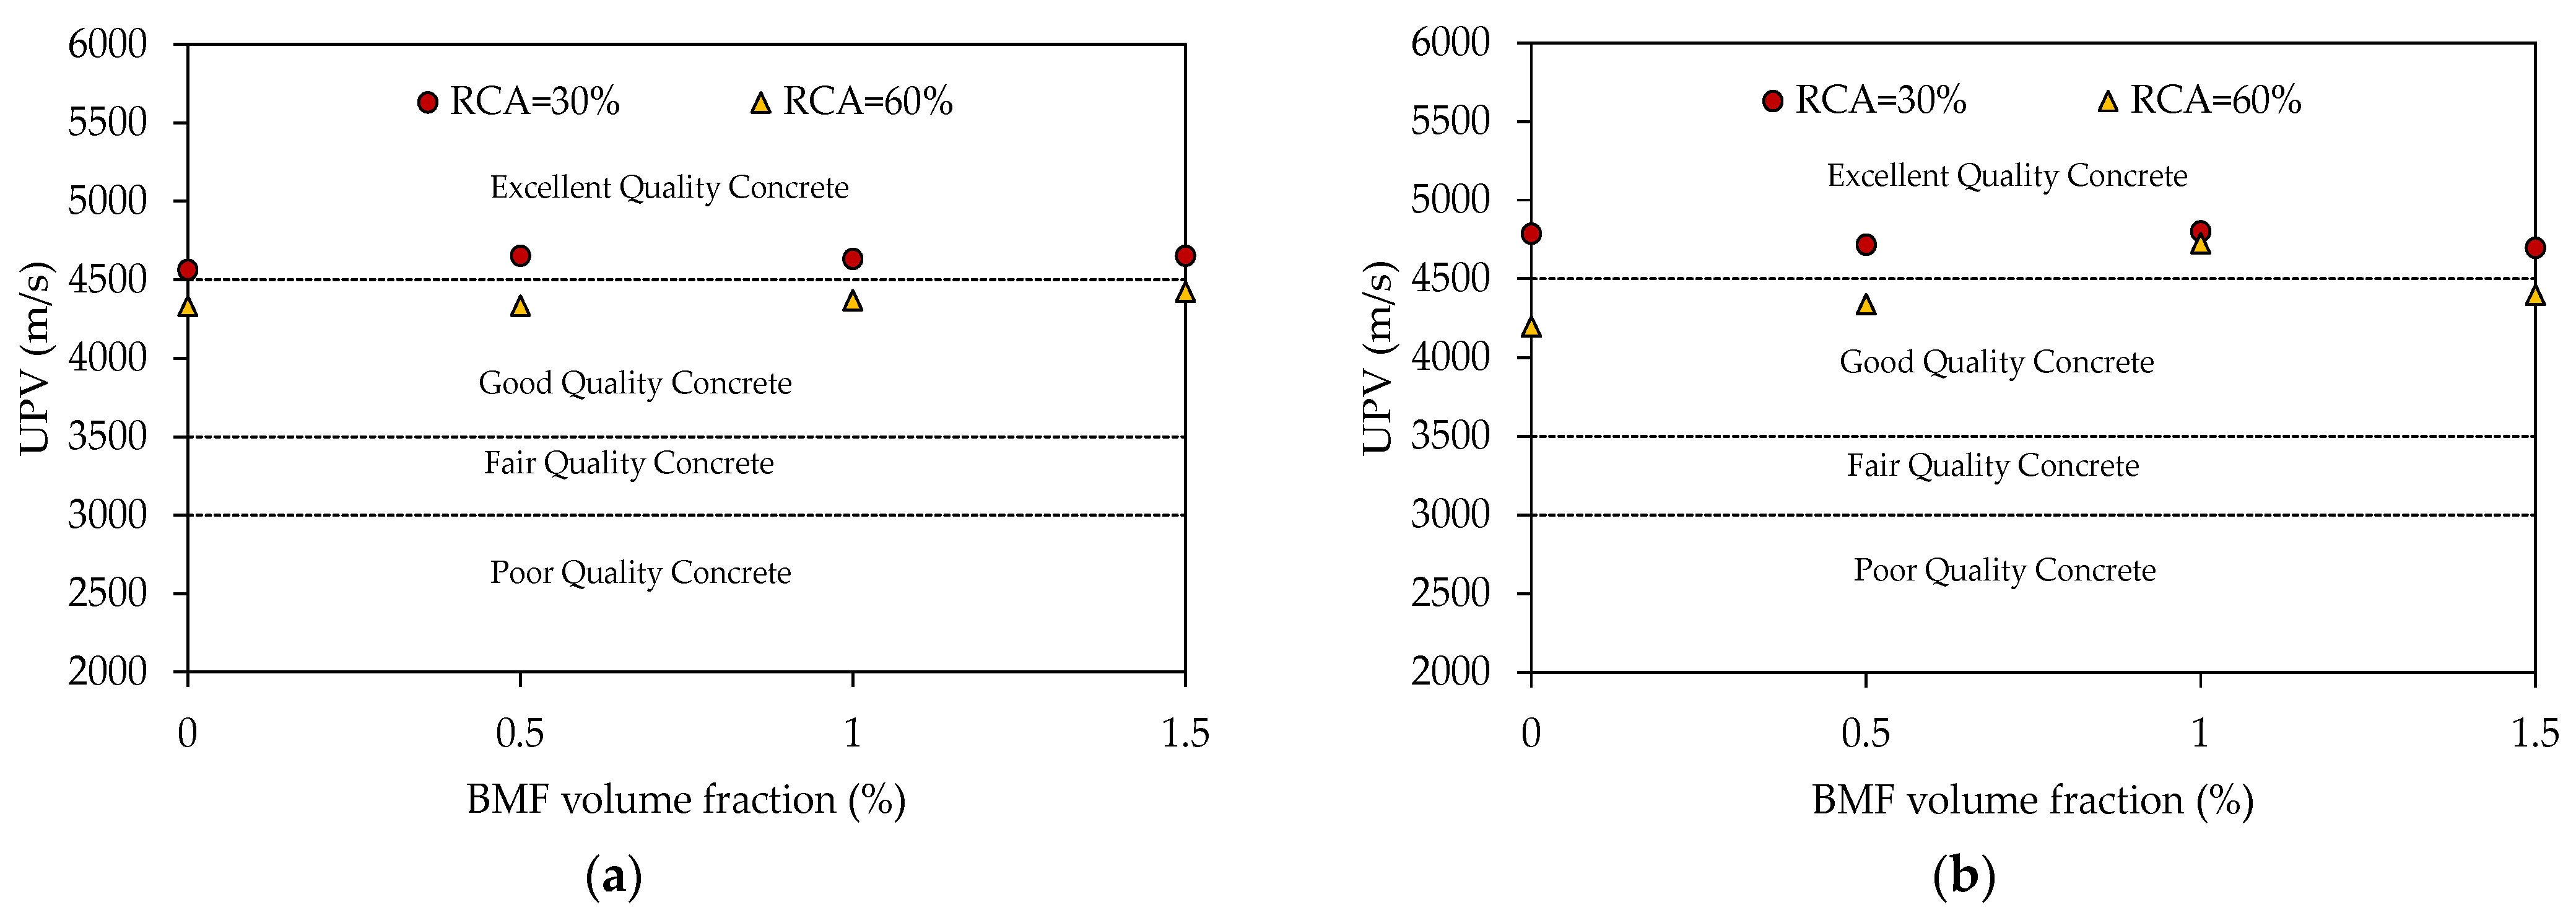
Table 6 shows that the UPV values of the plain NA-based NSC and HSC mixtures N-R0-B-0.0 and H-R0-B-0.0 exceeded 4500 m/s, indicating an excellent concrete quality of both mixtures [57]. The plain NSC mixtures N-R30-B-0.0 and N-R60-B-0.0 with 30 and 60% RCA exhibited 11 and 16% lower UPV values, relative to that of the NA-based mixture N-R0-B-0.0, respectively. Their HSC counterparts showed respective reductions of 6 and 17%, relative to that of H-R0-B-0.0. The reduced UPV values of the concrete made with RCA is an indication of the presence of more voids. Figure 20a,b demonstrates the effect of BMF on UPV values of NSC and HSC with different RCA replacement percentages, respectively. The incorporation of BMF had an almost no effect on the UPV of the NSC with 30 and 60% RCA, irrespective of the RCA replacement percentage. Similarly, the HSC with 30% RCA reinforced with BMF had similar UPV values. The addition of the BMF at νf of up to 1% increased the UPV value of the HSC with 60% RCA by 13%. A declining trend in the UPV value was observed at νf of 1.5%, where an increase of 5% only was recorded, relative to that of its plain counterpart. Based on the UPV values, the quality of all concrete mixtures with 30% RCA is rated as “Excellent”, whereas that of the majority of those with 60% RCA is rated as “Good” [57].
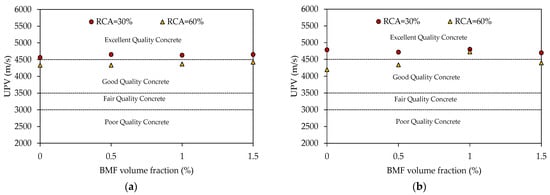
Figure 20.
Effect of BMF volume fraction on UPV of RCA-based mixtures: (a) NSC; (b) HSC.
5. Discussion
The main factors affected the performance of the mixtures tested in the present study were the BMF volume fraction, RCA replacement percentage, and initial concrete grade. Findings of the present study indicated that the workability of the RCA-based concrete mixtures decreased with an increase in the BMF volume fraction. The extent of the detrimental effect of the BMF on the workability was dependent on the RCA replacement percentage and the initial concrete grade. At 30% RCA, the slump reduction caused by the addition of BMF for NSC and HSC was insignificantly different, where up to a 32% slump reduction was recorded. The addition of BMF was more detrimental to the workability of the BMF-reinforced concrete with 60% RCA. Such a detrimental effect was more pronounced for the HSC (maximum slump reduction of 84%), rather than that of the NSC (maximum slump reduction of 51%). The decrease in the workability of RCA-based concrete due to the addition of the BMF observed in this study is consistent with other published findings [12,13] that showed 33 to 65% reductions in the slump of BF-reinforced concrete made with 50% RCA. Such a reduction in the concrete workability can be attributed to the surface area of the fibers, which utilized some of the cement paste for wrapping, in addition to an increased resistance of the fresh concrete to the movement of particles due to the friction created by the fiber network.
Results of this study revealed the potential of BMF to increase the compressive strength of RCA-based concrete. Varying the content of BMF had, however, no noticeable effect on the compressive strength gain, irrespective of the RCA replacement percentage and the initial grade of the concrete. The initial concrete grade also had no noticeable impact on the compressive strength gain of the mixtures with 30% RCA, where an average increase of 8% was recorded for both NSC and HSC. At 60% RCA, the compressive strength gain was less pronounced for HSC mixtures (9–13%) than that of their NSC counterparts (26–34%). The splitting tensile strength of the RCA-based concrete improved with the addition of BMF, but the strength gain was mainly affected by the RCA replacement percentage. At 30% RCA, the splitting tensile strength gain of both NSC and HSC increased almost linearly at the same rate with an increase in the BMF content, where up to a 53% strength gain was recorded. The addition of BMF also improved the splitting tensile strength of the mixtures with 60% RCA, but to a lesser extent with maximum strength gains of 16 and 22% for NSC and HSC, respectively. The flexural test results implied the viability of using BMF to improve the flexural strength of concrete made with 30% RCA by up to 18% for NSC and 59% for HSC, noting that the use of νf > 1.0% caused a minimal additional improvement or a decay in the strength gain. At 60% RCA, the addition of BMF at νf ≤ 1.0% tended to have an insignificant effect on the flexural strength. In fact, it was necessary to use BMF at νf of 1.5% to obtain significant flexural strength gains of 38 and 43% for the NSC and HSC, respectively. Previous studies attributed the improvement in the mechanical properties of RCA-based concrete reinforced with nonmetallic fibers to the formation of a fiber network that worked as a bridge in the cement matrix, resulting in decreasing propagation of micro- and macro cracks [15,16,18]. The reduced strength gain observed in some cases of the present study when high BMF volume fractions were used can be ascribed to a nonuniform distribution and clustering of the fibers. The possibility of having a strength reduction due to the addition of fibers or a declining trend after exceeding a specific fiber content was noted in some of the previous studies [12,19]. Several reasons were reported for such a strength decay including wrapping of the fibers with cement paste during the agitation process, thus diminishing the effectiveness of the mortar, fracture of the fibers during the agitation process, leading to a decreased anchoring length, and agglomeration and nonuniform dispersion of the fibers into the matrix, which created weak surfaces and prevented the formation of a space grip with integrity [12,19]
The addition of BMF to the RCA-based concrete mixtures tested in the present investigation tended to reduce the water absorption and abrasion mass loss, irrespective of the initial concrete grade. The improved resistance to the water penetration and abrasion caused by BMF was more pronounced for the mixtures with 60% RCA rather than those with 30% RCA. The improvement in the abrasion resistance can be ascribed to the increased stiffness of the matrix against tensile forces caused by abrasion [6,24]. A negligible increase in the UPV values of the RCA-based concrete was recorded due to the addition of BMF. Such a minor effect of the BMF on the UPV was not affected by the initial concrete grade nor the BMF content. These observations are in agreement with findings of other studies [20], which indicated no noticeable effect for the nonmetallic fibers on the UPV.
6. Idealized Tensile Softening Laws
6.1. Finite Element Modeling
A numerical three-dimensional (3D) finite element (FE) model was created for the tested concrete prisms reinforced with BMF using ATENA software [58]. Figure 21a depicts the geometry, boundary conditions, and locations of the monitoring points of a typical FE model. Half of the concrete prism was modeled using 3D macro-elements, with a mesh size of 15 mm, to take advantage of the specimen’s symmetry and shorten the processing time. Steel plates were provided at the load and support locations to avoid concentration of stresses at these locations. The boundary conditions included restraining the support steel plate form movement in the transverse and vertical directions through a line support and the plane of symmetry section from movement in the longitudinal direction via surface supports. Displacements were induced incrementally at the midpoint of the top steel plate. Two monitoring points were employed to record the numerical data. One point was in the middle of the top steel plate to record the load; whereas the other one was located at the bottom soffit of the beam in the midspan to record the deflection.

Figure 21.
FE modeling: (a) model geometry, boundary conditions, and monitoring points (dimensions are in mm); (b) Compressive hardening-softening law.
The constitutive law of the concrete in compression adopted in the FE analysis starts by a linear part having a slope equal to Ec of the concrete. The compressive hardening-softening law is represented by a multilinear function (Figure 21b). The compressive strain values of the breaking points are generated automatically by the software based on the concrete compressive strength. Values of the plastic concrete strain at the compressive strength (εp) were in the range of 0.09–0.11%, whereas those of the concrete plastic strain at a complete release of stress (εd) were 0.59–0.61%. For large-scale RC members made of fiber-reinforced concrete, the software manual recommends adopting a magnified value of εd to account for the probable increase in the compressive strain capacity caused by the fibers [58]. Magnifying the value of εd by up to 100 times in the present study had, however, no effect on the numerical results of the prisms. This behavior was anticipated since failure of the prisms was governed by the tensile strength and tensile softening behavior of the concrete. The tensile softening law of the concrete reinforced with BMF is represented by a multilinear function. Such a relationship has been developed based on an inverse analysis of the flexural test data. Details of the tensile softening law and the inverse analysis are presented in the following section.
6.2. Tensile Softening Law
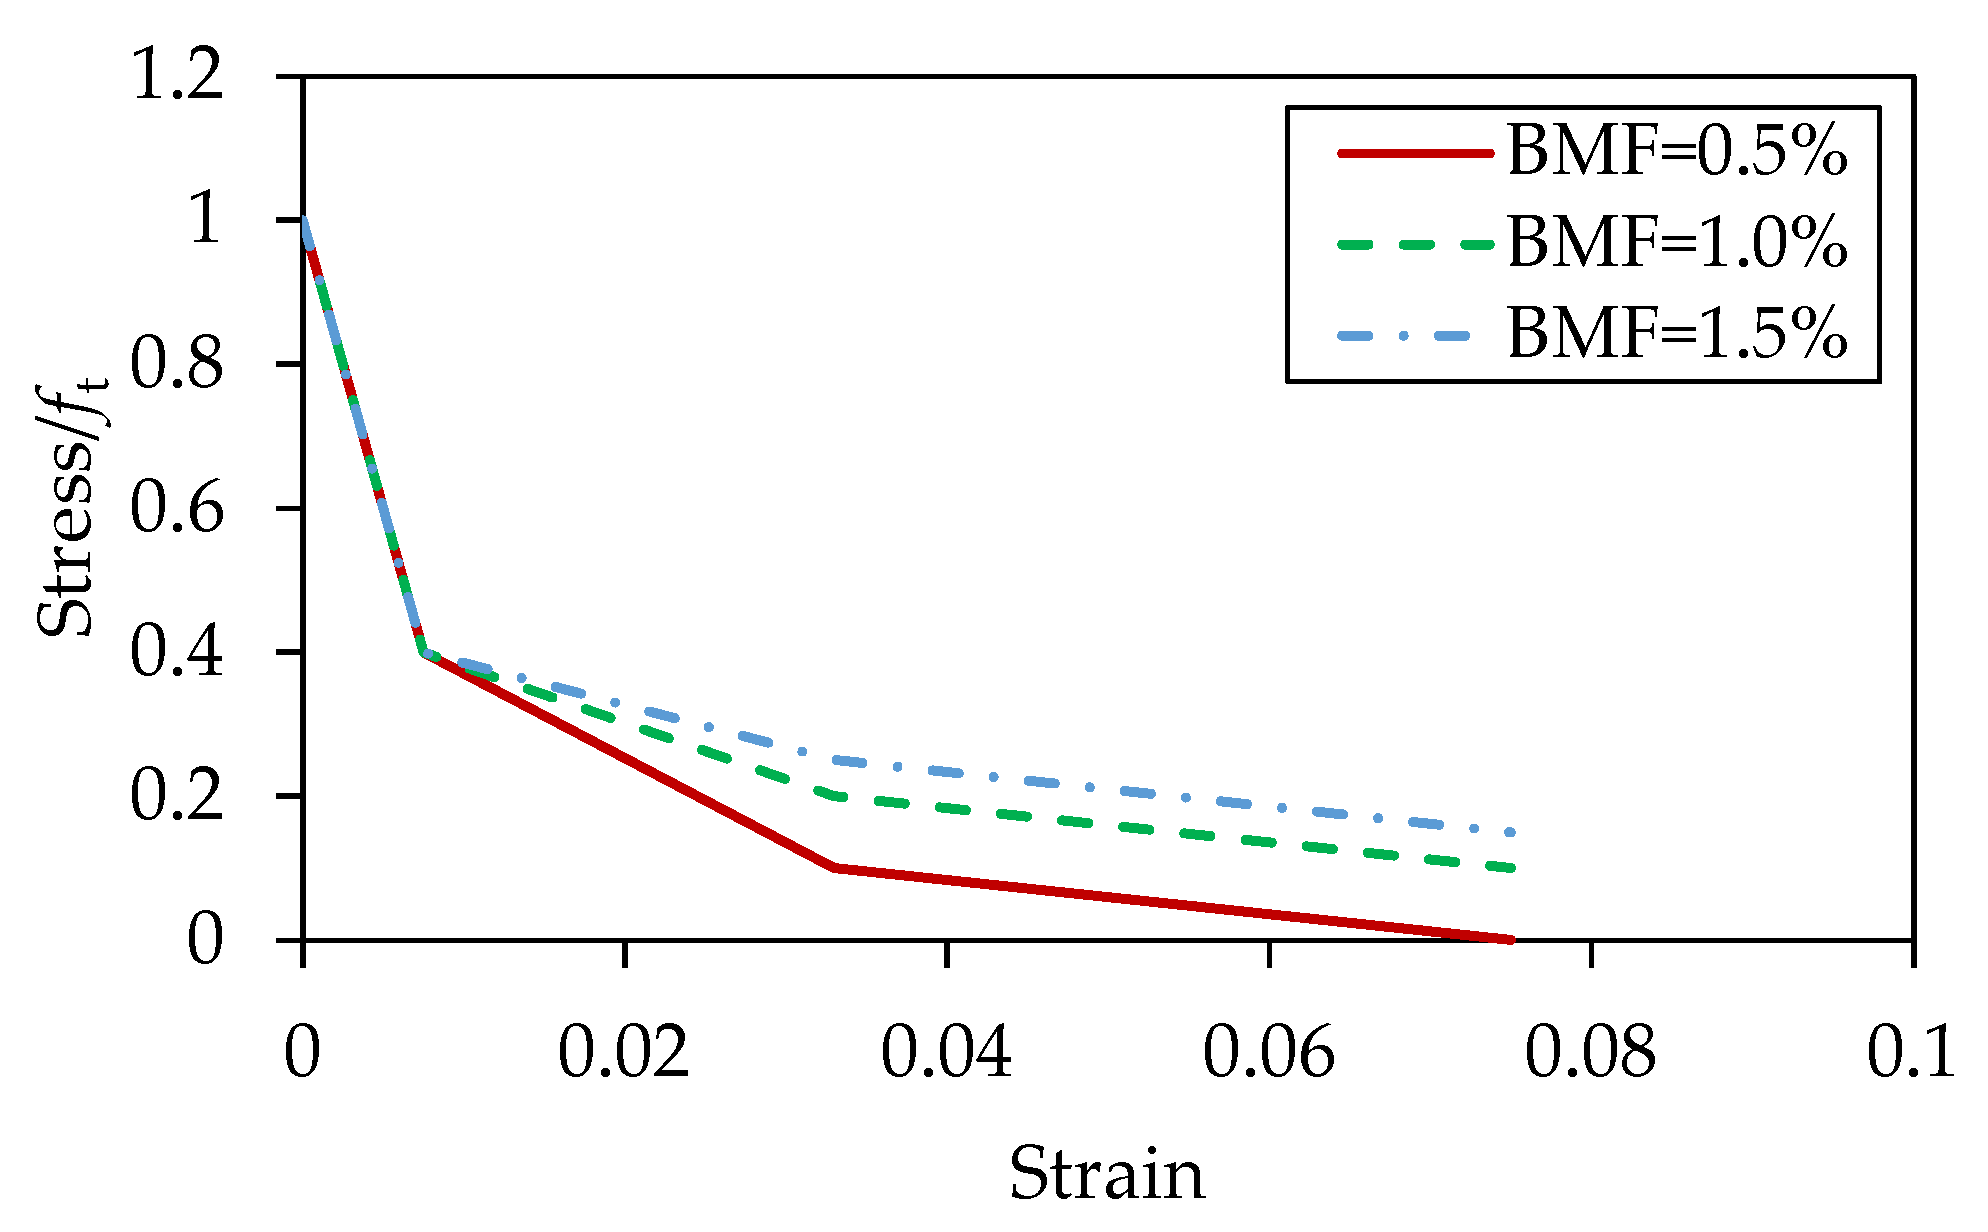
An idealized trilinear tensile softening relationship was considered for the RCA-based concrete reinforced with BMF. The first steeper branch was assumed constant for all of the BMF-reinforced mixtures [27,31], but the slope of the next two branches varied based on the BMF content. Several iterations were conducted to determine the stress and strain values of the breaking points of the relationship at different contents of BMF, based on an inverse analysis of the flexural test results. Figure 22 depicts the tensile softening laws obtained from the inverse analysis, with the y-axis representing the normalized tensile stress, and x-axis represents the tensile strain. The uniaxial tensile strength, ft, was assumed as 0.45fr [59]. The post-peak response was primarily affected by the BMF content rather than the RCA replacement percentage. Once the tensile strength is reached, the tensile stress decreases linearly until it reaches a value of 0.4ft at a tensile strain of 0.008. In the following two stages, the tensile stress continues to decline but at flatter rates, depending on the BMF volume fraction.
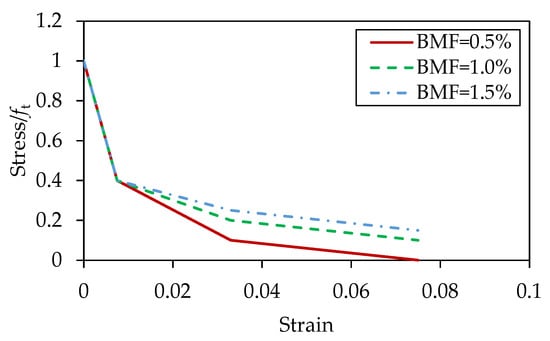
Figure 22.
Idealized tensile softening laws of RCA-based concrete reinforced with BMF.
6.3. Validation of the Tensile Softening Law
A comparative analysis between the flexural responses predicted numerically and those obtained from the experiments was conducted to verify the validity of the tensile softening laws. The numerical versus experimental flexural responses of the NSC with BMF are depicted in Figure 23 and Figure 24, whereas those of their HSC counterparts are compared in Figure 25 and Figure 26. The response of some replicates was not captured due to a malfunction of the transducer at the onset of cracking. Generally, the numerical and experimental deflection responses showed a similar trend. Table 7 compares the load capacity and flexural toughness predicted numerically with those obtained from the tests. The difference between the predicted and measured loads was, on average 4.5%, with a minimum of 0.8% and maximum of 8.2%. The deviation between the predicted flexural toughness and that obtained from the tests was, on average, 18.8%. The good agreement between the numerical and experimental results validates the accuracy of the idealized tensile softening laws.

Figure 23.
Numerical versus experimental flexural response of NSC with 30% RCA: (a) N-R30-B-0.5; (b) N-R30-B-1.0; (c) N-R30-B-1.5.

Figure 24.
Numerical versus experimental flexural response of NSC with 60% RCA: (a) N-R60-B-0.5; (b) N-R60-B-1.0; (c) N-R60-B-1.5.

Figure 25.
Numerical versus experimental flexural response of HSC with 30% RCA: (a) H-R30-B-0.5; (b) H-R30-B-1.0; (c) H-R30-B-1.5.

Figure 26.
Numerical versus experimental flexural response of HSC with 60% RCA: (a) H-R60-B-0.5; (b) H-R60-B-1.0; (c) H-R60-B-1.5.

Table 7.
Comparison between experimental and numerical results.
7. Conclusions
The workability, mechanical properties, and durability characteristics of NSC and HSC mixtures made with 30 and 60% RCA and BMF at νf of 0.5–1.5% were examined. The following conclusions can be drawn based on test results:
- The use of BMF was detrimental to the concrete workability. At νf of 1.5%, the NSC and HSC with 30% RCA showed similar slump reductions of 32 and 26%, respectively. Respective slump reductions of 51 and 84% were recorded at 60% RCA.
- The plain concrete mixtures with 30 and 60% showed approximately 19 and 32% reductions in the cube compressive strength, respectively, relative to that of their NA-based counterparts. The respective cylinder strength reductions were 31 and 51%, signifying an increased sensitivity of the plain RCA-based mixtures to the slenderness effect. The addition of BMF at νf of 0.5% increased the compressive strength of the NSC and HSC with 30% RCA by 8%, on average. At 60% RCA, the compressive strength gain was 26–34% for the NSC and 9–13% for the HSC. The use of a higher BMF content resulted in minimal additional strength gain or a reduced strength gain. The compressive strength of all RCA-based mixtures reinforced with BMF was, however, lower than that of the NA-based plain mixture.
- The splitting tensile strengths of the plain NSC mixtures with 30 and 60% RCA were 6 and 13% lower than those of their NA-based counterparts, respectively. The plain HSC with RCA exhibited higher respective strength reductions of 29 and 28%. The BMF-reinforced NSC and HSC with 30% RCA showed splitting tensile strength gains of 12–46% and 7–53%, respectively. At 60% RCA, the use of BMF with νf ≤ 1.0% improved the splitting tensile strengths of the NSC and HSC by up to 16 and 22%, respectively. Minimal or no further enhancement in the splitting tensile strength was record at νf of 1.5%. The addition of BMF to RCA mixtures at νf of 1.0% restored the original splitting tensile strength of the NA-based plain mixture, except for the HSC with 60% RCA, where the strength was not fully restored.
- At 30% RCA, the plain NSC mixture exhibited no flexural strength reduction, whereas its HSC counterpart exhibited a flexural strength reduction of 19%. At 60% RCA, the plain NSC and HSC showed flexural strength reductions of 22 and 26%, respectively, relative to those of their NA-based counterparts. The addition of BMF at νf ≤ 1.0% improved the flexural strength of the NSC and HSC with 30% RCA by up to 18 and 59%, respectively. At νf of 1.5%, minimal additional strength gain or a declining trend of the strength occurred. The addition of BMF at νf of 1.0% to NSC and HSC with 30% RCA fully restored the original flexural strength of the NA-based mixtures. At 60% RCA, it was necessary to use νf of 1.5% to restore the original flexural strength of the NA-based concrete.
- Partial replacement of NA by RCA increased the water absorption, reduced the UPV, and decreased the abrasion resistance. The addition of BMF to the RCA-based concrete tended to reduce the water absorption, improve the abrasion resistance, and slightly increased the UPV, irrespective of the initial concrete grade.
- New idealized tensile softening laws were established for RCA-based concrete mixtures reinforced with BMF. A comparison between the numerical and experimental flexural responses verified the validity of the tensile softening laws.
- Future research should investigate the effectiveness of using hybrid basalt fibers with different lengths rather than single-length fibers in improving the properties of NA- and RCA-based concrete. The shear behavior of large-scale concrete beams made with RCA and BMF should be examined in future work.
Author Contributions
Conceptualization, T.E.-M., H.E.-H. and S.S.; methodology, T.E.-M., H.E.-H. and S.S.; software, S.S. and T.E.-M., validation, S.S. and T.E.-M.; formal analysis, S.S., T.E.-M. and H.E.-H.; investigation, S.S., T.E.-M. and H.E.-H.; resources, T.E.-M., H.E.-H. and B.E.-A.; data curation, S.S.; writing—original draft preparation, S.S.; writing—review and editing, T.E.-M., H.E.-H., B.E.-A., S.S. and M.A.; visualization, S.S.; supervision, T.E.-M., H.E.-H. and B.E.-A.; project administration, T.E.-M.; funding acquisition, T.E.-M. All authors have read and agreed to the published version of the manuscript.
Funding
This project is supported jointly by the Ministry of Energy and Infrastructure at UAE [grant number 21R083] and the United Arab Emirates University (UAEU) [grant number 12N004].
Institutional Review Board Statement
Not applicable.
Informed Consent Statement
Not applicable.
Data Availability Statement
The data presented in this study are available on request from the corresponding author. The data are not publicly available due to privacy issues.
Conflicts of Interest
The authors declare no conflict of interest.
References
- Radonjanin, V.; Malešev, M.; Marinković, S.; Al Malty, A.E.S. Green Recycled Aggregate Concrete. Constr. Build. Mater. 2013, 47, 1503–1511. [Google Scholar] [CrossRef]
- Bandow, N.; Gartiser, S.; Ilvonen, O.; Schoknecht, U. Evaluation of the Impact of Construction Products on the Environment by Leaching of Possibly Hazardous Substances. Environ. Sci. Eur. 2018, 30, 14. [Google Scholar] [CrossRef] [PubMed]
- Bakaeva, N.V.; Klimenko, M.Y. Technique for Reduction of Environmental Pollution from Construction Wastes. IOP Conf. Ser. Mater. Sci. Eng. 2017, 262, 012195. [Google Scholar] [CrossRef]
- Alzard, M.H.; El-Hassan, H.; El-Maaddawy, T. Environmental and Economic Life Cycle Assessment of Recycled Aggregates Concrete in the United Arab Emirates. Sustainability 2021, 13, 10348. [Google Scholar] [CrossRef]
- Prakash, R.; Thenmozhi, R.; Raman, S.N.; Subramanian, C. Characterization of Eco-Friendly Steel Fiber-Reinforced Concrete Containing Waste Coconut Shell as Coarse Aggregates and Fly Ash as Partial Cement Replacement. Struct. Concr. 2020, 21, 437–447. [Google Scholar] [CrossRef]
- Prakash, R.; Raman, S.N.; Subramanian, C.; Divyah, N. 6—Eco-Friendly Fiber-Reinforced Concretes. In Handbook of Sustainable Concrete and Industrial Waste Management; Colangelo, F., Cioffi, R., Farina, I., Eds.; Woodhead Publishing Series in Civil and Structural Engineering; Woodhead Publishing: Sawston, UK, 2022; pp. 109–145. ISBN 978-0-12-821730-6. [Google Scholar]
- Debieb, F.; Courard, L.; Kenai, S.; Degeimbre, R. Roller Compacted Concrete with Contaminated Recycled Aggregates. Constr. Build. Mater. 2009, 23, 3382–3387. [Google Scholar] [CrossRef]
- Guo, H.; Shi, C.; Guan, X.; Zhu, J.; Ding, Y.; Ling, T.-C.; Zhang, H.; Wang, Y. Durability of Recycled Aggregate Concrete—A Review. Cem. Concr. Compos. 2018, 89, 251–259. [Google Scholar] [CrossRef]
- Kachouh, N.; El-Hassan, H.; El-Maaddawy, T. Effect of Steel Fibers on the Performance of Concrete Made with Recycled Concrete Aggregates and Dune Sand. Constr. Build. Mater. 2019, 213, 348–359. [Google Scholar] [CrossRef]
- Kachouh, N.; El-Hassan, H.; El-Maaddawy, T. Influence of Steel Fibers on the Flexural Performance of Concrete Incorporating Recycled Concrete Aggregates and Dune Sand. J. Sustain. Cem.-Based Mater. 2021, 10, 165–192. [Google Scholar] [CrossRef]
- Balouch, S.U.; Forth, J.P.; Granju, J.-L. Surface Corrosion of Steel Fibre Reinforced Concrete. Cem. Concr. Res. 2010, 40, 410–414. [Google Scholar] [CrossRef]
- Fang, S.-E.; Hong, H.-S.; Zhang, P.-H. Mechanical Property Tests and Strength Formulas of Basalt Fiber Reinforced Recycled Aggregate Concrete. Materials 2018, 11, 1851. [Google Scholar] [CrossRef] [PubMed]
- Wang, Y.; Hughes, P.; Niu, H.; Fan, Y. A New Method to Improve the Properties of Recycled Aggregate Concrete: Composite Addition of Basalt Fiber and Nano-Silica. J. Clean. Prod. 2019, 236, 117602. [Google Scholar] [CrossRef]
- Katkhuda, H.; Shatarat, N. Shear Behavior of Reinforced Concrete Beams Using Treated Recycled Concrete Aggregate. Constr. Build. Mater. 2016, 125, 63–71. [Google Scholar] [CrossRef]
- Ali, B.; Qureshi, L.A.; Raza, A.; Nawaz, M.A.; Rehman, S.U.; Rashid, M.U. Influence of Glass Fibers on Mechanical Properties of Concrete with Recycled Coarse Aggregates. Civ. Eng. J. 2019, 5, 1007–1019. [Google Scholar] [CrossRef]
- Lee, S. Effect of Nylon Fiber Addition on the Performance of Recycled Aggregate Concrete. Appl. Sci. 2019, 9, 767. [Google Scholar] [CrossRef]
- Ahmed, T.W.; Ali, A.A.M.; Zidan, R.S. Properties of High Strength Polypropylene Fiber Concrete Containing Recycled Aggregate. Constr. Build. Mater. 2020, 241, 118010. [Google Scholar] [CrossRef]
- Meesala, C.R. Influence of Different Types of Fiber on the Properties of Recycled Aggregate Concrete. Struct. Concr. 2019, 20, 1656–1669. [Google Scholar] [CrossRef]
- Dong, J.F.; Wang, Q.Y.; Guan, Z.W. Material Properties of Basalt Fibre Reinforced Concrete Made with Recycled Earthquake Waste. Constr. Build. Mater. 2017, 130, 241–251. [Google Scholar] [CrossRef]
- Das, C.S.; Dey, T.; Dandapat, R.; Mukharjee, B.B.; Kumar, J. Performance Evaluation of Polypropylene Fibre Reinforced Recycled Aggregate Concrete. Constr. Build. Mater. 2018, 189, 649–659. [Google Scholar] [CrossRef]
- Divyah, N.; Thenmozhi, R.; Neelamegam, M.; Prakash, R. Characterization and Behavior of Basalt Fiber-Reinforced Lightweight Concrete. Struct. Concr. 2021, 22, 422–430. [Google Scholar] [CrossRef]
- Srividhya, S.; Vidjeapriya, R.; Neelamegam, M. Enhancing the Performance of Hyposludge Concrete Beams Using Basalt Fiber and Latex under Cyclic Loading. Comput. Concr. 2021, 28, 93–105. [Google Scholar]
- Prakash, R.; Thenmozhi, R.; Raman, S.N.; Subramanian, C. Fibre Reinforced Concrete Containing Waste Coconut Shell Aggregate, Fly Ash and Polypropylene Fibre. Rev. Fac. Ing. Univ. Antioquia 2020, 94, 33–42. [Google Scholar] [CrossRef]
- Ahmed, M.; Islam, S.; Nazar, S.; Khan, R.A. A Comparative Study of Popular Concrete Mix Design Methods from Qualitative and Cost-Effective Point of View for Extreme Environment. Arab. J. Sci. Eng. 2016, 41, 1403–1412. [Google Scholar] [CrossRef]
- Gebretsadik, B.; Jdidirendi, K.; Farhangi, V.; Karakouzian, M. Application of Ultrasonic Measurements for the Evaluation of Steel Fiber Reinforced Concrete. Eng. Technol. Appl. Sci. Res. 2021, 11, 6662–6667. [Google Scholar] [CrossRef]
- Moradi, N.; Tavana, M.H.; Habibi, M.R.; Amiri, M.; Moradi, M.J.; Farhangi, V. Predicting the Compressive Strength of Concrete Containing Binary Supplementary Cementitious Material Using Machine Learning Approach. Materials 2022, 15, 5336. [Google Scholar] [CrossRef] [PubMed]
- Sorelli, L.G.; Meda, A.; Plizzari, G.A. Bending and Uniaxial Tensile Tests on Concrete Reinforced with Hybrid Steel Fibers. J. Mater. Civ. Eng. 2005, 17, 519–527. [Google Scholar] [CrossRef]
- Yoo, D.-Y.; Kang, S.-T.; Yoon, Y.-S. Effect of Fiber Length and Placement Method on Flexural Behavior, Tension-Softening Curve, and Fiber Distribution Characteristics of UHPFRC. Constr. Build. Mater. 2014, 64, 67–81. [Google Scholar] [CrossRef]
- Amin, A.; Foster, S.J.; Muttoni, A. Evaluation of the Tensile Strength of SFRC as Derived from Inverse Analysis of Notched Bending Tests. In Proceedings of the VIII International Conference on Fracture Mechanics of Concrete and Concrete Structures, FraMCoS-8, Toledo, Spain, 10–14 March 2013. [Google Scholar]
- Ernst & Sohn. Fédération Internationale du Béton. In Fib Model Code for Concrete Structures; Ernst & Sohn: Lausanne, Switzerland, 2010. [Google Scholar]
- Kachouh, N.; El-Maaddawy, T.; El-Hassan, H.; El-Ariss, B. Numerical Modeling of Concrete Deep Beams Made with Recycled Aggregates and Steel Fibers. Buildings 2022, 12, 529. [Google Scholar] [CrossRef]
- Shoaib, S.; El-Maaddawy, T.; El-Hassan, H.; El-Ariss, B.; Alsalami, M. Fresh and Hardened Properties of Concrete Reinforced with Basalt Macro-Fibers. Buildings 2022, 12, 1136. [Google Scholar] [CrossRef]
- ACI Committee 211.1; Standard Practice for Selecting Proportions for Normal, Heavyweight, and Mass Concrete. American Concrete Institute: Farmington Hills, MI, USA, 2009.
- ASTM C150/C150M—19a; Standard Specification for Portland Cement. ASTM International: West Conshohocken, PA, USA, 2012.
- ReforceTech AS, Røyken, Norway. Available online: https://reforcetech.com/ (accessed on 7 August 2022).
- Sim, J.; Park, C.; Moon, D.Y. Characteristics of Basalt Fiber as a Strengthening Material for Concrete Structures. Compos. Part B Eng. 2005, 36, 504–512. [Google Scholar] [CrossRef]
- Li, Z.; Ma, J.; Ma, H.; Xu, X. Properties and Applications of Basalt Fiber and Its Composites. IOP Conf. Ser. Earth Environ. Sci. 2018, 186, 012052. [Google Scholar] [CrossRef]
- Dhand, V.; Mittal, G.; Rhee, K.Y.; Park, S.-J.; Hui, D. A Short Review on Basalt Fiber Reinforced Polymer Composites. Compos. Part B Eng. 2015, 73, 166–180. [Google Scholar] [CrossRef]
- Larrinaga, P.; Chastre, C.; Biscaia, H.C.; San-José, J.T. Experimental and Numerical Modeling of Basalt Textile Reinforced Mortar Behavior under Uniaxial Tensile Stress. Mater. Des. 2014, 55, 66–74. [Google Scholar] [CrossRef]
- ASTM C127-15; Standard Test Method for Relative Density (Specific Gravity) and Absorption of Coarse Aggregate. ASTM International: West Conshohocken, PA, USA, 2015.
- ASTM C136/C136M-19; Test Method for Sieve Analysis of Fine and Coarse Aggregates. ASTM International: West Conshohocken, PA, USA, 2020.
- ASTM C88/C88M-18; Standard Test Method for Soundness of Aggregates by Use of Sodium Sulfate or Magnesium Sulfate. ASTM International: West Conshohocken, PA, USA, 2018.
- ASTM C131-06; Standard Test Method for Resistance to Degradation of Small-Size Coarse Aggregate by Abrasion and Im pact in the Los Angeles Machine. ASTM International: West Conshohocken, PA, USA, 2006.
- ASTM C29/C29M-17a; Test Method for Bulk Density (Unit Weight) and Voids in Aggregate. ASTM International: West Conshohocken, PA, USA, 2017.
- ASTM C31/C31M; Standard Test Practice for Making and Curing Concrete Test Specimens in the Field—ELearning Course. ASTM International: West Conshohocken, PA, USA, 2010.
- ASTM C 143; Test Method for Slump of Hydraulic-Cement Concrete. ASTM International: West Conshohocken, PA, USA, 2012.
- BS EN 12350-3:2019; Testing Fresh Concrete. Vebe Test. British Standards: London, UK, 2019.
- BS EN 12390-3:2019; Testing Hardened Concrete. Compressive Strength of Test Specimens. British Standards: London, UK, 2019.
- ASTM C39; Test Method for Compressive Strength of Cylindrical Concrete Specimens. ASTM International: West Conshohocken, PA, USA, 2018.
- ASTM C469-02; Test Method for Static Modulus of Elasticity and Poissons Ratio of Concrete in Compression. ASTM International: West Conshohocken, PA, USA, 2014.
- ASTM C496/C496M-17; Test Method for Splitting Tensile Strength of Cylindrical Concrete Specimens. ASTM International: West Conshohocken, PA, USA, 2017.
- ASTM C1609/C1609M-19a; Test Method for Flexural Performance of Fiber-Reinforced Concrete (Using Beam With Third-Point Loading). ASTM International: West Conshohocken, PA, USA, 2010.
- ASTM C642-21; Standard Test Method for Density, Absorption, and Voids in Hardened Concrete. ASTM International: West Conshohocken, PA, USA, 2006.
- ASTM C1585-20; Standard Test Method for Measurement of Rate of Absorption of Water by Hydraulic-Cement Concretes. ASTM International: West Conshohocken, PA, USA, 2013.
- ASTM C1747/C1747M-13; Test Method for Determining Potential Resistance to Degradation of Pervious Concrete by Impact and Abrasion. ASTM International: West Conshohocken, PA, USA, 2013.
- ASTM C597; Standard Test Method for Pulse Velocity Through Concrete. ASTM International: West Conshohocken, PA, USA, 2016.
- Ratay, R.T. Structural Condition Assessment; Wiley: New Jersey, NB, Canada, 2005. [Google Scholar]
- ATENA Computer Software, Cervenka Consulting s.r.o.: Prague, Czech Republic. Available online: https://www.cervenka.cz/products/atena/ (accessed on 21 June 2022).
- Ashour, S.A.; Hasanain, G.S.; Wafa, F.F. Shear Behavior of High-Strength Fiber Reinforced Concrete Beams. Struct. J. 1992, 89, 176–184. [Google Scholar] [CrossRef]
Publisher’s Note: MDPI stays neutral with regard to jurisdictional claims in published maps and institutional affiliations. |
© 2022 by the authors. Licensee MDPI, Basel, Switzerland. This article is an open access article distributed under the terms and conditions of the Creative Commons Attribution (CC BY) license (https://creativecommons.org/licenses/by/4.0/).

