Abstract
Since 2010, with the rapid development of tourism in Zhagana, Yiwa township, problems with the agroforestry–pastoral complex system and economic development in Zhagana have come to the fore. In order to investigate the sustainability of the agroforestry–pastoral complex system, the ecological footprint model was used to analyse the sustainable development of the ecosystem in Yiwa township from 2005 to 2020 and the ecological security changes in Zhagana from 2010 to 2020 through examining the ecological footprint intensity, the ecosystem diversity index and the ecosystem development capacity index. The results of the study show that the per capita ecological footprint of Yiwa township showed an overall decreasing trend between 2005 and 2020, and the per capita ecological deficit also showed a decreasing trend. Forest land was the most important component of the ecological footprint per capita, and grassland was the most important component of the ecological carrying capacity per capita. The footprint depth tended to increase and then decrease, and the footprint width tended to decrease, with a gentle increase from 2010. The ecological pressure index showed an overall decreasing trend, and the ecological sustainability index showed a sudden upward fluctuation after 2016. Overall, the ecological economy of Zhagana has some capacity for development, but there is a high level of ecological pressure.
1. Introduction
Human development depends on a stable natural ecosystem [1]. Zhagana in Diebe County, Gannan Tibetan Autonomous Prefecture, has a rich heritage of ancient Tibetan villages and natural ecological resources, presenting a distinctive composite system of agriculture, forestry and pastoralism cycles. With the rapid development of the local tourism economy, various ecological problems have become increasingly prominent and human activities pose certain threats to the local environment. Therefore, it is necessary to promote the endogenous and sustainable development of the countryside through moderate, limited and orderly industrial restructuring on the basis of the goal of coordinated development of the agricultural, forestry and pastoral systems.
The ecological footprint theory was proposed by the Canadian ecological economist Rees et al. in the early 1990s, who calculated the ecological footprint from the demand side and the ecological carrying capacity from the supply side, and measured whether the ecological environment of a region was in a sustainable state through a comparison of the two [2]. In turn, the ecological footprint theory and its research methods gradually spread from economics to geography, ecology, management, sociology and other research fields [3,4,5,6]. At present, few relevant studies exploring the dynamic evolution of the ecological footprint and carrying capacity in agriculture, forestry and pastureland can be seen, and the corresponding modelling methods need further improvement.
2. Research Methodology
This paper used time series based on the ecological footprint theory to quantitatively estimate and visualise the dynamic evolution of ecosystems, calculate the ecological pressure index, ecological sustainability index, ecological coordination coefficient, ecological footprint diversity index, and economic system development capacity ratio to assess the natural capital of the study area for ecological security, and explore the driving forces behind the formation of the three-dimensional ecological footprint natural capital pattern.
The ecological footprint theory has a unified system of evaluation indicators that allow for horizontal comparisons at different spatial scales. By comparing the ecological footprint of the study area over the years, a longitudinal comparison can be made over the time scale of the area to grasp dynamic changes in ecology [7]. Through calculating the ecological footprint of Yiwa township over the years, dynamic changes in ecology within Zhagana could be grasped, providing a quantitative analysis index system for the analysis of arable land, grazing land and woodland processes. The upward/downward trend of the ecological carrying capacity surplus or (deficit) would become an important indicator of the ecological dynamics of the study area.
The results of the ecological footprint calculation would be an important basis for judging the ecological development stage and sustainable development capacity of Yiwa township, and at the same time provide a control basis for the direction and objectives of development of the agroforestry–pastoral complex system; they would provide a basis for prediction and comparative analysis of the ecological effects on local ecological security.
2.1. Ecological Footprint Calculation
Many academics considered the ecological footprint to be the total biologically productive area (including land and water) needed to produce all the resources consumed by the population in a given region and to absorb all the waste generated by that population [8,9,10]. It is the biologically productive land area needed to produce all the resources consumed by the population of a region and to absorb all the waste generated by the region. It is calculated as:
In the equation, is the total ecological footprint, is the number of people; is the ecological footprint per capita; is the per capita consumption of commodity, is the average productive capacity of consumer commodity, and is the type of consumer commodity and input. The ecological footprint analysis method accounts for biologically productive land on the earth’s surface in six main categories (fossil energy land, arable land, pasture land, forest land, construction land, and water), based on differences in productivity magnitude.
2.2. Ecological Carrying Capacity Calculation
Ecological footprint supply (ecological carrying capacity) is calculated by the following formula:
where is the total ecological carrying capacity of the region, is the population, is the ecological carrying capacity per capita (hm2/person), is the biological production area per capita, is the equilibrium factor, and is the yield factor. The balance factor is based on data from the China Ecological Footprint Report 2019, as shown in Table 1 below.

Table 1.
Equilibrium factors and yield factors for each type of productive land.
2.3. Ecological Deficit/Profit and Loss
Ecological deficit is the difference between the ecological footprint and the ecological carrying capacity [11,12]. It is calculated by the formula:
where is the ecological deficit or surplus. When > 0, it denotes an ecological surplus, i.e., the resources needed for production and living are less than the resources the region can provide, indicating that the land use and environmental conditions in the region are good. When < 0, it denotes an ecological deficit, indicating that the ecological environment is overloaded. In other words, the resources required for production and living are greater than the resources the region can provide, and the region is under high ecological pressure. This determines whether the development of the region is within the ecological carrying capacity.
2.4. Three-Dimensional Ecological Footprint Calculation
The three-dimensional ecological footprint is expressed using footprint depth and footprint breadth. Footprint depth refers to the extent to which humans consume natural resources and the level of human use of the capital stock. Footprint breadth refers to the size of the output of natural resources and the level of utilisation of capital flows.
In the above equation and are the depth and breadth of the footprint; refers to the ecological footprint of Class i land, while denotes the ecological carrying capacity of Class i land. When ≤ , it indicates an ecological surplus, and = 1, and when > , it indicates an ecological deficit, and > 1 [13].
2.5. Ecological Pressure Index
The ecological pressure index reflects the intensity of the disturbance to ecosystems caused by human activities, using the capacity of the “natural–economic–social” complex ecosystem as a reference point. It is calculated using the formula [14,15]:
where < 1 indicates that the intensity of disturbance caused by human activities has not yet exceeded the self-feedback threshold of the regional ecosystem under specific conditions, and ecological security is still guaranteed, while the opposite will affect the ecosystem balance. The higher the ecological pressure index, the greater the intensity of the disturbance to the ecosystem’s equilibrium, and the greater the threat to ecological security [16].
Based on the acquired basic and standard data, the ecological safety assessment is graded according to the following grading criteria, as shown in Table 2 below.
Table 2.
Eco-safety assessment grading.
2.6. Ecological Sustainability Index
The Ecological Sustainability Index () indicates the extent to which a region is ecologically sustainable in its use. The formula is:
The meanings of and are the same as before. 0 < < 1, where the smaller the value, the weaker the ecological sustainability, and vice versa.
2.7. Ecological Coordination Coefficient
Ecological deficits/surpluses do not well reflect the resource endowment conditions of different regions, and are prone to yielding biased results when performing cross-sectional comparisons between regions. For example, the same ecological deficit value has a different meaning for the western arid region than for the southeastern coastal region; in addition, in underdeveloped regions, lower consumption levels often result in ecological surpluses, but the conclusion that local development is more sustainable may be erroneous. Therefore, in evaluating the regional ecological footprint, the regional per capita ecological coordination coefficient (DS) can be introduced to compensate for the inadequacy of using the ecological deficit/surplus for evaluation.
When = 1.414, regional ecological demand and supply are balanced and in the best state of coordination; when 1 ≤ DS < 1.414, there are two cases: if > , regional ecological demand is greater than supply, development attempts to make up for the lack of ecological carrying capacity by depleting the stock of natural capital, and the region is in a state of ecological incoherence.
2.8. Ecological Diversity Index and Index of Development Capacity of Ecological and Economic Systems
The Shannon–Weaver formula was used to calculate the diversity index of the ecological footprint by introducing the economic system development capacity formula into the ecosystem, and different land types were used as indicators to measure the diversity of the ecological and economic system [17], calculated as follows:
In the above equation, is the ecological footprint diversity index; is the proportion of the total footprint accounted for by the land type. The ecological footprint diversity in the above equation is made up of two components: richness (the amount of different land types utilised) and evenness (a measurement of the distribution of ecological footprint components). According to this formula, the closer the distribution of the ecological footprints in an ecosystem is to equality, the more diverse the ecosystem is for a given system component, and the more stable the system is, in line with the ecological concept that “diversity leads to stability” [18,19].
The developmental capacity of an ecosystem can be obtained by multiplying the ecological footprint by the ecological footprint diversity index, using the following formula:
In the above equation, is the Ecosystem Development Capacity Index.
3. Spatial Identification of Agroforestry–Pastoral Complex Systems
3.1. Overview of the Study Area
The township of Yiwa is located in the northwestern part of Diebe County, Gannan Tibetan Autonomous Prefecture, Gansu Province, and lies in the middle and upper reaches of the Bailong River, which is one of the temperate forest areas with the richest seed plant species diversity in China as well as the area with the highest concentration of coniferous species distribution in Gansu Province, as shown in Figure 1. In May 2013, Zhagana was named in the first batch of China’s Important Agricultural Cultural Heritage and, in March 2016, it was inscribed on the Preliminary List of China’s Globally Important Agricultural Cultural Heritage [20,21]. In 2017, the “Diebe Zhagana Agroforestry–Pastoral Complex System” in Gansu Province was selected for inclusion in the list of globally important agricultural cultural heritage systems (GIAHS) by FAO experts. While improving the economy, society and people’s living standards, protecting the local ecological environment and biodiversity and achieving sustainable economic and social development is an important challenge for Yiwa township.
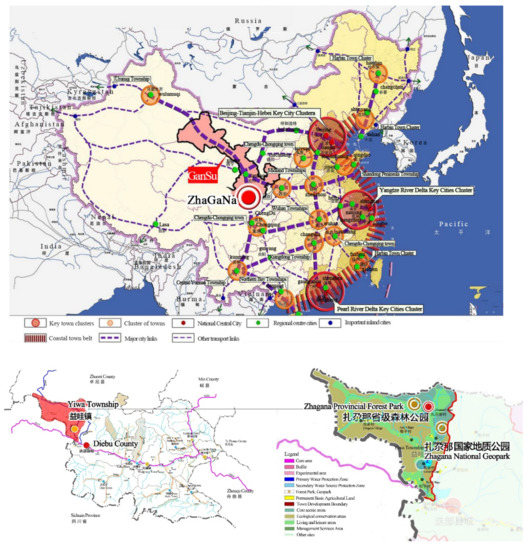
Figure 1.
Spatial distribution of restrictive elements in Yiwa township.
Local agriculture is at risk from biodiversity reduction, loss of traditional agricultural techniques and knowledge, agro-ecological degradation, and even imbalance in complex systems due to excessive tourism. The increase in surface facilities built for tourism disturbed traditional agricultural and pastoral planting areas, and the population of Yiwa township has risen steadily in recent years, as shown in Figure 2. In 2017, Zhagana topped the ranking of scenic heat gain within Gansu with a 305.2% increase, and rose from fourth to first place in the province, as shown in Figure 3.
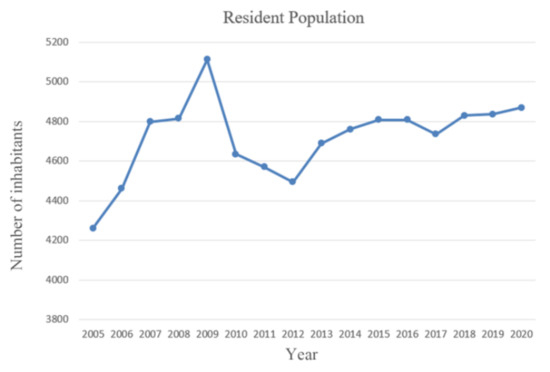
Figure 2.
Population change in Yiwa township.
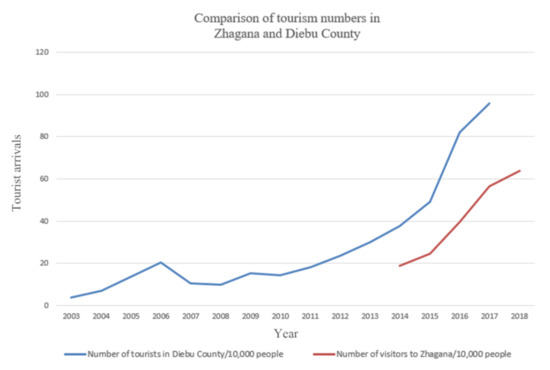
Figure 3.
Growth in tourism in Zhagana.
3.2. Data Sources
The statistical data used in this study were obtained from statistical yearbooks and the remote sensing data were Landsat images from the GEE platform used to construct the China Land Cover Dataset (CLCD) for the period 1985–2020. Comparisons were made with the current state-of-the-art 30 m thematic products, including impermeable surface area (ISA), surface water and forests, to assess the quality of the CLCD in an integrated manner. Finally, the accuracy of the CLCD was assessed by visually interpreting independent samples and third-party test samples to obtain data on various productive land types for a 30 m × 30 m grid from 2005–2020 [22,23,24,25]. As Figure 4 shows, the glacial erosion topography and mounded landforms in Yiwa town are both typical and have special ecological protection functions.
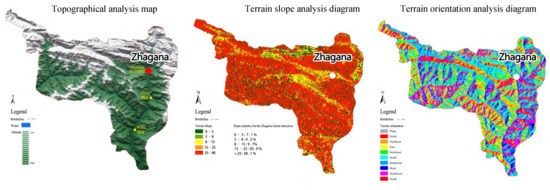
Figure 4.
Diagram of the current status of the land in Yiwa township.
The data for global average yields were mainly obtained from the Food and Agriculture Organization of the United Nations (FAO) statistical database. The area balance factors and yield factors for each land type were obtained from the Working Guidebook to the National Footprint and Biocapacity Accounts, published by the Global Ecological Footprint Network (GEFN) [26,27]; for statistical convenience, this paper combines raw coal, coke, gasoline, oil and natural gas into fossil energy land, and includes electricity as construction land, as shown in Table 3 below.
Table 3.
Composition of biological resources and energy pollution sources.
4. Analysis of Results
Ecological problems emerge as a dynamic and cumulative process over time, and the ecological footprint, as a quantitative measure of sustainable development status, reflects the extent of human use of nature [28]. Ecological status was analysed using a time-series approach combined with an ecological footprint model, and the spatial visualisation function in ArcGIS10.8 was used to spatially analyse the composition of arable land, forest land, grassland, construction land and water in Yiwa township from 2005 to 2020, as shown in Figure 5.
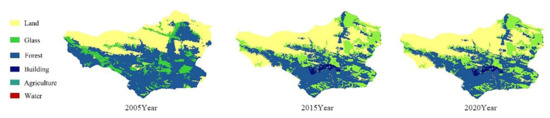
Figure 5.
Changes in the ecological footprint in Zhagana.
4.1. Analysis of the Temporal Dynamics of the Ecological Footprint per Capita
As can be seen from Table 4, the per capita ecological footprint of Yiwa township from 2005 to 2020 showed a decreasing trend, with the smallest proportion in the per capita ecological footprint of the water area, with an annual average of 0.02%.
Table 4.
Ecological footprint in Yiwa Township, 2005–2020.
In the overall performance of the ecological footprints of agriculture, forestry and livestock, there was an overall decreasing trend. Among them, arable land had the most significant decreasing trend, from 0.26 hm2/person in 2005 to 0.1834 hm2/person in 2020, and its annual average ecological footprint share was 2.75%. During the same period, grassland declined from 2.2642 hm2/person to 1.9358 hm2/person, with its average annual ecological footprint share being 29.08%. The ecological footprint of fossil fuel land and construction land, in contrast to the change in the total ecological footprint per capita, started to rise after 2017, mainly because the local tourism industry started to increase significantly, resulting in increased motor vehicle travel and construction of tourism facilities. Otherwise, the compound land use of agriculture, forestry and animal husbandry accounted for a high proportion of the six categories of ecologically productive land, reaching 97.12%, mainly contributing to the ecological footprint per capita, with grassland second only to forest land, which is closely related to the nomadic life of local residents in Yiwa town.
4.2. Analysis of the Temporal Dynamics of the Ecological Carrying Capacity per Capita
As can be seen from Table 5, the per capita ecological carrying capacity of Yiwa township from 2005 to 2020 showed a continuous decreasing trend. The ecological carrying capacity of forest land > grassland > building land > cultivated land > water area, of which the ecological carrying capacity of forest land accounted for the largest proportion of the average value of the total ecological carrying capacity, with a value of 82.35%. The ecological carrying capacity of cropland was consistent with the change in total ecological carrying capacity per capita, showing a decreasing trend year by year, from 0.4345 hm2/person to 0.3044 hm2/person, with an average annual decrease rate of 0.10%. The share of grassland and water in the total ecological carrying capacity also showed a decreasing trend, with grassland decreasing from 6.85% to 6.34% and water decreasing by 0.01%; only the share of building land showed an increasing trend, from 0.96% to 6.06%, as the total ecological carrying capacity decreased, indicating that the area occupied was arable land. In terms of contribution to ecological carrying capacity, three types of ecologically productive land—arable land, forest land and construction land—were the main contributors.
Table 5.
Ecological carrying capacity in Yiwa township, 2005–2020.
As can be seen from Table 6, the Zhagana ED was consistently negative in 2010, 2015 and 2020, i.e., it showed an ecological deficit. The larger the difference between the ecological carrying capacity per capita energy value and the ecological footprint per capita energy value, the more serious the ecological deficit situation, i.e., the more difficult it is for the study area to develop sustainably. The ecological footprint of the per capita arable land in Zhagana increased each year between 2010 and 2020 and reached a peak, but then dropped to a ten-year low in 2015.
Table 6.
Changes in the ecological footprint in Zhagana.
4.3. Analysis of the Temporal Dynamics of Ecological Surplus and Deficit per Capita in Yiwa Township from 2005 to 2020
As can be seen from Table 7, the ecological surplus and deficit of Yiwa Township from 2005 to 2020 showed a deficit, but this decreased year by year from 2017 onwards. The overall average annual decline rate was 1.62%, from 1.1495 hm2/capita in 2005 to 0.8520 hm2/capita in 2020. Only arable land, forest land and construction land were in ecological surplus, while the other four categories were in ecological deficit. The proportion of ecologically productive land in ecological surplus was grassland (95.97%) > fossil fuel land (3.97%) > water (0.06%). The ecological surplus of cropland decreased from 0.1728 hm2/person to 0.1210 hm2/person, with an average annual decline rate of 1.87%; the ecological deficit of grassland decreased from 1.8340 hm2/person to 1.5680 hm2/person, with an average annual decline rate of 0.91%; the ecological surplus of forest land decreased from 0.4866 hm2/person to 0.4345 hm2/person, with an average annual decline rate of 0.67%. The study shows that the overall surplus and deficit in the region changed for the better from 2017 onwards, mainly due to a gradual increase in agricultural production offsetting consumption in the ecological footprint calculation; the improvement in the ecological deficit was not due to an increase in the ecological carrying capacity of the local agroforestry–pastoral complex.
Table 7.
Ecological deficit or surplus by land type in Yiwa township, 2005–2020.
4.4. Dynamic Analysis of Three-Dimensional Ecological Footprint
As can be seen from Figure 6, the depth of the footprint of Yiwa township showed a trend towards increasing and then decreasing from 2005 to 2020, while the breadth of the footprint showed a gradual decrease followed by an increasing trend from 2010 onwards. The breadth of the footprint in Yiwa was lower and more moderate, and the increasing trend year on year indicated that Yiwa took up more and more capital flows in the development process. This finding suggests a change in the development model of Yiwa township, whereby development gradually shifted towards capital stock for economic development while the sustainable use of natural capital diminished. The years 2010–2013 saw an increase in the depth of the footprint, indicating that too much capital stock was consumed during this period and resources were gradually reduced; 2017–2020 saw a gradual decrease, indicating a change in the development model of Yiwa township, with the consumption of capital stock gradually decreasing under the vigorous promotion of ecological development. The depth of the footprint in Yiwa township was more balanced, indicating that Yiwa township currently has less demand than supply in the use of resources and can rely on its own capital stock to supplement it.
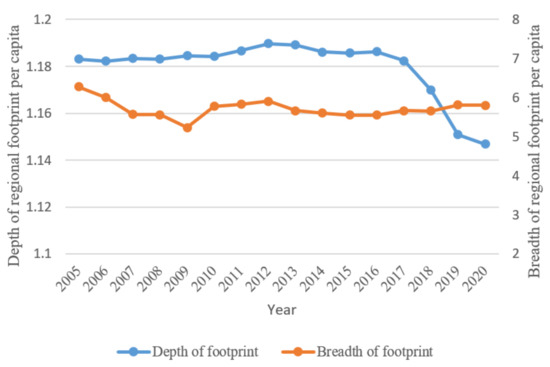
Figure 6.
Dynamics of footprint depth and breadth in Yiwa township, 2005–2020.
4.5. Dynamic Analysis of Ecological Pressure Index and Ecological Sustainability Index
The ecological pressure index and ecological sustainability index of Yiwa township from 2005 to 2020 were calculated from Equations (6) and (7), as shown in Figure 7. The Ecological Pressure Index EPI started to show a decreasing trend from 2012, from 1.1897 to 1.1468, a decrease of 0.96 times with an average annual decrease rate of 0.54%, indicating that the ecological overload in Yiwa township eased in 2017 and the ecological pressure decreased. The Ecological Sustainability Index (ESI) for Yiwa township showed a decline until 2012 and a sudden upward fluctuation after 2016. The ESI for Yiwa township increased from 0.4582 in 2017 to 0.4658 in 2020, and continued to fluctuate in the range of 0.4609–0.4658 in the intervening years. Overall, the ecological sustainability index for Yiwa township was generally low over the study period, but the pressure on sustainable development eased in recent years.
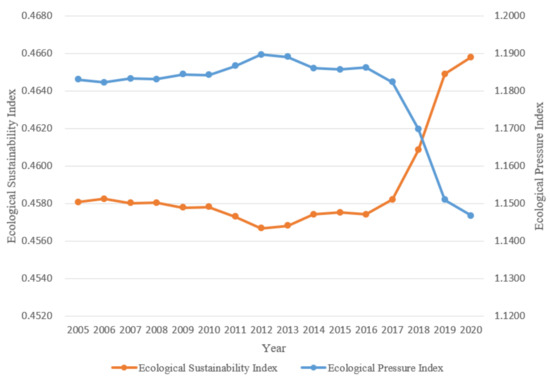
Figure 7.
Dynamics of the Ecological Pressure and Ecological Sustainability Index in Yiwa township, 2005–2020.
5. Analysis of Ecological Security Changes in Zhagana
In order to more accurately describe the status of the resource and environmental carrying capacity of the study area, the ecological pressure index can be used to measure the degree of overloading of the ecological footprint of the energy value [29]. This model is different from the absolute perspective of ecological deficit/surplus, as it considers the changes in ecological pressure in Zhagana in 2010, 2015 and 2020 in terms of relative numbers; the calculation results are shown in Table 8.
Table 8.
Changes in ecological pressure index in Zhagana.
The ecological coherence coefficient for Zhagana changed smoothly between 2010 and 2020, slightly above 1.4, indicating average ecological coherence of development. Zhagana’s ecological footprint diversity index decreased year by year from 0.86 in 2010 to 0.49 in 2020, indicating that Zhagana’s ecological footprint uniformity (which measures the distribution status of ecological footprint components) was poor. In addition, the mean value of Zhagana’s ecosystem development capability index was 3.41 between 2010 and 2020, with an overall slow increase except for an abrupt increase in 2017, indicating that Zhagana’s ecosystem development capability gradually increased (Table 9).
Table 9.
Ecological sustainability analysis of Zhagana.
6. Conclusions and Discussion
6.1. Discussion
Comparing the measured natural capital results with existing studies that use the ecological footprint model with refined equilibrium and yield factors to calculate the ecological safety assessment [30,31], there is a deficit in capital and differences in the natural capital values, but the overall trend change is consistent. The reason may be related to the time sequence of the study, the refinement of the equilibrium and yield factors and the calculation of footprint account items. In terms of capital use tracking, the study area has low natural capital and high consumption of water resources, and needs to respond to the call for management and rational exploitation of water resources; in addition, the industrial structure needs to be optimized [32,33,34,35], with equal emphasis on ecological protection and resource development, so that capital mobility could be improved and stock consumption reduced; finally, relevant policies and regulations on environmental protection and environmental protection mechanisms need to be established to promote sustainable ecological development. From the perspective of the driving mechanism of the evolution of natural capital in the three-dimensional ecological footprint, the economic, social and technological development of the study area has a transmission mechanism for the appropriation of capital, and economic development is still dependent on the consumption of capital and energy. In summary, this study does a good job in assessing and calculating the ecological security of the study area in terms of driving force analysis, but there are still some shortcomings, and future studies should choose a longer time series; the selection of footprint account items and driving force factors also needs to be more comprehensive. In addition, the lack of water resources in the study area and the overall small results of the improved watershed equilibrium factor lead to an overall small ecological footprint for water resources, and subsequent measurement of the water footprint needs to be increased.
6.2. Conclusions
(1) The per capita ecological footprint of Yiwa township showed a general trend of decrease during 2005–2020, and the per capita ecological footprint of all types of ecological land was accounted for mainly by forestry land with the smallest amount being water. At the same time, the ecological carrying capacity per capita also showed a decrease, and the rate of decline was faster than the ecological footprint per capita, so the ecological deficit of Yiwa township became gradually significant. The ecological pressure gradually eased during the post-2017 period, where the ecological deficit was mainly due to the increase in fossil energy consumption and construction land. The footprint depth showed a trend of increasing and then decreasing, indicating that the problem of capital stock being continuously depleted became improved, while the change in footprint breadth flattened out the upper body trend, indicating that the appropriation of capital flow increased year by year.
(2) The sustainable development of Yiwa township was assessed by calculating its ecological pressure index (EPI) and ecological sustainability index (ESI) from 2005 to 2020. The ecological pressure index (EPI) was found to generally decrease over the last decade, and the ecological overload was reduced; the ecological sustainability index (ESI) showed a decline before 2012 and an increase and fluctuation after 2016, and was generally in a weakly unsustainable development stage.
(3) The driving force analysis model showed that there was a transmission mechanism for the economic, social and technological development of the study area via the appropriation of capital. Zhagana has a large share of forests and water and a high biological richness index, but the watershed ecosystem is affected by the poor storage capacity of the river network, while the demand for water resources increases. In the more economically developed and densely populated villages, due to the pollution of land and water resources caused by the massive discharge of tourism pollutants, the environmental pressure per their unit area remains high. Economic development still relies on the consumption of capital energy and investment in the level of science and technology needs to increase, the energy structure needs to improve, and the efficiency of energy use needs to increase; the industry needs to accelerate its transformation, improve the economic system and reduce its dependence on capital.
(4) The overall ecological resources of the study area are under great pressure and the efficiency of resource use is low. It is urgent to maintain the integrity of the spatial pattern of Zhagana’s agricultural, forestry and pastoral systems, to strengthen the continuity of natural processes to achieve regional ecological security, and to establish a Zhagana ecological spatial system. A networked, highly connected ecological infrastructure framework should be constructed with important agricultural, forestry and pastoral systems as panels and trunk streams and main roads as corridors, allowing important ecological functions such as biodiversity maintenance, water connotation and soil conservation to be properly exercised.
Author Contributions
Writing and editing, S.Z.; conceptualisation, X.X. and S.Z.; methodology, S.Z. and X.X.; funding acquisition, X.X. All authors have read and agreed to the published version of the manuscript.
Funding
This work was supported by the National Social Science Foundation of China, grant number 51968037, and Gansu Provincial Science and Technology Plan Project, grant number 21CX6ZA072.
Institutional Review Board Statement
Not applicable.
Informed Consent Statement
Informed consent was obtained from all participants involved in this study.
Data Availability Statement
The data that support the findings of this study are available from the corresponding author upon reasonable request.
Acknowledgments
The authors wish to thank in advance the editor and reviewers for their contribution in the submission and revision phases, most importantly, my supervisor for her guidance.
Conflicts of Interest
The authors declare no conflict of interest.
References
- Moore, J.; Kissinger, M.; Rees, W.E. An urban metabolism and ecological footprint assessment of Metro Vancouver. J. Environ. Manag. 2013, 124, 51–61. [Google Scholar] [CrossRef] [PubMed]
- Yang, L.; Yang, Y. Evaluation of eco-efficiency in China from 1978 to 2016: Based on a modified ecological footprint model. Sci. Total Environ. 2019, 662, 581–590. [Google Scholar] [CrossRef] [PubMed]
- Salvo, G.; Simas, M.S.; Pacca, S.A.; Guilhoto, J.J.; Tomas, A.R.; Abramovay, R. Estimating the human appropriation of land in Brazil by means of an Input–Output Economic Model and Ecological Footprint analysis. Ecol. Indic. 2015, 53, 78–94. [Google Scholar] [CrossRef]
- Wang, M.; Liu, J.; Wang, J.; Zhao, G. Ecological Footprint and Major Driving Forces in West Jilin Province, Northeast China. Chin. Geogr. Sci. 2010, 20, 434–441. [Google Scholar] [CrossRef]
- Jin, C.; Liu, Y.; Li, Z.; Gong, R.; Huang, M.; Wen, J. Ecological consequences of China’s regional development strategy: Evidence from water ecological footprint in Yangtze River Economic Belt. Environ. Dev. Sustain. 2022, 1–16. [Google Scholar] [CrossRef]
- Liu, Y.; Qu, Y.; Cang, Y.; Ding, X. Ecological security assessment for megacities in the Yangtze River basin: Applying improved emergy-ecological footprint and DEA-SBM model. Ecol. Indic. 2022, 134, 108481. [Google Scholar] [CrossRef]
- Yao, X.; Wang, Z.; Zhang, H. Dynamic changes of the ecological footprint and its component analysis response to land use in Wuhan, China. Sustainability 2016, 8, 329. [Google Scholar] [CrossRef]
- Wackernagel, M.; Onisto, L.; Bello, P.; Linares, A.C.; Falfán IS, L.; Garcıa, J.M.; Guerrero, A.I.S.; Guerrero, M.G.S. National natural capital accounting with the ecological footprint concept. Ecol. Econ. 1999, 29, 375–390. [Google Scholar] [CrossRef]
- Zhou, T.; Wang, Y.P.; Gong, J.Z.; Wang, F.; Feng, Y.F. Model revision and method improvement of ecological footprint. J. Ecol. 2015, 35, 4592–4603. [Google Scholar]
- Koohafkan, P.; Altieri, M.A. Globally Important Agricultural Heritage Systems: A Legacy for the Future; Food and Agriculture Organization of the United Nations: Rome, Italy, 2011. [Google Scholar]
- Kajihara, H.; Zhang, S.; You, W.; Min, Q. Concerns and opportunities around cultural heritage in east Asian globally important agricultural heritage systems (GIAHS). Sustainability 2018, 10, 1235. [Google Scholar]
- Ke, H.; Yang, W.; Liu, X.; Fan, F. Does innovation efficiency suppress the ecological footprint? Empirical evidence from 280 Chinese cities. Int. J. Environ. Res. Public Health 2020, 17, 6826. [Google Scholar] [CrossRef]
- Shi, S.; Hu, B.; Yan, Y.; Li, X.; Zhou, K.; Tang, C.; Xie, B. Dynamic evolution of the ecological carrying capacity of poverty-stricken karst counties based on ecological footprints: A case study in Northwestern Guangxi, China. Int. J. Environ. Res. Public Health 2020, 17, 991. [Google Scholar] [CrossRef]
- Chunling, L.; Memon, J.A.; Thanh, T.L.; Ali, M.; Kirikkaleli, D. The impact of public-private partnership investment in energy and technological innovation on ecological footprint: The case of Pakistan. Sustainability 2021, 13, 10085. [Google Scholar] [CrossRef]
- Guo, J.; Ren, J.; Huang, X.; He, G.; Shi, Y.; Zhou, H. The dynamic evolution of the ecological footprint and ecological capacity of Qinghai Province. Sustainability 2020, 12, 3065. [Google Scholar] [CrossRef]
- Kirikkaleli, D.; Adebayo, T.S.; Khan, Z.; Ali, S. Does globalization matter for ecological footprint in Turkey? Evidence from dual adjustment approach. Environ. Sci. Pollut. Res. 2021, 28, 14009–14017. [Google Scholar] [CrossRef]
- Xiao, Y.; Ou, Y.; Qu, X.; Zhang, L.; Zhang, X.; Jun, X. Determining the Regional Carrying Capacity of the Wuhan City Circle Based on the Improved Ecological Footprint Method. JAWRA J. Am. Water Resour. Assoc. 2021, 57, 585–601. [Google Scholar] [CrossRef]
- Zhang, H.; Xiao, Y.; Deng, Y. Island ecosystem evaluation and sustainable development strategies: A case study of the Zhoushan Archipelago. Glob. Ecol. Conserv. 2021, 28, e01603. [Google Scholar] [CrossRef]
- Tong, S.; Zhiming, F.; Yanzhao, Y.; Yumei, L.; Yanjuan, W. Research on land resource carrying capacity: Progress and prospects. J. Resour. Ecol. 2018, 9, 331–340. [Google Scholar] [CrossRef]
- Guo, X.R.; Yang, J.R.; Mao, X.Q. Calculation and analysis of urban ecological footprint: A case study of Guangzhou. Geogr. Res. 2003, 22, 654–662. [Google Scholar]
- Wackernagel, M.; Rees, W. Our Ecological Footprint: Reducing Human Impact on the Earth; New Society Publishers: Gabriola, BC, Canada, 1998. [Google Scholar]
- Jeswani, H.K.; Azapagic, A. Water footprint: Methodologies and a case study for assessing the impacts of water use. J. Clean. Prod. 2011, 19, 1288–1299. [Google Scholar] [CrossRef]
- Mancini, M.S.; Galli, A.; Niccolucci, V.; Lin, D.; Bastianoni, S.; Wackernagel, M.; Marchettini, N. Ecological Footprint: Refining the carbon Footprint calculation. Ecol. Indic. Integr. Monit. Assess. Manag. 2016, 61, 390–403. [Google Scholar] [CrossRef]
- Liu, Z.; Li, B.; Chen, M.; Li, T. Evaluation on sustainability of water resource in karst area based on the emergy ecological footprint model and analysis of its driving factors: A case study of Guiyang city, China. Environ. Sci. Pollut. Res. 2021, 28, 49232–49243. [Google Scholar] [CrossRef] [PubMed]
- Chen, H.S. Evaluation and analysis of eco-security in environmentally sensitive areas using an emergy ecological footprint. Int. J. Environ. Res. Public Health 2017, 14, 136. [Google Scholar] [CrossRef] [PubMed]
- Dietz, T.; Rosa, E.A. Effects of population and affluence on CO2 emissions. Proc. Natl. Acad. Sci. USA 1997, 94, 175–179. [Google Scholar] [CrossRef] [PubMed]
- Qureshi, M.I.; Elashkar, E.E.; Shoukry, A.M.; Aamir, A.; Mahmood, N.H.N.; Rasli, A.M.; Zaman, K. Measuring the ecological footprint of inbound and outbound tourists: Evidence from a panel of 35 countries. Clean Technol. Environ. Policy 2019, 21, 1949–1967. [Google Scholar] [CrossRef]
- Guo, J. Evaluation and Prediction of Ecological Sustainability in the Upper Reaches of the Yellow River Based on Improved Three-Dimensional Ecological Footprint Model. Int. J. Environ. Res. Public Health 2022, 19, 13550. [Google Scholar] [CrossRef]
- Yin, Y.; Han, X.; Wu, S. Spatial and temporal variations in the ecological footprints in Northwest China from 2005 to 2014. Sustainability 2017, 9, 597. [Google Scholar] [CrossRef]
- Wei, S.; Pan, J.; Liu, X. Landscape ecological safety assessment and landscape pattern optimization in arid inland river basin: Take Ganzhou District as an example. Hum. Ecol. Risk Assess. Int. J. 2020, 26, 782–806. [Google Scholar] [CrossRef]
- Wang, G. Evaluation and Analysis of Sustainable Development of Regional Ecological Economy Based on Ecological Footprint Model. Ekoloji 2019, 28, 2099–2103. [Google Scholar]
- Li, P.; Zhang, R.; Wei, H.; Xu, L. Assessment of physical quantity and value of natural capital in China since the 21st century based on a modified ecological footprint model. Sci. Total Environ. 2022, 806, 150676. [Google Scholar] [CrossRef]
- Rees, W.E. Ecological Footprints and Appropriated Carrying Capacity: What Urban Economics Leaves Out; The Earthscan Reader in Rural–Urban Linkages; Routledge: London, UK, 2018; pp. 285–297. [Google Scholar]
- Ecotourism and Environmental Sustainability: Principles and Practice; Ashgate Publishing, Ltd.: Farnham, UK, 2009.
- Rees, W. Ecological Footprint//Companion to Environmental Studies; Routledge: London, UK, 2018; pp. 43–48. [Google Scholar]


Publisher’s Note: MDPI stays neutral with regard to jurisdictional claims in published maps and institutional affiliations. |
© 2022 by the authors. Licensee MDPI, Basel, Switzerland. This article is an open access article distributed under the terms and conditions of the Creative Commons Attribution (CC BY) license (https://creativecommons.org/licenses/by/4.0/).