Article

Research on Prediction of Coal Sample Deformation Based on Acoustic-Emission Sensitive Index

1
State Key Laboratory of Coking Coal Exploitation and Comprehensive Utilization, Pingdingshan 467099, China
2
College of Municipal and Environmental Engineering, Henan University of Urban Construction, Pingdingshan 467099, China
3
State Key Laboratory of Coal Mine Disaster Dynamics and Control, Chongqing University, Chongqing 400044, China
*
Author to whom correspondence should be addressed.
Sustainability 2022, 14(22), 14875; https://doi.org/10.3390/su142214875
Submission received: 21 October 2022 / Revised: 2 November 2022 / Accepted: 7 November 2022 / Published: 10 November 2022
(This article belongs to the Special Issue Coal and Rock Dynamic Disaster Monitor and Prevention)

Abstract

:
Establishing the relationship between the deformation of coal samples and acoustic emission response is the basis for the deformation prediction of coal samples. Using a combination of laboratory tests and theoretical analysis, acoustic emission tests of the uniaxial loading process were conducted on coal samples in the study area and the test results were analyzed, focusing on the rule of variation of acoustic emission counts with loading time. Based on the analysis of stress, strain, time, and acoustic-emission parameters variation, the relationship between the deformation of coal samples and acoustic emission response was established and analyzed. The analysis results show that during the loading process, the acoustic emission counts show the characteristics of stage changes, which can be divided into three stages: the initial stage with sporadic acoustic emission events, the middle stage with a stable increase of acoustic emission events, and the final stage with the rapid increase of acoustic emission events. This stage division has good consistency with the deformation stages of coal samples. Moreover, the acoustic emission counts have obvious and easily identifiable characteristics of changes in the deformation process of coal samples. The acoustic emission count can be used as a sensitive indicator in this study area to predict the deformation of coal samples. It provides a reference for the application of acoustic-emission prediction technology in this study area, which is important to improve the accuracy of geohazard prediction.

1. Introduction

The study of coal–rock sample deformation prediction is the basis for the accurate prediction of coal mine geological hazards. Due to uneven local deformation, the process of deformation of coal–rock samples is often accompanied by acoustic and electromagnetic waves and other accompanying phenomena. For this reason, some scholars have studied the relationship between coal–rock deformation and associated phenomena starting from these associated phenomena, and gradually formed a variety of prediction techniques, such as the ultrasonic prediction technique for coal–rock deformation, the acoustic-emission prediction technique [1,2], microseismic prediction technique [3,4], electromagnetic radiation prediction technique [5,6,7,8], infrared radiation [9,10,11], and infrasound prediction technique [12,13,14,15,16]. Ultrasonic signals decay quickly and receive little information; electromagnetic radiation monitoring is effective and easily disturbed by surrounding electromagnetic waves; infrasound and microseismic signals decay slowly but have the deficiency of difficult localization. Of these techniques, acoustic emission prediction technology has attracted many scholars to conduct related research on account of its simple principle and easy operation. Because the test process is susceptible to interference affecting the reliability of monitoring results, it has inspired some scholars to conduct exploratory research from several aspects. Some scholars have loaded coal–rock samples under different loading methods such as uniaxial loading, triaxial loading, cyclic loading, and unloading of the surrounding pressure, analyzed the differences in acoustic emission response characteristics under different loading methods, and studied the mechanism causing the variability of acoustic emission [17,18,19,20,21,22]. Some scholars have tested the acoustic emission response characteristics under different experimental conditions such as different loading speeds and surrounding pressure, and analyzed the influence of experimental conditions on the acoustic emission response characteristics [23,24,25]. Some scholars have tested the acoustic emission response characteristics of coal samples, rock samples, and coal–rock combination samples under different sample conditions such as water content, metamorphism degree, damage degree, lithology, and homogeneity, and analyzed the mechanism of the influence of different sample conditions on the acoustic emission response [26,27,28,29].
Many research results have been obtained by previous scholars on the acoustic emission characteristics of the coal sample-loading process [30,31,32]. However, for different study areas, the differences in formation conditions of coal samples lead to different internal structures and mechanical properties of coal samples, which in turn cause different acoustic emission responses. For this reason, in order to predict coal–rock deformation in the study area using the acoustic emission technique, it is necessary to first understand the relationship between coal sample deformation and acoustic emission response in the study area. In this paper, based on the testing and analysis of acoustic emission response characteristics of the uniaxial loading process of coal samples in the study area, the sensitive indexes of acoustic emission response of coal sample deformation were determined and correspondences between the changes of sensitive indexes and coal sample deformation were analyzed in order to provide guidance for the application of coal mine geological acoustic emission prediction technology to the study area. The study flow is shown in Figure 1.

2. Material and Methods
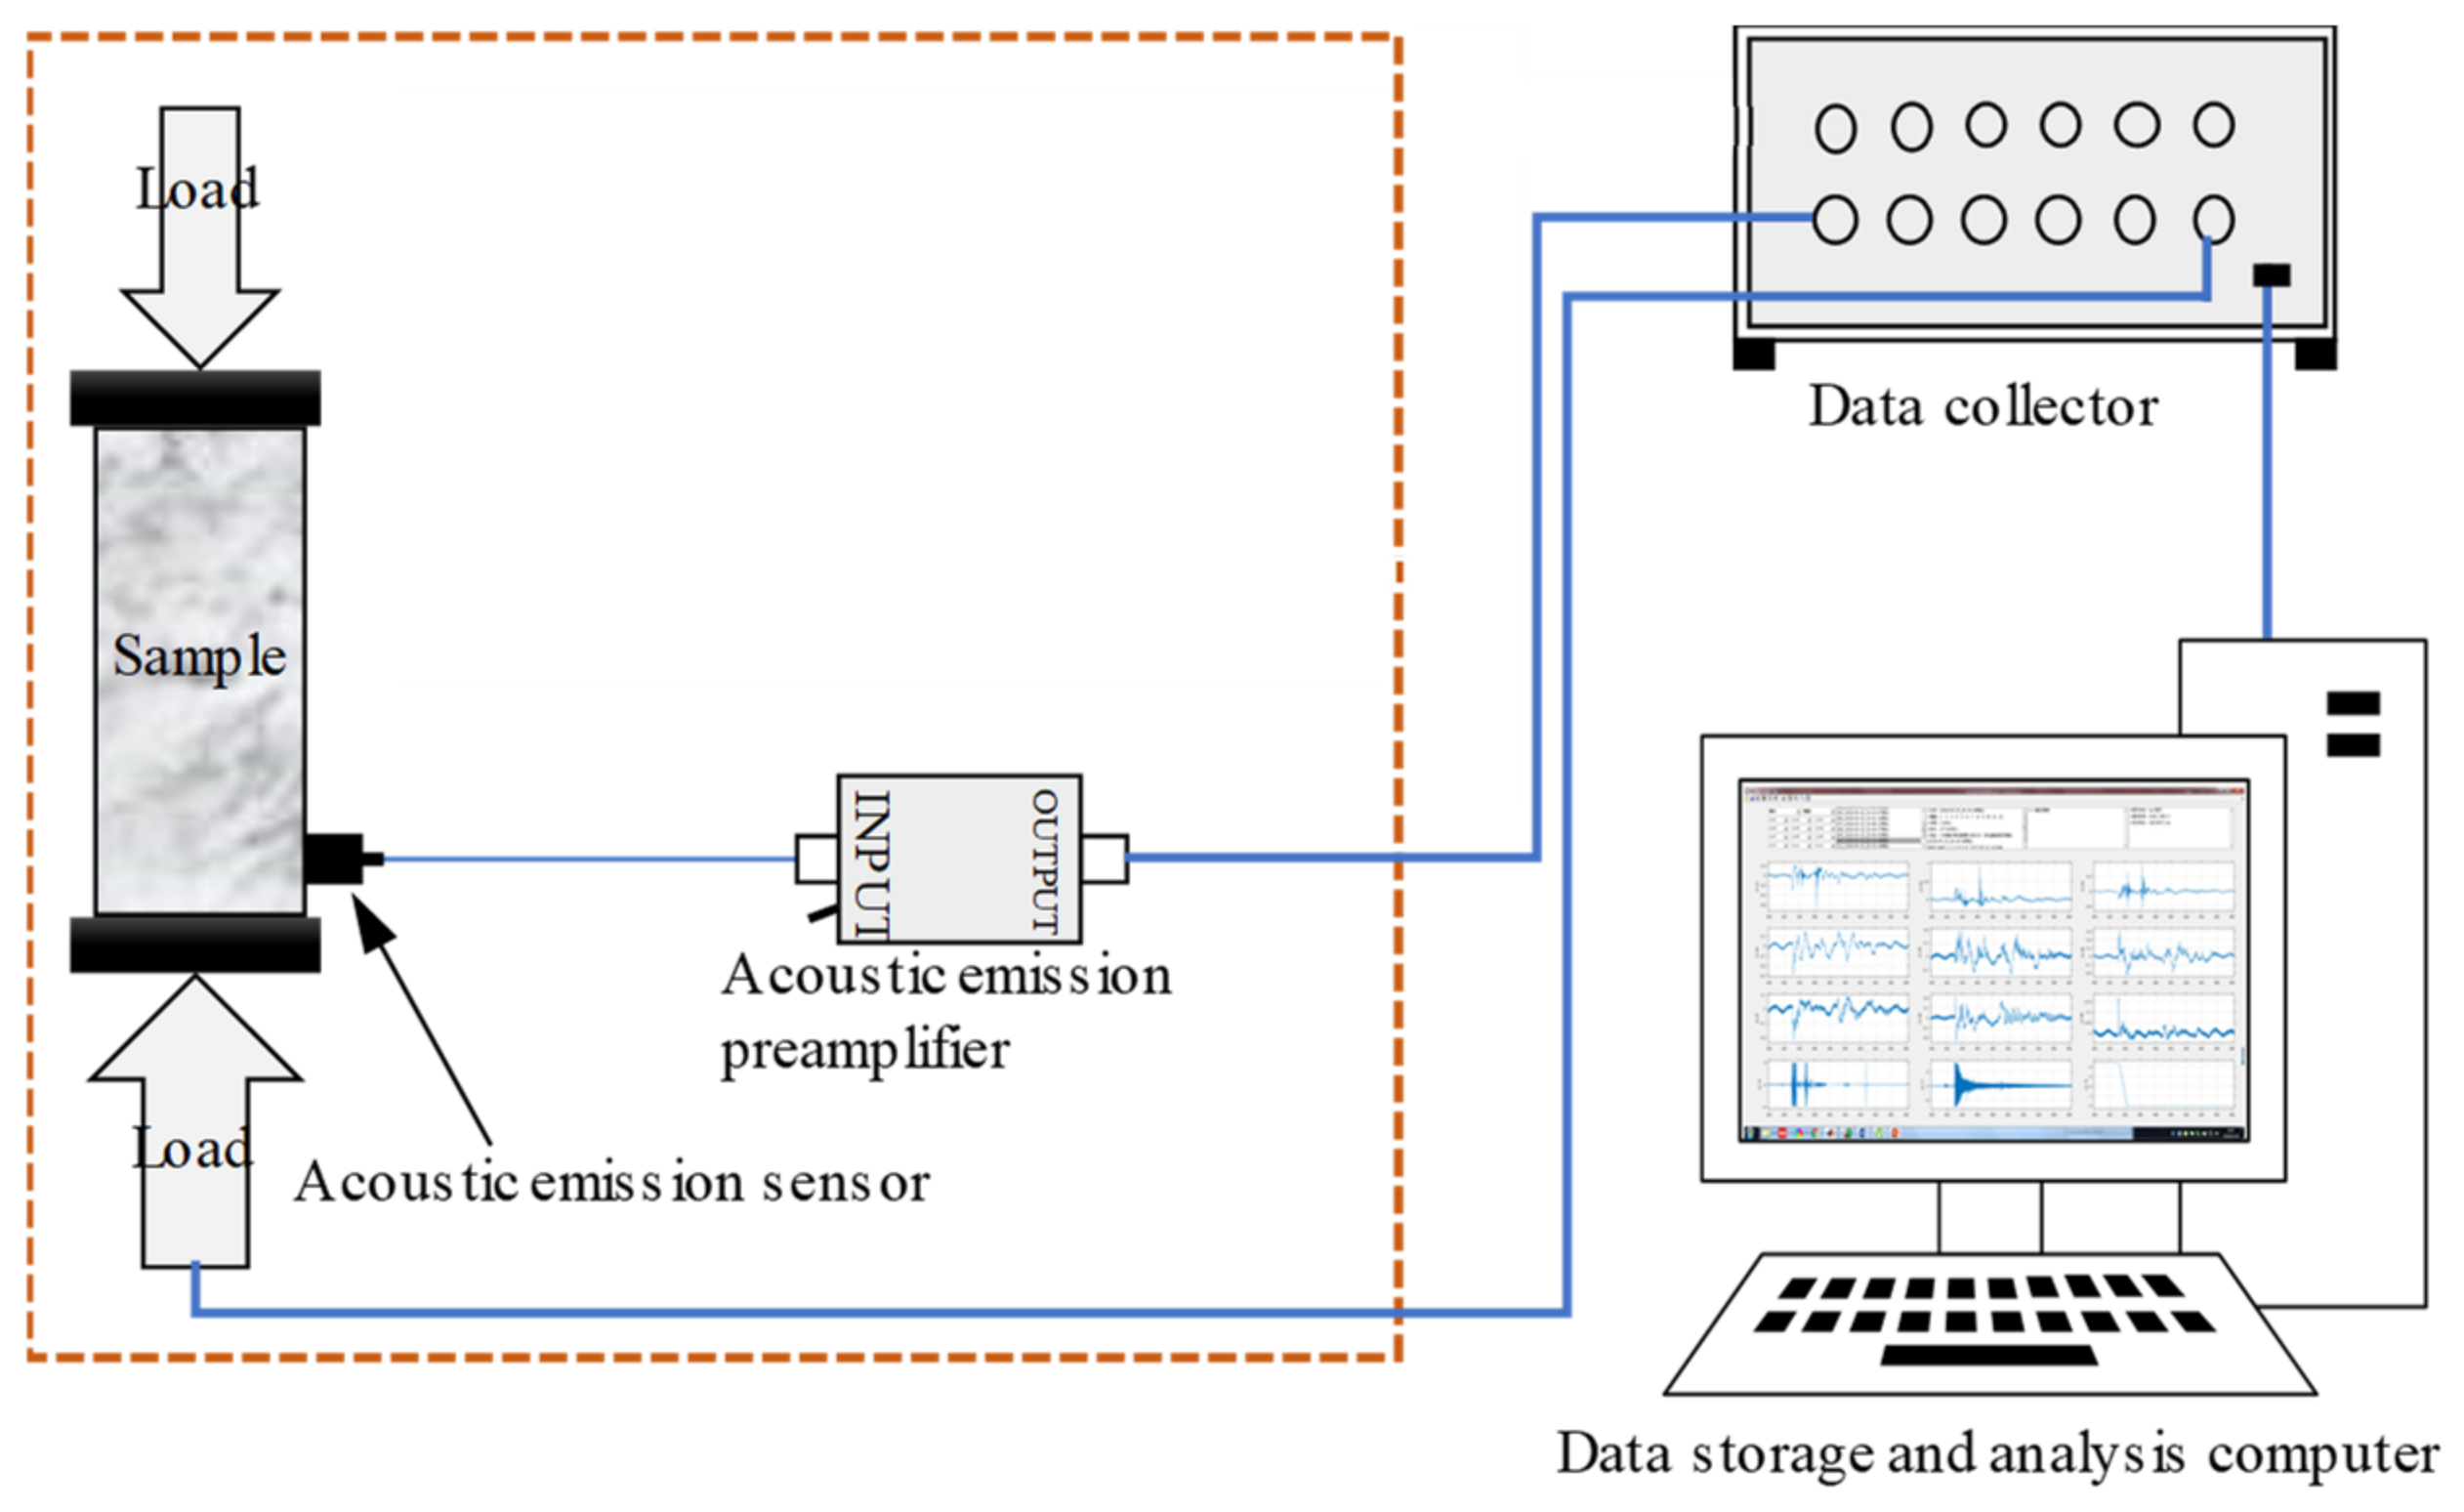
2.1. Testing Device

The experimental equipment adopts the self-developed coal–rock stress–strain loading device and the multi-channel fully digital PCI-2 acoustic emission acquisition system from Physical Acoustics, USA. The device mainly includes an axial pressure-loading system, stress–strain acquisition system, and acoustic emission acquisition/analysis system. Its experimental schematic diagram is shown in Figure 2.
The loading process is precisely controlled by the computer system, which can carry out automatic data collection and recording, reduce human interference and ensure the accuracy of the test. The stress-loading system realizes the recording of deformation parameters through the stress transducer and displacement transducer. The acoustic emission sensor amplifies the received acoustic emission signal through the preamplifier, then transmits it to the acoustic emission acquisition card, and analyzes it through the analysis software to present the test results in the form of graphs. The specific parameters of the equipment are shown in Table 1.

2.2. Coal Samples

According to the requirements of coal sample collection and production, the coal sample is collected and sealed at the stopping face of Shoushan No.1 mine. The structure outline of the study area is shown in Figure 3.
In the laboratory, the liquid nitrogen condensing drill and wire-cutting machine are used to process the coal samples into standard columnar samples with a diameter of 50 mm and a height of 100 mm along the vertical bedding direction, and the flatness of the upper and lower surfaces meets the production requirements of coal samples. A total of 7 coal samples were prepared, of which 1 was a standby sample. The prepared coal samples are sealed and stored for use. Specific parameters of coal samples are shown in Table 2.

2.3. Experimental Principle and Procedure

During uniaxial loading, the uneven force inside the coal sample results in local deformation coupled with air to produce acoustic emission signals with different characteristics. The difference in acoustic emission signal characteristics characterizes the different internal deformation of coal samples. For this reason, the deformation pattern of coal samples can be inferred and predicted based on the acoustic emission signal test results.
For the experimental test, according to the acoustic emission signal propagation characteristics, the acoustic emission sensor and the coal sample were coupled in contact, the acoustic emission sensor was fixed in the middle of the coal sample, and petroleum jelly was used as a coupling agent between the coal sample and the sensor to improve the coupling effect.
When conducting the test, the test steps are as follows: (1) Fix the acoustic emission sensor and put the coal sample into the sample cylinder. (2) Set the stress loading parameters, use the load control mode, and set the loading speed to 200 N/s. The acoustic emission acquisition parameters are also set. (3) Start the stress-loading device and acoustic emission acquisition device at the same time and start the test. (4) Continue the loading until the coal sample is destroyed. And the loading process test parameters are saved.

3. Results and Discussion

Through the preliminary analysis of the test results, it was concluded that the six coal samples possess similar acoustic emission change patterns and the same change mechanisms. Therefore, to avoid repetition of the exposition, coal samples No. 1 and No. 2 were selected for detailed exposition.

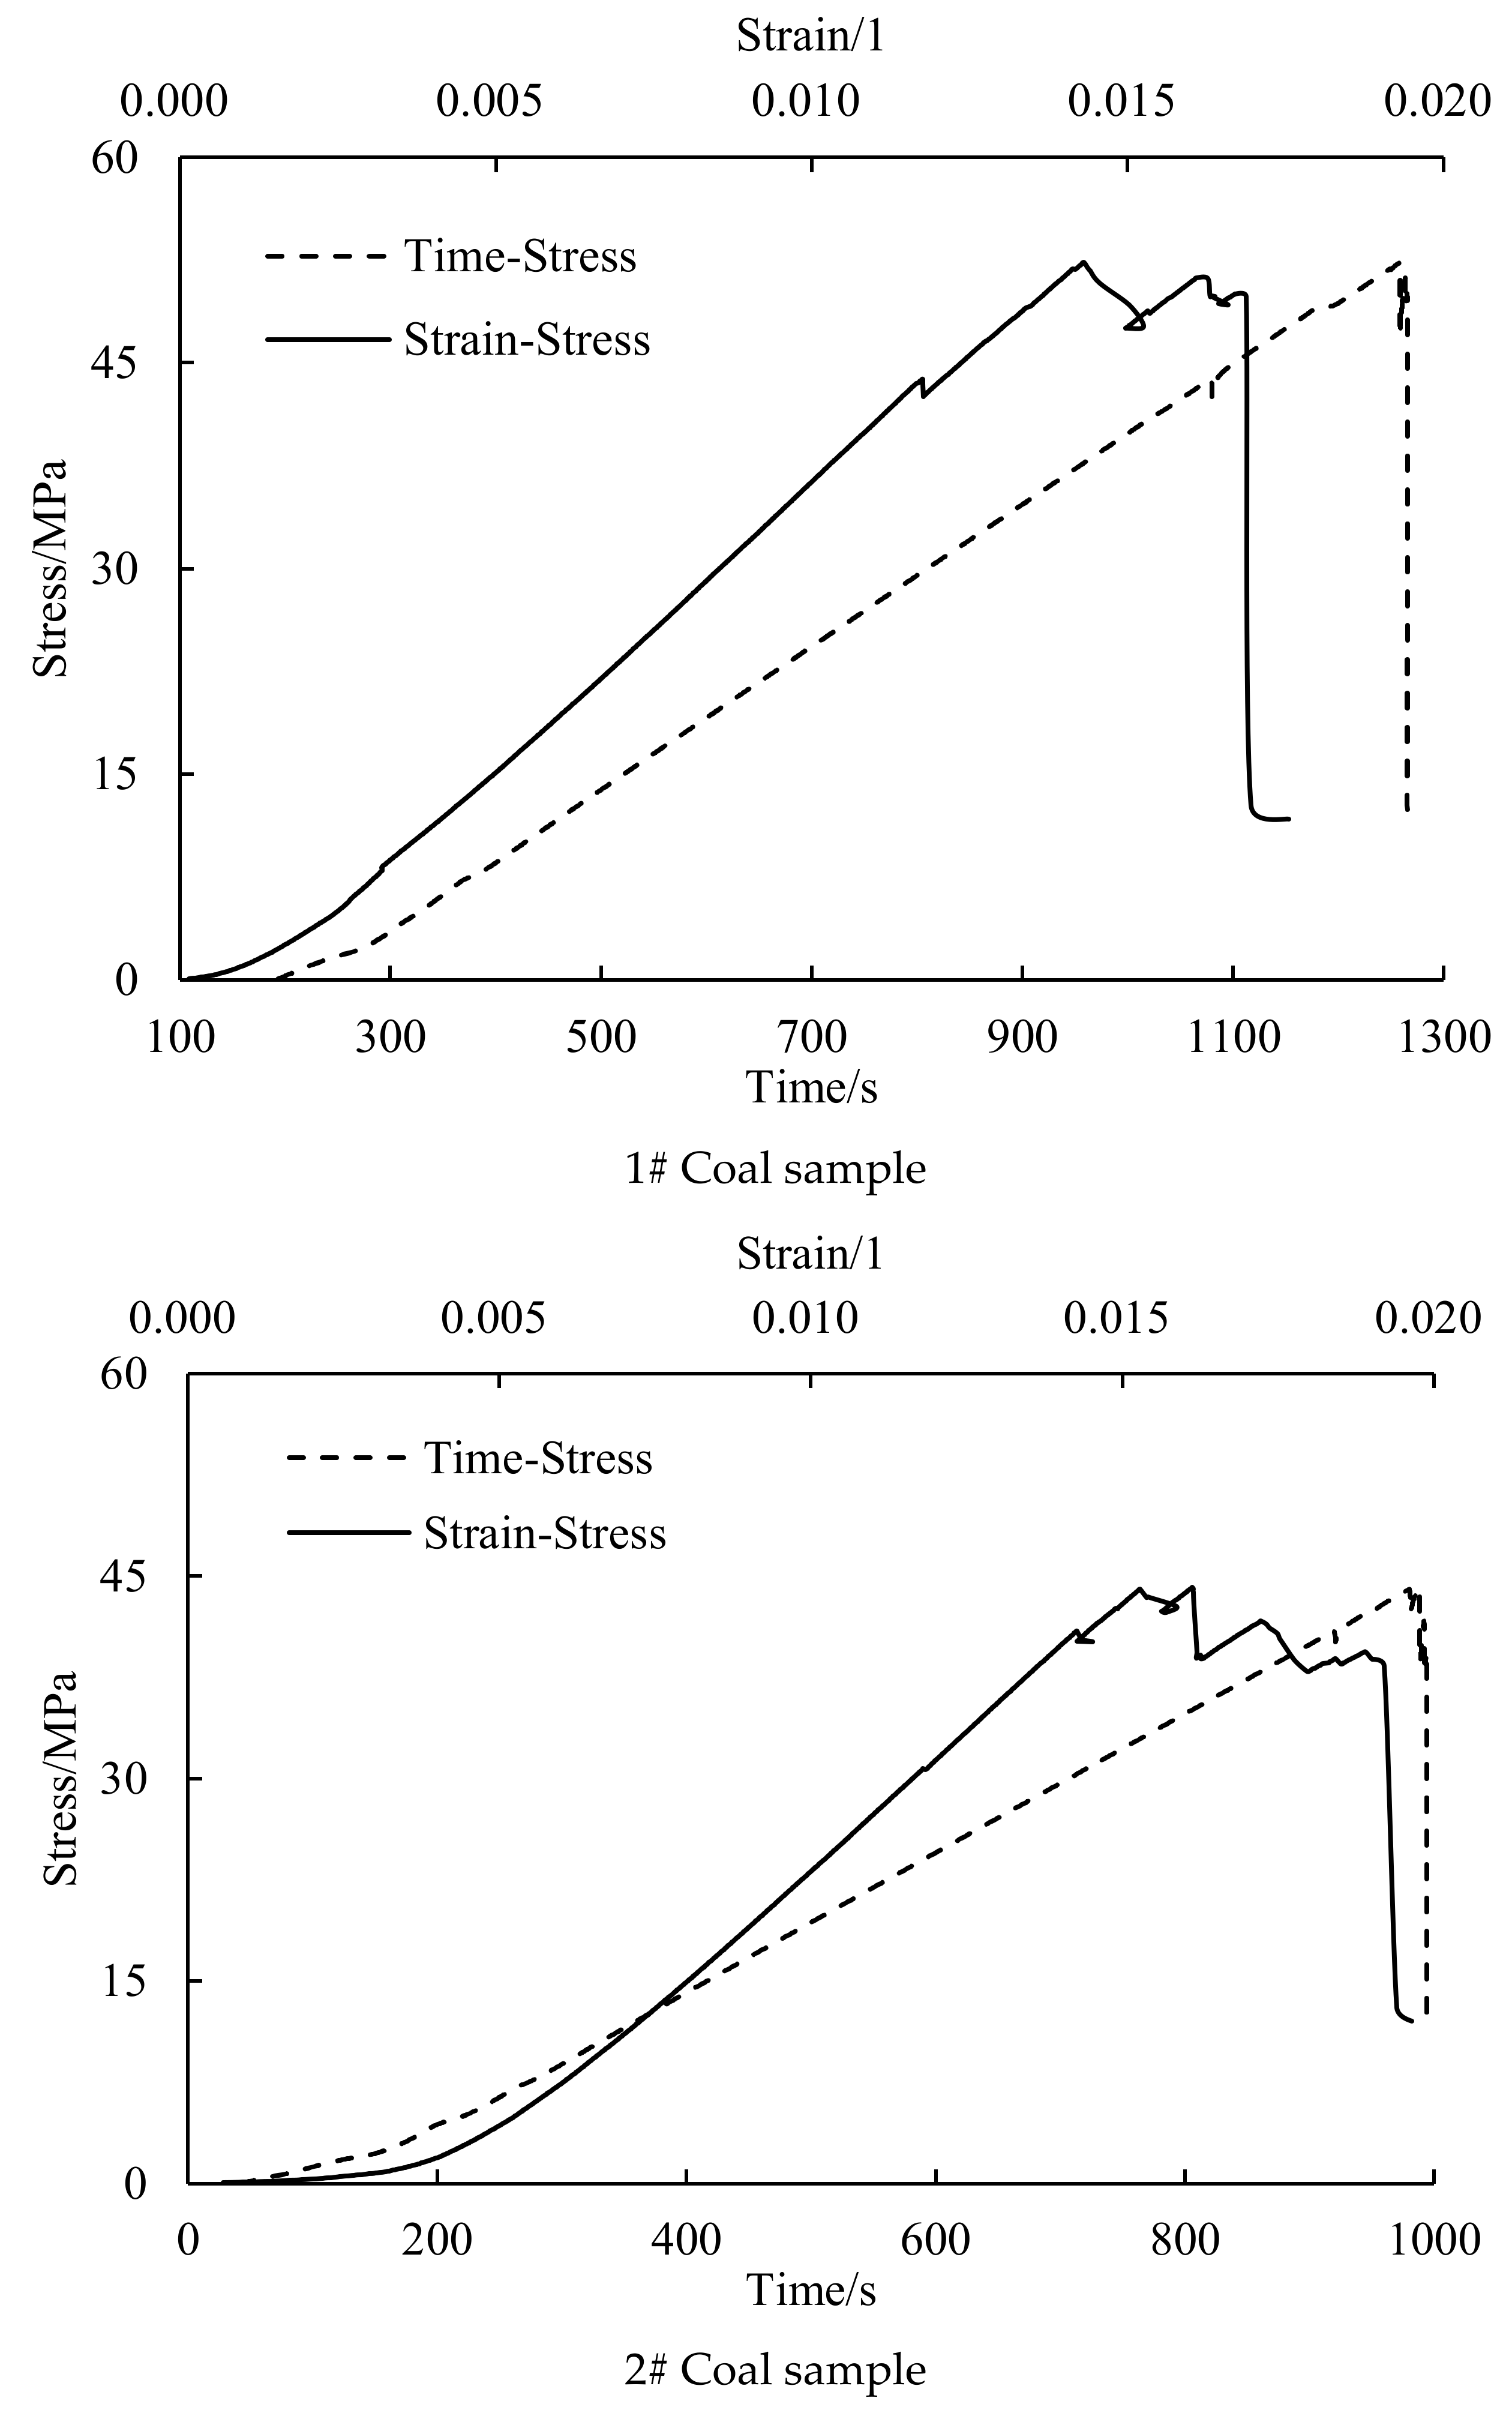
3.1. Stress–Strain Test Results

When the coal samples are in different deformation stages, the stress–strain curves show different characteristics. Many scholars usually classify the deformation stages of coal samples according to the different characteristics of stress–strain curves. To facilitate the comparison and analysis of the characteristics of acoustic emission parameters with time and the deformation stages of coal samples, the strain–stress–time variation diagram was drawn, as shown in Figure 4.
According to the stress–strain–time test results of the coal samples, the deformation mechanism of coal samples, and the experimental purpose, the whole deformation stage of coal samples can be divided into three stages: compression-density deformation stage, elastic deformation stage, and plastic/later deformation stage (including plastic deformation stage and post-peak damage stage).

3.2. Sensitive Indicators

The sensitive index is the acoustic emission index that can show different phase change characteristics when the coal sample is in different deformation stages. This index has obvious abnormal and easily identifiable change characteristics before the destruction of coal samples occurs, and the destruction of coal samples can be predicted according to the change characteristics of this index.
In order to preferably select a sensitive index suitable for this study area, the change patterns of acoustic emission amplitude, energy, and count parameters during the loading process of coal samples were analyzed and compared with the deformation characteristics of coal samples. The results of the preliminary analysis show that the changes in acoustic emission counting parameters during the loading process are obvious in the stages, and the characteristics of each stage are obvious, easy to identify, and have good consistency with the deformation stages of coal samples. Moreover, when the coal sample enters the plastic deformation stage, the acoustic emission count parameter has an obvious trend of rapid increase, and the damage to the coal sample can be predicted based on this feature. Therefore, the acoustic emission count is used as a sensitive indicator for the prediction of coal sample deformation in this study area.

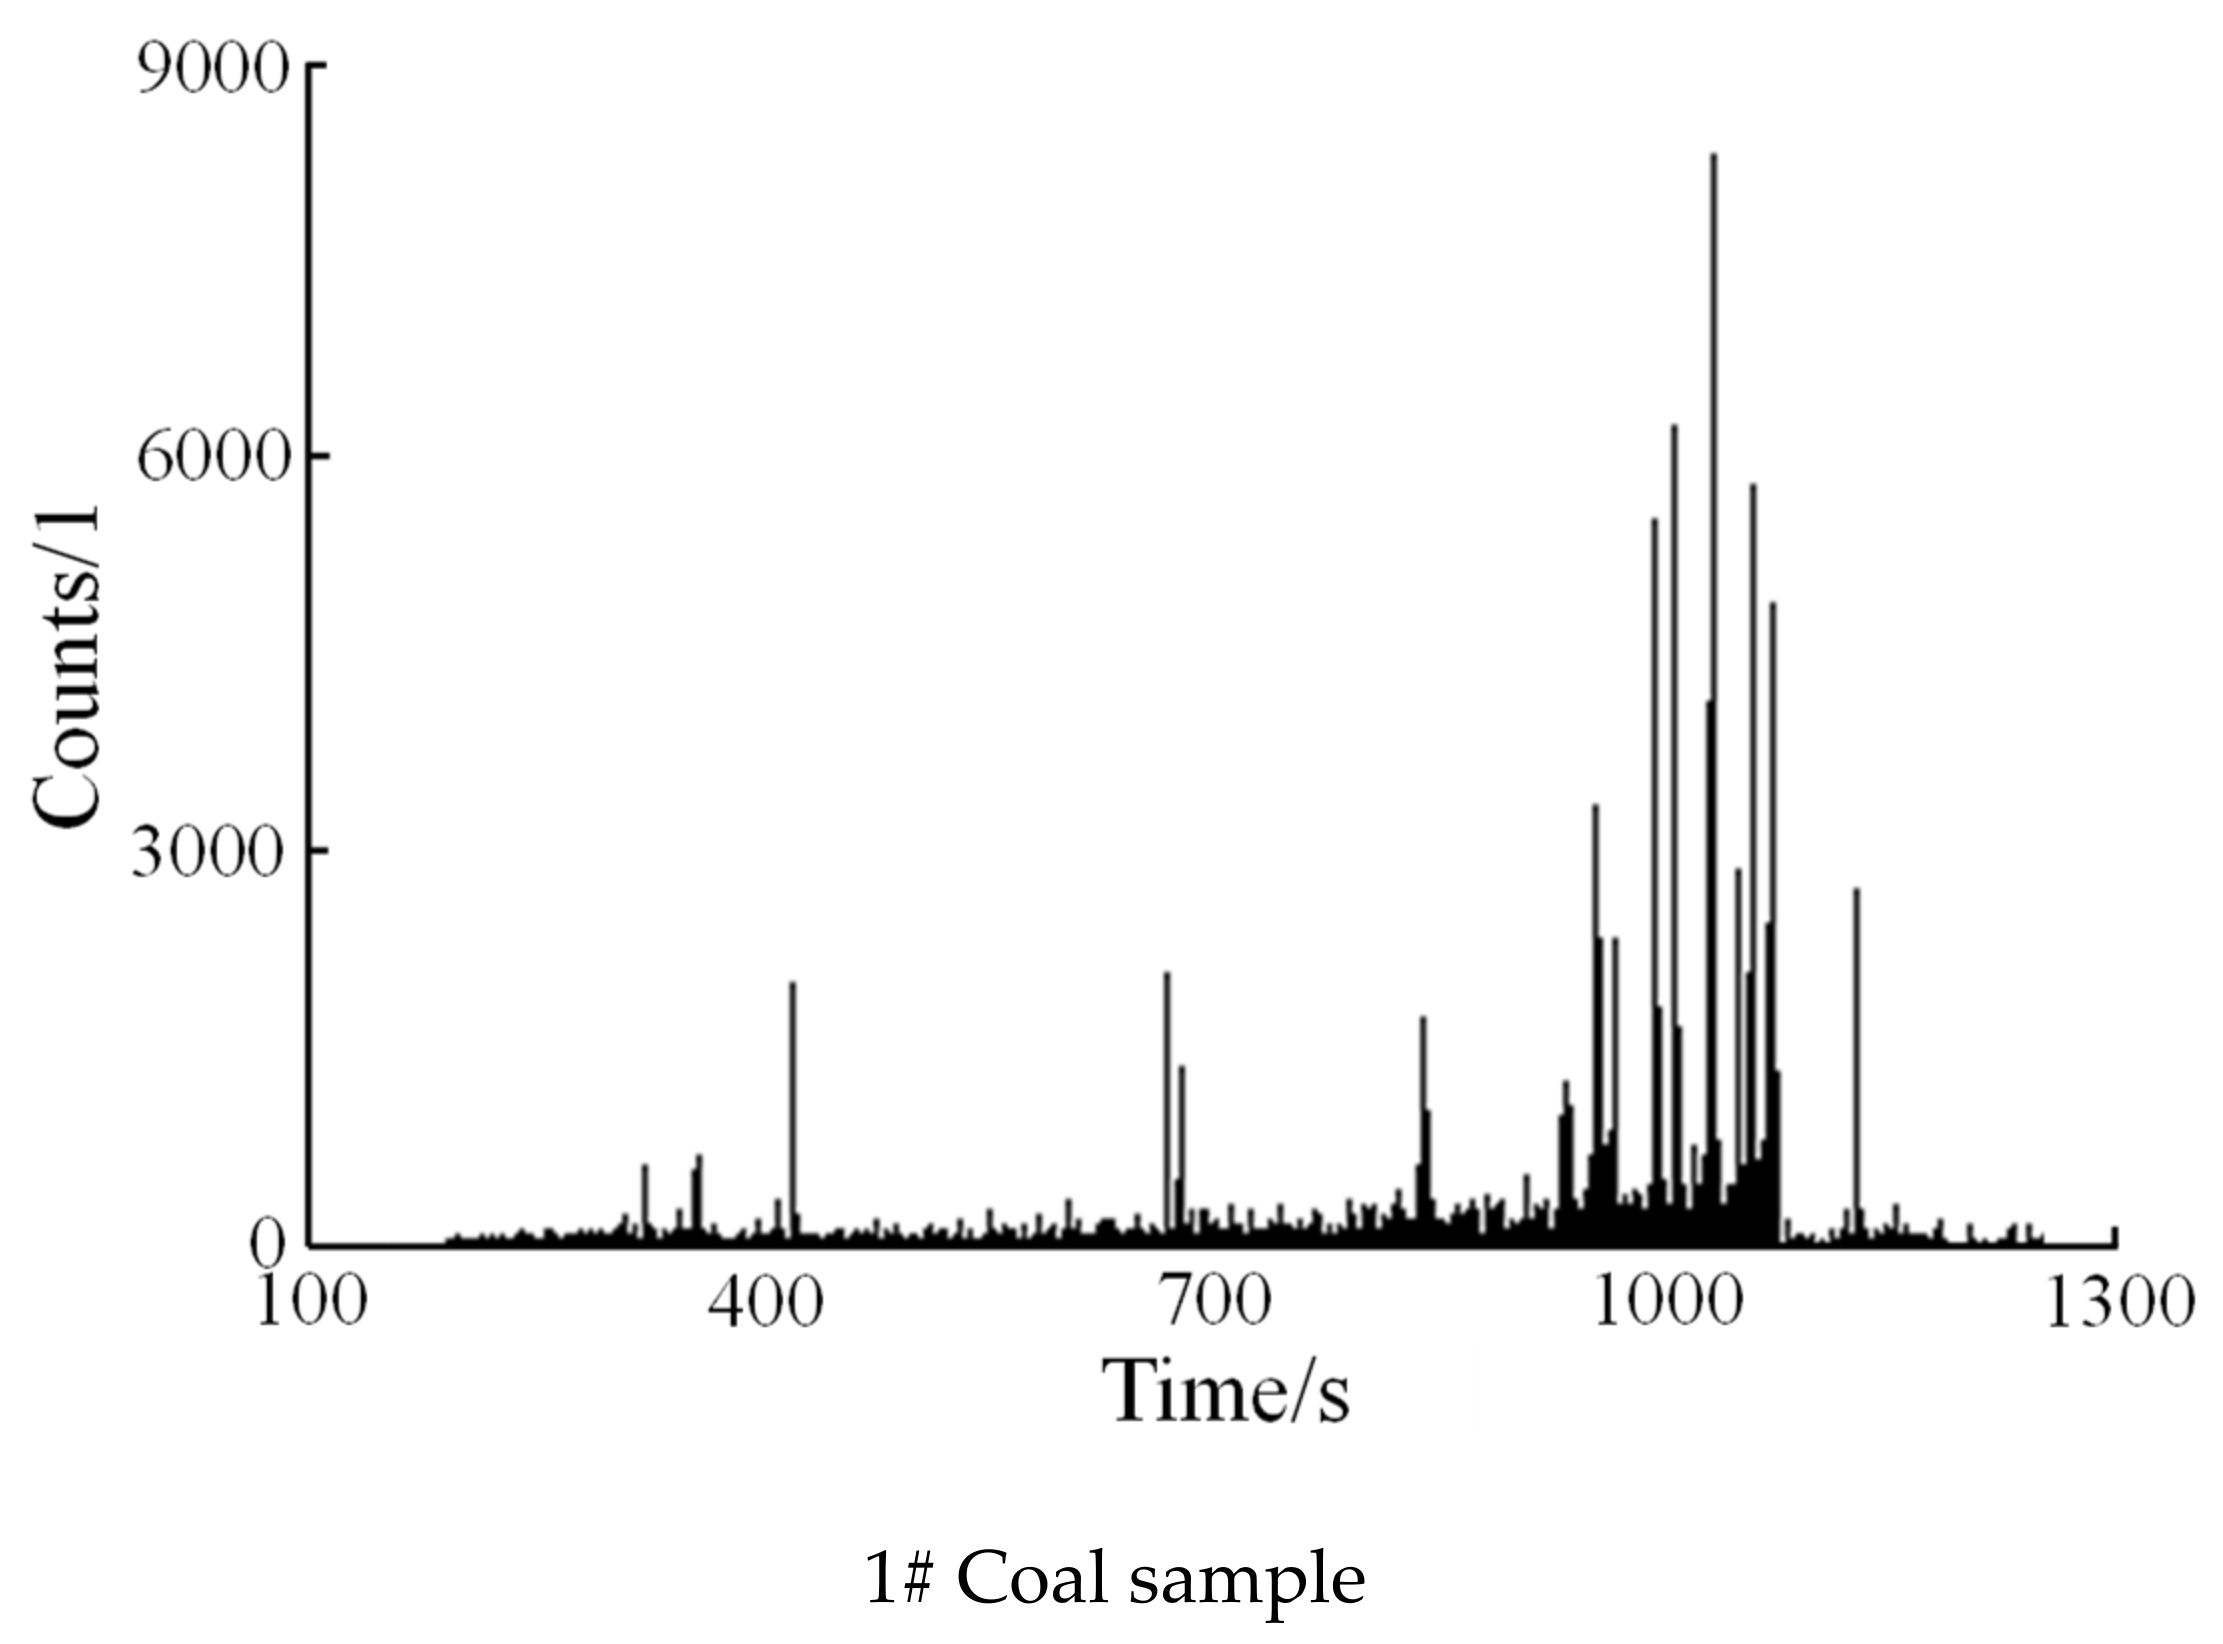
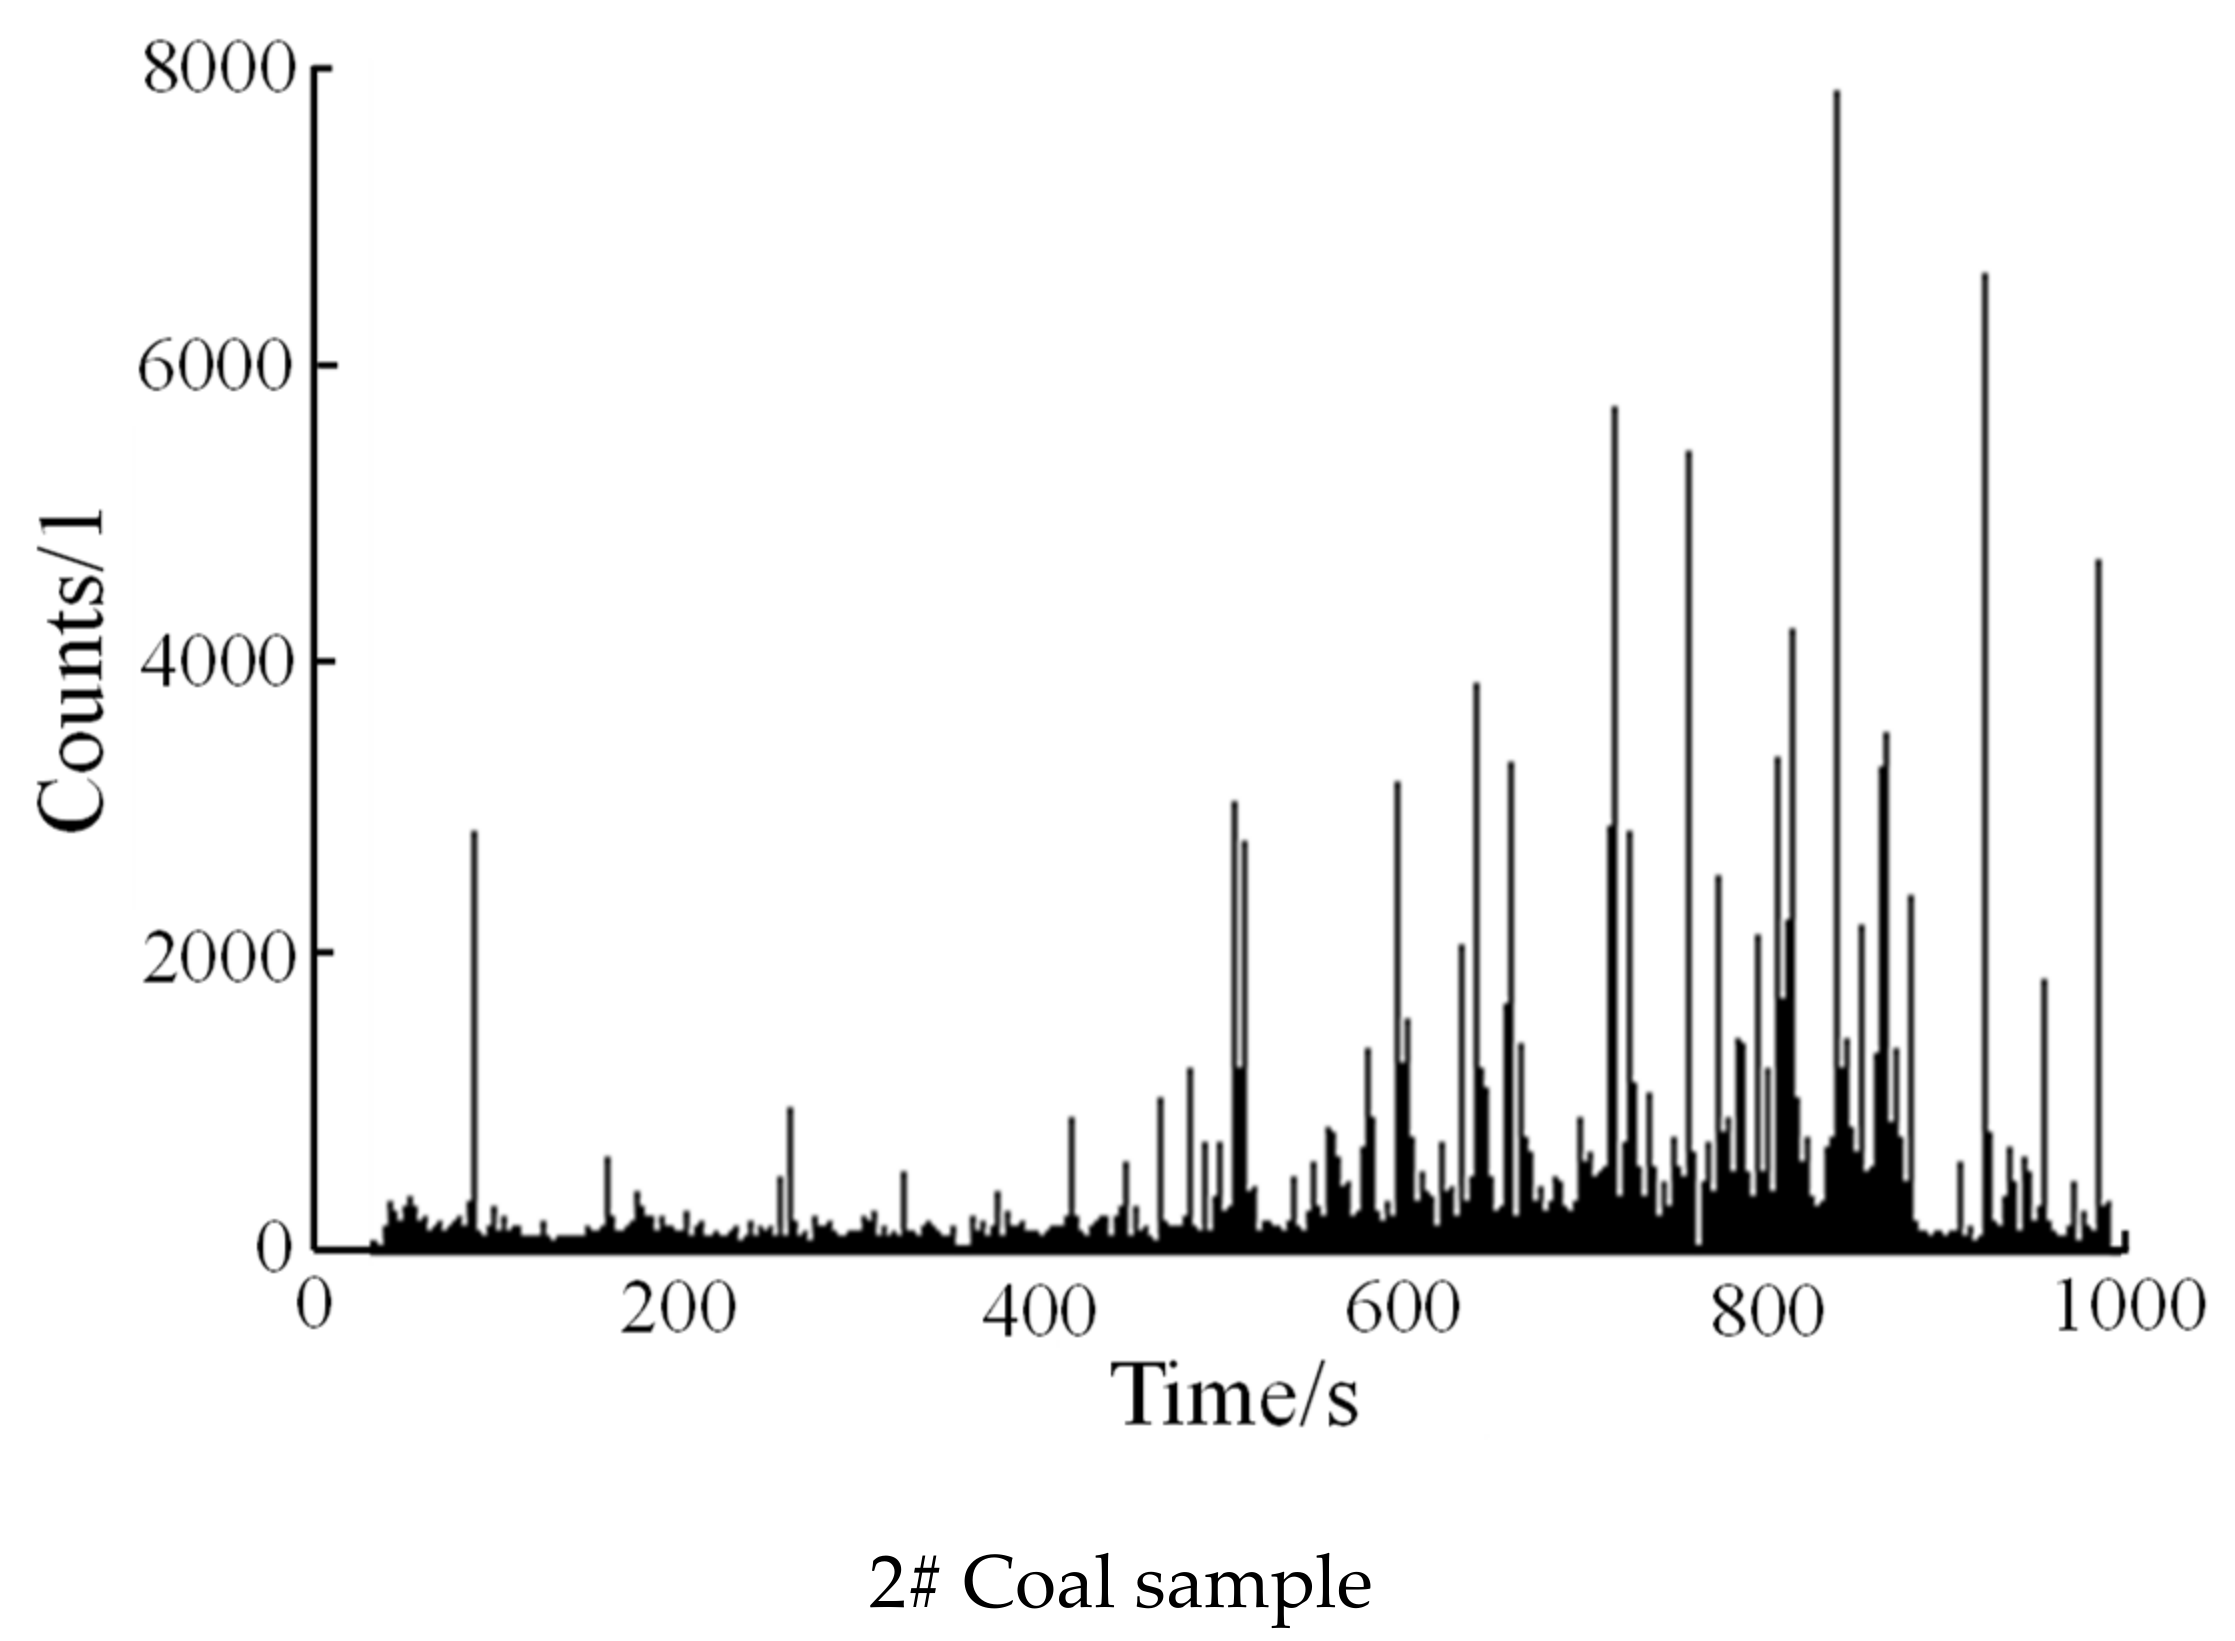
3.3. Analysis of Acoustic Emission Counting Results

The preliminary analysis results showed good agreement between the acoustic emission count variation and coal sample deformation. To further derive the relationship between acoustic emission count parameters and coal sample deformation and the characteristics of each phase, the curves of acoustic emission count variation with time during loading were plotted based on the test results, as shown in Figure 5.
From the figure, it can be seen that the acoustic emission count changes progressed in a phased manner with the loading, and there were local differences in the acoustic emission count changes for different coal samples. Combined with the stress–strain–time test results of the coal samples, the specific analysis of the acoustic emission change characteristics of each coal sample is as follows.
For the No. 1 coal sample, the acoustic emission counting parameter is 0 in the 0–193 s phase, which is the environmental noise testing phase, and almost no acoustic emission events with amplitude exceeding the threshold value are generated in the environment; in the 193–430 s phase, a certain amount of acoustic emission events are generated, mainly due to the fact that this phase is in the compression-density phase of coal sample deformation. The closure of cracks between coal particles is caused by the stress, resulting in the destruction of some angular non-flat contact surfaces and the generation of a certain number of infrasonic events. In stage 430–850 s, there are sporadic acoustic emission events generated, mainly due to the fact that this stage is in the elastic deformation stage of coal sample deformation, which is mainly caused by the elastic deformation of coal particles under the action of stress, and only in the local stress concentration region or the region with lower strength does damage occur and a small number of acoustic emission events are generated. In the stage after loading to 850 s, the acoustic emission counts show a trend of rapid increase and have high acoustic emission count values, mainly due to the deformation of coal samples into the plastic deformation stage at this stage, due to the loading effect of stress, so that the internal local stress of coal samples gradually reaches or even exceeds the bearing capacity of coal samples, causing the first level of the internal weak surface of coal samples to be damaged first, before tending to stabilize. When the stress continues to increase beyond the next level of the weak surface, the next level of the weak surface will be damaged, and so on, until the damaged area continues to increase, resulting in the destruction of the coal sample as a whole.
For the No. 2 coal sample, the acoustic emission count is 0 in the 0–40 s stage, which is the ambient noise testing stage; in the 40–300 s stage, a certain amount of acoustic emission events are generated, corresponding to the compression and density stage of coal sample deformation, mainly dominated by the closure of cracks between coal particles. A certain amount of infrasonic events are generated due to the unevenness of the fracture surface, which causes damage to the local weak surface or stress concentration area. In the 300–700 s stage, the acoustic emission events are less in the early part of this stage, and more acoustic emission events are generated locally later in the stage. This stage corresponds to the elastic deformation stage of coal sample deformation. In the early part of this stage, the coal sample is mainly dominated by the elastic deformation of coal particles, and only sporadic acoustic emission events occur locally on some weak surfaces, and in the later partof this stage, due to the strong inhomogeneity of this coal sample, the overall coal sample is still dominated by elastic deformation, and only more infrasound events were generated in some stress concentration areas. Therefore, the acoustic emission counts show the characteristics of overall low value and local high value of acoustic emission counts in the late stage. In the stage after loading to 700 s, the acoustic emission count as a whole showed a trend of rapid increase, and the acoustic emission count as a whole was larger, which was mainly due to the fact that the coal sample entered the stage of plastic deformation, and the coal particles began to be damaged. With the increasing damage area, the bearing capacity gradually decreased, and under the effect of gradually increasing stress, the scale and scope of damage increasingly occurred, such that the acoustic emission count showed a trend of rapid increase.
By analyzing the acoustic emission characteristics of the loading process of coal samples, it is concluded that the acoustic emission changes with the loading process of coal samples show stage characteristics, and overall can be divided into three stages: the initial stage with a certain amount of acoustic emission events, the middle stage with fewer acoustic emission events, and the final stage with a rapid increase of acoustic emission events. For different coal samples, the overall change pattern of acoustic emission counts in each stage is similar, and local differences exist. This difference is mainly caused by differences in the coal samples themselves, and the different characteristics can also be used to make a predictive study of the internal structural differences between coal samples.

3.4. Discussion

By analyzing the relationship between loaded acoustic emission amplitude, energy, count, and coal sample deformation, it is concluded that acoustic emission count and coal sample deformation have a good correspondence, and acoustic emission count is selected as a sensitive indicator for the prediction of coal-sample-deformation acoustic emission in this study area. However, the sensitivity indexes differ for different study areas, and when conducting other regional studies, the sensitivity indexes suitable for the corresponding study areas should be determined by combining the study’s actual measurement results.
Through in-depth analysis of the change characteristics of acoustic emission counts, it is concluded that the change of acoustic emission counts during the loading process presents stage characteristics, which can be divided into three stages: the initial stage with a certain amount of infrasonic events, the middle stage with fewer acoustic emission events, and the final stage with a rapid increase of acoustic emission events. This rule is consistent with previous research on soft rock [33]. The results of this stage division are well in agreement with the deformation stage division of coal samples, and the deformation stage of coal samples can be predicted according to the different response characteristics of acoustic emission counts. Meanwhile, the reason why the changes in acoustic emission counts show stage characteristics is mainly due to the stages of internal deformation of coal samples. The differences in deformation mechanisms at different deformation stages lead to different characteristics of acoustic emission response. Therefore, the acoustic emission counts are the external characterization of the deformation of coal samples.
In the same study area, the acoustic emission counts of different coal samples showed similar variation patterns on the whole, but there were differences in local areas, which were mainly due to the differences in internal structures. Therefore, future studies could examine differences in the internal structure of coal samples based on the differences in acoustic emission response based on a large number of tests and establish a refined model of the correspondence between acoustic emission response and the internal structure of coal samples to achieve an accurate prediction study of the internal structure of coal samples.

4. Conclusions

By analyzing the acoustic emission characteristics of the coal sample loading process, the following conclusions are drawn.
(1)
AE tests were carried out during the uniaxial loading of coal samples, and the relationship between the deformation of coal samples and the AE response was established. It is believed that the AE counting parameters have good consistency with the deformation of coal samples, and the phase characteristics are obvious, so this index can be selected as a sensitive index for AE prediction of coal deformation in the study area.
(2)
The characteristics of AE in the loading process of coal samples were analyzed, and it was concluded that the AE count changes in the loading process show phase characteristics. It can be divided into three stages: the initial stage with a certain amount of infrasound events, the middle stage with fewer AE events, and the final stage with a rapid increase in AE events. The results of this stage correspond to the deformation of coal samples, and the characteristics of each stage are obvious, which can be used to predict the deformation of coal samples.
(3)
The different AE response characteristics characterize the differences in the internal structural characteristics of coal samples, which further strengthens the study of the differences in AE characteristics of different coal samples during the loading process and provides a new direction for studying the internal structural characteristics of coal samples.

Author Contributions

Data curation, Z.C.; Writing—original draft, M.W., B.J., W.D. and S.L.; Writing—review & editing, J.Z. All authors have read and agreed to the published version of the manuscript.

Funding

This work was supported by Natural Science Youth Fund of Henan Province (project number: 212300410105) and Open Research Fund of State Key Laboratory of Coking Coal Exploitation and Comprehensive Utilization, China Pingmei Shenma Group.

Conflicts of Interest

The authors declare no conflict of interest.

References

  1. Singh, M.; Tangirala, S.K.; Chaudhuri, A. Potential of CO, based geothermal energy extraction from hotsedimentary and dry rock reservoirs, and enabling carbon geo-sequestration. Geomech. Geophys. Geo-Energy Geo-Resour. 2020, 6, 16. [Google Scholar] [CrossRef]
  2. Zhou, X.M.; Wang, S.; Li, X.L. Research on theory and technology of floor heave control in semicoal rock roadway: Taking longhu coal mine in Qitaihe mining area as an Example. Lithosphere 2022, 2022, 3810988. [Google Scholar] [CrossRef]
  3. Raziperchikolaee, S.; Alvarado, V.; Yin, S. Quantitative acoustic emissions source mechanisms analysis of soft and competent rocks through micromechanics seismicity coupled modeling. Int. J. Geomech. 2020, 21, 04020269. [Google Scholar] [CrossRef]
  4. Li, X.L.; Chen, S.J.; Wang, S. Study on in situ stress distribution law of the deep mine taking Linyi Mining area as an example. Adv. Mater. Sci. Eng. 2021, 9, 5594181. [Google Scholar] [CrossRef]
  5. Lou, Q.; Song, D.; He, X.; Li, Z.; Qiu, L.; Wei, M.; He, S. Correlations between acoustic and electromagnetic emissions and stress drop induced by burst-prone coal and rock fracture. Saf. Sci. 2019, 115, 310–319. [Google Scholar] [CrossRef]
  6. Wei, M.; Song, D.; He, X.; Li, Z.; Qiu, L.; Lou, Q. Effect of rock properties on electromagnetic radiation characteristics generated by rock fracture during uniaxial compression. Rock Mech. Rock Eng. 2020, 53, 5223–5238. [Google Scholar] [CrossRef]
  7. Song, D.; Liu, X.; He, X.; Nie, B.; Wang, W. Investigation on the surface electrical characteristics of coal and influencing factors. Fuel 2021, 287, 119551. [Google Scholar] [CrossRef]
  8. Das, S.; Mallik, J.; Bandyopadhyay, K.; Das, A. Evaluation of maximum horizontal near-surface stress (SHmax) azimuth and its distribution along Narmada-Son Lineament, India by geogenic Electromagnetic Radiation (EMR) technique. J. Geodyn. 2020, 133, 101672. [Google Scholar] [CrossRef]
  9. Khan, N.M.; Ma, L.; Cao, K.; Spearing, A.J.S.; Liu, W.; Jie, Y.; Yousaf, M. Early Violent Failure Precursor Prediction Based on Infrared Radiation Characteristics for Coal Specimens Under Different Loading Rates. Rock Mech. Rock Eng. 2022, 55, 6939–6961. [Google Scholar] [CrossRef]
  10. Ma, L.; Zhang, Y.; Cao, K.; Wang, Z. An Experimental Study on Infrared Radiation Characteristics of Sandstone Samples Under Uniaxial Loading. Rock Mech. Rock Eng. 2019, 52, 3493–3500. [Google Scholar] [CrossRef]
  11. Cao, K.; Ma, L.; Zhang, D.; Lai, X.; Zhang, Z.; Khan, N.M. An experimental study of infrared radiation characteristics of sandstone indilatancy process. Int. J. Rock Mech. Min. Sci. 2020, 136, 104503. [Google Scholar] [CrossRef]
  12. Jiang, F.; Xun, L. Application of microseismic monitoring technology of strata fracturing in underground coal mine. Chin. J. Geotech. Eng. 2002, 24, 147–149. [Google Scholar]
  13. Liu, X.; Liu, Q.; Du, K.; Li, X.; Xie, Q. Acoustic emission features and P-wave first-motion polarity of tensile fractures in the rock. Chin. J. Eng. 2022, 44, 1315–1323. [Google Scholar]
  14. He, X.; Nie, B.; Wang, E.; Dou, L.M.; Liu, M.J.; Liu, Z.T. Electromagnetic emission forecasting technology of coal or rock dynamic disasters in mine. J. China Coal Soc. 2007, 32, 56–59. [Google Scholar]
  15. Nejati, H.R.; Nazerigivi, A.; Sayadi, A.R. Physical and mechanical phenomena associated with rock failure in Brazilian Disc Specimens. Int. J. Geol. Environ. Eng. 2018, 12, 35–42. [Google Scholar]
  16. AlShorman, O.; Alkahatni, F.; Masadeh, M.; Irfan, M.; Glowacz, A.; Althobiani, F.; Kozik, J.; Glowacz, W. Sounds and acoustic emission-based early fault diagnosis of induction motor: A review study. Adv. Mech. Eng. 2021, 13, 1–19. [Google Scholar] [CrossRef]
  17. Zhang, G.; Deng, Z.; Jiang, J.; Li, S.; Mo, Y.; Wang, J.; Ma, B. Acoustic emission characteristics of coal with strong impact proneness under different loading modes. J. Min. Saf. Eng. 2020, 37, 977–982. [Google Scholar]
  18. Zhao, Y.; Ran, H.; Feng, G.; Guo, Y.; Fan, Y. Damage evolution and failure characteristics of cemented gangue backfill body with different height-width ratios under uniaxial compression. J. Min. Saf. Eng. 2022, 39, 674–682. [Google Scholar]
  19. Zhou, Z.W.; Liu, J.F.; Zou, H.; Zhuo, Y.; Xu, Y.M.D. Acoustic Emission Characteristics and Damage Evolution of Rock Salt under Uniaxial Compression. J. Yangtze River Sci. Res. Inst. 2016, 33, 63–68. [Google Scholar]
  20. Li, W.; Huang, Y.L.; Gao, H.D.; Li, J.M.; Ruan, Z.Y.; Song, T.Q. Study on acoustic emission characteristics of gangue of different graduations during confined compression. J. Min. Saf. Eng. 2020, 37, 155–161, 168. [Google Scholar]
  21. Vorobieva, I.; Shebalin, P.; Narteau, C. Break of slope in earthquak esize distribution and creep rate along the San Andreas Fault system. Geophys. Res. Lett. 2016, 43, 6869–6879. [Google Scholar] [CrossRef]
  22. Qiu, Z.Y.; Pan, Y.S.; Luo, H. Study on influence of effective confining pressure on acoustic emission signal in coal fracture. J. Saf. Sci. Technol. 2015, 11, 47–53. [Google Scholar]
  23. Gong, F.Q.; Luo, S.; Li, X.B. Rules of linear energy storage and energy dissipation in red sandstone during tensioning. Chin. J. Rock Mech. Eng. 2018, 37, 352–360. [Google Scholar]
  24. Zhao, H.; Yin, G.; Li, H.; Wang, Z. Analysis on AE characteristic and its confining pressure effect of outburst coal containing gas. J. Chongqing Univ. 2013, 36, 101–107. [Google Scholar]
  25. Wang, B.; Ning, Y.; Feng, T.; Guo, Z. Experimental study on anchoring effect of brittle rock mass influenced by loading rates at low strain rate. J. China Coal Soc. 2019, 44, 2691–2699. [Google Scholar]
  26. Gao, Y.; Guo, P.; Li, X.; Li, Y.; Xu, D.; Zou, Z.; Qin, J.; Shi, G.; Li, S. Investigation of triaxial compression failure and acoustic emission characteristics of different reservoir rocks. J. Eng. Geol. 2022, 30, 1169–1178. [Google Scholar]
  27. Liu, H.Y.; Zhang, B.Y.; Li, X.L. Research on roof damage mechanism and control technology of gob-side entry retaining under close distance gob. Eng. Fail. Anal. 2022, 138, 106331. [Google Scholar] [CrossRef]
  28. Ma, Y.K.; Wang, E.Y.; Li, Z.H.; Liu, J.; Du, Z.S. Methane sorption and seepage in coal and characteristics of acoustic emission. J. China Coal Soc. 2012, 37, 641–646. [Google Scholar]
  29. Xia, B.; Li, Y.; Hu, H.; Luo, Y.; Peng, J. Effect of Crack Angle on Mechanical Behaviors and Damage Evolution Characteristics of Sandstone Under Uniaxial Compression. Rock Mech. Rock Eng. 2022, 55, 6567–6582. [Google Scholar] [CrossRef]
  30. Justo, J.; Castro, J.; Cicero, S. Notch effect and fracture load predictions of rock beams at different temperatures using the theory of critical distances. Int. J. Rock Mech. Min. Sci. 2020, 125, 104161. [Google Scholar] [CrossRef]
  31. Liu, S.M.; Li, X.L.; Wang, D.K.; Zhang, D. Investigations on the mechanism of the microstructural evolution of different coal ranks under liquid nitrogen cold soaking. Energy Sources Part A Recovery Util. Environ. Eff. 2020, 1–17. [Google Scholar] [CrossRef]
  32. Bayane, I.; Bruhwiler, E. Structural condition assessment of reinforced-concrete bridges based on acoustic emission and strain measurements. J. Civ. Struct. Health Monit. 2020, 10, 1037–1055. [Google Scholar] [CrossRef]
  33. Chen, N.; Li, P.; Han, H.; Zeng, Z.; Qiu, L. Acoustic emission characteristics of soft rock with schistose structure during deformation failure. Eng. J. Wuhan Univ. 2022, 55, 539–544. [Google Scholar]
Figure 1. Flow chart of study.
Sustainability 14 14875 g001
Figure 2. Schematic diagram of experimental apparatus.
Sustainability 14 14875 g002
Figure 3. Outline map of geological structure in study area.
Sustainability 14 14875 g003
Figure 4. The diagram of strain–stress–time.
Sustainability 14 14875 g004
Figure 5. The acoustic emission counts vary with the loading time.
Sustainability 14 14875 g005aSustainability 14 14875 g005b
Table 1. Main parameters of the test system.
No.ParametersTest Range (Value)Sensitivity
1Stress0 kN~500 kN2.5 N
2Strain0~150 mm0.002 mm
3Monitoring frequency1 kHz~3 MHz
4Amplitude17 dB~100 dB
5Sampling frequency40 MHz
6AE input impedance50 Ω
7Impact defined time0~104 ms1.6 μs
8Impact lockout time0~65 ms1 μs
Table 2. Parameters of coal samples.
No.Diameter/mmHeight/mmPeak Intensity/Mpa
1#49.3499.6652.35
2#49.4499.2544.16
3#49.4299.3242.31
4#49.0498.1248.25
5#49.3498.6254.12
6#49.4099.2639.34
7#49.3097.5940.64
Publisher’s Note: MDPI stays neutral with regard to jurisdictional claims in published maps and institutional affiliations.

