Abstract
The growing population in urban areas generates large volumes of hospital waste which intensifies the problem of hospital waste management in developing countries. This study is designed to evaluate environmental impacts associated with hospital waste management scenarios using life cycle assessment (LCA) approach. Two scenarios were designed to describe the current practices: (scenario A) and an integrated approach (scenario B), which includes segregation and recycling of hospital waste. Data were collected from five public hospitals located in the district of Sheikhupura, Pakistan. The collected hospital waste was quantified and categorized on a daily basis for five consecutive months (October 2020 to February 2021). The functional unit was defined as one tonne of hospital waste. System boundaries for two scenarios include segregation, transportation, treatment and disposal of hospital waste. After defining functional unit and system boundaries, LCA was conducted using the IGES-GHG simulator. The scenarios were evaluated using common parameter, i.e., greenhouse gas (GHG) emissions. Scenario A and scenario B resulted in net GHG emissions of 1078.40 kg CO2-eq. per tonne of waste and 989.31 kg CO2-eq. per tonne of waste, respectively. Applying an integrated approach, it would be possible to mitigate GHG emissions of 37,756.44 kg CO2-eq. per tonne of waste annually and to recover some materials such as glass, paper, plastic and metals. Therefore, implementing an integrated approach for the management of hospital waste will progress the entire system towards sustainability. The findings of this study can be used for future research and policymaking.
1. Introduction
Waste generated at health care facilities during diagnosis, treatment and immunization is a special type of waste, known as hospital waste [1]. Hospital waste can be classified into two categories: hazardous waste and non-hazardous or general waste. According to the World Health Organization (WHO), 10–15% of hospital waste was considered as hazardous and classified into infectious waste, pathological waste, sharps waste, chemical waste, pharmaceutical waste, cytotoxic waste, and radioactive waste [2]. The management of hospital waste includes segregation, collection, storage, transportation, treatment, and final disposal, and needs special attention in developing countries due to lack of knowledge and limited resources [3]. Segregation is the key to achieve the goal of proper management of hospital waste and it is a process of sorting hospital waste at the point of generation. Due to poor segregation, general waste mixes with hazardous waste and thus increases the quantity of hazardous waste. Therefore, lack of awareness regarding the benefits of segregation is a major hurdle in the effective management of hospital waste [4,5,6,7].
In recent years, rapid urbanization has increased the amounts of hospital waste generation, influenced by several socioeconomic and environmental factors such as the human development index, life expectancy, mortality rates and CO2 emissions [8]. The waste treatment technologies such as microwave irradiation, autoclaving, incineration and chemical disinfection are determined based on several factors, including health hazards, environmental impacts, social acceptance and economic costs. Due to factors like cost, access and feasibility of these technologies, most of developing countries use simple, inefficient and high-emission technologies for the treatment of hospital waste [9]. Incineration is the mature and most common method for the treatment of hospital waste; however, it is not energy efficient and environmentally friendly due to inefficiencies in the incinerator operation [10]. Landfill is the cheap and easiest option for the disposal of waste. Landfill technologies have evolved in recent years, but these developments are limited to developed countries. In developing countries, the management of disposal sites is neglected, and open dumping is used for disposal of waste. Landfill sites release landfill gases including methane (CH4), which contributes to global warming and produces leachate which contaminates underground water. Improper management of landfills causes risks related to human health and environment [11].
Recycling is an alternative to incineration, and it provides economic and environmental benefits. The strategies dealing with the recycling process include segregation and decontamination of recyclables. The selection of decontamination method from chemical disinfection or steam sterilization depends on the type of waste and required level of decontamination. Chemical disinfection is a process used to eliminate biological agents and spores using disinfectants such as chlorine compounds, phenols, peroxides, aldehydes, quaternary ammonium compounds and alcohols. Solutions of sodium hypochlorite (NaOCl), known as bleach, are commonly used to disinfect contaminations and its oxidizing capacity is given as ppm (parts per million) of available chlorine. Several factors influence the effectiveness of chemical disinfectants such as concentration, organic matter, pH, contact time, range of microbiological activity, temperature and shelf-life [12]. Steam sterilization of reusable equipment and hospital waste is performed in autoclave, a metal vessel designed to withstand high pressures and involves processes such as pre-heating, waste feeding, air evacuation, steam treatment, steam discharge and waste unloading. Hospital waste is processed at 121 °C for 30 min at 1 atm pressure and steam at this temperature deactivates the microbial proteins present in the waste. The performance of this technique depends on factors such as time, temperature, removal of air and amount of waste [13].
Life cycle assessment (LCA) is a tool to assess the environmental impacts associated with waste management scenarios. It addresses multiple emission-related aspects such as energy and material flows, impacts associated with inputs and outputs, and helps to interpret the results and make informed decisions. LCA has four primary stages according to international standards on LCA: goal and scope definition, inventory analysis, impact assessment and interpretation [14]. Waste management LCA is different from product LCA, where the functional unit is designed in relation to the input of system, i.e., waste. In product LCA, on the other hand, the functional unit is designed in terms of the system’s output, i.e., the product [15]. The Institute for Global Environmental Strategies (IGES) Japan has developed a simulation tool, consisting of ten spreadsheets, according to the Intergovernmental Panel on Climate Change (IPCC) 2006 guidelines. The simulator estimates GHG emissions from waste management technologies in life cycle perspective using input data such as time (months), weight (tonnes) and appropriate local conditions. The difference between direct GHG emissions and GHG savings indicates net GHG emissions, which reflect the overall environmental impact [16]. Under the 2006 IPCC guidelines, GHG emission and mitigation estimates are divided into sectors and each sector contains categories and subcategories. The “waste” sector provides detailed descriptions of GHG emissions from categories such as solid waste treatment, biological treatment of solid waste, incineration and open burning of waste and wastewater treatment. The Solid waste treatment category is further subdivided into subcategories: managed, unmanaged and unclassified landfills [17].
Unfortunately, few studies were conducted to assess the environmental impacts related to hospital waste management scenarios. The aim of this study is to quantify and compare different waste management technologies in a life cycle perspective and propose an alternative integrated approach. For this purpose, the amounts of recyclable components of hospital waste such as paper, plastic, glass, metal and non-recyclable hospital waste generated was estimated to derive an inventory. The results enable the hospital administration and policymakers to understand the environmental benefits of integrated hospital waste management strategy.
2. Materials and Methods
2.1. Goal and Scope
The research was conducted in five public hospitals located in district of Sheikhupura, Pakistan. These public hospitals have departments of dentistry, cardiology, dermatology, otolaryngology, pediatrics, gynecology and urology. DHQ hospital is at district level and THQ hospitals are at tehsil level. THQ hospital Muridkey is the biggest among THQ hospitals. Table 1 shows the details of these hospitals.

Table 1.
Details of public hospitals in district Sheikhupura, Pakistan.
Two hospital waste management scenarios were designed to conduct LCA. Scenario A refers to current hospital waste management practices and scenario B proposed an alternative integrated approach for the management of hospital waste. In an integrated approach hospital waste is segregated at source and recycling is used as an alternative to incineration; decontamination methods, disinfection or sterilization, are applied according to the composition of recyclable waste. A functional unit was defined as one tonne of hospital waste. System boundaries for two scenarios include segregation, transportation, treatment and disposal of hospital waste. Scenarios were evaluated using common parameters, i.e., GHG emissions. Figure 1 shows the system boundaries.
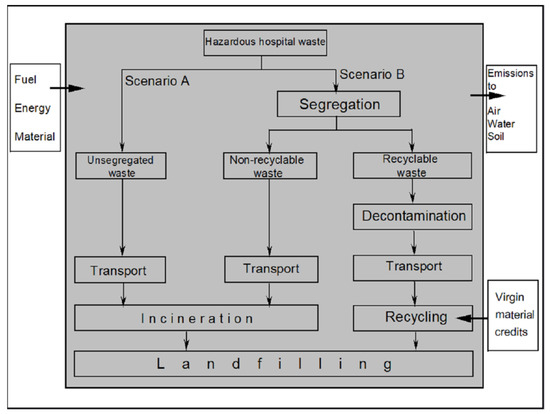
Figure 1.
System boundaries.
System boundaries in scenario A begin with the transportation of hospital waste from the hospital storage facility to the off-site incineration plant and finally to the municipal landfill. System boundaries in scenario B start with segregation of hospital waste into non-recyclable waste and recyclable waste. Components of recyclable waste such as paper, plastic, glass and metal were collected in different waste containers. Finally, the untreated waste from the incinerator and recycling facility was transported to a landfill site. Functional units and system boundaries are the same for both scenarios, so comparison shows the potential for GHG mitigation.
2.2. Life Cycle Inventory
The amount of hospital waste was quantified over a period of five consecutive months from October 2020 to February 2021. Different waste containers were placed in each department of the hospitals in order to separate recyclables from non-recyclable waste. General hospital waste was not included in this study. The segregated hospital waste from partially filled waste containers was weighed twice a day using digital scales. Table 2 shows the quantity of hospital waste.
Table 2.
Quantity of hazardous hospital waste.
Hospitals generated 1.6 tonnes of recyclable waste per month, with recycling giving an opportunity to manage recyclable waste in a sustainable way with economic and environmental benefits. Proper segregation of recyclables maximizes the benefits of the recycling process. Major limitations in the recycling process are sorting and decontamination of recyclables. Table 3 shows the proportion of recyclable components.
Table 3.
Components of recyclable hospital waste.
Plastic has the highest share in the recyclable waste, and it was estimated to be 1.21 tonnes per month or 75.9 % of the total recyclable waste. Plastics are used in medical applications due to their thermal properties, durability, ease of processing and sterilization potential [18]. Table 4 shows the share, type of polymers and application of plastics in hospitals [19].
Table 4.
Share, type of polymers and application of plastics in hospitals.
Three R’s: reduce, reuse and recycle are necessary for the management of hospital waste in a sustainable way [20]. There is an urgency to develop medical products, especially plastic products, with greater recyclability [21]. The recyclability of polyethylene terephthalate (PET) and high-density polyethylene (HDPE) is greater than polypropylene (PP) and polystyrene (PS) [22]. The PVC recyclability was about 79%, and the material recovery rate of high-quality plastic was 12–35% higher than low-quality plastic [23]. The recycling process helps to reduce the requirement of virgin production of materials. A study conducted in Maasstad hospital in Rotterdam (Netherlands) demonstrated the recycling potential of polypropylene wrapping used in operating theatres to pack surgical instruments. Medical items were made using recycled plastic; items made from 100% recycled plastic were more brittle and harder than ones made from 100% virgin material. Results show that recycled polypropylene wrapping can be used as raw material for production of new medical devices [24]. A study conducted in hospitals in Massachusetts (USA) shows that IV bags and syringes have great potential for recycling [25]. Another study conducted at the Royal Sussex County Hospital in Brighton (UK) found that recycling hospital waste could save 30% of a hospital’s annual budget. It has also been confirmed that each tonne of recycled glass saves 1.2 tonnes of raw materials compared to the production of virgin glass [26]. Recycling of sharps gives a sustainable model that leads to circular economy of hospital waste with economic and environmental benefits [21].
The secondary or mechanical recycling is the environmentally preferred option, and it involves the sorting and reprocessing of recovered plastic. The product of this type of recycling process is single-polymer granules or pellets, which can replace virgin plastic. The polymers accepted by mechanical recycling facility are PP and PE or PET and HDPE. Advancement in recycling plants to process more polymers can enhance the recyclability of products. Tertiary or feedstock chemical recycling depolymerizes the plastic using pyrolysis and/or hydrolysis processes. The recovered chemical elements can be used as raw material for production of new plastic products. Oil and gas are also produced during the recycling process and can be used as fuel. The limitation of feedstock recycling is that few polymers can be recycled, and it has environmental impacts [27]. Several studies have been conducted to investigate the environmental burden related to the recycling of plastic waste [28,29,30,31,32,33,34,35,36,37,38,39,40,41,42].
2.2.1. Transportation
Special waste vehicles were used for the transportation of hospital waste from hospital storage facilities to the off-site incineration plant, and the combustion of diesel fuel is the source of GHG emissions from waste transportation. Table 5 shows the distance from the incineration plant to each hospital.
Table 5.
Distance from incineration plant to each hospital.
In scenario A, hospital waste vehicles covered 207.6 km distance daily to transport hospital waste from five hospitals to off-site an incineration plant and 692 L of diesel is consumed per month. In scenario B, 300 L of extra diesel is consumed per month for the transportation of recyclables to the recycling facility, which is 90 km from the storage facility. The energy content and emission factor of diesel fuel are 36.42 MJ/L and 0.074 kg CO2/MJ, respectively. Inputs such as the total amount of hospital waste transported per month and diesel fuel usage in liters per month was required to estimate GHG emissions from waste transportation using Equation (1). Table 6 gives the details of material and energy inputs and results in life cycle perspective.
Table 6.
Life cycle inventory for waste transportation.
Table 6.
Life cycle inventory for waste transportation.
| Scenario | Inputs | Output | |
|---|---|---|---|
| Amount of Waste (Tonnes/Month) | Fossil Fuel Consumption (L/Month) | Net GHG Emissions (Kg CO2-eq/Tonne) | |
| Scenario A | 5.2 | 692 | 358.65 |
| Scenario B | 5.2 | 992 | 514.14 |
For Scenario A:
For Scenario B:
The total GHG emissions from waste transportation per month can be estimated by multiplying GHG emissions and total amount of hospital waste transported per month. For scenario A and scenario B, GHG emissions per month were estimated to be 1865 kg CO2-eq per month and 2673.52 kg CO2-eq per month, respectively.
2.2.2. Incineration
The hospital waste was incinerated in a semi-continuous stoker type incinerator. There is only one functional incinerator in the study area to manage large volumes of hospital waste, which is stored in puncture-resistant bags and manually fed to the incinerator through a ram feeder. Figure 2 shows the basic layout of the incinerator.

Figure 2.
Incinerator.
The inputs such as type of the incinerator, total amount of waste incinerated per month, composition of waste and total amount of natural gas and electricity used for the operation activities were needed to estimate GHG emissions from waste incineration. Carbon dioxide (CO2), methane (CH4) and nitrous oxide (N2O) are released into the atmosphere, but CO2 is the major source of global warming and therefore considered for GHG emission calculations using the Equation (2).
The units of fuel consumption (), net calorific value () of fuel, emission factor of carbon dioxide (), electricity consumption () and emission factor of electricity generation () are mass or volume per tonne, MJ per unit mass or volume, kg CO2 per MJ, MWh per tonne and kg CO2-eq per MWh, respectively. Total GHG emissions are equal to the sum of operation emissions and combustion emissions. Net GHG emissions can be estimated by subtracting indirect GHG savings from total GHG emissions. The incinerator electricity and gas consumption rates were 15 kWh per tonne and 300 L per tonne. The electricity and gas consumptions can be calculated by multiplying the amount of waste incinerated and the consumption rate. Table 7 shows the life cycle inventory data for waste incineration.
Table 7.
Life cycle inventory for waste incineration.
The total GHG emissions from waste incineration per month can be estimated by multiplying GHG emissions and the total amount of hospital waste incinerated per month. For scenario A and scenario B, GHG emissions per month was estimated to be 4218.65 kg CO2-eq/month and 2924.04 kg CO2-eq/month, respectively.
2.2.3. Recycling
Recycling is the most sustainable option for the management of hospital waste, as it provides an opportunity to recover valuable materials, which considerably reduces the need for the production from virgin material. The recycling process has several stages such as transportation, sorting and pre-processing, all of which contribute to GHG emissions. The inputs are the amount of recyclable waste and composition of recyclables to quantify GHG emissions from the recycling process. Table 8 shows the GHG emissions from recyclables [43].
Table 8.
GHG emissions from recycling.
The total GHG emissions from recyclable waste can be calculated by adding the product of GHG emission from each recyclable and percentage of that recyclable. Finally, net GHG emissions from recycling process can be calculated by subtracting avoided GHG emissions from total GHG emissions. Table 9 shows the life cycle inventory data for recycling process.
Table 9.
Life cycle inventory for recycling process.
The total GHG emissions from the recycling process per month can be estimated by multiplying GHG emissions and total amount of recyclables per month and was estimated to be −187.97 kg CO2-eq/month. The negative value of net GHG emissions indicates the mitigation potential of the recycling process. It is important to mention here that the indirect GHG savings potential of the recycling process is remarkable. Therefore, it is necessary to incorporate recycling in the management of hospital waste.
2.2.4. Landfilling
The GHG emissions from landfilling in life cycle perspective can be calculated using First Order Decay (FOD) model, as under:
The mass of decomposable degradable organic carbon (DDOC) at the beginning of the reaction is when t (time in years) is zero and (“k” is reaction constant) is unity. The GHG emissions from waste landfilling required the data such as amount of waste landfilling per month, total amount of fossil fuel utilization for operation activities at the landfill and composition of landfilling waste.
2.3. Scenario Description
Two hospital waste management scenarios were designed in this study. Scenario A deals with current waste management practices and scenario B refers to an alternative integrated approach, in which incineration and recycling are applied to non-recyclable waste and recyclable waste, respectively. Scenarios are compared using a common parameter i.e., GHG emissions.
2.3.1. Scenario A (Current Practices)
In this scenario, hospital waste was collected and transported to an off-site incineration plant in specially designed waste vehicles. The hospital waste was incinerated and finally the unburnt waste and bottom ash from the incinerator transported to landfill for final disposal.
2.3.2. Scenario B (Integrated Approach)
Segregation of hospital waste into recyclable waste and non-recyclable waste is the first step in an integrated approach. Recyclable waste includes tubing, films, IV bags, catheters, face masks, housings, sutures, blood sets and syringes, needles, glass items, implants, surgical instruments. Recyclables such as paper, plastic, glass and metal are separated from hospital waste and decontaminated using chemical disinfection or steam sterilization. The quantity of recyclable waste is 1.6 tonnes per month, i.e., 30.7% of total hospital generated waste. Figure 3 shows the integrated approach for the management of hospital waste.

Figure 3.
Integrated hospital waste management approach.
3. Results
The GHG emissions from hospital waste management technologies are estimated using the same functional unit and system boundaries. Results are generated in a life cycle perspective as direct, avoided and net GHG emissions. Scenario A and Scenario B resulted in net GHG emissions of 1078.40 kg CO2-eq per tonne of waste and 989.31 kg CO2-eq per tonne of waste, respectively. The findings show that scenario A is damaging the environment due to intensive use of an incinerator. The recycling process provides an alternative to incineration and significantly reduces the environmental burdens. Figure 4 shows the GHG emissions from the whole system.

Figure 4.
Net GHG emissions from whole system.
In scenario A, net GHG emissions from transportation, incineration and landfilling were 358.65 kg CO2-eq per tonne of waste, 843.73 kg CO2-eq per tonne of waste and 99.85 kg CO2-eq per tonne of waste, respectively. Figure 5 shows the net GHG emissions from individual hospital waste management activity from scenario A.
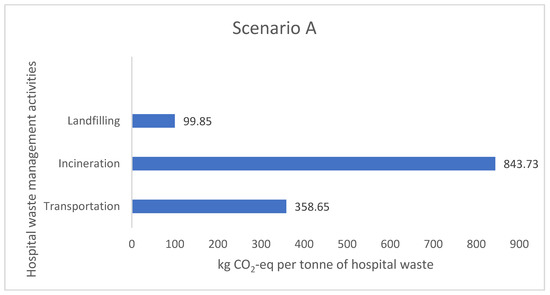
Figure 5.
Net GHG emissions from individual activity—scenario A.
The recycling process has many stages such as collection, sorting and pre-processing, and each stage contributes to GHG emissions. In scenario B, net GHG emissions from transportation, incineration, recycling and landfilling were 514.14 kg CO2-eq per tonne of waste, 812.23 kg CO2-eq per tonne of waste, −117.48 kg CO2-eq per tonne of waste and 96.38 kg CO2-eq per tonne of waste, respectively. The minus sign in net GHG emissions from recycling indicates indirect GHG savings. Figure 6 shows the net GHG emissions from individual hospital waste management activity from scenario B.

Figure 6.
Net GHG emissions from individual activity—scenario B.
The major contribution to GHG emissions from incineration came from the operational activities of the incinerator. GHG emissions from operation activities and combustion of waste were calculated to estimate direct GHG emissions from incineration. The consumption of electricity and natural gas makes it difficult to incinerate huge amounts of hospital waste and demands an alternative for the treatment of hospital waste. This study provides an alternative integrated approach for the management of hospital waste in a sustainable way. Table 10 shows the detail of GHG emissions from incineration of hospital waste.
Table 10.
GHG emissions from incineration.
Results demonstrate that scenario A showed higher values of GHG emissions and the recycling process reduces the overall environmental burdens.
3.1. Sensitivity and Uncertainty Analysis
Sensitivity analysis has been performed to evaluate the uncertainty levels in the study results. Uncertainty describes the distribution of data within a certain range and caused by variation in the data inputs. Variation is a statistical term described as standard deviation, which is the randomness of the observations. The main reasons for the uncertainty are assumptions, data quality, and geographical variations in data. Moreover, data may be sensitive to assumptions defined during the conduction of LCA. Secondary data, mostly from the IGES-GHG database were used in this study and there is a chance of uncertainty due to geographical differences. For example, recycling data in the database were according to the local conditions of Thailand and these are different from the local conditions in the study area; this may lead to uncertainty in the study results. The data quality can be evaluated using the pedigree matrix, which consists of five data quality indicators. Table 11 shows the data quality indicators used in the pedigree matrix [44].
Table 11.
Pedigree matrix used to evaluate the data quality.
Each indicator can be assessed with a score of 1 to 5, where a score of 1 means that data are of high quality and a score of 5 indicates poor quality of data. Each indicator and score give an uncertainty factor, which is combined into standard deviation to evaluate the uncertainty in the data quality of this study. Data quality appeared good in cases where data were measured and taken from the study area without any assumption. Table 12 shows the parameter score to assess the quality of data.
Table 12.
Assessment of data quality using Pedigree Matrix.
For the transportation activity, the total distance and fuel consumption of waste collection vehicles was calculated. The electricity and natural gas consumption rates of the incinerator were evaluated to calculate the exact electricity and natural gas consumption of the incinerator. Recycling of hospital waste was limited in the developing countries and there is lack of data availability in the scientific literature. The literature review gives precious insight regarding the recyclability of recyclables, especially plastic waste.
3.2. Interpretation
The study shows that current practices are not a sustainable solution for the problem of hospital waste management due to their environmental burdens. Intensive incineration releases harmful gases and particulate matter. In addition, transportation of hospital waste to an off-site incineration plant and recycling facility contributes to GHG emissions. Landfilling generates landfill gases and leachate, but the landfills have negligible contribution to GHG emissions relative to transportation and incineration. The results demonstrate that a hospital that shifts from its current practices to an integrated approach would reduce GHG emissions which equates to 37,756.44 kg CO2-eq per tonne of waste each year. This is a huge reduction in GHG emissions and can have considerable positive environmental impacts. Pakistan is a resource constrained country, and it is impossible to install advance treatment technologies; however, it is feasible to incorporate recycling processes into the hospital waste management.
3.3. Discussion
This study demonstrates that current hospital waste management practices have higher environmental burdens than an alternative integrated approach. Though public hospitals in the study area provided a baseline for initial data, results and information can be applied to any hospital in Pakistan to estimate the environmental impact related to waste scenarios. There are considerable economic and environmental benefits of a recycling process such as cost reduction of waste disposal, recovery of material and reduction in GHG emissions. The first and most important step in the integrated approach is the separation of recyclables from non-recyclable waste. A detailed waste assessment of every hospital department is made to understand the composition of hospital waste. Once the assessment is completed, waste containers are placed for the collection of components of recyclable waste and non-recyclable waste. The training of staff and all concerned stakeholders regarding the segregation and handling of hospital waste is necessary to achieve sustainable results from the integrated approach.
It is impossible to completely shift from incineration to any other treatment technology; however, recycling of hospital waste provides an alternative to incineration and plays a significant role in reducing GHG emissions from the whole system. LCA is a tool to assess the environmental impacts and gives different results due to different parameters such as functional unit, system boundaries, waste generation rates and the composition of waste. Similarly, the hospital waste management studies using LCA differ from each other in terms of quantification and characterization of hospital waste.
4. Conclusions
This study evaluates the current hospital waste management practices in five public hospitals in the district of Sheikhupura, Pakistan. Issues like the generation of large volumes of hospital waste and lack of availability of incinerators highlighted the need for an alternative solution for the problem of hospital waste management. Two scenarios were designed to estimate the environment impacts: scenario A refers to current practices and scenario B is an alternative integrated approach. Scenarios were compared based on GHG emissions in a life cycle perspective. Functional unit and system boundaries are the same for both scenarios. Scenario A and scenario B resulted in net GHG emissions of 1078.40 kg CO2-eq. per tonne of waste and 989.31 kg CO2-eq. per tonne of waste, respectively.
It has been discovered that hospital waste has a high percentage of recyclable waste (30.7% of total hospital waste) consisting of paper, plastic, glass and metal. The recycling of these recyclables provides an opportunity to mitigate GHG emissions of 37,756.44 kg CO2-eq. per tonne of waste annually. The economic benefits of recycling include the cost reduction of hospital waste disposal and recovery of valuable materials from the waste stream. Therefore, recycling is the most economic and environmentally friendly option for the disposal of hospital waste, and it will drive the whole system towards sustainability.
One of the limitations of this study is the lack of availability of recycling data. Additionally, GHG emissions is the only parameter to compare waste management scenarios. Transportation to off-site treatment facilities and incineration with no energy recovery system have high environmental impacts. Practical difficulties are faced during the segregation of hospital waste due to lack of knowledge regarding recyclable materials.
In future, the scope of this study can be expanded to other public as well as private hospitals. Awareness and training of hospital staff regarding segregation of hospital waste are key to achieving sustainable management. The recycling process provides economic and environmental benefits such as waste disposal cost reduction, recovery of valuable materials and avoiding GHG emissions. Therefore, recycling should be an objective of future studies.
Implication
LCA is a decision-making tool used in this study to evaluate the environmental impacts associated with different hospital waste management scenarios, helping to estimate the environmental burdens. Logistic factors are a major hurdle in the sustainable management of hospital waste and require the attention of the relevant authorities. The high cost of fossil fuels makes it impossible to rely on incineration as a sole option for the management of hospital waste.
Author Contributions
Data curation, M.H.M. and F.N.; Formal analysis, M.A.M. and S.A.; Funding acquisition, M.F.B.; Writing—original draft, M.H.M. and M.A.M.; Writing—review & editing, M.A.M., A.A.Y., M.E.M.S., A.H. and K.S. All authors have read and agreed to the published version of the manuscript.
Funding
This research received no external funding.
Institutional Review Board Statement
Not applicable.
Informed Consent Statement
Not applicable.
Data Availability Statement
Not applicable.
Conflicts of Interest
The authors declare no conflict of interest.
References
- Udofia, E.A.; Gulis, G.; Fobil, J. Solid medical waste: A cross sectional study of household disposal practices and reported harm in Southern Ghana. BMC Public Health 2017, 17, 464. [Google Scholar] [CrossRef]
- Chartier, Y.; Emmanuel, J.; Pieper, U.; Prüss, A.; Rushbrook, P.; Stringer, R.; Townend, W.; Wilburn, S.; Zghondi, R. Chartier, Safe Management of Wastes from Health-Care Activities, 2nd ed.; World Health Organization (WHO): Geneva, Switzerland, 2014. [Google Scholar]
- Padmaja, K. Knowledge, attitude, practice regarding hospital waste management among interns & nurses of tertiary care hospitals of Navi Mumbai. Sch. J. Appl. Med. Sci. 2017, 5, 526–530. [Google Scholar]
- Sahiledengle, B. Self-reported healthcare waste segregation practice and its correlate among healthcare workers in hospitals of Southeast Ethiopia. BMC Health Serv. Res. 2019, 19, 591. [Google Scholar] [CrossRef] [PubMed]
- Akulume, M.; Kiwanuka, S.N. Health Care Waste Segregation Behavior among Health Workers in Uganda: An Application of the Theory of Planned Behavior. J. Environ. Public Health 2016, 2016, 8132306. [Google Scholar] [CrossRef] [PubMed]
- Shinn, H.K.; Hwang, Y.; Kim, B.-G.; Yang, C.; Na, W.; Song, J.-H.; Lim, H.K. Segregation for reduction of regulated medical waste in the operating room: A case report. Korean, J. Anesthesiol. 2017, 70, 100–104. [Google Scholar] [CrossRef] [PubMed]
- Sengodan, V.C. Segregation of biomedical waste in an South Indian tertiary care hospital. J. Nat. Sci. Biol. Med. 2014, 5, 378–382. [Google Scholar] [CrossRef]
- Minoglou, M.; Gerassimidou, S.; Komilis, D. Healthcare Waste Generation Worldwide and Its Dependence on Socio-Economic and Environmental Factors. Sustainability 2017, 9, 220. [Google Scholar] [CrossRef]
- Kenny, C.; Priyadarshini, A. Review of Current Healthcare Waste Management Methods and Their Effect on Global Health. Healthcare 2021, 9, 284. [Google Scholar] [CrossRef]
- Boesch, M.E.; Vadenbo, C.; Saner, D.; Huter, C.; Hellweg, S. An LCA model for waste incineration enhanced with new technologies for metal recovery and application to the case of Switzerland. Waste Manag. 2014, 34, 378–389. [Google Scholar] [CrossRef] [PubMed]
- De, S.; Debnath, B. Prevalence of Health Hazards Associated with Solid Waste Disposal- A Case Study of Kolkata, India. Procedia Environ. Sci. 2016, 35, 201–208. [Google Scholar] [CrossRef]
- Decontamination and Waste Management; World Health Organization: Geneva, Switzerland, 2020.
- Hossain, S.; Balakrishnan, V.; Ab Rahman, N.N.N.; Sarker, Z.I.; Ab Kadir, M.O. Treatment of Clinical Solid Waste Using a Steam Autoclave as a Possible Alternative Technology to Incineration. Int. J. Environ. Res. Public Health 2012, 9, 855–867. [Google Scholar] [CrossRef]
- Burnley, S.; Wagland, S.; Longhurst, P. Using life cycle assessment in environmental engineering education. High. Educ. Pedagog. 2019, 4, 64–79. [Google Scholar] [CrossRef]
- Anshassi, M.; Townsend, T.G. Reviewing the underlying assumptions in waste LCA models to identify impacts on waste management decision making. J. Clean. Prod. 2021, 313, 127913. [Google Scholar] [CrossRef]
- Nirmala Menikpura, S.-A. Estimation Tool for Greenhouse Gas (GHG) Emissions from Municipal Solid Waste (MSW) Management in a Life Cycle Perspective; Institute for Global Environmental Strategies (IGES): Hayama, Japan, 2013. [Google Scholar]
- Eggleston, H.S.; Buendia, L.; Miwa, K.; Ngara, T.; Tanabe, K. (Eds.) 2006 IPCC Guidelines for National Greenhouse Gas Inventories; National Greenhouse Gas Inventories Programme; IGES: Hayama, Japan, 2006. [Google Scholar]
- Czuba, L. Application of Plastics in Medical Devices and Equipment. In Handbook of Polymer Applications in Medicine and Medical Devices; Elsevier: Amsterdam, The Netherlands, 2014; pp. 9–19. [Google Scholar] [CrossRef]
- Gill, Y.Q.; Khurshid, M.; Abid, U.; Ijaz, M.W. Review of hospital plastic waste management strategies for Pakistan. Environ. Sci. Pollut. Res. 2022, 29, 9408–9421. [Google Scholar] [CrossRef] [PubMed]
- Zamroni, M.; Prahara, R.S.; Kartiko, A.; Purnawati, D.; Kusuma, D.W. The Waste Management Program Of 3R (Reduce, Reuse, Recycle) By Economic Incentive And Facility Support. J. Physics: Conf. Ser. 2020, 1471, 012048. [Google Scholar] [CrossRef]
- van Straten, B.; Dankelman, J.; van der Eijk, A.; Horeman, T. A Circular Healthcare Economy; a feasibility study to reduce surgical stainless steel waste. Sustain. Prod. Consum. 2021, 27, 169–175. [Google Scholar] [CrossRef]
- Antonopoulos, I.; Faraca, G.; Tonini, D. Recycling of post-consumer plastic packaging waste in the EU: Recovery rates, material flows, and barriers. Waste Manag. 2021, 126, 694–705. [Google Scholar] [CrossRef] [PubMed]
- Faraca, G.; Astrup, T. Plastic waste from recycling centres: Characterisation and evaluation of plastic recyclability. Waste Manag. 2019, 95, 388–398. [Google Scholar] [CrossRef] [PubMed]
- van Straten, B.; van der Heiden, D.; Robertson, D.; Riekwel, C.; Jansen, F.; van der Elst, M.; Horeman, T. Surgical waste reprocessing: Injection molding using recycled blue wrapping paper from the operating room. J. Clean. Prod. 2021, 322, 129121. [Google Scholar] [CrossRef]
- Lee, B.-K.; Ellenbecker, M.J.; Moure-Eraso, R. Analyses of the recycling potential of medical plastic wastes. Waste Manag. 2002, 22, 461–470. [Google Scholar] [CrossRef]
- Hutchins, D.C.J.; White, S.M. Coming round to recycling. BMJ 2009, 338, b609. [Google Scholar] [CrossRef] [PubMed]
- Ragaert, K.; Delva, L.; Van Geem, K. Mechanical and chemical recycling of solid plastic waste. Waste Manag. 2017, 69, 24–58. [Google Scholar] [CrossRef] [PubMed]
- Chen, Y.; Cui, Z.; Cui, X.; Liu, W.; Wang, X.; Li, X.; Li, S. Life cycle assessment of end-of-life treatments of waste plastics in China. Resour. Conserv. Recycl. 2019, 146, 348–357. [Google Scholar] [CrossRef]
- Khoo, H.H. LCA of plastic waste recovery into recycled materials, energy and fuels in Singapore. Resour. Conserv. Recycl. 2019, 145, 67–77. [Google Scholar] [CrossRef]
- Gu, F.; Guo, J.; Zhang, W.; Summers, P.A.; Hall, P. From waste plastics to industrial raw materials: A life cycle assessment of mechanical plastic recycling practice based on a real-world case study. Sci. Total Environ. 2017, 601–602, 1192–1207. [Google Scholar] [CrossRef]
- Wäger, P.A.; Hischier, R. Life cycle assessment of post-consumer plastics production from waste electrical and electronic equipment (WEEE) treatment residues in a Central European plastics recycling plant. Sci. Total Environ. 2015, 529, 158–167. [Google Scholar] [CrossRef] [PubMed]
- Rigamonti, L.; Grosso, M.; Møller, J.; Sanchez, V.M.; Magnani, S.; Christensen, T. Environmental evaluation of plastic waste management scenarios. Resour. Conserv. Recycl. 2014, 85, 42–53. [Google Scholar] [CrossRef]
- Ferreira, S.; Cabral, M.; da Cruz, N.; Simões, P.; Marques, R.C. Life cycle assessment of a packaging waste recycling system in Portugal. Waste Manag. 2014, 34, 1725–1735. [Google Scholar] [CrossRef] [PubMed]
- Al-Salem, S.; Evangelisti, S.; Lettieri, P. Life cycle assessment of alternative technologies for municipal solid waste and plastic solid waste management in the Greater London area. Chem. Eng. J. 2014, 244, 391–402. [Google Scholar] [CrossRef]
- Rajendran, S.; Hodzic, A.; Scelsi, L.; Hayes, S.; Soutis, C.; AlMa’adeed, M.; Kahraman, R. Plastics recycling: Insights into life cycle impact assessment methods. Plast. Rubber Compos. 2013, 42, 1–10. [Google Scholar] [CrossRef]
- Nishijima, A.; Nakatani, J.; Yamamoto, K.; Nakajima, F. Life cycle assessment of integrated recycling schemes for plastic containers and packaging with consideration of resin composition. J. Mater. Cycles Waste Manag. 2012, 14, 52–64. [Google Scholar] [CrossRef]
- Al-Maaded, M.; Madi, N.K.; Kahraman, R.; Hodzic, A.; Ozerkan, N.G. An Overview of Solid Waste Management and Plastic Recycling in Qatar. J. Polym. Environ. 2012, 20, 186–194. [Google Scholar] [CrossRef]
- Komly, C.-E.; Azzaro-Pantel, C.; Hubert, A.; Pibouleau, L.; Archambault, V. Multiobjective waste management optimization strategy coupling life cycle assessment and genetic algorithms: Application to PET bottles. Resour. Conserv. Recycl. 2012, 69, 66–81. [Google Scholar] [CrossRef]
- Chilton, T.; Burnley, S.; Nesaratnam, S. A life cycle assessment of the closed-loop recycling and thermal recovery of post-consumer PET. Resour. Conserv. Recycl. 2010, 54, 1241–1249. [Google Scholar] [CrossRef]
- Hou, P.; Xu, Y.; Taiebat, M.; Lastoskie, C.; Miller, S.A.; Xu, M. Life cycle assessment of end-of-life treatments for plastic film waste. J. Clean. Prod. 2018, 201, 1052–1060. [Google Scholar] [CrossRef]
- Faraca, G.; Martinez-Sanchez, V.; Astrup, T.F. Environmental life cycle cost assessment: Recycling of hard plastic waste collected at Danish recycling centres. Resour. Conserv. Recycl. 2019, 143, 299–309. [Google Scholar] [CrossRef]
- Aryan, Y.; Yadav, P.; Ranjan Samadder, S. Life Cycle Assessment of the existing and proposed plastic waste management options in India: A case study. J. Clean. Prod. 2019, 211, 1268–1283. [Google Scholar] [CrossRef]
- Available online: https://ledsgp.org/app/uploads/2015/09/User_Manual_for_GHG-waste-calculator.pdf (accessed on 10 February 2022).
- Available online: https://lca-net.com/files/Overview_and_methodology.pdf (accessed on 8 February 2022).


Publisher’s Note: MDPI stays neutral with regard to jurisdictional claims in published maps and institutional affiliations. |
© 2022 by the authors. Licensee MDPI, Basel, Switzerland. This article is an open access article distributed under the terms and conditions of the Creative Commons Attribution (CC BY) license (https://creativecommons.org/licenses/by/4.0/).