Abstract
The supply chain management plays a crucial role in delivering products from a supplier, through the manufacturer, distributors, and retailers to the targeted customers. The lifecycle of the products can be ended at any stage due to imperfect quality or waste, which are typically not managed well for a good price. This product’s life can be extended and increased with the use of the circular economy for the value addition processes which turn the waste into byproducts, which can be sold with maximum profit. The automobile industry is associated with various other small industries and is very significant for the economy at the local, national, and international levels. However, the industry also requires sustainable development in its supply chain management, gained by introducing the circular economy concept to manage and reduce the generated waste. The consumption of carbon fiber-reinforced composites (CFRCs) in the manufacturing of numerous automotive parts has acquired immense attention this decade, but the process also generates imperfect products (waste). The proposed model is based on a mathematical formulation to manage imperfect production by reworking and recycling, where the former is required to re-add value to the proportion of the rejected parts, and the latter is to recycle the remaining scrap into useful products by using a circular economy. The outsourcing operation is also added to provide an optimal level of inventory and lot sizing for minimizing the total cost of the supply chain management. Data from the automobile part industry are tested to provide the practical implications of the proposed SCM mathematical model. Sensitivity analysis is performed to understand the significance level of the individual parameters affecting the objective function, i.e., the total cost of the SCM. The results show a meaningful insight for the managers to obtain the benefits of the circular economy in multi-stage automobile part production for sustainable and resilient supply chain management.
1. Introduction
For decades, the automotive industry has been among the leading revenue generating sectors globally. With the upsurge in demographics and the adaptation to their requirements, the automobile companies are putting new variants of automobiles into the market. Without doubt, the competition increases with the passage of time as a huge number of players have ventured into this sector. Technology and the economy are providing the cutting edge in this competition, and over the last two decades, the circular economy (CE) has increased the attention from practitioners and researchers in various organizations tenfold, due to its positive social and environmental protection impacts [1]. Moreover, it offers a chance to optimize the production process by creating sustainable products, and it preserves the value of the products to the greatest extent possible [2]. The term “circular economy” (CE) implies the transformation of business operations from the conventional linear economic system, in which regular resources (inputs such as raw material) are transformed into valuable products through production in a circular system, in which the harm done in resource acquirement is restored. The progress of conservation and sustainable use, sustainable recycling, and the closed-loop supply chain make sure that negligible waste is produced during the manufacturing process and the product’s lifecycle [3,4,5].
For businesses and nations to effectively and efficiently reduce and manage waste, the CE concept and its implementation are becoming crucial. Because the CE offers numerous possibilities for the regulation of items such as smartphones, plastic, food, and steel, emerging economies stand to benefit greatly from its implementation and proper governance. For instance, these economies receive end-of-life goods, such as electronics and clothing, from wealthy nations for refurbishing and consumption [6]. Therefore, emerging nations must create robust systems for refurbished and recycled imports. Recycling products, minimizing environmental contamination, and protecting the environment through “non-discard” behavior can lower import costs on an economic level and give the locals access to low-cost recycled goods (social).
In current study, the CE in the automotive industry has been targeted. In particular, the consumption and recycling of carbon fiber-reinforced composites (CFRCs) in the manufacturing of numerous automotive parts have acquired immense attention this decade. CFRCs, in the same manner as traditional metals, are in the limelight and are receiving a lot of consideration in the market. Reinforced composites with carbon fibers have an excessive strength-to-weight ratio with a density nearly as low as 1.6 g/cc, making them extremely lightweight without any compromise on strength [7]. Moreover, the light weight leads to secondary advantages, such as speediness and fuel efficiency for vehicles. Empirical studies show that a 10% drop in weight can conserve up to 6–8% of fuel in vehicles [8]. Such advantages further streamline the attention of carbon fiber-based automotive parts in lavish racing variants. However, recognizing the increase in and benefits of the supply of CFRCs, automakers have pondered whether to swap more traditional metal automotive components with CFRCs in a wide range of luxury cars and trucks [9]. Recycling and reworking are significant parameters in the enhancement of the effective utilization of the said products in the automotive industry; these products are included in this study.
Nonetheless, in many incipient economies, such as that of Pakistan, the exploration of the CE concept and its potential benefits has been scarce. Limited efforts have been made to detect the drivers and barriers in the implementation of the CE in developing economies outside of the context of China, which dominates the extant microlevel CE literature [10]. To the best of our knowledge, the study on the CE for CFRCs in the automobile sector is barely available. Furthermore, in this study the mathematical formation considering the recycling process of the waste generated in the automobile part manufacturing industry is carried out. Imperfect products in the form of re-working and recycling are also modelled for the circular economy. The proposed work consists of a literature review in Section 2. Section 3 highlights the model formulation while Section 4 and Section 5 present the numerical experimentation and solutions. Sensitivity analysis is conferred in Section 6 while the conclusion is discussed in Section 7.
2. Literature Review
The circular economy (CE) is an economic paradigm that, in contrast to the generalized, diffused, and traditional “take, make, dispose of” linear model, intends to curtail raw material consumption, enhance the product’s lifetime to maximize the extracted value from it, and later, when it reaches the end-of-life stage, to reuse its spare parts and components to cutback the total demand for raw materials [11]. The CE can generate a vigorous model that permits manufacturing entities, such as those companies involved in the chain of the automotive industry, to encounter the requirements of sustainable development [12]. However, the outcomes expected from the creation of a robust sustainability model have not been generated by the appliance of the circular economy’s activities in several divisions of manufacturing organizations [13]. The CE has been studied from three main perspectives in the literature that is now available: the macro (for example, a policy maker), the meso (for example, eco-industrial parks), and the microscopic (for example, a product or a company) [14]. A new research area based on circular business models (CBMs) has recently surfaced to examine how companies build their BMs in compliance with the CE principles [15,16]. Implementing the CE principles [17,18] necessitates a fundamental transformation of a company’s business model (BM) or the process by which it creates and exchanges value with its stakeholders and customers to produce profits [19,20].
With the passage of time in closed-loop supply chains (CLSC), the traditional economic order quantity (EOQ) model has witnessed changes as the actual market situation and demands have deviated from the assumptions previously incorporated, which were prone to errors [21]. Remanufacturing systems are an integral part of the CE, and possess a complex structure (consumer, supplier, retailer, remanufacturers, etc.). In comparison to manufacturing, uncertainties are inevitable traits of a remanufacturing environment and predicting the impacts on managerial decisions are intricate, leading to errors [22]. Therefore, the quantification of these effects is important in an EOQ model for a remanufacturing setup. Many researchers have contributed to the widespread applications of EOQ variants in remanufacturing environments [23,24,25,26]. Alinovi et al. 2012 [27] worked on extension of the EOQ model for impact assessment due to uncertain market demand. Chung et al. 2011 [28] worked on the determination of optimal units, considering carbon emission in the remanufacturing of units. Ray and Chaudhuri (2005) [29] worked on the storage levels in EOQ models when considering uncertain demands. Ahmed et al. 2022 [30] worked on reworking of defective items for global supply chain. In the current study, we adopt a mathematical model in the remanufacturing environment to consider imperfection in an uncertain environment. To the best of our knowledge, such a model is first of its kind for the CE in the automotive industry. The role of reverse logistics (RL) is a contemporary and important study for the CE. For instance, the studies on the critical elements of RL are on network design (Alumur et al., 2012) [31], collection points and warehousing (Bai and Sarkis, 2013) [32], the processing of the collected material (Kalayci and Gupta, 2013) [33], and digitization in RL (Isenberg, 2014) [34].
This study targets the automotive industry for the said purpose as it is one of the major contributing sectors of the global economy. Researchers are working on the economic, environmental, and societal factors in the automobile industry for sustainable development [35,36]. In the last few years, a growing trend in the automotive industry has been observed, in which metals are replaced by plastic components for a reduction in weight, thus leading to low fuel consumption. Plastics, in general, present a wide category, and their decomposition is also one of major concerns faced globally. For these purposes, the research work on plastics recovery through the CE in the automotive industry holds a substantial significance. In the automotive industry particularly, the disassembly of used parts and the cleaning, remodeling, assembling, storage, and packaging, for example, are only a few of the phases of sequences involved in the process of remanufacturing items, which is regarded as a fundamental process in the scientific literature [37,38,39]. Importantly, the ability to use the remanufactured components or parts requested by the automotive market; the available resources, the dynamics, and the existing capacity in organizations reflect the remanufacturing capacity of the company, particularly those that make up the automobile sector [40]. Similarly, to this, the businesses that remanufacture goods must increase their capacity to effectively control variation in their production lines and cut down on the processing periods needed to incorporate remanufactured components or parts into new goods smartly [41,42]; as such, a study considering 4.0 is also being undertaken [43].
In addition, a company’s remanufacturing capacity should also be planned such that it enables the creation of goods with a high-quality content in the shortest amount of time. This rule applies to all types of businesses, including those in the automobile industry [44,45]. In contrast, the first ten years of the current millennium were marked by a significant degree of volatility in the prices of goods and services [46]. Recycling, environmental sustainability, and waste-free production have become crucial for socio-economic development in the second decade [47] and are becoming vital elements for both economic development and social living. However, given that the world’s consumption of food and energy has grown exponentially over the past three decades and is predicted to increase threefold by the year 2050, the various actions and policies that are currently being implemented in many countries are only seen as a palliative addressal of the issue of global warming [48].
Value additions in the form of raw materials, work, time, energy, and the reuse of end-of-life products are desirable from an economic and environmental standpoint [49,50]. Reuse includes a variety of tactics, such as the direct use of automobile parts as spares or as a source for production [51]. More of the prior added value is typically preserved during the remanufacturing of used goods than during material recycling [52]. Remanufacturing used goods entails a manufacturing procedure intended to bring them back to the same standards as the comparable new goods. Optimistic assessments of market potential and the surge in demand support recycling/remanufacturing, as per the reports of APICS 2014 and EC 2015. Automotive remanufacturing is seen as a significant contributor to sustainable development, accounting for almost two-thirds of all remanufacturing activities globally [53], as per EC 2015. Remanufacturing fits within the circular economy efforts in the EU, and the Federal Vehicle Repair Cost Savings Act of 2015 saw the legalization of remanufacturing in the US. The Chinese included remanufacturing in its five-year plans as a national policy [54]. Additionally, scholars, academics, and professionals in the innovation arena have acknowledged in the literature that the circular economy is very closely linked to the innovation happenings carried out by businesses, primarily manufacturing businesses, including those in the automotive industry, but especially those involved in eco-innovation activities.
For many years, the automotive industry has been one of the major revenue-generating industries in the world economy. The auto industry is always creating and releasing new car models into the market to meet the wants of the growing demographic. However, because a lot of major competitors have entered this industry, it has also grown quite competitive. Researchers such as Burinskienė [55] have worked on the cost reduction of the automotive sector in the services segment. A lot of related work in terms of multi-objective optimization in the closed-loop and green supply chain, considering recycling costs and inventory management [56], multi-objective optimization modeling in remanufacturing (circular economy) [57], sustainable inventory management under an uncertain environment in the automotive sector [58,59], the waste recycling supply chain in manufacturing [60], has been carried out recently. However, manufacturers are continually searching for more cutting-edge technology to foster improved performance along with cost-effectiveness and the higher production of new automobiles due to the fierce competition within the sector. At the vehicular stage, two alternates of aluminum are commonly used: wrought and cast. Automotive cast aluminum usually has a high proportion of recycled substances compared to wrought aluminum. Conversely, cast aluminum is consumed for power train applications, such as pistons, transmission housing, and engine blocks, while wrought aluminum is consumed in body-frame fabrication [61]. A light weight is also acquired through substitute glazing, engine, and seat materials, along with the designs. Having said that, it is imperative to note that materials such as CFR plastics and magnesium do play a vital part in automotive light-weighting and are one of the future insights.
Furthermore, carbon fiber-reinforced composites (CFRCs) have a stake in the automobile makeup which has been increasing gradually over the recent decade due to the performance-related benefits. The processes of plastic production and their transformation are usually empowered by fossil fuel feedstocks that are inherently noncircular. Another problem caused by plastics is their partial recyclability at their end-of-life stage [62]. Subsequently, the rise in the carbon fiber usage exaggerates the issue of waste management, predominantly when the automotive components get to their end-of-life stage. The traditional methods of treating CFRPs at their end-of-life stage has generally had an undesirable impact on the environment due to the disposal in landfills [63]. Hence, scholars and industrialists have developed various recovering and recycling technologies for reclaiming carbon fibers and reusing them for supplementary applications. Nevertheless, the carbon fibers provide high performance; yet, the cost of virgin carbon fibers is comparatively expensive. This generates an amplified market demand for the recycled fiber products, as RCFs are comparatively cheaper. However, a comprehensive study of the lifecycle or cost investigation of recycling carbon fibers in the automotive industries has not been published in the literature; yet, the commercial recyclers indicate that RCF yields a 20–40% cost savings when compared with virgin fibers [64]. Lastly, the disparity in the supply chain and the demand for carbon fibers also accounts for the upsurge in the trend for the recycling of fibers. Table 1 illustrates the demand and actual supply of the carbon fibers in the current industries.

Table 1.
Overall carbon fiber demand and supply through 2020 [64].
Hence, this research is basically carried out to tackle the abovementioned deficiency and to assist the managers in taking effective decisions. A mathematical model, the only one of its kind to consider the recycling process of the waste generated in the automobile part manufacturing industry, is proposed in this work. This consists of the imperfect products in the form of re-work and recycled work, modelled for the circular economy. Lastly, an outsourcing operation is added to provide an optimal level of inventory and lot sizing for the minimizing of the total cost of the supply chain management.
3. Research Methodology
The methodology is significant to the understanding of the step-by-step procedure of the research to accomplish the intended objectives. It started with the detailed literature review to identify the problem and ended with the finding of the required results with the interpretation, as is shown in Figure 1. The starting phases of the methodology, i.e., the literature review and the problem statement, are discussed in the introduction and the literature review sections. The mathematical model is developed for the proposed supply chain management for the reworking and recycling operations of the circular economy; it is then verified and tested for errors. The data have been collected from the previous research articles and literature and have been analyzed by testing the reliability using statistics testing. The numerical experiment is performed by putting the reliable data into the proposed SCM mathematical model (equation) for the optimal decision variables. The results are obtained as optimal decisions with the best objective value.
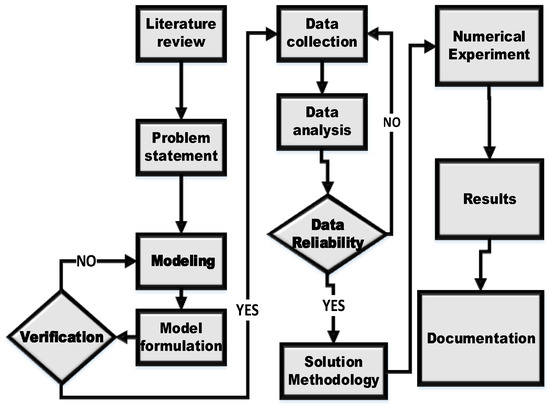
Figure 1.
Research methodology flow diagram.
3.1. Proposed Supply Chain Network
An automobile part manufacturing system is based on a multi-stage manufacturing system, where the production is performed in three phases. The constraint of the resources compelled the manufacturer to outsource a few operations to the vendor which created a systematic supply chain for inventory, production, and resource management. The in-house manufacturing considers the starting and finishing stage while the vendor manages the middle stage of the manufacturing. The typical supply chain management starts from raw material and ends at the finished goods after the multi-stage production for supply. However, the proposed research work integrates the circular economy concept in the current supply chain by managing the waste (imperfect production) produced at each stage using reworking and recycling operations. The purpose of the circular economy is fulfilled by managing the waste by modelling the reworking and recycling in the automobile part supply chain management.
The flow diagram of the production flow for the proposed supply chain management research method is given in Figure 2. The scrap produced as reinforced carbon fiber has been moved to the recycling for further processing and for conversion into the starting raw material of the automobile parts. The assumptions, notation, and model formulation of the proposed supply chain management is discussed further.
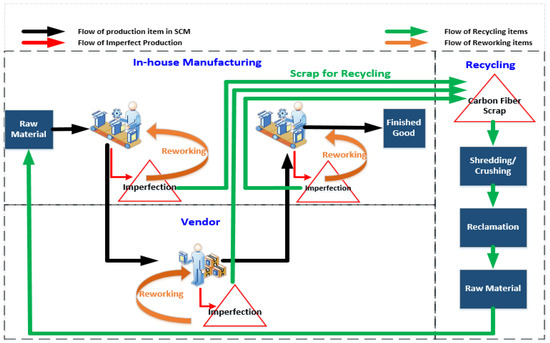
Figure 2.
A layout of the automobile part supply chain management considering circular economy by waste management using recycling and reworking operations.
3.2. Assumptions
The assumptions of the proposed supply chain management are based on a single manufacturer and multiple vendors. The supply chain is formed by sharing information, material, and money. The scenario is quite interesting in that the manufacturer is relying on the process of outsourcing for delivering 100% semifinished products to multiple vendors; after completing the outsourcing operations, they return these products back to the manufacturer for the finishing operations. The model requires the following assumptions in order to understand the limitations of the application in real-life situations.
- The manufacturer outsources some processes due to a shortage of internal resources
- The model is based on only a single type of item
- The holding cost of the raw materials per unit item is lower than the holding cost of the work in progress per unit
- All the scrap is recycled completely
- The customer demand is fulfilled in phase 3 only
- Both the demand and the production rates are constant
- To mitigate shortages, the production rate for all the phases is considered as P1 > ∑ P2i > P3 > D
- The inspection is carried out throughout the production and rework phases;
- The rate of reworking is equal to the production rate
- The inventory holding cost is based upon the average inventory
- The screening cost is neglected in this model
3.3. Model Formulation
There are three phases in the inventory diagram. The manufacturer’s phases are shown in phases 1 and 3, whereas the vendor’s phase is shown in phase 2. T1, T2, and T3 are the three portions of total time T (). These three phases of the manufacturer are further broken into t1, t2, t3, t4, t5, t6, t7, t8, and t9, such that , , and . Thus, the total cycle time can be written as . From Figure 1, it can be shown as n, and . The customer demand rate is denoted by the symbol D. Our model’s primary objective is to lower the whole cost of the supply chain TC, which includes both the manufacturer’s and the supplier’s total costs.
In addition,
The cost of manufacturer is given as
Similarly, the cost of the ith vendor will be
where i = 1, 2, 3 … n.
3.3.1. Cost of Manufacturer and Vendor
The manufacturing process is divided into two phases: phase 1 and phase 3. Both phases have their own set of costs. The setup cost, production cost, holding cost, carbon emission cost, inspection cost, and rework cost are all included in the manufacturing cost.
3.3.2. Setup Cost
This is a one-time cost that is not affected by quantity or time. This cost covers expenses such as tool setup and changeovers. It is the cost of starting the manufacturing system for the first time. The setup costs of the manufacturers are determined by
Similarly, the vendor’s setup costs can be shown as
3.3.3. Manufacturing and Rework Cost
This cost is heavily influenced by the demand for manufactured items. This cost includes all processing, machine, labor, and material expenses. The production cost per unit item and the reworks cost per unit item are considered to be equal for the same phase. As a consequence, the manufacturing and rework costs are given for phases 1 and 3.
The manufacturing cost for the vendor is given in Equation (9)
3.3.4. Holding Cost
The cost of holding the raw materials, the semi-finished items, and the completed goods is referred to as the holding cost. This cost comprises the cost of transporting semi-finished items between the producer and the supplier. This is illustrated mathematically in Equation (10).
where
The derivation of the holding cost is given in Appendix A for all three phases. Similarly, the holding cost of the vendors is given in Equation (12):
where i = (1, 2, 3), and
3.3.5. Carbon Emission Cost
Carbon emissions arise throughout the manufacturing process. Not only do the government and the industry care about reducing carbon emissions, but customers also want green products. For management considerations, this manufacturing model adds carbon emission costs [65]. Equation (14) may be used to estimate the cost of carbon emissions per unit output for the manufacturer.
For the vendors, it is shown by Equation (15):
3.3.6. Inspection Cost
Inspection is performed at all stages of manufacturing to guarantee that clients receive only the best products. Defective components are returned for rework, whereas excellent ones are returned for packaging. Equation (16) calculates the cost of inspection for the manufacturer and vendor.
3.3.7. Recycling Cost
This consists of the processing cost of the scrap produced by imperfect production. The scrap is a proportion of the rejected items and is not possible to rework. The reinforced carbon fiber as scrap is transferred to the recycling process, where a few processes, i.e., shredding/crushing and reclamation are performed to transform it again into the raw material of the automobile parts. The cost of recycling is given in the Equation (17).
3.3.8. Total Manufacturing Cost
The total manufacturing cost is the sum of the manufacturer’s setup cost, production cost, holding cost, carbon emission cost, and inspection cost. Equations (5), (7), (8), (10), (12), and (14) describe the total cost of the manufacturer, as given in Equation (18):
3.3.9. Total Cost of Vendors
Similarly, by adding Equations (6), (9), (11), (13), and (15) into Equation (4), the generic equation for the total cost of all the vendors may be demonstrated, as given in Equation (19):
3.3.10. Total Cost of the Supply Chain
Equation (20) is obtained by combining Equations (18) and (19) into Equation (1) to determine the overall cost of the supply chain:
The first-order derivative can be written as
4. Numerical Experiment and Solution Methodology
The data were collected from the literature review based on the automobile spare part manufacturing industry. The data related to the production rate, demand, setup cost, holding cost, and manufacturing cost were taken from the paper of Sarkar et al. (2014) [66,67]. The inspection data were collected from the research study of Sarkar (2016) [68]. The data of the carbon emissions in tons per unit item of production were taken from the work conducted by M. Omair et al. (2016) [69]. The other data considered, such as defective rates and marginal cost, are taken directly from the industry because they rely on the industrial conditions and state regulations. The data of the automobile spare part manufacturing industry of phase A and C, taken from the literature review, are given in Table 2. The setup cost and carbon emission cost are sums of the costs of both phase A and phase C.
Table 2.
Manufacturing data for phase A and phase C (auto part manufacturing industry).
There are three vendors considered in the proposed automobile part manufacturing supply chain management. The outsourcing is also based on the production model, where the imperfection products are inspected and sorted into reworking and recycling products for the circular economy. In phase B, the processes are performed in outsourcing firms. The major costs of manufacturing in phase B are given in Table 3.
Table 3.
Outsourcing data (auto part manufacturing industry).
The model is developed for the SCM of the multi-stage manufacturer and the multiple vendors (n); however, the three outsourcers/vendors are considered for the methodology and numerical experiment of the study. The research aims to obtain optimal lot quantity Q for the manufacturer: Qb1 for the 1st vendor, Qb2 for the 2nd vendor, and Qb3 for the 3rd vendor. The mathematical model is a constrained nonlinear type in solving. The objective function cannot be solved through the classical method because of its complexity. To solve this nonlinear equation, sequential quadratic programming (SQP) is used [70]. The SQP approach is based on the Newton approach, which is the best way to solve the unconstrained optimizations [71]. Schittkowski et al. [72] have introduced and tested a version that, in terms of performance, accuracy and percentage, outperforms any other system, and they have tested successful solutions for a wide range of research concerns. The approach closely resembles the methodology for the unconstrained optimization of the Newton method. An approximation is made of the Hessian using a quasi-Newton updating method at each major iteration. It is then used to generate a quadratic programming (QP) sub-problem that is used to create a search direction for a line solution. SQP has a fast execution time compared to other optimization techniques. It solves objective functions with less iteration.
5. Numerical Results and Discussion
Numerical managers are concerned with parameters that have a substantial influence on TC. The initial investment is intended to keep those variables under balance. One of them is the cost of the setup and carbon emissions. Reusable sources of energy are utilized to lower the cost of the carbon footprint. Inline inspection should be rigorously followed to avoid rework costs, and a traditional, human-based inspection can be managed by automation and technology to minimize inspection expenditures. Table 4 shows what effect the decision variables have on the objective function TC when we change their values from the optimum value suggested by our model. It can be seen that iteration number 6 is the only optimal value of Q for the minimum TC.
Table 4.
Effect of decision variables on TC.
The optimality of the production quantity is dependent on the response, i.e., the total cost of the SCM. The SQP is utilized to find the best result on the basis of the decisions. Figure 3 depicts the relationship between the manufacturing lot size and the overall supply chain cost. The lot sized as a decision variable obtained from the proposed model is set at 45 units for the minimum supply chain cost, i.e., USD 48332. It is required to set the production quantity at 45 as a starting production rate in the first stage of the manufacturer; these are further transferred to the three (03) vendors in the SCM, where the optimal outsourcing strategy for the given numeral is given, and vendor 01 will receive fourteen (14) units, vendor 02 sixteen (16) units, and vendor 03 seventeen (17) units, respectively, for the minimum total cost of the SCM.
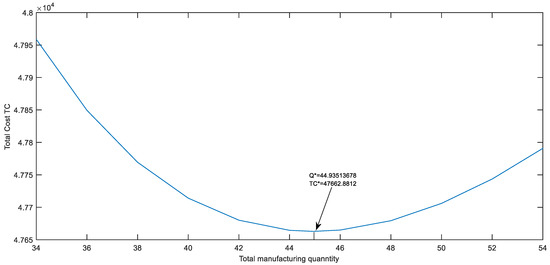
Figure 3.
Total cost (TC) with respect to production lot size Q (‘*’ denotes optimum quantity).
It is pertinent to mention here that the curve is showing a concave shape for the optimization of the decision variable, i.e., the production lot size with respect to the objective function, i.e., the total cost of the SCM. The optimized production lot size is delivered to the multiple vendors for possible outsourcing distribution, where the inventory, production, and outsourcing quantities are managed for an effective supply chain between the multi-stage manufacturer and the vendor. A good production policy is obtained with an optimal production lot size and optimal outsourcing strategy for the smooth flow of the goods in an effective SCM. The results are promising and outstanding for the supply chain managers for the management of the outsourcing and the production decisions.
6. Sensitivity Analysis
The sensitivity analysis is required to obtain the importance and significance of the input parameters on the output of the proposed SCM model, i.e., the TC. The managers and industrial experts required further analysis for the implication of the proposed SCM. The uncertainty in the prices of the input variable due to inflation, the exchange rate, the increasing energy prices, and the other uncontrollable disruptions definitely affect the total cost. The important factors are changed with the variation of their impact on the output. Table 5 demonstrates the sensitivity of the total cost of the system to each input parameter when altered by −50%, −25%, +25%, and +50%. The percent change in the total cost of the system indicates the degree of sensitivity of the total cost to that specific parameter. The data compiled in Table 5show the sensitivity analysis of the manufacturer. The sensitivity analyses of all the variables are presented in Appendix A, Table A1, Table A2, Table A3, Table A4, Table A5, Table A6 and Table A7.
Table 5.
Sensitivity analysis of input parameters.
In the above table, the sensitivity of each variable is shown for all the decision variables and the total cost. The data lead to the following conclusion:
- A rise in demand rate “D” raises the total cost TC. The demand rate has a greater impact on the total cost. Changing the demand value by 50% might result in a 48% increase in the overall cost.
- As the marginal cost MR rises, so does the TC. It is the second most significant measure in terms of the TC. Changing the MR by 50% affects the TC by 29%.
- High carbon emissions will raise the overall cost. With a TC variation of 5.8 percent, it is the third most important variable.
- A rise in production costs raises the TC. When fluctuating by 50%, it can affect the TC by 4.0%.
- The TC changes by 3.5% if the inspection costs (I1, I2i, I3) alter by 50%. The inventory holding costs (hm, hvi), raw material holding costs (hr1, h2v, i), and setup costs (sm, svi) all have a direct effect on the overall cost. Increasing these costs might raise the overall cost (TC).
- Certain variables have little influence on the decision variables but have a large impact on the overall cost. MR, Ia, Ic, Ibi, em, ebi, Ma, Mc, and Mbi are the parameters.
- The production rate (P1, P2i, and P3) has an inverse relationship with the total cost. When the rate of production increases, the overall cost drops.
The sensitivity analysis is well illustrated with the help of curves. The graphical illustration of the sensitivity analysis is shown in Figure 4.
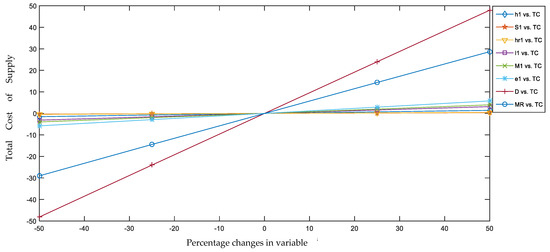
Figure 4.
Graphical representation of sensitivity analysis.
According to the graphical representation, the marginal and demand lines have a greater influence on the overall cost%. A little adjustment in any of these factors will have a big impact on the overall cost. The remaining variables have little influence on the overall cost. Only when the marginal and demand rates vary dramatically does the total cost change. All of the other variable lines may be identified using different colors and markers. As this graph shows, the marginal rate and demand have a considerable influence on output. Similarly, to the second line, the third line represents the cost of carbon emissions, which has the third largest influence on the total cost and can change the total cost significantly. The fourth component in this category is the production cost, and the following factor with a greater influence on the overall cost is the holding cost. The overall cost reduces as the manufacturing rate rises. Figure A2, Figure A3 and Figure A4 in Appendix A show that the sensitivity analysis of the key factors, including the holding cost, setup cost, and carbon emission cost, is also provided. These analyses are important for the decision makers and managers in understanding the importance of the holding cost, production cost, production rate, marginal rate, setup cost, etc., and the impact on the total cost of the SCM. It was found that the demand fluctuation affected the total cost with a big margin, i.e., 48%, and the production cost with the impact of around 5%, and the production cost affected the total cost of the SCM with 4%. These analyses are important as a proactive approach for the uncertain fluctuations in costs parameters and demand due to exchange rate, inflations, increasing energy costs, and uncontrollable scenarios. The results are showing a positive impact on the total cost of supply chain appreciating the circular economy by considering recycling and reworking of waste produced.
7. Conclusions
The automobile part manufacturing industry requires research and development for the development of the economy at the domestic and global level. The waste produced in the industry is a major concern for the managers to deal with. The circular economy plays a significant role in the management of that waste by converting the linear economy into a circular economy. The reworking and recycling operations of imperfect production in the automobile industry to minimize the waste and maximize the profit of the supply chain management are the way towards a circular economy. Reinforced carbon fiber as an important constituent of the automobile parts is transformed and recycled into the raw material by particular production process. The data from the automobile part manufacturing industry provide an insight into the implications of the proposed supply chain model for managing lot size, inventory, reworking, recycling, outsourcing, and the production of the multi-stage manufacturing system. The production quantity and outsourcing quantity for each vendor are optimized to minimize the total cost of the supply chain management.
A supply chain management based on single multi-stage manufacturer and multiple vendors for managing outsourcing is modelled and optimized. The imperfect production is well managed by adding the circular economy concept. A nonlinear mathematical equation for minimizing the total cost of the supply chain management is obtained and is solved using an evolutionary algorithm called sequential quadratic programming (SQP). The detailed sensitivity analysis is also performed to manage and find the significance of the input parameters on the total cost of the SCM. The model is highly sensitive to the annual demand, and the results show bigger changes with the varying demand. The production cost and the inspection cost have less impact on the total cost.
The proposed model helps managers in deciding on the optimal quantity for production and the lot size for shifting to outsourcers that will minimize the total cost of the supply chain. The results are an outstanding and significant aid for the decision makers to manage the reinforced carbon fiber waste into the recycling and reworking operations for circular economy. In addition, the sensitivity provided a clear picture of the important factors affecting the total cost, and those factors can be controlled for the resilient SCM. The optimal result and solution are important in understanding the importance of the waste management and outsourcing with a minimum cost of production. Overall, the research creates awareness among the managers, government organizations, and researchers in understanding the role of the circular economy and the use of reinforced carbon fiber in the automobile industry for the value chain management and escalating economy.
The model is based on deterministic demand, and demand is sensitive to the total cost of the SCM. Therefore, in future the model can be extended with variable demand depending on multiple variables, which can be obtained using probabilistic, fuzzy, stochastic linear regression approaches. The model considers two echelons for production and outsourcing firms by managing inventory, lot size, and production; however, it can be modeled for the three-echelon SCM. It is also recommended that industries and government should work together for the implementation of the circular economy of the automobile part manufacturing firms to minimize the waste and maximize the profit with value chain management.
Author Contributions
Conceptualization, M.O. and M.A.; methodology, M.O.; software, K.A.; validation, M.A. and K.A.; formal analysis, M.A. and G.H.; investigation, G.H., K.A. and J.B.; data curation, M.O., K.A. and G.H.; writing—original draft preparation, M.O.; writing—review and editing, M.O. and M.A.; supervision, J.B.; funding acquisition, M.A. All authors have read and agreed to the published version of the manuscript.
Funding
This work was supported by Researchers Supporting Project Number (RSP-2021/274), King Saud University, Riyadh, Saudi Arabia.
Institutional Review Board Statement
Not applicable.
Informed Consent Statement
Not applicable.
Data Availability Statement
Not applicable.
Acknowledgments
This work was supported by the Researchers Supporting Project Number (RSP-2021/274), King Saud University, Riyadh, Saudi Arabia.
Conflicts of Interest
The authors declare no conflict of interest.
Abbreviations
| Abbreviations | Description |
| M | Index for manufacturer |
| vi | Index for ith vendor |
| TC | The total cost of the supply chain |
| TCm | The total cost of the manufacturer |
| TCvi | The total cost of ith vendor |
| Hm | Holding cost of manufacturer |
| Hvi | Holding cost of vendor i |
| hm | Holding cost per unit item of manufacturer |
| hvi | Holding cost per unit item of an ith vendor |
| hr1 | Unit holding cost of raw material for manufacturer of first phase |
| hr3 | Unit holding cost of raw material for manufacturer of third phase |
| hr2i | Unit holding cost of raw material for vendors of second phase |
| Sm | Setup cost of manufacturer |
| Svi | Setup cost of vendor i |
| s1 | Setup cost per unit item of manufacturer |
| s2i | Setup cost per unit item of an ith vendor |
| M1 | Production cost of the manufacturer for first phase |
| M3 | Production cost of a manufacturer for third phase |
| M2i | Production cost of the ith vendor for second phase |
| m1 | Production cost per unit item of phase 1 for manufacturer |
| m3 | Production cost per unit item of phase 3 for manufacturer |
| m2i | Production cost per unit item of an ith vendor |
| D | Constant rate of demand |
| P1 | Production rate of phase 1 |
| P3 | Production rate of phase 3 |
| P2i | Production rate of phase 2 for ith vendor |
| CEm | Carbon emission cost for the manufacturer |
| CEvi | Carbon emission cost for ith vendor |
| fm | Carbon emission cost per ton CO2 emission for manufacturer |
| e1 | Carbon emission per unit item production for the manufacturer |
| fvi | Carbon emission cost per ton CO2 emission for vendor i |
| e2i | Carbon emission per unit item production for vendor i |
| α1 | Rate of rework of first phase for the manufacturer |
| α3 | Rate of rework of third phase for manufacturer |
| α2i | Rate of rework of second phase for the ith vendor |
| β1 | Rate of scrap for recycling from first phase of the manufacturer |
| β3 | Rate of scrap for recycling from third phase of manufacturer |
| β2i | Rate of scrap for recycling from second phase of ith vendor |
| R | Recycling cost per item (USD/item) |
| MR | Marginal cost of vendors |
| ICm | Inspection cost for the manufacturer |
| ICvi | Inspection cost for ith vendor |
| I1 | Inspection cost per unit item at first phase |
| I3 | Inspection cost per unit item at third phase |
| I2i | Inspection cost per unit item at second phase for ith vendor |
| c | Capacity of each item (%) |
| C | Capacity of manufacturer inventory (%) |
| Cvi | Total capacity of ith vendor inventory (%) |
Appendix A
Table A1.
Sensitivity analysis for setup cost of manufacturer and vendors.
Table A1.
Sensitivity analysis for setup cost of manufacturer and vendors.
| Parameters | % Age Change | Decision Variables | Changed Cost | % Change in the Total Cost | |||
|---|---|---|---|---|---|---|---|
| Q | Qb1 | Qb2 | Qb3 | ||||
| Sm | −50 | 40.3 | 12.6 | 13.5 | 14.3 | 47,494.0890 | −0.35 |
| −25 | 44.4 | 13.7 | 14.9 | 15.8 | 47,578.9616 | −0.18 | |
| 25 | 45.4 | 13.9 | 15.3 | 16.2 | 47,745.8790 | 0.17 | |
| 50 | 45.9 | 14.1 | 15.4 | 16.4 | 47,827.9848 | 0.35 | |
| Sb1 | −50 | 41.3 | 9.8 | 15.2 | 16.2 | 47,006.4712 | −1.38 |
| −25 | 43.3 | 12.0 | 15.2 | 16.1 | 47,361.9368 | −0.63 | |
| 25 | 46.4 | 15.4 | 15.1 | 16.0 | 47,928.8769 | 0.56 | |
| 50 | 47.8 | 16.8 | 15.0 | 15.9 | 48,169.9823 | 1.06 | |
| Sb2 | −50 | 40.9 | 13.9 | 10.8 | 16.2 | 46,997.1621 | −1.40 |
| −25 | 43.1 | 13.9 | 13.1 | 16.1 | 47,357.5307 | −0.64 | |
| 25 | 46.6 | 13.8 | 16.8 | 16.0 | 47,932.9298 | 0.57 | |
| 50 | 48.0 | 13.7 | 18.4 | 15.9 | 48,177.8169 | 1.08 | |
| Sb3 | −50 | 40.7 | 13.9 | 15.3 | 11.5 | 46,973.2156 | −1.45 |
| −25 | 43.0 | 13.9 | 15.2 | 13.9 | 47,346.4625 | −0.66 | |
| 25 | 46.7 | 13.8 | 15.1 | 17.9 | 47,942.8118 | 0.59 | |
| 50 | 48.2 | 13.7 | 15.0 | 19.5 | 48,196.7217 | 1.12 | |
Table A2.
Sensitivity analysis for holding cost of manufacturer and vendors.
Table A2.
Sensitivity analysis for holding cost of manufacturer and vendors.
| Parameters | % Age Change | Decision Variables | Changed Cost | % Change in the Total Cost | |||
|---|---|---|---|---|---|---|---|
| Q | Qb1 | Qb2 | Qb3 | ||||
| hm | −50 | 49.8 | 15.2 | 16.8 | 17.8 | 46,930.4577 | −1.54 |
| −25 | 47.2 | 14.4 | 15.9 | 16.9 | 47,305.9910 | −0.75 | |
| 25 | 43.0 | 13.2 | 14.4 | 15.3 | 48,003.6605 | 0.71 | |
| 50 | 41.3 | 12.7 | 13.9 | 14.7 | 48,330.3343 | 1.40 | |
| hb1 | −50 | 45.9 | 14.8 | 15.1 | 16.0 | 47,506.1409 | −0.33 |
| −25 | 45.4 | 14.3 | 15.1 | 16.0 | 47,585.8844 | −0.16 | |
| 25 | 44.5 | 13.4 | 15.1 | 16.0 | 47,737.3922 | 0.16 | |
| 50 | 44.2 | 13.0 | 15.1 | 16.1 | 47,809.6401 | 0.31 | |
| hb2 | −50 | 45.7 | 13.8 | 15.9 | 16.0 | 47,538.7000 | −0.26 |
| −25 | 45.3 | 13.8 | 15.5 | 16.0 | 47,601.6297 | −0.13 | |
| 25 | 44.6 | 13.8 | 14.7 | 16.0 | 47,722.5794 | 0.13 | |
| 50 | 44.3 | 13.8 | 14.4 | 16.1 | 47,780.8348 | 0.25 | |
| hb3 | −50 | 45.7 | 13.8 | 15.1 | 16.8 | 47,545.9719 | −0.25 |
| −25 | 45.3 | 13.8 | 15.1 | 16.4 | 47,605.1404 | −0.12 | |
| 25 | 44.6 | 13.8 | 15.1 | 15.7 | 47,719.2907 | 0.12 | |
| 50 | 44.3 | 13.8 | 15.1 | 15.3 | 47,774.4552 | 0.23 | |
Table A3.
Sensitivity analysis for manufacturing cost of manufacturer and vendors.
Table A3.
Sensitivity analysis for manufacturing cost of manufacturer and vendors.
| Parameters | % Age Change | Decision Variables | Changed Cost | % Change in the Total Cost | |||
|---|---|---|---|---|---|---|---|
| Q | Qb1 | Qb2 | Qb3 | ||||
| Ma | −50 | 44.9 | 13.8 | 15.1 | 16.0 | 45,772.8812 | −3.97 |
| −25 | 44.9 | 13.8 | 15.1 | 16.0 | 46,717.8812 | −1.98 | |
| 25 | 44.9 | 13.8 | 15.1 | 16.0 | 48,607.8812 | 1.98 | |
| 50 | 44.9 | 13.8 | 15.1 | 16.0 | 49,552.8812 | 3.97 | |
| Mc | −50 | 44.9 | 13.8 | 15.1 | 16.0 | 46,438.8812 | −2.57 |
| −25 | 44.9 | 13.8 | 15.1 | 16.0 | 47,050.8812 | −1.28 | |
| 25 | 44.9 | 13.8 | 15.1 | 16.0 | 48,274.8812 | 1.28 | |
| 50 | 44.9 | 13.8 | 15.1 | 16.0 | 48,886.8812 | 2.57 | |
| Mb1 | −50 | 44.9 | 13.8 | 15.1 | 16.0 | 46,586.4812 | −2.26 |
| −25 | 44.9 | 13.8 | 15.1 | 16.0 | 47,124.6812 | −1.13 | |
| 25 | 44.9 | 13.8 | 15.1 | 16.0 | 48,201.0812 | 1.13 | |
| 50 | 44.9 | 13.8 | 15.1 | 16.0 | 48,739.2812 | 2.26 | |
| Mb2 | −50 | 44.9 | 13.8 | 15.1 | 16.0 | 46,407.0812 | −2.63 |
| −25 | 44.9 | 13.8 | 15.1 | 16.0 | 47,034.9812 | −1.32 | |
| 25 | 44.9 | 13.8 | 15.1 | 16.0 | 48,290.7812 | 1.32 | |
| 50 | 44.9 | 13.8 | 15.1 | 16.0 | 48,918.6812 | 2.63 | |
| Mb3 | −50 | 44.9 | 13.8 | 15.1 | 16.0 | 46,227.6812 | −3.01 |
| −25 | 44.9 | 13.8 | 15.1 | 16.0 | 46,945.2812 | −1.51 | |
| 25 | 44.9 | 13.8 | 15.1 | 16.0 | 48,380.4812 | 1.51 | |
| 50 | 44.9 | 13.8 | 15.1 | 16.0 | 49,098.0812 | 3.01 | |
Table A4.
Sensitivity analysis for inspection cost of manufacturer and vendors.
Table A4.
Sensitivity analysis for inspection cost of manufacturer and vendors.
| Parameters | % Age Change | Decision Variables | Changed Cost | % Change in the Total Cost | |||
|---|---|---|---|---|---|---|---|
| Q | Qb1 | Qb2 | Qb3 | ||||
| I1 | −50 | 44.9 | 13.8 | 15.1 | 16.0 | 46,162.8812 | −3.15 |
| −25 | 44.9 | 13.8 | 15.1 | 16.0 | 46,912.8812 | −1.57 | |
| 25 | 44.9 | 13.8 | 15.1 | 16.0 | 48,412.8812 | 1.57 | |
| 50 | 44.9 | 13.8 | 15.1 | 16.0 | 49,162.8812 | 3.15 | |
| I3 | −50 | 44.9 | 13.8 | 15.1 | 16.0 | 46,312.8812 | −2.83 |
| −25 | 44.9 | 13.8 | 15.1 | 16.0 | 46,987.8812 | −1.42 | |
| 25 | 44.9 | 13.8 | 15.1 | 16.0 | 48,337.8812 | 1.42 | |
| 50 | 44.9 | 13.8 | 15.1 | 16.0 | 49,012.8812 | 2.83 | |
| I21 | −50 | 44.9 | 13.8 | 15.1 | 16.0 | 46,024.1312 | −3.44 |
| −25 | 44.9 | 13.8 | 15.1 | 16.0 | 46,843.5062 | −1.72 | |
| 25 | 44.9 | 13.8 | 15.1 | 16.0 | 48,482.2562 | 1.72 | |
| 50 | 44.9 | 13.8 | 15.1 | 16.0 | 49,301.6312 | 3.44 | |
| I22 | −50 | 44.9 | 13.8 | 15.1 | 16.0 | 45,937.8812 | −3.62 |
| −25 | 44.9 | 13.8 | 15.1 | 16.0 | 46,800.3812 | −1.81 | |
| 25 | 44.9 | 13.8 | 15.1 | 16.0 | 48,525.3812 | 1.81 | |
| 50 | 44.9 | 13.8 | 15.1 | 16.0 | 49,387.8812 | 3.62 | |
| I23 | −50 | 44.9 | 13.8 | 15.1 | 16.0 | 45,851.6312 | −3.80 |
| −25 | 44.9 | 13.8 | 15.1 | 16.0 | 46,757.2562 | −1.90 | |
| 25 | 44.9 | 13.8 | 15.1 | 16.0 | 48,568.5062 | 1.90 | |
| 50 | 44.9 | 13.8 | 15.1 | 16.0 | 49,474.1312 | 3.80 | |
Table A5.
Sensitivity analysis for carbon emission per unit item of manufacturer and vendors.
Table A5.
Sensitivity analysis for carbon emission per unit item of manufacturer and vendors.
| Parameters | % Age Change | Decision Variables | Changed Cost | % Change in the Total Cost | |||
|---|---|---|---|---|---|---|---|
| Q | Q21 | Q22 | Q23 | ||||
| Em | −50 | 44.9 | 13.8 | 15.1 | 16.0 | 44,902.8812 | −5.79 |
| −25 | 44.9 | 13.8 | 15.1 | 16.0 | 46,282.8812 | −2.90 | |
| 25 | 44.9 | 13.8 | 15.1 | 16.0 | 49,042.8812 | 2.90 | |
| 50 | 44.9 | 13.8 | 15.1 | 16.0 | 50,422.8812 | 5.79 | |
| ev1 | −50 | 44.9 | 13.8 | 15.1 | 16.0 | 46,948.7312 | −1.50 |
| −25 | 44.9 | 13.8 | 15.1 | 16.0 | 47,305.8062 | −0.75 | |
| 25 | 44.9 | 13.8 | 15.1 | 16.0 | 48,019.9562 | 0.75 | |
| 50 | 44.9 | 13.8 | 15.1 | 16.0 | 48,377.0312 | 1.50 | |
| ev2 | −50 | 44.9 | 13.8 | 15.1 | 16.0 | 46,869.3812 | −1.66 |
| −25 | 44.9 | 13.8 | 15.1 | 16.0 | 47,266.1312 | −0.83 | |
| 25 | 44.9 | 13.8 | 15.1 | 16.0 | 48,059.6312 | 0.83 | |
| 50 | 44.9 | 13.8 | 15.1 | 16.0 | 48,456.3812 | 1.66 | |
| ev3 | −50 | 44.9 | 13.8 | 15.1 | 16.0 | 46,790.0312 | −1.83 |
| −25 | 44.9 | 13.8 | 15.1 | 16.0 | 47,226.4562 | −0.92 | |
| 25 | 44.9 | 13.8 | 15.1 | 16.0 | 48,099.3062 | 0.92 | |
| 50 | 44.9 | 13.8 | 15.1 | 16.0 | 48,535.7312 | 1.83 | |
Table A6.
Sensitivity analysis for production rate of manufacturer and vendors.
Table A6.
Sensitivity analysis for production rate of manufacturer and vendors.
| Parameters | % Age Change | Decision Variables | Changed Cost | % Change in the Total Cost | |||
|---|---|---|---|---|---|---|---|
| Q | Qb1 | Qb2 | Qb3 | ||||
| P1 | −50 | 39.6 | 12.2 | 13.3 | 14.1 | 48,676.5423 | 2.13 |
| −25 | 42.9 | 13.2 | 14.4 | 15.3 | 48,015.2125 | 0.74 | |
| 25 | 46.3 | 14.2 | 15.6 | 16.5 | 47,443.3664 | −0.46 | |
| 50 | 47.2 | 14.5 | 15.9 | 16.9 | 47,293.2992 | −0.78 | |
| P3 | −50 | 48.3 | 14.8 | 16.2 | 17.3 | 47,142.2867 | −1.09 |
| −25 | 46.1 | 14.1 | 15.5 | 16.5 | 47,476.8613 | −0.39 | |
| 25 | 44.2 | 13.6 | 14.9 | 15.8 | 47,779.9770 | 0.25 | |
| 50 | 43.8 | 13.5 | 14.7 | 15.6 | 47,860.2119 | 0.41 | |
| P21 | −50 | 43.4 | 12.2 | 15.1 | 16.0 | 47,974.2549 | 0.65 |
| −25 | 44.3 | 13.2 | 15.1 | 16.0 | 47,783.6076 | 0.25 | |
| 25 | 45.5 | 14.2 | 15.2 | 16.1 | 47,568.2539 | −0.20 | |
| 50 | 46.0 | 14.6 | 15.2 | 16.2 | 47,487.4091 | −0.37 | |
| P22 | −50 | 43.3 | 13.7 | 13.6 | 15.9 | 47,967.1023 | 0.64 |
| −25 | 44.2 | 13.7 | 14.5 | 15.9 | 47,790.0488 | 0.27 | |
| 25 | 45.6 | 13.9 | 15.5 | 16.1 | 47,557.6326 | −0.22 | |
| 50 | 46.1 | 14.0 | 15.9 | 16.3 | 47,468.1258 | −0.41 | |
| P23 | −50 | 43.2 | 13.7 | 15.0 | 14.6 | 47,974.8463 | 0.65 |
| −25 | 44.2 | 13.7 | 15.0 | 15.4 | 47,795.6793 | 0.28 | |
| 25 | 45.6 | 13.9 | 15.2 | 16.5 | 47,552.8428 | −0.23 | |
| 50 | 46.2 | 14.0 | 15.3 | 16.9 | 47,460.4261 | −0.42 | |
| D | −50 | 36.5 | 11.3 | 12.2 | 12.9 | 24,709.3035 | −48.16 |
| −25 | 41.5 | 12.8 | 13.9 | 14.8 | 36,213.3466 | −24.02 | |
| 25 | 47.4 | 14.5 | 15.9 | 16.9 | 59,089.6920 | 23.97 | |
| 50 | 49.2 | 15.0 | 16.6 | 17.6 | 70,507.9911 | 47.93 | |
| MR | −50 | 36.6 | 11.3 | 12.3 | 13.0 | 33,829.5707 | −29.02 |
| −25 | 41.4 | 12.8 | 13.9 | 14.7 | 40,778.3478 | −14.44 | |
| 25 | 47.7 | 14.6 | 16.1 | 17.1 | 54,510.1082 | 14.37 | |
| 50 | 49.9 | 15.2 | 16.8 | 17.9 | 61,333.4027 | 28.68 | |
Table A7.
Sensitivity analysis for raw material holding cost of manufacturer and vendors.
Table A7.
Sensitivity analysis for raw material holding cost of manufacturer and vendors.
| Parameters | % Age Change | Decision Variables | Changed Cost | % Change in the Total Cost | |||
|---|---|---|---|---|---|---|---|
| Q | Qb1 | Qb2 | Qb3 | ||||
| Hr1 | −50 | 46.3 | 14.2 | 15.6 | 16.5 | 47,445.2852 | −0.46 |
| −25 | 45.6 | 14.0 | 15.3 | 16.3 | 47,554.8778 | −0.23 | |
| 25 | 44.3 | 13.6 | 14.9 | 15.8 | 47,769.3626 | 0.22 | |
| 50 | 43.7 | 13.4 | 14.7 | 15.6 | 47,874.3848 | 0.44 | |
| Hr3 | −50 | 46.9 | 14.4 | 15.8 | 16.7 | 47,353.2244 | −0.65 |
| −25 | 45.9 | 14.1 | 15.4 | 16.4 | 47,509.6720 | −0.32 | |
| 25 | 44.1 | 13.5 | 14.8 | 15.7 | 47,813.0454 | 0.32 | |
| 50 | 43.2 | 13.3 | 14.5 | 15.4 | 47,960.3395 | 0.62 | |
| Hr21 | −50 | 45.4 | 13.9 | 15.3 | 16.2 | 47,579.5097 | −0.17 |
| −25 | 45.2 | 13.9 | 15.2 | 16.1 | 47,621.3111 | −0.09 | |
| 25 | 44.7 | 13.7 | 15.0 | 15.9 | 47,704.2239 | 0.09 | |
| 50 | 44.5 | 13.7 | 14.9 | 15.9 | 47,745.3429 | 0.17 | |
| Hr22 | −50 | 45.6 | 14.0 | 15.3 | 16.3 | 47,560.8561 | −0.21 |
| −25 | 45.2 | 13.9 | 15.2 | 16.1 | 47,612.0420 | −0.11 | |
| 25 | 44.6 | 13.7 | 15.0 | 15.9 | 47,713.3807 | 0.11 | |
| 50 | 44.3 | 13.6 | 14.9 | 15.8 | 47,763.5471 | 0.21 | |
| Hr23 | −50 | 45.6 | 14.0 | 15.3 | 16.3 | 47,555.2509 | −0.23 |
| −25 | 45.3 | 13.9 | 15.2 | 16.2 | 47,609.2590 | −0.11 | |
| 25 | 44.6 | 13.7 | 15.0 | 15.9 | 47,716.1255 | 0.11 | |
| 50 | 44.3 | 13.6 | 14.9 | 15.8 | 47,768.9999 | 0.22 | |
The graphical representations of the sensitivity analysis are given below in various figures from Figure A1, Figure A2, Figure A3, Figure A4, Figure A5, Figure A6 and Figure A7.

Figure A1.
Sensitivity analysis graph for holding cost and total cost.
Figure A1.
Sensitivity analysis graph for holding cost and total cost.


Figure A2.
Sensitivity analysis graph for raw material holding cost and total cost.
Figure A2.
Sensitivity analysis graph for raw material holding cost and total cost.


Figure A3.
Sensitivity analysis graph for cost of carbon emission and total cost.
Figure A3.
Sensitivity analysis graph for cost of carbon emission and total cost.


Figure A4.
Sensitivity analysis graph for production rate and total cost.
Figure A4.
Sensitivity analysis graph for production rate and total cost.


Figure A5.
Sensitivity analysis graph for setup cost and total cost.
Figure A5.
Sensitivity analysis graph for setup cost and total cost.


Figure A6.
Sensitivity analysis graph for manufacturing cost and total cost.
Figure A6.
Sensitivity analysis graph for manufacturing cost and total cost.


Figure A7.
Sensitivity analysis graph for inspection cost and total cost.
Figure A7.
Sensitivity analysis graph for inspection cost and total cost.

References
- Jawahir, I.; Bradley, R. Technological elements of circular economy and the principles of 6R-based closed-loop material flow in sustainable manufacturing. Procedia CIRP 2016, 40, 103–108. [Google Scholar] [CrossRef]
- Govindan, K.; Hasanagic, M. A systematic review on drivers, barriers, and practices towards circular economy: A supply chain perspective. Int. J. Prod. Res. 2018, 56, 278–311. [Google Scholar] [CrossRef]
- Bernon, M.; Tjahjono, B.; Ripanti, E. Aligning retail reverse logistics practice with circular economy values: An exploratory framework. Prod. Plan. Control 2018, 29, 483–497. [Google Scholar] [CrossRef]
- Schroeder, P.; Dewick, P.; Kusi-Sarpong, S.; Hofstetter, J. Circular economy and power relations in global value chains: Tensions and trade-offs for lower income countries. Resour. Conserv. Recycl. 2018, 136, 77–78. [Google Scholar] [CrossRef]
- Yang, M.; Smart, P.; Kumar, M.; Jolly, M.; Evans, S. Product-service systems business models for circular supply chains. Prod. Plan. Control 2018, 29, 498–508. [Google Scholar] [CrossRef]
- Agyemang, M.; Kusi-Sarpong, S.; Khan, S.A.; Mani, V.; Rehman, S.T.; Kusi-Sarpong, H. Drivers and barriers to circular economy implementation: An explorative study in Pakistan’s automobile industry. Manag. Decis. 2019, 57, 971–994. [Google Scholar] [CrossRef]
- Fangueiro, R.; Rana, S. Natural Fibres: Advances in Science and Technology towards Industrial Applications; Springer: Berlin/Heidelberg, Germany, 2016. [Google Scholar]
- Joost, W.J. Reducing vehicle weight and improving US energy efficiency using integrated computational materials engineering. JOM 2012, 64, 1032–1038. [Google Scholar] [CrossRef]
- Berman, B. Where’s the Affordable Carbon Fiber Automobile? 2015. Available online: https://www.technologyreview.com/2015/08/10/72629/wheres-the-affordable-carbon-fiber-automobile/ (accessed on 15 April 2022).
- Abubakar, F. An Investigation into the Drivers, Barriers and Policy Implications of Circular Economy Using a Mixed-Mode Research Approach. Ph.D. Thesis, University of Sheffield, Sheffield, UK, 2018. [Google Scholar]
- Stahel, W.R. The business angle of a circular economy–higher competitiveness, higher resource security and material efficiency. New Dyn. Effect. Bus. Circ. Econ. 2013, 1, 11–32. [Google Scholar]
- Mishra, J.L.; Chiwenga, K.D.; Ali, K. Collaboration as an enabler for circular economy: A case study of a developing country. Manag. Decis. 2019, 59, 1784–1800. [Google Scholar] [CrossRef]
- Ghisellini, P.; Cialani, C.; Ulgiati, S. A review on circular economy: The expected transition to a balanced interplay of environmental and economic systems. J. Clean. Prod. 2016, 114, 11–32. [Google Scholar] [CrossRef]
- Merli, R.; Preziosi, M.; Acampora, A. How do scholars approach the circular economy? A systematic literature review. J. Clean. Prod. 2018, 178, 703–722. [Google Scholar] [CrossRef]
- Zucchella, A.; Previtali, P. Circular business models for sustainable development: A “waste is food” restorative ecosystem. Bus. Strat. Environ. 2019, 28, 274–285. [Google Scholar] [CrossRef]
- Urbinati, A.; Chiaroni, D.; Chiesa, V. Towards a new taxonomy of circular economy business models. J. Clean. Prod. 2017, 168, 487–498. [Google Scholar] [CrossRef]
- MacArthur, E. Towards the circular economy. J. Ind. Ecol. 2013, 2, 23–44. [Google Scholar]
- Ünal, E.; Shao, J. A taxonomy of circular economy implementation strategies for manufacturing firms: Analysis of 391 cradle-to-cradle products. J. Clean. Prod. 2019, 212, 754–765. [Google Scholar] [CrossRef]
- Schulz, M.; Bey, N.; Niero, M.; Hauschild, M. Circular economy considerations in choices of LCA methodology: How to handle EV battery repurposing? Procedia CIRP 2020, 90, 182–186. [Google Scholar] [CrossRef]
- Lewandowski, M. Designing the business models for circular economy—Towards the conceptual framework. Sustainability 2016, 8, 43. [Google Scholar] [CrossRef]
- Chuang, C.H.; Chiang, C.Y. Dynamic and stochastic behavior of coefficient of demand uncertainty incorporated with EOQ variables: An application in finished-goods inventory from General Motors’ dealerships. Int. J. Prod. Econ. 2016, 172, 95–109. [Google Scholar] [CrossRef]
- Liao, H.; Deng, Q.; Wang, Y. Optimal acquisition and production policy for end-of-life engineering machinery recovering in a joint manufacturing/remanufacturing system under uncertainties in procurement and demand. Sustainability 2017, 9, 338. [Google Scholar] [CrossRef]
- Rossi, E.; Bertassini, A.C.; dos Santos Ferreira, C.; do Amaral, W.A.N.; Ometto, A.R. Circular economy indicators for organizations considering sustainability and business models: Plastic, textile and electro-electronic cases. J. Clean. Prod. 2020, 247, 119137. [Google Scholar] [CrossRef]
- Taleizadeh, A.A.; Alizadeh-Basban, N.; Niaki, S.T.A. A closed-loop supply chain considering carbon reduction, quality improvement effort, and return policy under two remanufacturing scenarios. J. Clean. Prod. 2019, 232, 1230–1250. [Google Scholar] [CrossRef]
- Ke, H.; Wu, Y.; Huang, H. Competitive pricing and remanufacturing problem in an uncertain closed-loop supply chain with risk-sensitive retailers. Asia-Pac. J. Oper. Res. 2018, 35, 1850003. [Google Scholar] [CrossRef]
- Okorie, O.; Turner, C.; Salonitis, K.; Charnley, F.; Moreno, M.; Tiwari, A.; Hutabarat, W. A decision-making framework for the implementation of remanufacturing in rechargeable energy storage system in hybrid and electric vehicles. Procedia Manuf. 2018, 25, 142–153. [Google Scholar] [CrossRef]
- Alinovi, A.; Bottani, E.; Montanari, R. Reverse logistics: A stochastic EOQ-based inventory control model for mixed manufacturing/remanufacturing systems with return policies. Int. J. Prod. Res. 2012, 50, 1243–1264. [Google Scholar] [CrossRef]
- Chung, C.-J.; Wee, H.-M. Short life-cycle deteriorating product remanufacturing in a green supply chain inventory control system. Int. J. Prod. Econ. 2011, 129, 195–203. [Google Scholar] [CrossRef]
- Ray, J.; Chaudhuri, K.S. An EOQ model with stock-dependent demand, shortage, inflation and time discounting. Int. J. Prod. Econ. 1997, 53, 171–180. [Google Scholar] [CrossRef]
- Ahmed, W.; Jalees, M.; Omair, M.; Mukhtar, Z.; Imran, M. An inventory management for global supply chain through reworking of defective items having positive inventory level under multi-trade-credit-period. Ann. Oper. Res. 2022, 315, 1–28. [Google Scholar] [CrossRef]
- Guide, V.D.R., Jr. Production planning and control for remanufacturing: Industry practice and research needs. J. Oper. Manag. 2000, 18, 467–483. [Google Scholar] [CrossRef]
- Kim, K.; Song, I.; Kim, J.; Jeong, B. Supply planning model for remanufacturing system in reverse logistics environment. Comput. Ind. Eng. 2006, 51, 279–287. [Google Scholar] [CrossRef]
- Kin, S.T.M.; Ong, S.K.; Nee, A. Remanufacturing process planning. Procedia CIRP 2014, 15, 189–194. [Google Scholar] [CrossRef]
- Bag, S.; Gupta, S. Examining the effect of green human capital availability in adoption of reverse logistics and remanufacturing operations performance. Int. J. Manpow. 2019, 41, 1097–1117. [Google Scholar] [CrossRef]
- Sarkar, B.; Omair, M.; Choi, S.B. A multi-objective optimization of energy, economic, and carbon emission in a production model under sustainable supply chain management. Appl. Sci. 2018, 8, 1744. [Google Scholar] [CrossRef]
- Omair, M.; Ullah, M.; Ganguly, B.; Noor, S.; Maqsood, S.; Sarkar, B. The quantitative analysis of workers’ stress due to working environment in the production system of the automobile part manufacturing industry. Mathematics 2019, 7, 627. [Google Scholar] [CrossRef]
- Khalid, Q.S.; Arshad, M.; Maqsood, S.; Jahanzaib, M.; Babar, A.R.; Khan, I.; Mumtaz, J.; Kim, S. Hybrid particle swarm algorithm for products’ scheduling problem in cellular manufacturing system. Symmetry 2019, 11, 729. [Google Scholar] [CrossRef]
- Khalid, Q.S.; Azim, S.; Abas, M.; Babar, A.R.; Ahmad, I. Modified particle swarm algorithm for scheduling agricultural products. Eng. Sci. Technol. Int. J. 2021, 24, 818–828. [Google Scholar] [CrossRef]
- Bag, S.; Dhamija, P.; Gupta, S.; Sivarajah, U. Examining the role of procurement 4.0 towards remanufacturing operations and circular economy. Prod. Plan. Control 2021, 32, 1368–1383. [Google Scholar] [CrossRef]
- Aljuneidi, T.; Bulgak, A.A. A mathematical model for designing reconfigurable cellular hybrid manufacturing-remanufacturing systems. Int. J. Adv. Manuf. Technol. 2016, 87, 1585–1596. [Google Scholar] [CrossRef]
- Aydin, R.; Kwong, C.K.; Geda, M.W.; Kremer, G.E.O. Determining the optimal quantity and quality levels of used product returns for remanufacturing under multi-period and uncertain quality of returns. Int. J. Adv. Manuf. Technol. 2018, 94, 4401–4414. [Google Scholar] [CrossRef]
- Dobbs, C.; Escobedo, F.J.; Zipperer, W.C. A framework for developing urban forest ecosystem services and goods indicators. Landsc. Urban Plan. 2011, 99, 196–206. [Google Scholar] [CrossRef]
- Sellitto, M.A.; de Almeida, F.A. Strategies for value recovery from industrial waste: Case studies of six industries from Brazil. Benchmark. Int. J. 2019, 27, 867–885. [Google Scholar] [CrossRef]
- Bicket, M.; Vanner, R. Designing policy mixes for resource efficiency: The role of public acceptability. Sustainability 2016, 8, 366. [Google Scholar] [CrossRef]
- Agrawal, V.V.; Atasu, A.; van Ittersum, K. Remanufacturing, third-party competition, and consumers’ perceived value of new products. Manag. Sci. 2015, 61, 60–72. [Google Scholar] [CrossRef]
- Barnes, J.H., Jr. Recycling: A problem in reverse logistics. J. Macromark. 1982, 2, 31–37. [Google Scholar] [CrossRef]
- Thierry, M.; Salomon, M.; Van Nunen, J.; Van Wassenhove, L. Strategic issues in product recovery management. Calif. Manag. Rev. 1995, 37, 114–136. [Google Scholar] [CrossRef]
- Östlin, J.; Sundin, E.; Björkman, M. Product life-cycle implications for remanufacturing strategies. J. Clean. Prod. 2009, 17, 999–1009. [Google Scholar] [CrossRef]
- Hammer, A.B.; Jones, L. China’s Dominance as a Global Consumer and Producer of Copper. 2012. Available online: https://ssrn.com/abstract=3370573 (accessed on 5 May 2022).
- Tan, Q.; Zeng, X.; Ijomah, W.L.; Zheng, L.; Li, J. Status of end-of-life electronic product remanufacturing in China. J. Ind. Ecol. 2014, 18, 577–587. [Google Scholar] [CrossRef]
- Filho, J. Opportunities for Aluminium Components in Automotive Applications. 2016. Available online: http://www.charles-hatchett.com/public/images/documents/2016/2016-CHA-Seminar-Presentation (accessed on 5 May 2022).
- Skszek, T.W.; Zaluzec, M.; Conklin, J.; Wagner, D.A. MMLV: Project overview. SAE Technical Paper. 2015. Available online: https://www.sae.org/publications/technical-papers/content/2015-01-0407/ (accessed on 5 May 2022).
- Elgowainy, A.; Han, J.; Ward, J.; Joseck, F.; Gohlke, D.; Lindauer, A.; Ramsden, T.; Biddy, M.J.; Alexander, M.; Barnhart, S.; et al. Current and future United States light-duty vehicle pathways: Cradle-to-grave lifecycle greenhouse gas emissions and economic assessment. Environ. Sci. Technol. 2018, 52, 2392–2399. [Google Scholar] [CrossRef]
- Keoleian, G.A.; Sullivan, J.L. Materials challenges and opportunities for enhancing the sustainability of automobiles. MRS Bull. 2012, 37, 365–373. [Google Scholar] [CrossRef]
- Burinskienė, A. Designing a Multi-Stage Transport System Serving e-Commerce Activity. Sustainability 2021, 13, 6154. [Google Scholar] [CrossRef]
- Ahmadini, A.A.H.; Modibbo, U.M.; Shaikh, A.A.; Ali, I. Multi-objective optimization modelling of sustainable green supply chain in inventory and production management. Alex. Eng. J. 2021, 60, 5129–5146. [Google Scholar] [CrossRef]
- Rajak, S.; Vimal, K.E.K.; Arumugam, S.; Parthiban, J.; Sivaraman, S.K.; Kandasamy, J.; Duque, A.A. Multi-objective mixed-integer linear optimization model for sustainable closed-loop supply chain network: A case study on remanufacturing steering column. Environ. Dev. Sustain. 2022, 24, 6481–6507. [Google Scholar] [CrossRef]
- Modibbo, U.M.; Gupta, S.; Ahmed, A.; Ali, I. An integrated multi-objective multi-product inventory managed production planning problem under uncertain environment. Ann. Oper. Res. 2022, 1–45. [Google Scholar] [CrossRef]
- Becerra, P.; Mula, J.; Sanchis, R. Sustainable Inventory Management in Supply Chains: Trends and Further Research. Sustainability 2022, 14, 2613. [Google Scholar] [CrossRef]
- Barma, M.; Modibbo, U.M. Multiobjective mathematical optimization model for municipal solid waste management with economic analysis of reuse/recycling recovered waste materials. J. Comput. Cogn. Eng. 2022, 1. [Google Scholar] [CrossRef]
- Longana, M.L.; Ong, N.; Yu, H.; Potter, K.D. Multiple closed loop recycling of carbon fibre composites with the HiPerDiF (High Performance Discontinuous Fibre) method. Compos. Struct. 2016, 153, 271–277. [Google Scholar] [CrossRef]
- Hagnell, M.; Åkermo, M. The economic and mechanical potential of closed loop material usage and recycling of fibre-reinforced composite materials. J. Clean. Prod. 2019, 223, 957–968. [Google Scholar] [CrossRef]
- CompositesWorld. Recycled Carbon Fiber Update: Closing the CFRP Lifecycle Loop. 2014. Available online: https://www.compositesworld.com/articles/recycled-carbon-fiber-update-closing-the-cfrp-lifecycle-loop (accessed on 15 April 2022).
- CompositesWorld. Supply and Demand: Advanced Fibers. 2016. Available online: https://www.compositesworld.com/articles/supply-and-demand-advanced-fibers (accessed on 15 April 2022).
- Alkahtani, M.; Omair, M.; Khalid, Q.S.; Hussain, G.; Sarkar, B. An agricultural products supply chain management to optimize resources and carbon emission considering variable production rate: Case of nonperishable corps. Processes 2020, 8, 1505. [Google Scholar] [CrossRef]
- Alkahtani, M.; Khalid, Q.S.; Jalees, M.; Omair, M.; Hussain, G.; Pruncu, C.I. E-agricultural supply chain management coupled with blockchain effect and cooperative strategies. Sustainability 2021, 13, 816. [Google Scholar] [CrossRef]
- Sarkar, B.; Cárdenas-Barrón, L.E.; Sarkar, M.; Singgih, M.L. An economic production quantity model with random defective rate, rework process and backorders for a single stage production system. J. Manuf. Syst. 2014, 33, 423–435. [Google Scholar] [CrossRef]
- Sarkar, B. Supply chain coordination with variable backorder, inspections, and discount policy for fixed lifetime products. Math. Probl. Eng. 2016, 2016, 6318737. [Google Scholar] [CrossRef]
- Omair, M.; Sarkar, B.; Cárdenas-Barrón, L.E. Minimum quantity lubrication and carbon footprint: A step towards sustainability. Sustainability 2017, 9, 714. [Google Scholar] [CrossRef]
- Birgin, E.G.; Haeser, G.; Ramos, A. Augmented Lagrangians with constrained subproblems and convergence to second-order stationary points. Comput. Optim. Appl. 2018, 69, 51–75. [Google Scholar] [CrossRef]
- Mostafa, N.; Khajavi, M. Optimization of welding parameters for weld penetration in FCAW. J. Achiev. Mater. Manuf. Eng. 2006, 16, 132–138. [Google Scholar]
- Schittkowski, K. NLPQL: A FORTRAN subroutine solving constrained nonlinear programming problems. Ann. Oper. Res. 1986, 5, 485–500. [Google Scholar] [CrossRef]


Publisher’s Note: MDPI stays neutral with regard to jurisdictional claims in published maps and institutional affiliations. |
© 2022 by the authors. Licensee MDPI, Basel, Switzerland. This article is an open access article distributed under the terms and conditions of the Creative Commons Attribution (CC BY) license (https://creativecommons.org/licenses/by/4.0/).