Article

Soil Microbial Communities in Desert Grassland around Rare Earth Mine: Diversity, Variation, and Response Patterns

1
College of Life and Environmental Sciences, Minzu University of China, Beijing 100081, China
2
College of Resources and Environmental Economics, Inner Mongolia University of Finance and Economics, Hohhot 010070, China
3
CAS Key Laboratory for Environmental Biotechnology, Research Center for Eco-Environmental Sciences, Chinese Academy of Sciences (CAS), Beijing 100085, China
4
College of Resources and Environment, Baotou Normal College, Inner Mongolia University of Science & Technology, Baotou 014030, China
5
Resource Utilization and Environmental Protection Coordinated Development Academician Expert Workstation in the North of China, Inner Mongolia University of Finance and Economics, Hohhot 010070, China
*
Authors to whom correspondence should be addressed.
Sustainability 2022, 14(23), 15629; https://doi.org/10.3390/su142315629
Submission received: 11 October 2022 / Revised: 8 November 2022 / Accepted: 11 November 2022 / Published: 24 November 2022
(This article belongs to the Special Issue Biodiversity Conservation and Environmental Sustainability)

Abstract

:
Bayan Obo mine is so far the world’s largest rare earth mine. Critical concerns arise as (1) whether there is an accumulation of exogenous rare earth elements (REE) in the desert steppe on the periphery of the mine and (2) how the exogenous rare earth accumulation affects the soil microbial communities nearby. In this study, nine sample sites were set up according to their distance gradients from the mine. Illumina high-throughput sequencing targeting 16S rRNA genes were conducted. The results show that the accumulation of exogenous rare earth in the desert at the periphery of the Bayan Obo mine vary at distance gradients. Fortunately, no significant effects on the physicochemical properties of the soil were found. However, the composition of the soil microbial community changed significantly in response to the variation in distance gradient. Highly abundant microbial genera YC-ZSS-LKJ147, Subgroup_10, and Sphingomonas were positively correlated with REE, whereas Pseudomonas is negative correlated. Total phosphorus (TP) was attributed to 5.95% of the variation in microbial communities, followed by light rare earth elements (LREE, 5.39%). The study provides evidence for the ecological risks posed to soil ecosystems by the long-term accumulation of exogenous REE in the Bayan Obo mine.

1. Introduction

Rare earth elements (REEs) are a group of chemical elements with similar properties, including the lanthanides (57–71), Sc (21), and Y (39) [1]. In recent years, REEs have gained wide attention as important strategic resources. They are now widely used in high-tech industries as essential raw ingredients for many electronic products, new energy devices, medical devices, and military equipment [2,3]. The global trend towards high-tech development and clean energy has led to a surge in demand for REEs, which has stimulated a sharp rise in their production worldwide. It was reported that relevant industrial output increased by more than 4 times, from 64,500 tons of rare earth oxide (REO) equivalent in 1994 to 280,000 tons of REO equivalent in 2021 [4], and among more than 90% were contributed by China [5].
The huge production has caused severe soil contamination in the rare earth mining sites and their peripheral regions [6,7]. The total concentration of REE has reached 18,891.81 mg/kg in soil of the Bayan Obo mining area [8]. REEs (lanthanum, cerium, and yttrium) can potentially inhibit seed germination and reduce biomass of crops [9], and lanthanum negatively impacts the survival, reproduction, and enzyme activity of soil invertebrates [10,11]. Human REE exposure is associated with respiratory diseases [12] and bioaccumulation in hair, blood [13], and the urinary tract [14]. These results suggest that REEs would potentially endanger soil ecosystems in the surroundings, and eventually damage human health through the associated food web [15,16].
Soil microbes participate in the decomposition of organic matter, the synthesis of humus, the transformation and recirculation of soil nutrients, and the maintenance of the material cycles and energy flows in the ecosystem [17,18]. Therefore, the composition and diversity of the microbial community are important for the conservation and restoration of the stability of soil ecological functions. Soil microbiota respond rapidly to soil environmental changes [19]. Numerous studies have confirmed that soil microbial communities exhibit significant responses to soil pollution, including heavy metals [20], oil [21], and other organic matter pollution [22]. Nevertheless, little attention has been paid to the ecological effects of REEs on soil microbiota [23].
As the world’s largest rare earth mine [24], after more than 60 years of operation, there is a large amount of exogenous rare earth accumulation in the soil of Bayan Obo mining area and its surroundings [8,25]. Many previous studies have focused solely on the rare earth mine, as it is the source of contamination [7,8,26]. However, contamination due to wind transport over longer distances does occur in a wider area on the periphery of the mine, which was rarely discussed in the past [27,28]. It remains unclear whether the accumulations of REEs in these downwind soil ecosystems have any negative impacts on the microbial community as well as the extents of these impacts. In this study, soil samples were collected along a distance gradient in a desert grassland on the periphery of the Bayan Obo mine. The microbial communities were analyzed to determine (1) the variation pattern of soil microbial diversity in REE polluted grassland and (2) the relevant drivers for the community variations.

2. Materials and Methods

2.1. Study Area

Bayan Obo deposit consists of the Main Ore Body, the East Ore Body, and the West Ore Body. It mainly produces light rare earths, with open-pit mining as employed [24]. The study area is located in Damao desert steppe near the Bayan ore bodies, at the southern part of the Mongolian Plateau and on the northside of Yin Mountain (Figure 1). The total site area is about 328.64 km2 [8]. The study area is in a temperate continental climate zone, with dry and windy springs, short summers with concentrated precipitation, cool autumns with long sunshine, and long and cold winters. The average annual temperature is 2.5–3.3 °C. The average annual precipitation is 220–256 mm, mainly happening in July and August. The annual evaporation is 2100–2700 mm, which is significantly higher than the precipitation. The northwest wind prevails in this area all year round, in a way leading to a drier climate [29].

2.2. Setting up Sampling Sites and Collection of Soil Samples

The field survey was conducted from August 3–5, 2020. Starting from the edge of the mining area, a total of nine sampling sites were set up in the southeast region (downwind from the mine), thus establishing a distance gradient from the mining area. The distance between sample sites was generally greater than 1 km. However, due to limitations stemming from complicated conditions in the field, the distance between sampling sites varied. A total of four sampling plots were established within each site.
Soil samples 0–20 cm deep were collected using the plum-blossom pile sampling method. The collected soil samples were thoroughly mixed on a plastic tablecloth and then 1 kg soils were collected by the quartering method. A total of 36 soil sample squares to be tested were collected (9 sites × 4 sampling plots). The samples were divided into two parts and stored in plastic bags until use. One aliquot was stored at ambient temperature for soil physicochemical property measurements, and it was transported to the laboratory for immediate processing. Another aliquot was stored in a −18 °C foam freezer for microbial sequencing, and it was transported to the laboratory and stored in a −40 °C freezer until use.

2.3. Investigation of Plants

The vegetation community characteristics of each plot, such as vegetation coverage and plant species, were calculated. Subsequently, the dry weight of aboveground biomass was determined. Specifically, the investigation method was as follows: a 1 m × 1 m herb sample plot was selected per plot, and a total of 36 plots (9 sites × 4 herbaceous plots) were arranged to estimate the coverage and species of herbaceous plants. Herb samples in each plot were collected and brought to the laboratory to measure the dry weight of the aboveground biomass of herbs via drying method (75 °C). Vegetation community characteristics of the studied sites are shown in Table 1.

2.4. Soil Physical and Chemical Properties

Soil samples were air-dried, pulverized, ground in an agate bowl, and then passed through a 120-mesh nylon sieve. All samples were tested in the Resource and Environment Testing Laboratory of Inner Mongolia University of Finance and Economics. Standard soil analytical methods were used for the soil physical and chemical analyses [30]. Soil pH and electrical conductivity were determined with a soil-to-water ratio of 1:2.5 (w/v), using a pH-3C meter (Rex Electric chemical Instruments, Beijing, China) and an electrical conductivity meter (DDS-11A, Rex Electric chemical Instruments, Beijing, China), respectively. Water content (WC) was analyzed by weighing soil mass after oven-drying at 105 °C until stable (24 h). Soil texture (SI) was measured using the hydrometer method (percent of soil fragments < 0.02 mm). Total nitrogen (TN) was determined by an element analyzer (Vario EL Cube, Elementar, Germany). Total organic carbon (OC) was determined by the potassium dichromate volumetric method. After four-acid digestion (HNO3/HCLO4/HF/HCL), total phosphorus (TP) and metals in soil, including Cu, Pb, Zn, and Cr, were determined by inductively coupled plasma-mass spectrometry (ICP-Plasma Perkin Elmer Plasma Elan5000). Soil physical and chemical properties are shown in Table 1.
The concentrations of REEs in soil was determined by inductively coupled plasma mass spectrometry ICP-MS (ICP-Plasma Perkin Elmer Plasma Elan5000). Rare earth standard solution was prepared in advance. Specifically, the single rare earth oxide was calcined at 850 °C and then weighed for 0.1000 g (accuracy > 99.99%). The sample was placed in a 150 mL beaker, with 15 mL of HNO3 added and then heated at low temperature to dissolve completely. The 1 mg/mL rare earth standard solution was cooled to room temperature. Each rare earth standard solution was diluted to 1 μg/mL when being used.
To measure the sample, 0.3 g of the tested sample was weighed and placed in a nickel crucible. Subsequently, 2 g of NaOH and 2 g of Na2O2 were added. The mixture was then heated to 750 °C and melted for 10 min. After the cooling, the sample was extracted with 100 mL of hot water, and then 25 mL of concentrated HCl until the solution was clear after heating. It was thereafter transferred into a 200 mL volumetric flask and diluted with DI water to the mark. The well-mixed solution was then characterized by plasma mass spectrometry.

2.5. Microbial DNA Extraction, Amplification, and Sequencing

Microbial total genome DNA was extracted from soils using the CTAB method [31]. DNA purity and concentration were checked with 1% agarose gels. According to the concentration, DNA was finally diluted to 1 ng/µL using sterile water before PCR amplification.
Soil bacterial community was studied by amplifying the 16 S rRNA gene V4 region, using the specific primer pair 515F/806R with the barcodes. PCR reaction was carried out in a 30 µL mixture of 15 µL 2×Phusion High-Fidelity PCR Master Mix, 3 µL of 2-µM forward and reverse primers, and about 10 ng template DNA. Meanwhile, the system was continually replenished with PCR grade water. Thermal cycling started with initial denaturation at 98 °C for 1 min, followed by 30 cycles of denaturation at 98 °C for 10 s, annealing at 50 °C for 30 s, and elongation at 72 °C for 30 s. Finally, the process was terminated with 72 °C for 5 min for final extension.
PCR products were tested using electrophoresis on 2% agarose gel and cleaned with GeneJET Gel Extraction Kit (Thermo Scientific, MA, USA). Sequencing libraries were generated using TruSeq DNA PCR-Free Sample Preparation Kit (Illumina, San Diego, USA) following manufacturer’s recommendations and index codes. The library was purified with Qiagen Gel Extraction Kit (Qiagen, Germany) and quality was assessed on the Qubit 2.0 Fluorometer (Thermo Scientific). Finally, the library was sequenced on Illumina NovaSeq platform and 250 bp paired-end readings were generated.

2.6. Bioinformatics Analyses

Paired-end readings were assigned to samples based on their unique barcode and truncated by cutting off the barcode and primer sequence. Then, they were merged using FLASH (V1.2.7, http://ccb.jhu.edu/software/FLASH accessed on 29 November 2016) [32]. High-quality clean tags were obtained on QIIME (V1.9.1, http://qiime.org/scripts/split_libraries_fastq.html, accessed on 27 May 2015) [33]. Chimera sequences were removed by comparing tags to the reference database (Silva database, https://www.arb-silva.de, accessed in December 2019) using UCHIME algorithm (UCHIME, http://www.drive5.com/usearch/manual/uchimealgo.html, accessed in September 2021) [34]. Sequences with ≥ 97% similarity were assigned to the same OTUs by Uparse software (Uparse v7.0.1001, http://drive5.com/uparse, accessed in September 2021) [35]. For each representative sequence, the Silva Database (http://www.arb-silva.de/ accessed in December 2019) [36] was used based on Mothur algorithm to annotate taxonomic information. OTUs abundance information were normalized using a standard of sequence number corresponding to the sample with the least sequences. Subsequent analysis of alpha diversity and beta diversity were all performed based on this output normalized data.

2.7. Statistic Analyses

The statistical significances in soil physical and chemical properties were analyzed by one-way ANOVA based on SPSS Statistics 21. Principal component analysis (PCA) was used to present the environmental differences between sampling sites. Alpha diversity (including Chao1, ACE, Shannon, and Simpson indexes) was applied for analyzing complexity of species and quantitative differences. The significance of each index between sites was estimated by one-way ANOVA. Non-metric multidimensional scale (NMDS), Pearson correlation analysis, and variogram partitioning analysis (VPA) were conducted based on R package “Vegen” (4.1.0).

3. Results

3.1. REE, Soil Properties and Plant Communities

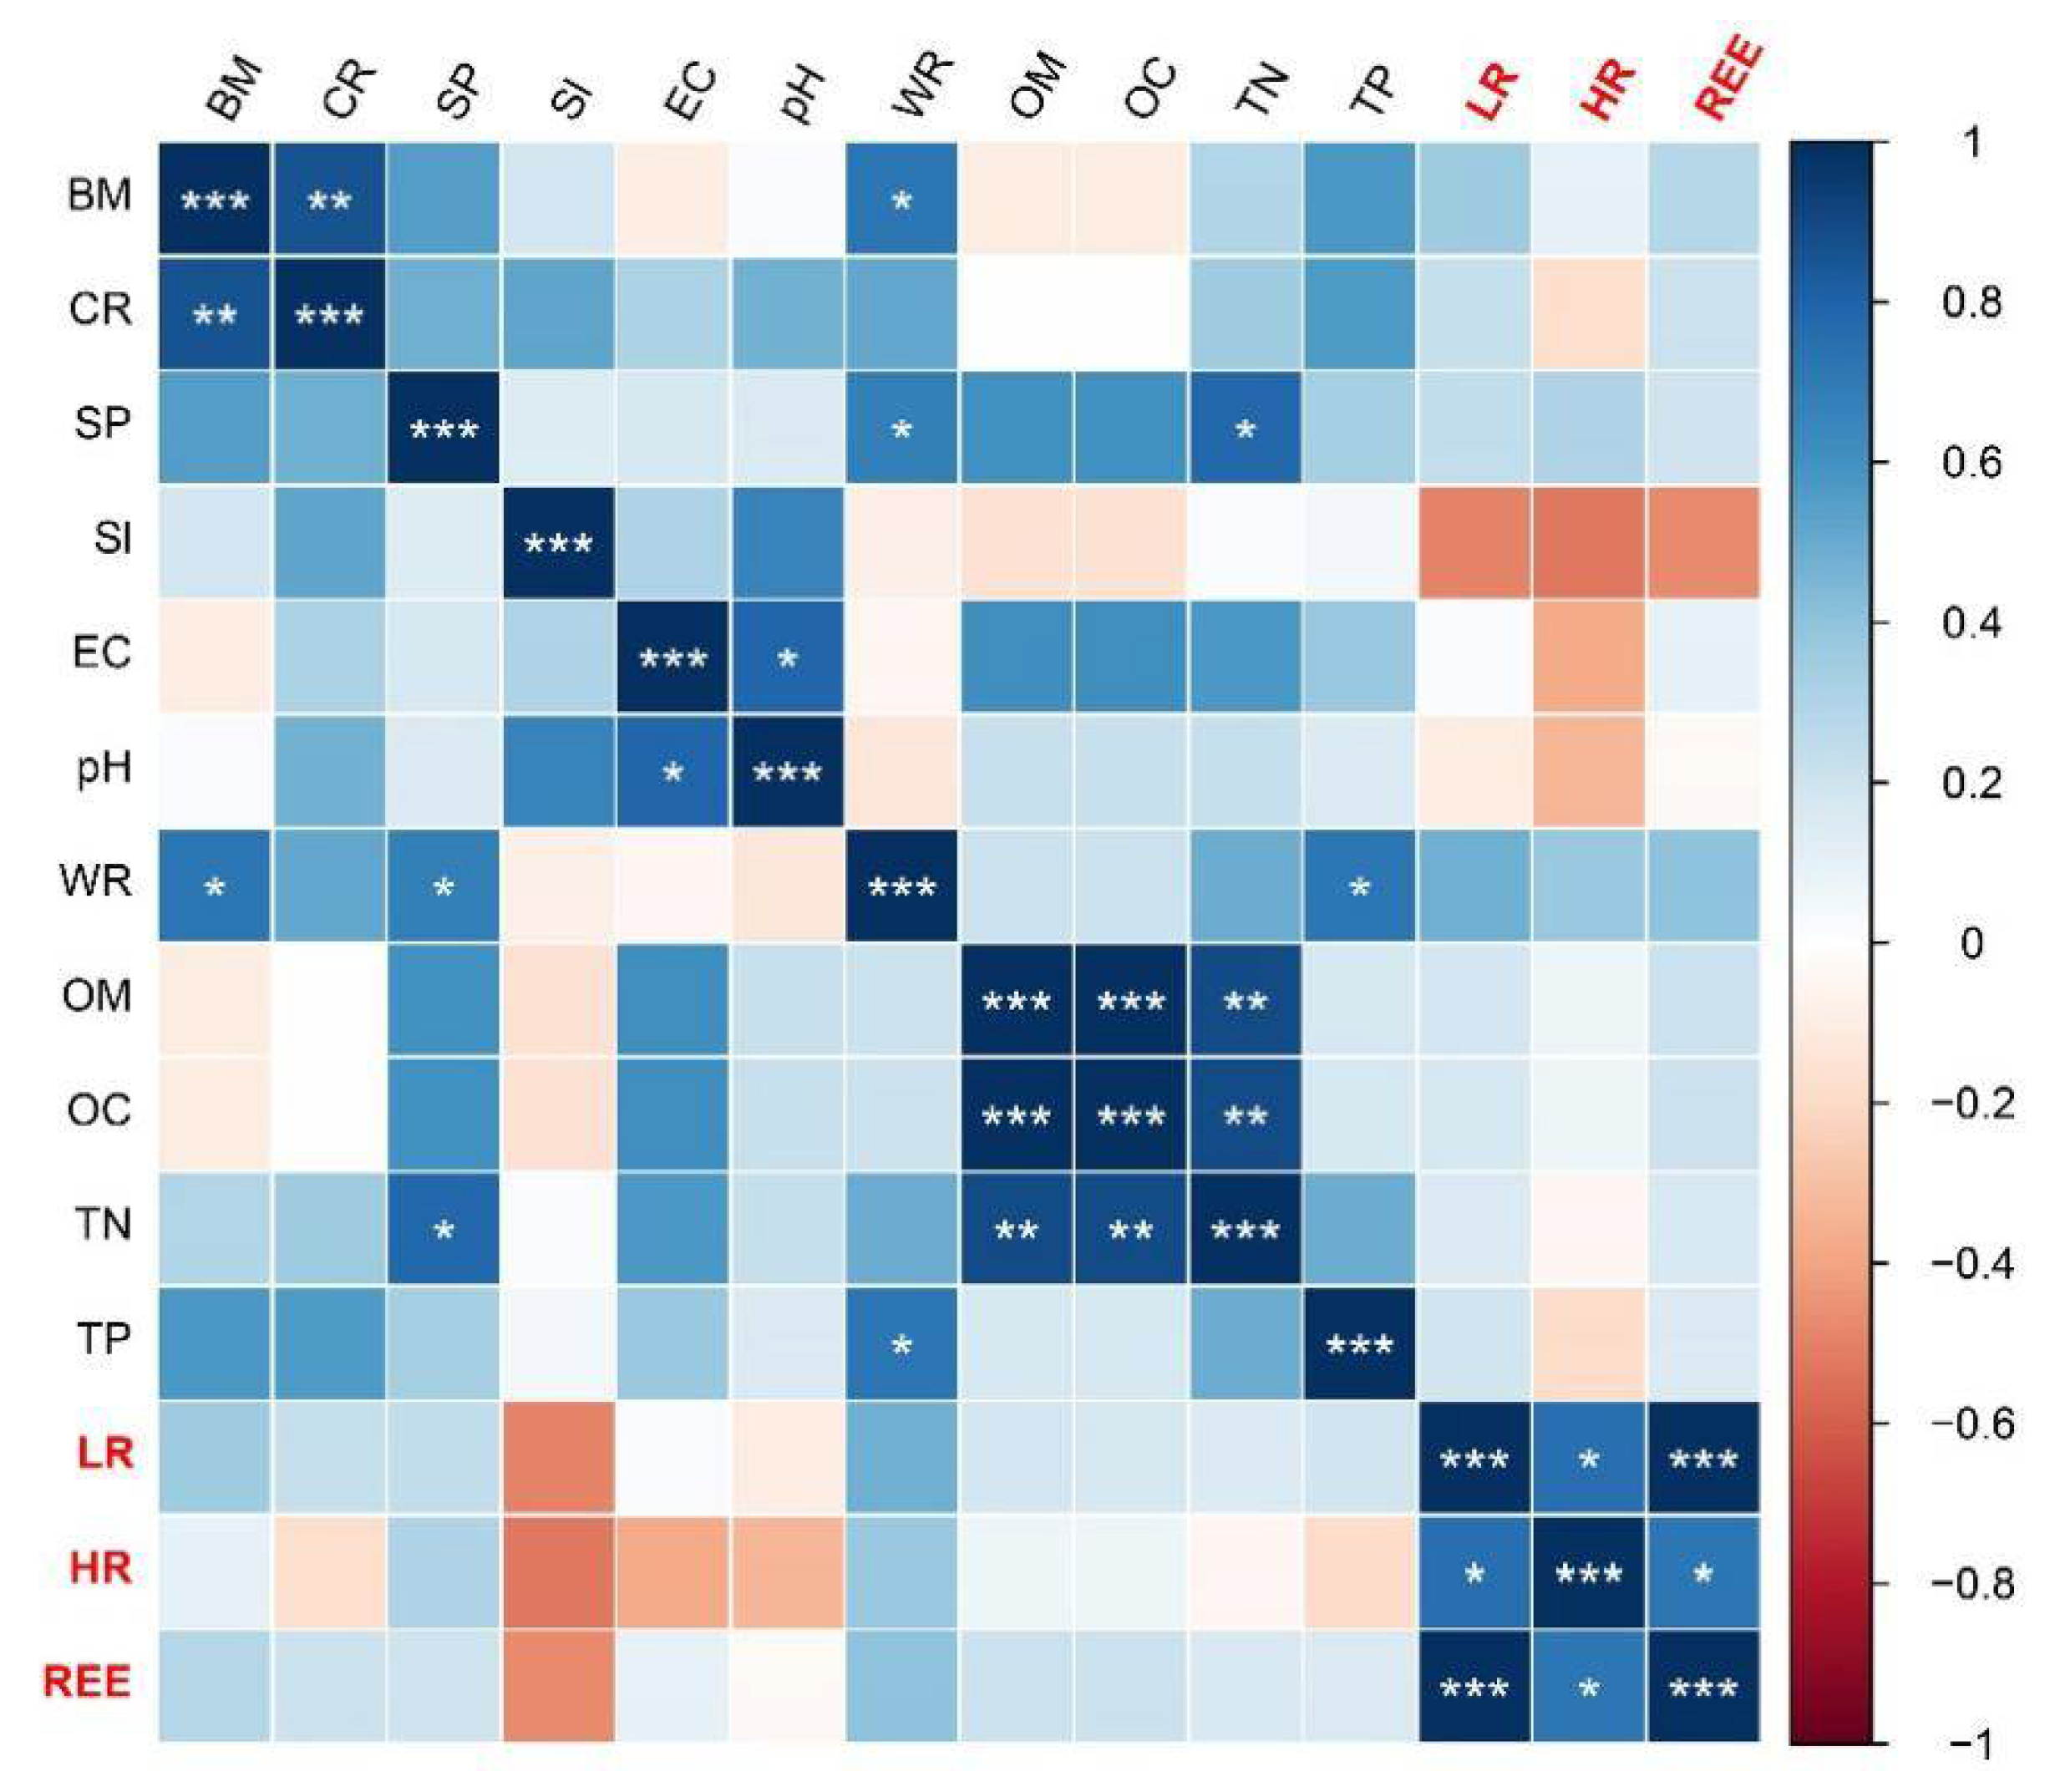
The concentration of total REEs, light rare earth elements (LREEs), and heavy rare earth elements (HREEs) were characterized to be 217.05–1064.97 μg/g, 199.67–1028.37 μg/g, and 10.17–36.6 μg/g, respectively (Table 1). The concentrations of REEs, LREEs, and HREEs decreased along the descending distance gradients from S1 to S9, with the highest value found in S1 and the lowest value found in S9. Similarly, total phosphorus (TP) demonstrated similar trends. In contrast, soil pH (7.95–8.75) and electrical conductivity (EC) (28.37–71.67 ms/m) generally increased from S1 to S9. Other soil physicochemical properties did not show consistent patterns along the descending distance gradients. For example, the moisture content (WR) was significantly higher in S1 and S2. The soil texture (SI) was higher in S1 but decreased in S3~S6. The soil nutrients including total organic matter (TOM), total organic carbon (TOC) and total nitrogen (TN) showed little variations between sites. No significant correlation was found between REE concentrations and other soil physical and chemical properties (Figure 2).
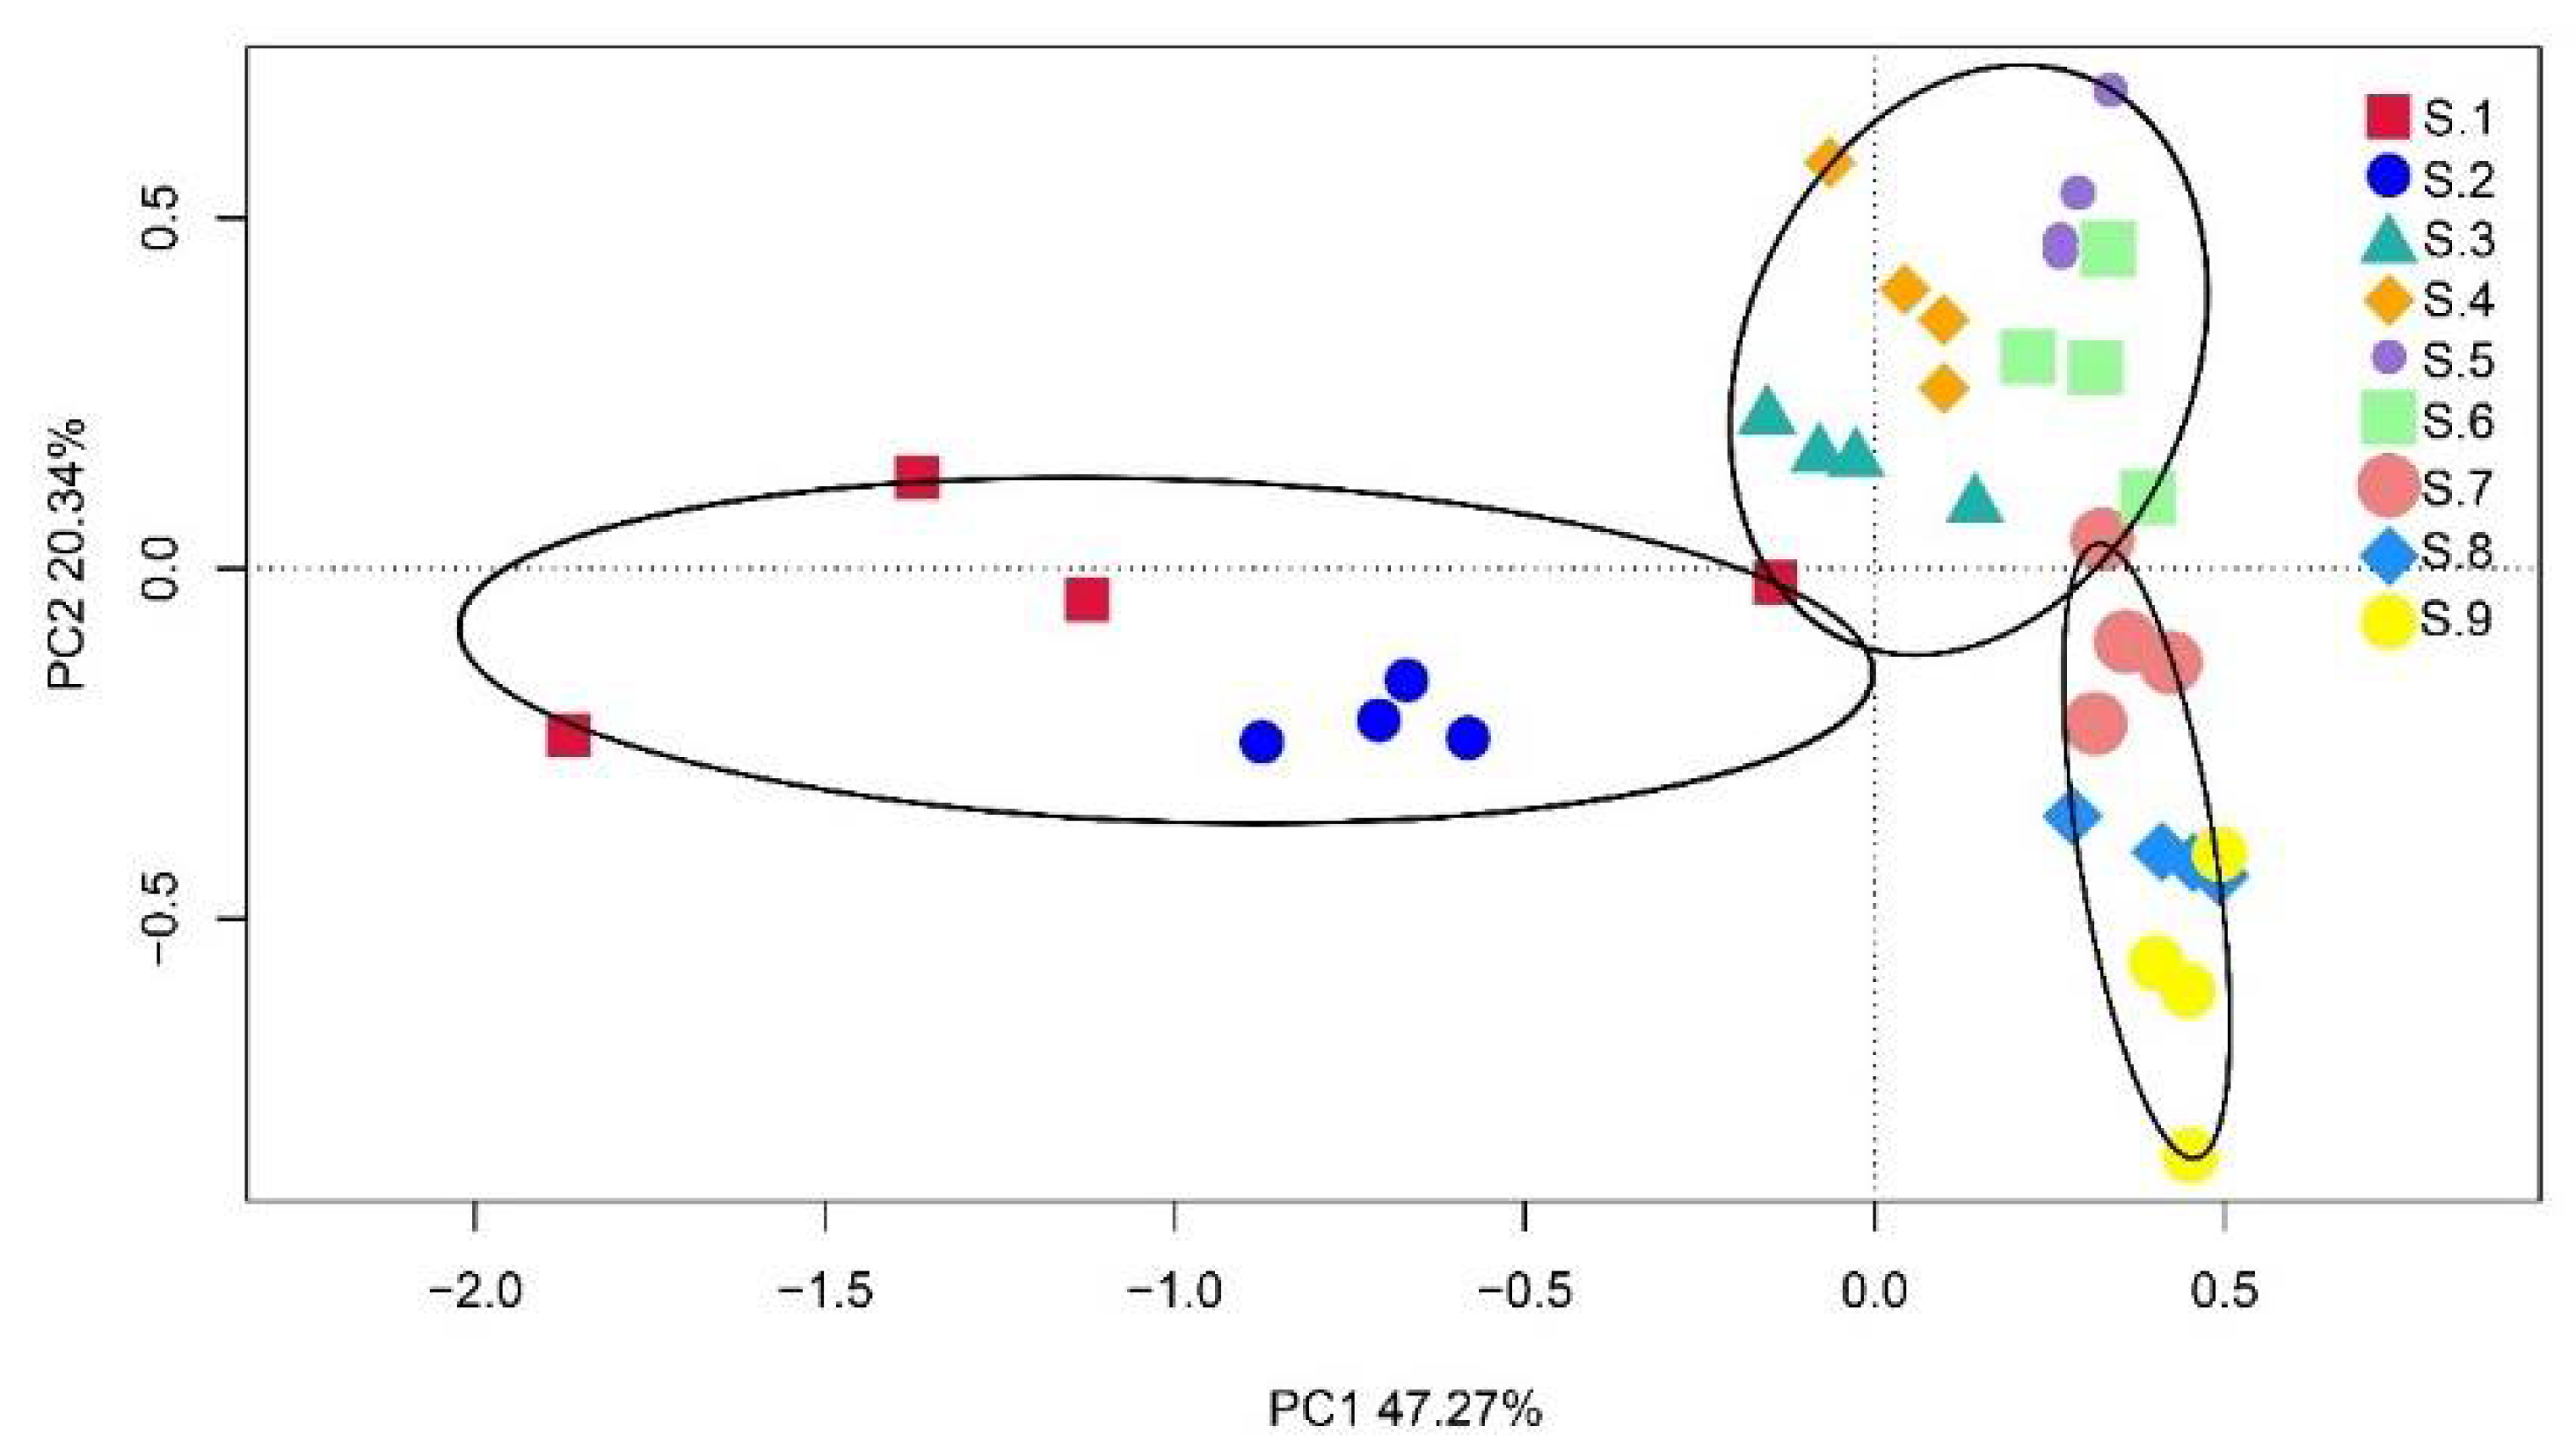
Stipa krylovii roshev, Stipa breviflora, and Stipa klement were dominant species in the desert steppe. From S1 to S9, the plant biomass (BM), vegetation coverage (CR), and the number of plant species (SP) first decreased, then increased (Table 1). BM and SP were positively correlated with soil moisture content (WR) with high significance but did not show any correlation with REE concentrations (Figure 2). According to the PCA and cluster analysis (Figure 3), the sampling sites could generally be divided into three plots, i.e., area I, which were those in close proximity to the mine area (S1 and S2), area II, which were those in the middle range of proximity (S3, S4, S5, and S6), and area III, which were those distant from the mine area (S7, S8, and S9).

3.2. Diversity of Soil Microbial Communities

3.2.1. Alpha Diversity

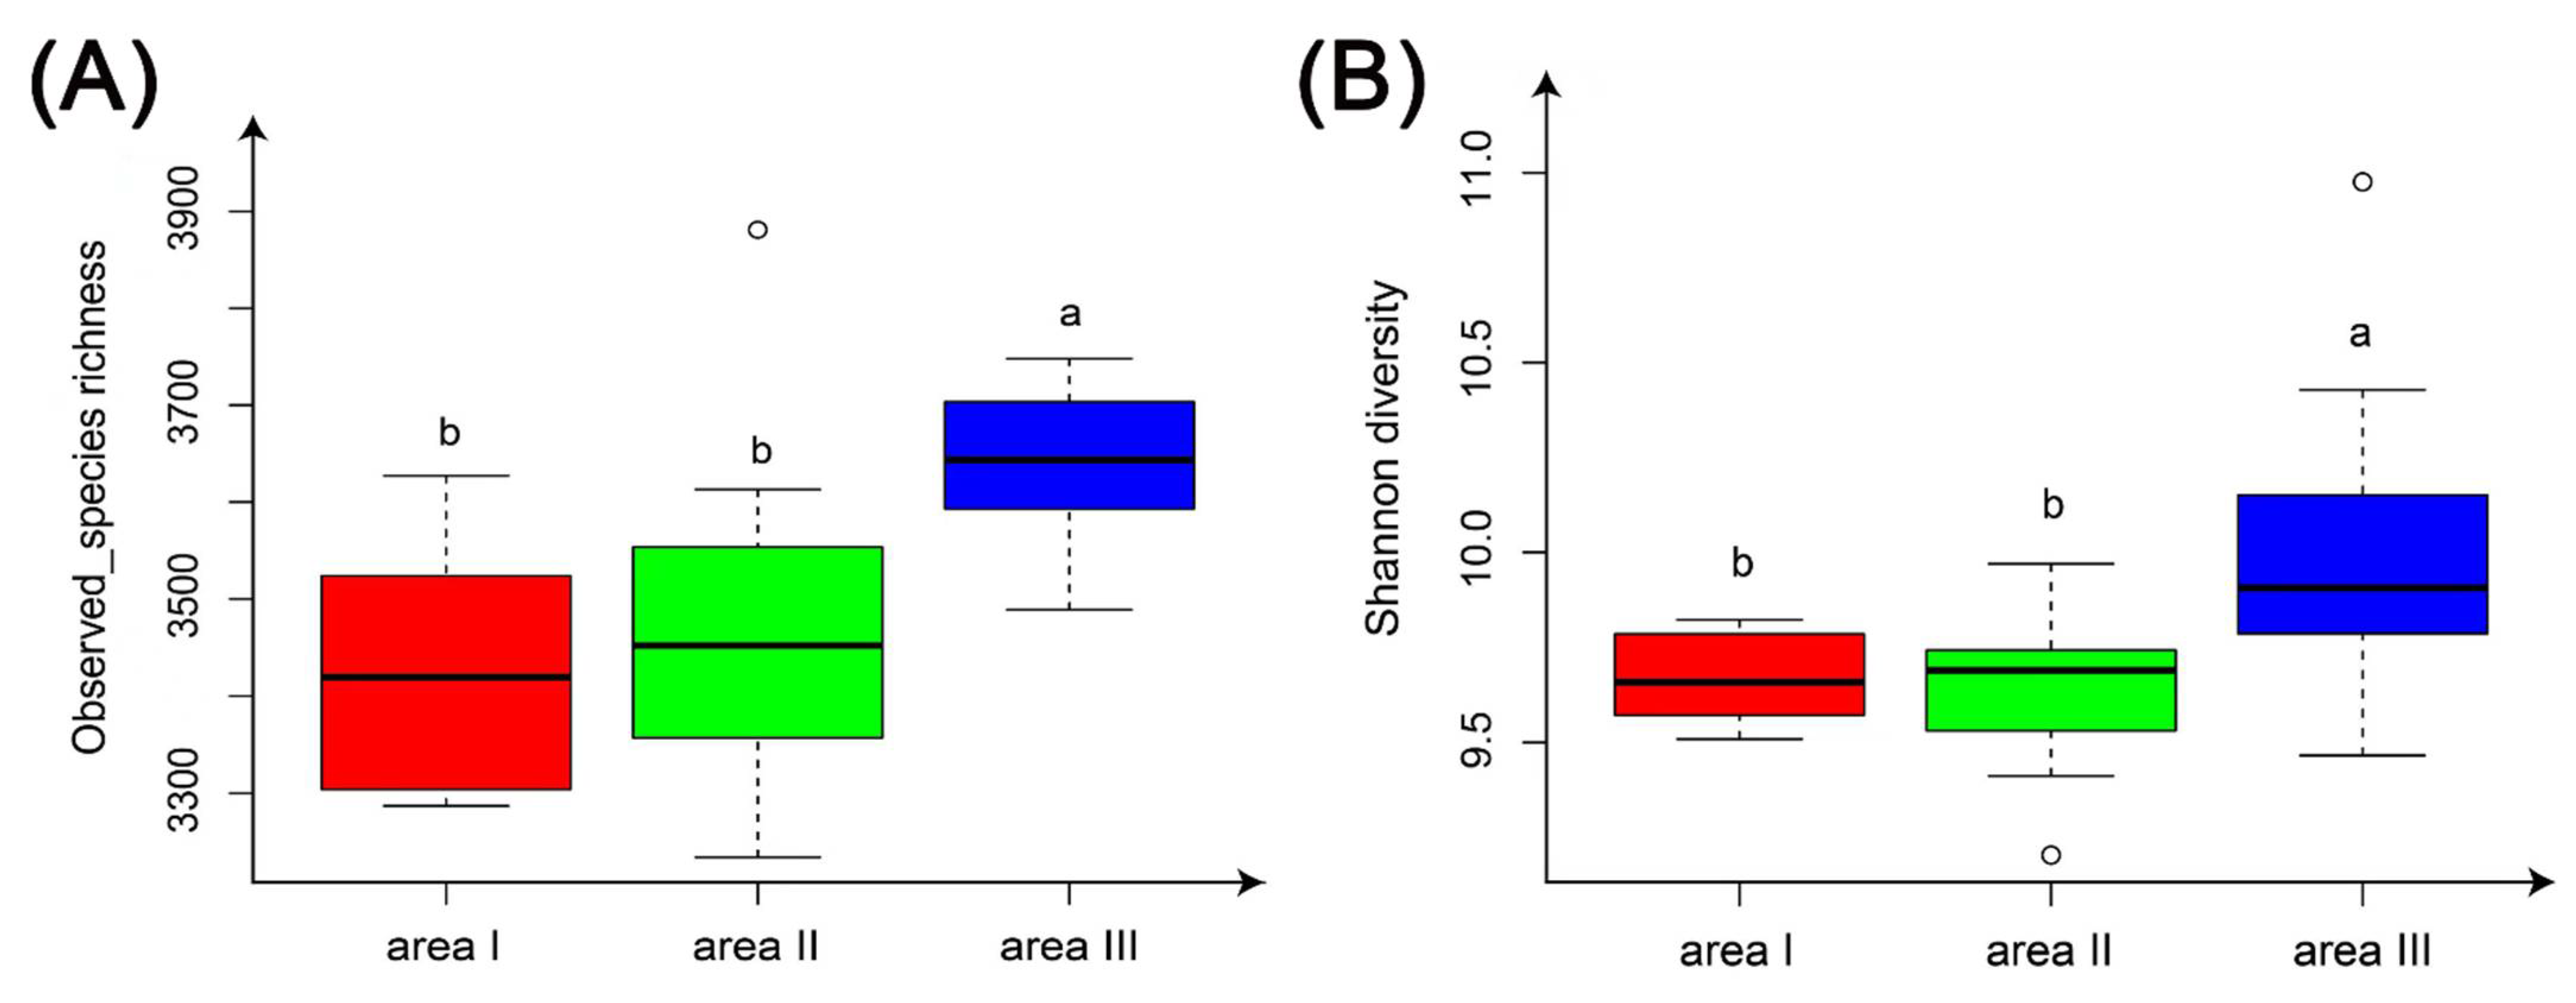
Two α-diversity indices, including the Shannon–Wiener index of diversity and the observed species richness, were estimated (Figure 4). Diversity indices of microbial communities in area III (S7, S8, S9) were significantly higher than those sampled from the other two areas (p < 0.05). However, there was no obvious difference observed between area I and area II.

3.2.2. Beta Diversity

A non-metric multidimensional scale (NMDS) of soil microbial communities was carried out based on the Bray–Curtis distance matrix (Figure 5). The stress value of 0.169 indicates that the results are acceptable and appropriate. In general, the four plots of sampling sites aggregated separately, indicating the similarity within each site of microbial community structure. Obvious differentiation among nine sites was found, mostly along the X-axis. Sampling area I (S1 and S2) is distributed along the Y axis on the left side of the X axis, sampling area III (S7, S8, and S9) was distributed along the Y axis on the right side of the X axis. Area II (S3, S4, S5, and S6) was distributed in the middle of the two former areas. Among them, S1 was located in the upper left and S9 was located in the lower right. Differentiation of microbial communities was the most significant between these two sites.

3.3. Taxonomic Profiles of the Soil Microbial Communities

Bacterial communities dominated in the desert grassland soils on the periphery of the mine. After comparing the annotations with the database Silva132, a total of 7980 operational taxonomic units (OTUs) were annotated to the phylum level and 2635 (25.03%) OUTs were annotated to the genus level.
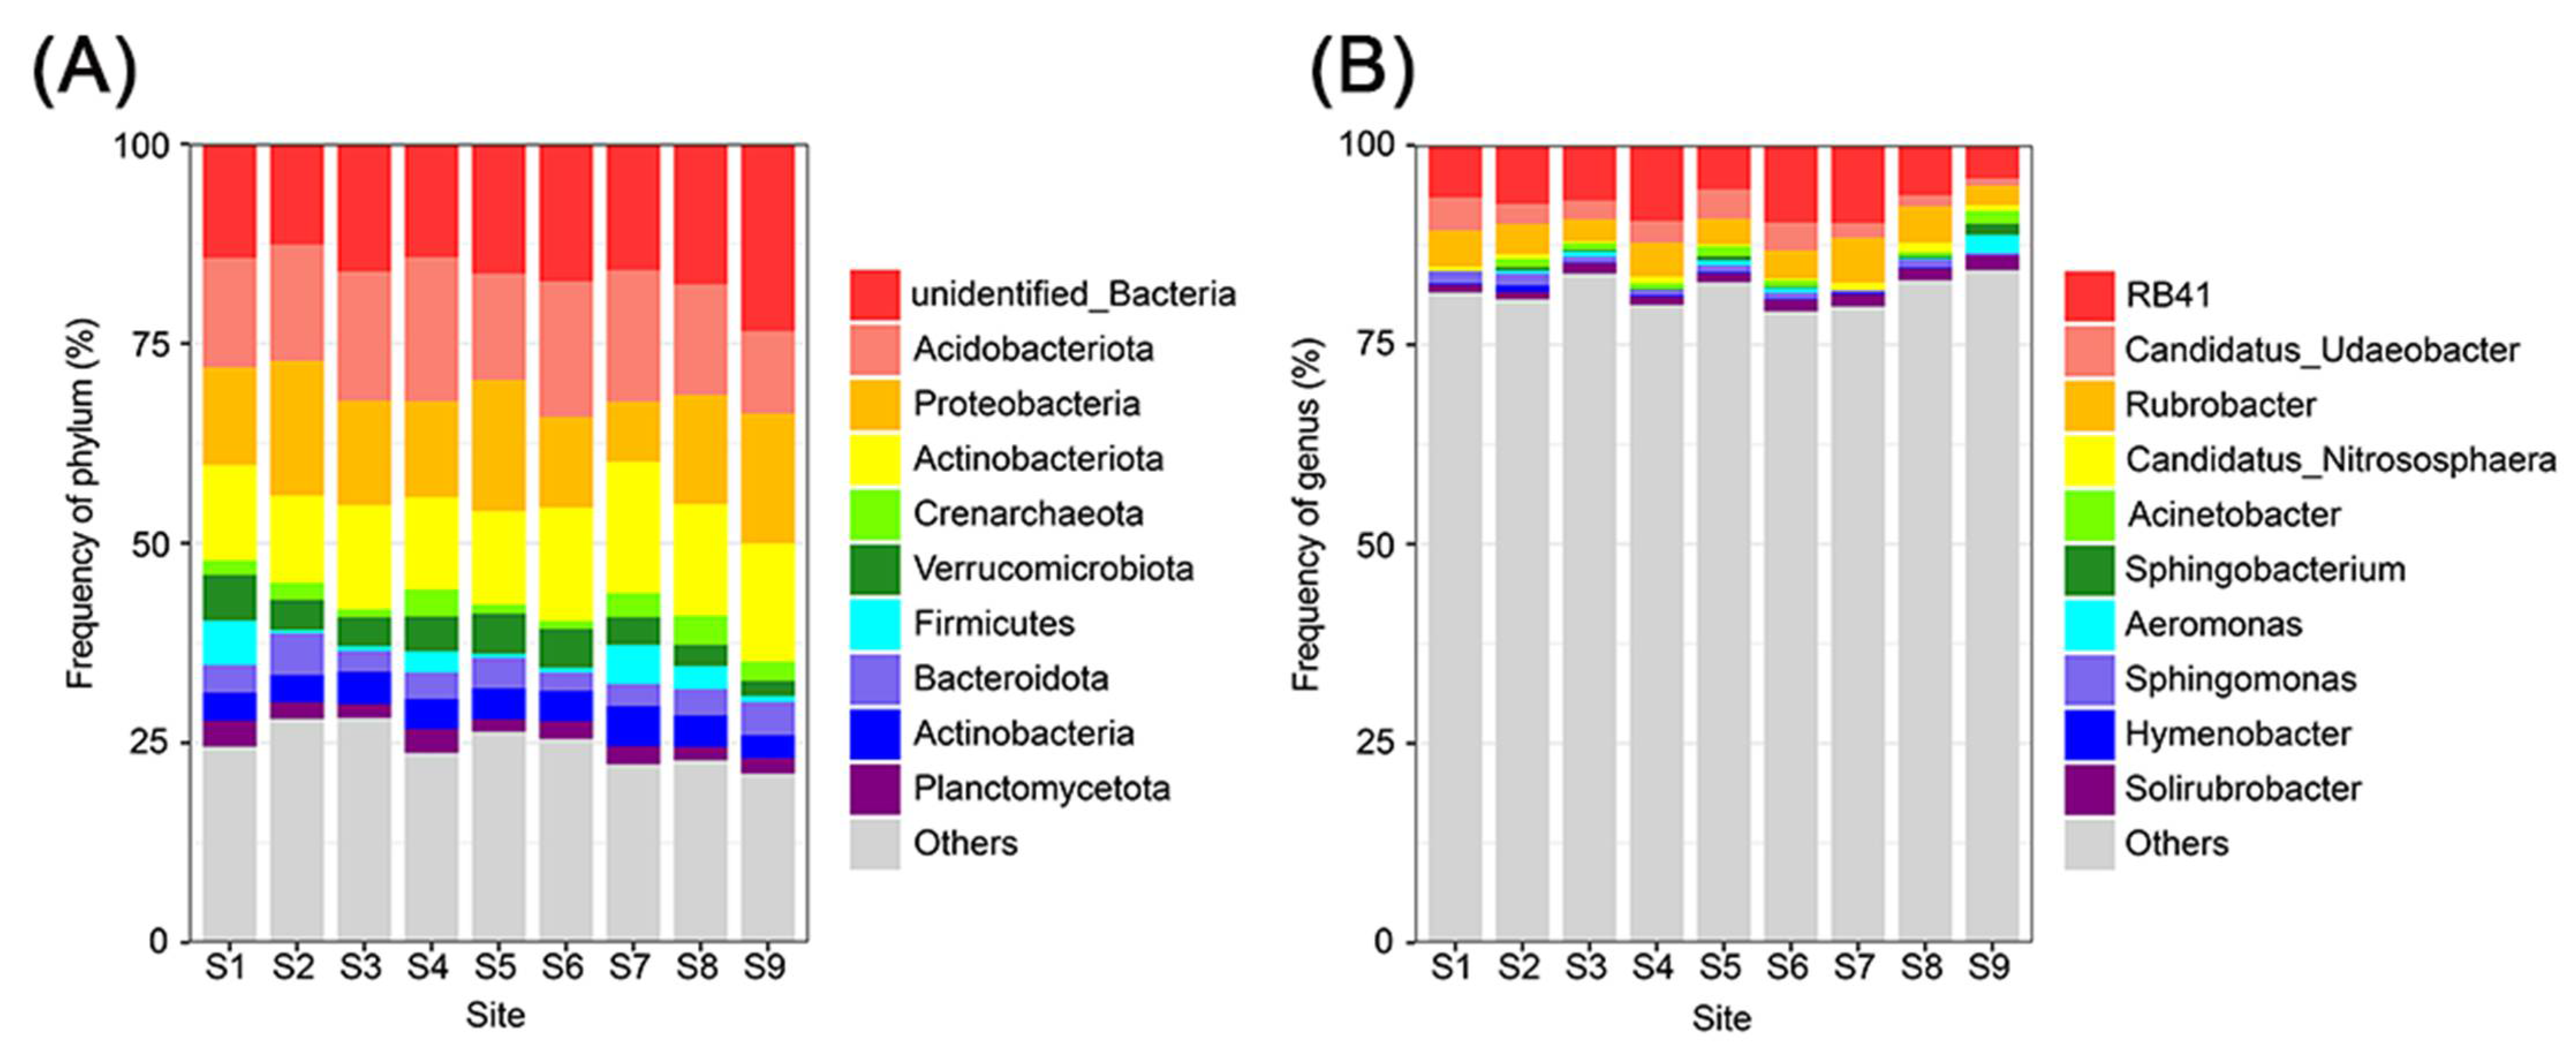
Taxonomic classification revealed significant differences in microbial community structure between sampling plots (Figure 6). At the phylum level, it was found that dominant phyla were Acidobacteriota, Proteobacteria, and Actinobacteriota (Figure 6A). Notably, the proportion of Verrucomicrobiota and Firmicutes reduced from 5.71% and 5.57% in S1 to 1.91% and 0.74% in S9, respectively (Supplementary Material: Table S1). At the genus level, RB41, Candidatus_Udaeobacter, and Rubrobacter were dominant (Figure 6B). Among all genera, Candidatus_Udaeobacter and Sphingomonas, whose proportions decreased from 4.12% and 1.53% in S1 to 0.87% and 0.32% in S9, indicated that these bacteria might be tolerant or dependent on REEs in the soils. In contrast, Acinetobacter, Sphingobacterium, and Aeromonas were almost not detected in S1, but accounted for 1.61%, 1.40%, and 2.27% of the total OUTs in S9, respectively (Supplementary Material: Table S2).
The genera that were the most abundant in the sites near the mining area were Faecalibacteriu, YC-ZSS-LKJ147, Candidatus_Udaeobacter, Subgroup_10, Sphingomonas, Roseisolibacter, Flavobacterium, Hymenobacter, Adhaeribacter, and Abditibacterium. In contrast, genera such as Chryseobacterium, Sphingobacterium, Flavobacterium, Acinetobacter, Pseudomonas, Brevundimonas, Chitinibacter, and Comamonas were the most abundant in the sites far away from the mining area (Supplementary Material: Figure S1).

3.4. Environmental Factors Affecting Microbial Communities

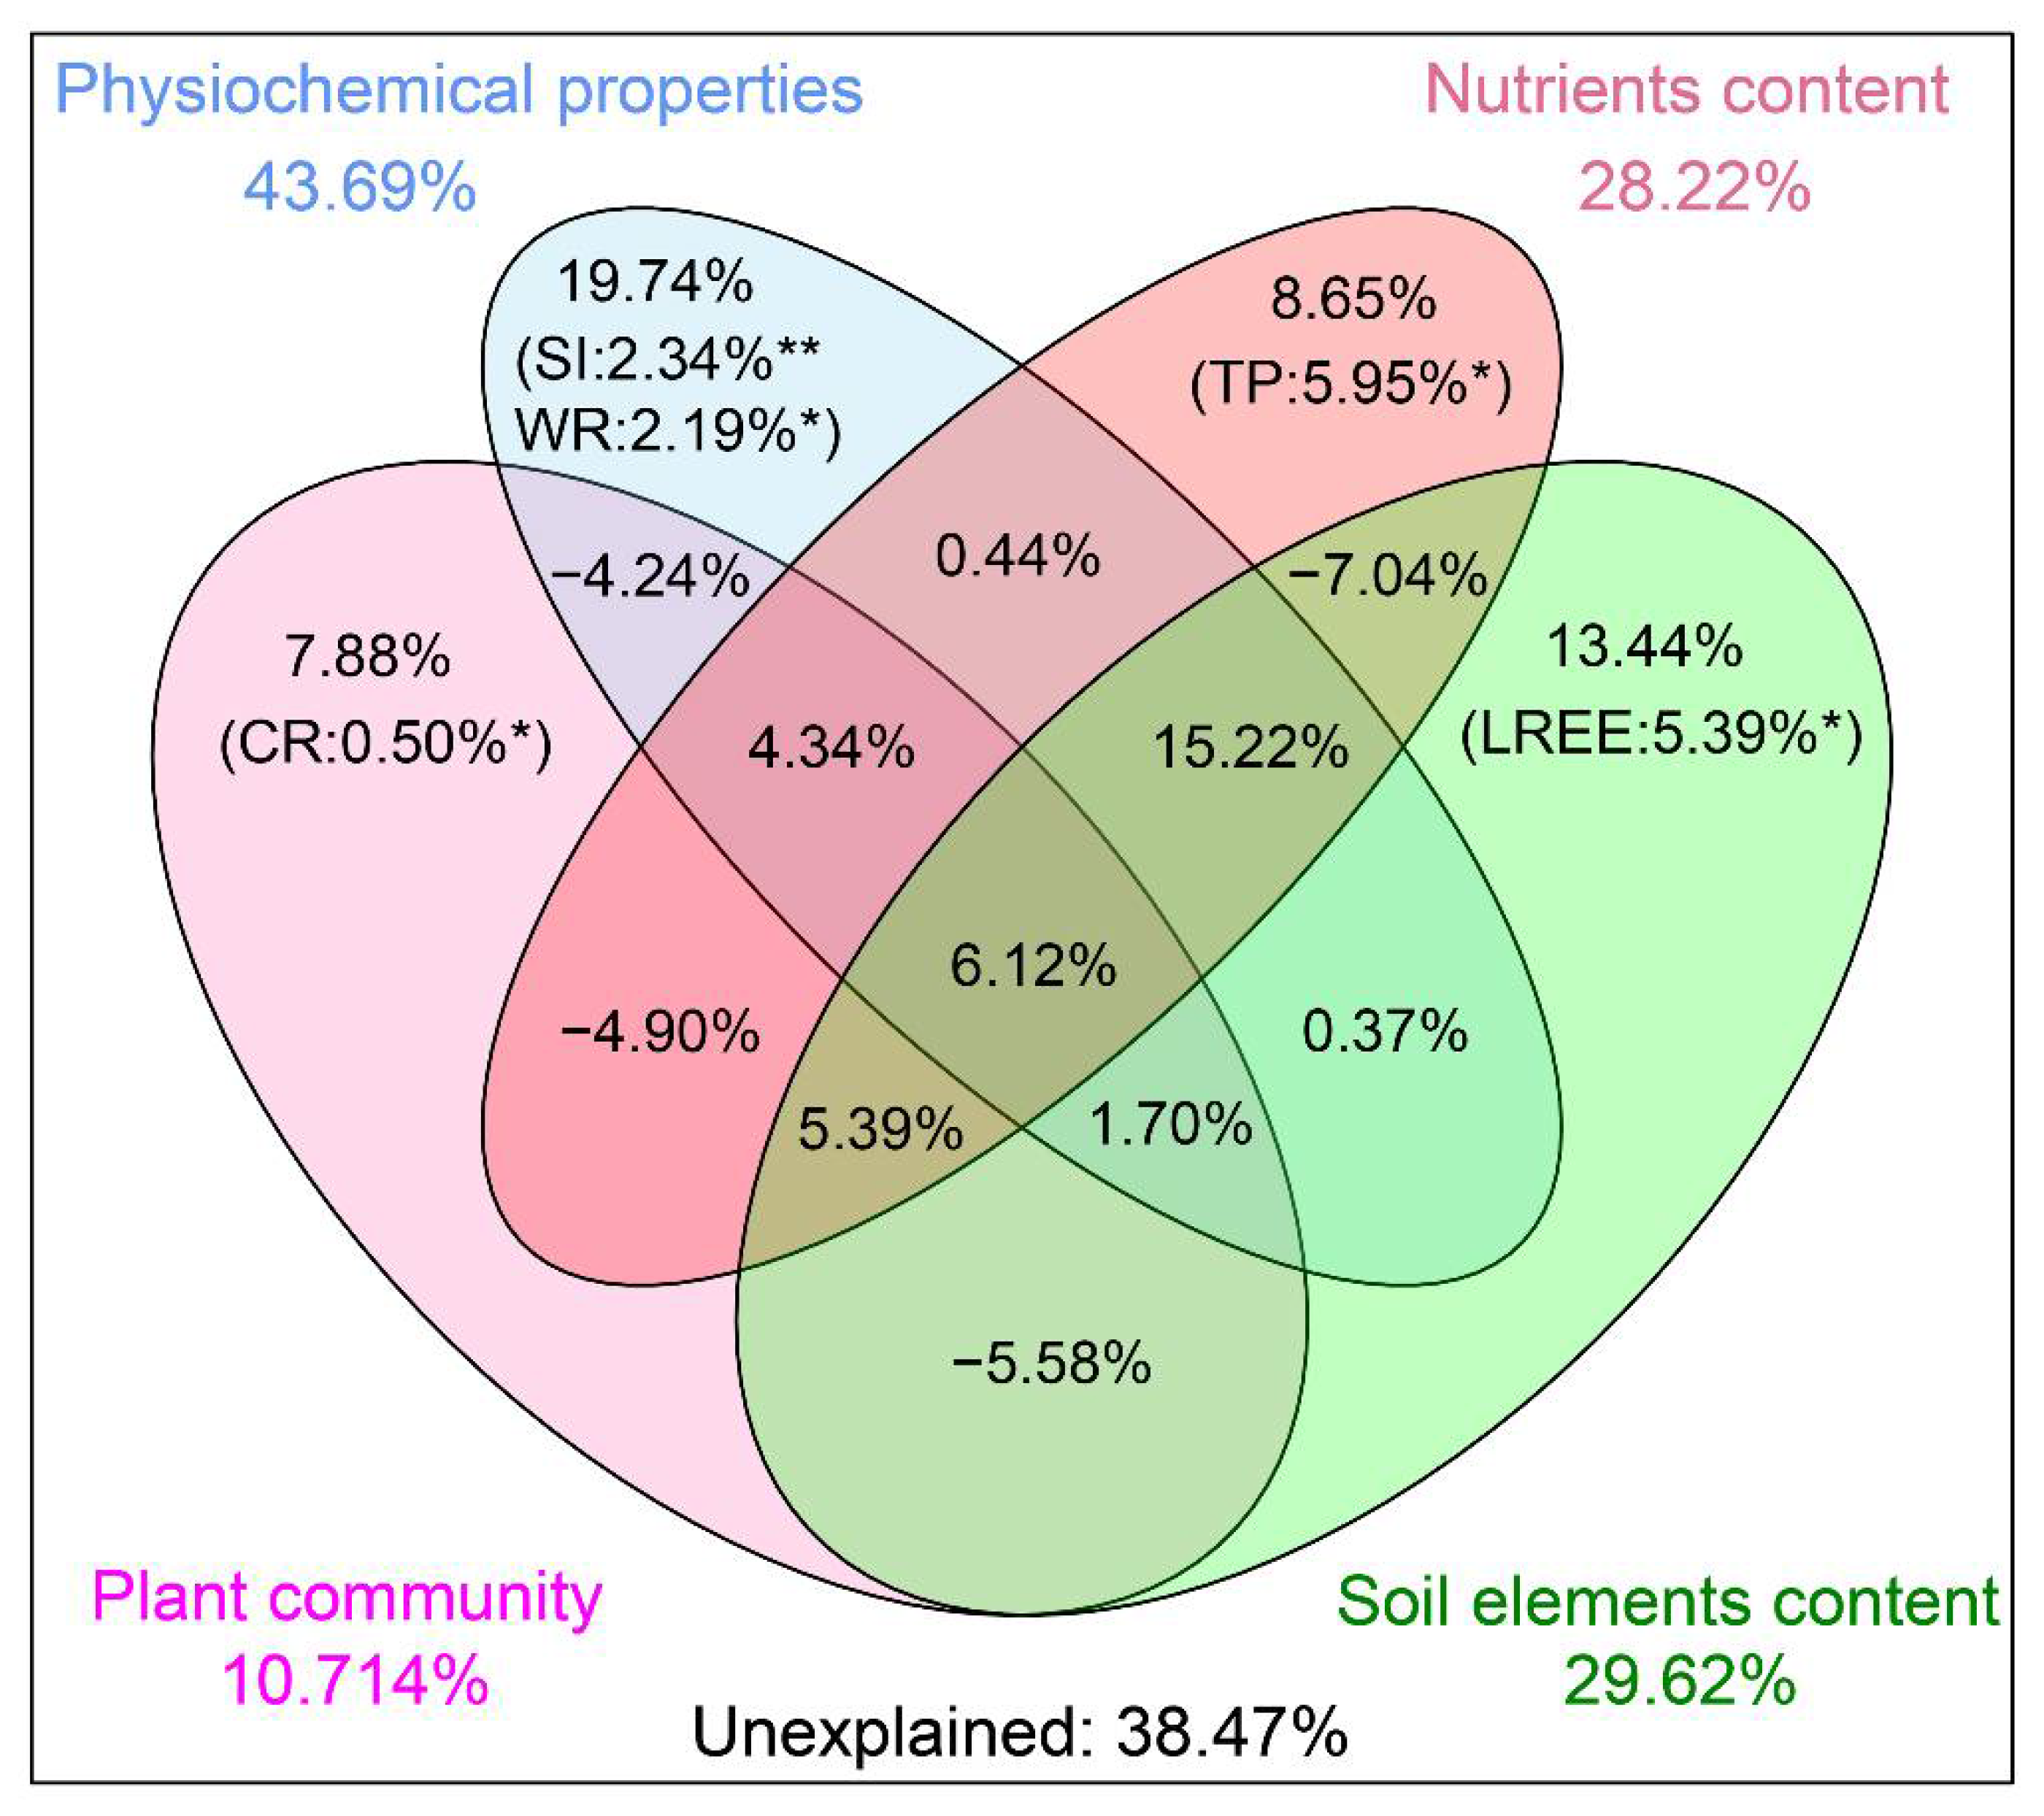
Variogram partitioning analysis (VPA) showed that 14 environmental factors explained a total of 61.53% of the observed variations in microbial community structure, while 38.47% of the variations remained unexplained (Figure 7). The explainable results were associated with three factors of plant community (10.71%), four factors of soil physicochemical property (43.69%), four factors of soil nutrient elements (28.22%), three factors of 17 elements (29.62%), and the common effects of these 14 factors of microbial variation (6.12%). Considering the influence of a single impact factor, TP explained the greatest degree of variation in microbial community structure (5.95%, p = 0.013), followed by LREE (5.39%, p = 0.029), SI (2.34%, p = 0.002), WR (2.19%, p = 0.031), and CR (0.50%, p = 0.027).
Correlation analysis further verified the relationship between microbial taxa and soil physicochemical properties. It was found that the relative abundance of some bacteria was significantly correlated with the concentration of REE in soil (Table 2). Among them, the relative abundance of Actinobacteriota was mainly negatively correlated with soil REE concentrations. (-r = 0.480, p = 0.003), while Verrucomicrobiota, Planctomycetota, Gemmatimonadetes, and Abditibacteriota were significantly positively correlated (r = 0.338, p = 0.044; r = 0.364, p = 0.029; r = 0.576, p= 0.000; r = 0.530, p = 0.001). At genus level, YC-ZSS-LKJ147 (r = 0.555, p = 0.000), Subgroup_10 (r = 0.589, p = 0.000), Sphingomonas (r = 0.671, p= 0.000), Roseisolibacter (r = 0.704, p = 0.000), Adhaeribacter (r = 0.333, p = 0.047), Abditibacterium (r = 0.530, p = 0.001), and some other genera were positively correlated with REEs, while Pseudomonas was significantly negatively correlated with REE concentrations (r = −0.349, p = 0.037). Soil total phosphorus (TP) was positively correlated with the three main phyla, i.e., Planctomycetota, Gemmatimonadetes, and Abditibacteriota, and five main genera (Table 2). Soil pH, electrical conductivity (EC), and soil texture (SI) were negatively correlated with the main phyla Verrucomicrobiota and Gemmatimonadetes (all p < 0.05), and were significantly negatively correlated with the dominant genera Candidatus_Udaeobacter, and Roseisolibacter (all p < 0.05). Soil water content (WR) positively correlated with the genera YC-ZSS-LKJ147, Subgroup_10, Sphingomonas, and Roseisolibacter (p < 0.05).

4. Discussion

4.1. Effects of Exogenous REEs on Soil Physical and Chemical Properties

As reported, in the in situ leaching rare earth mining area, significant degradation was found of soil nutrient element content (i.e., soil organic matter, total nitrogen, carbon-nitrogen ratio, available nitrogen, available phosphorus, and available potassium) along the ionic REE gradient [37,38]. This degradation trend was also observed when studying the effects in the REE yttrium, under controlled conditions in the laboratory [19].
In the present study, we did not observe significant differences in soil physicochemical properties between the sites near the mining area (S1, S2) and for those distal to the mining area (S7, S8, S9) (Table 1). In addition, the physicochemical properties of soil were not observed to be related to the content of REEs in soil (Figure 2). This suggests that although there is a distance gradient-related accumulation of REEs in the desert grassland around the Bayan Obo mining area, the content of REEs in the soil has not significantly changed the physicochemical properties of the soil and the characteristics of the surface vegetation.
One possible explanation for differences between our findings and those of previous reports [37,38] is that the mining method, rather than REEs, had a greater impact on soil properties. Previous analyses of heavy metals support the notion that leaching extracted minerals, organic matter, and metals from soil leads to disruption of the physical structure and chemical properties of soil [39]. Instead of leaching, open-pit mining was employed in the Bayan Obo mine, and, as a consequence, 64.0–89.4% of the REEs in the soil were in the residual state with low environmental activities [40]. Therefore, despite long-term accumulation of REEs for over 60 years, there has as of yet been no observed significant impact on soil physicochemical properties and vegetation characteristics in the desert grassland around the Bayan Obo mine.

4.2. Effects of Exogenous REE on Soil Microbial Community

A subtle pulse may result in significant changes in microbial abundance, microbial activity rates, and/or microbial community composition [41]. Therefore, to some extent, the composition and diversity of the microbial community are important for the conservation and restoration of the stability of soil ecological functions. Specifically, in fragile environments such as desert grasslands around rare earth mines, the profound impact of the accumulation of REEs on soil microbial communities should not be overlooked.
Despite there being no change in soil properties, our studies showed significant differences in the alpha diversity, including richness and Shannon indexes, of soil microbial communities in sites closer to the mining area and those farther away from the mining area (Figure 4). In addition, the beta diversity representing community variation showed that communities between close mine sites (S1, S2) were quite different in composition as compared with limbic sites (S7, S8, S9) (Figure 5). As the content of REEs decreased with the distance from the mining area (Table 1), it could be inferred that the soil microbial community changed significantly with the gradient of REEs in the soil desert grassland around the Bayan Obo mine. A similar result suggested that exogenous yttrium could deteriorate microbial community structure by decreasing the OTU richness index and microbial diversity indexes [42]. Additionally, an investigation at a decade-old abandoned rare earth mine discovered that the microbial community had not yet recovered over the ten-year span from contamination [37]. Studies have shown that REEs were a key driver for soil microbial communities, including those of bacteria, archaea, and ammonia-oxidizing archaea (AOA) [21,37,43] in rare earth mining areas. In the present study, the content of LREEs in the soil explains 5.39% variance of the microbial community (Figure 7); this suggests that LREEs are an important, influential factor.
Based on a taxonomic analysis, 10 important bacterial genera, including Faecalibacterium, YC-ZSS-LKJ147, Candidatus_Udaeobacter, Subgroup_10, Sphingomonas, Roseisolibacter, Flavobacterium, Hymenobacter, Adhaeribacter, and Abditibacterium, were more abundant in REE-rich soils from the S1 and S2 plots (Supplementary Material: Figure S1). Among them, YC-ZSS-LKJ147, Subgroup_10, Sphingomonas, Roseisolibacter, Adhaeribacter, and Abditibacterium positively correlated with REE concentrations (Table 2). The dominant microbial genera found in a survey of an abandoned rare earth mine in southern China included Janthinobacterium, Xiphinematobacter, Pirellula, Brevundimonas, and Methylobacterium. With the exception of Sphingomonas, these findings suggested no similarity to the Bayan Obo mining area. Recent research suggested that REEs were ubiquitous under stress conditions such as drought, clay, and heavy metals [44,45,46], and be able to play a role in the degradation of organometallic compounds [47]. It was reported that REEs significantly enhance the function of bacteria, such as methanotrophic [48,49] and Ketogulonigenium [50]. However, for Sphingomonas, further studies were recommended to reveal responses to REEs and their ecological functions in REE-contaminated soils. The determination of REE-tolerant bacteria could play an important role in bioremediation of REE pollution.
In contrast, some bacterial genera, such as Chryseobacterium, Flavobacterium, Acinetobacter, Pseudomonas, Brevundimonas, Chitinibacter, and Comamonas, were observed to be more abundant in sites distal to the mining area, as shown in Supplementary Material: Figure S1. These findings suggest that mining activities for REEs mostly negatively impact specific soil microbiota [38,42,43,44]
Furthermore, in belowground ecosystems, soil microorganisms, together with plant roots, soil enzymes, and soil invertebrates, constitute a complex food web [17,51]. Soil microbes regulate the decomposition and transformation of soil enzymes, and also play a decisive role in the types and activities of these enzymes [52]. Soil microorganisms interfere with soil invertebrates by down-top control [15]. The changes in microbial community made predominantly by REE accumulation in desert grassland soil are very likely to affect soil enzymes and soil animals and destroy the soil ecosystem structure and function. More studies need to be carried out for further verification, in order to fully recognize ecological risks of rare earth pollution in this region.

4.3. Environmental Factors Shape the Soil Microbial Community Together

In addition to the effects of REE on soil microbial community, other soil parameters were also examined. In our study, community composition variation was explained by physicochemical properties (43.69%), four factors of soil nutrient elements (28.22%), and three factors of 17 elements (29.62%) (Figure 7). These findings suggest that in addition to REE, soil nutrient elements and other physicochemical properties together shape the soil microbial community.
TP (5.95%), LREEs (5.39%), and SI (2.34%) are key factors in the current study (Figure 7). In previous studies, the physicochemical properties, namely soil nutrient elements, were found to drive the variation of soil microbial community. For example, a study on a desert steppe reported that the proportion of SI and TN positively correlated with the abundance of soil bacteria [53]; WR was considered one of the key factors strongly affecting bacterial community composition via changes from precipitation [54]. In contrast, in a heavy metal contaminated area, soil organic matter was regarded as the most important factor [50].
For microbial taxon, Acidobacteria was the most abundant phyla in soil bacterial communities (Figure 6). Acidobacteria typically appeared to dominate in nutrient-poor soil environments [55], and was tolerant to heavy metals, which may offer it an advantage in the soil of the study area [56]. Actinobacteriota, one of the dominant phyla here, were observed to be inversely correlated with REEs (Table 2) A previous study found that the abundance of Actinobacteriota was reduced in tailings soil polluted by heavy metals Cd, Zn, and Pb [57]. Actinobacteriota can be used as bioindicators for Zn contamination [58], and can also be used to monitor REE pollution.

5. Conclusions

Through field investigations and high-throughput sequencing, our study suggested that the mining of rare earths in the Bayan Obo mine resulted in the accumulation of REEs in desert steppe soils, although the physicochemical properties of the soils were not significantly changed by the exogenous REE. In addition, the community structure and composition of soil microorganisms were affected, with TP, REEs, SI, and WR identified as key factors responsible for the differences among soil microbial communities. These findings may advance our understanding of the ecological risk of rare earth contamination and provide support for further ecological risk assessment and ecological remediation.

Supplementary Materials

The following supporting information can be downloaded at: https://www.mdpi.com/article/10.3390/su142315629/s1, Figure S1: Heat-map of genus in nine different sites; Table S1 Relative abundance of main 10 phyla (%); Table S2 Relative abundance of main 10 genera (%).

Author Contributions

Conceptualization, W.S., H.G. and J.L.; methodology, H.G., Y.M. and X.D.; software, R.S., Y.L. and W.C.; investigation, H.G., Y.M., R.S. and Y.L.; writing—original draft preparation, H.G. and X.D.; writing—review and editing, H.G., Y.M. All authors have read and agreed to the published version of the manuscript.

Funding

This research was funded by the Inner Mongolia Science and Technology Project 2022YFHH0042; Inner Mongolia Natural Science Foundation Project 2021MS04001; National Natural Science Foundation of China (no: 41161010); National Natural Science Foundation of China (no: 42061069); the key technology and application of ecological quality diagnosis and integrated management of “Beautiful Inner Mongolia” (no: 2019GG010); the Research Foundation of Education Bureau of Inner Mongolia, China (NJYT-19-B29).

Institutional Review Board Statement

Not applicable.

Informed Consent Statement

Not applicable.

Data Availability Statement

Not applicable.

Acknowledgments

We would like to thank Weichen Guo for his help in field investigation.

Conflicts of Interest

The authors declare no conflict of interest.

References

  1. Castor, S.B.; Hedrick, J.B. Rare Earth Elements. Ind. Miner. Rocks 2006, 7, 769–792. [Google Scholar] [CrossRef]
  2. Ramos, S.J.; Dinali, G.S.; Oliveira, C.; Martins, G.C.; Moreira, C.G.; Siqueira, J.O.; Guilherme, L.R.G. Rare Earth Elements in the Soil Environment. Curr. Pollut. Rep. 2016, 2, 28–50. [Google Scholar] [CrossRef] [Green Version]
  3. Gwenzi, W.; Mangori, L.; Danha, C.; Chaukura, N.; Dunjana, N.; Sanganyado, E. Sources, behaviour, and environmental and human health risks of high-technology rare earth elements as emerging contaminants. Sci. Total Environ. 2018, 636, 299–313. [Google Scholar] [CrossRef] [PubMed]
  4. USGS U.S. Geological Survey, Mineral Commodity Summaries, January 2022. Available online: https://www.usgs.gov/centers/national-minerals-information-center/rare-earths-statistics-and-information (accessed on 10 October 2022).
  5. Alonso, E.; Sherman, A.M.; Wallington, T.J.; Everson, M.P.; Field, F.R.; Roth, R.; Kirchain, R.E. Evaluating Rare Earth Element Availability: A Case with Revolutionary Demand from Clean Technologies. Environ. Sci. Technol. 2012, 46, 3406–3414. [Google Scholar] [CrossRef]
  6. Adeel, M.; Lee, J.Y.; Zain, M.; Rizwan, M.; Nawab, A.; Ahmad, M.; Shafiq, M.; Yi, H.; Jilani, G.; Javed, R.; et al. Cryptic footprints of rare earth elements on natural resources and living organisms. Environ. Int. 2019, 127, 785–800. [Google Scholar] [CrossRef]
  7. Wang, L.; Liang, T. Geochemical fractions of rare earth elements in soil around a mine tailing in Baotou, China. Sci. Rep. 2015, 5, 12483. [Google Scholar] [CrossRef] [Green Version]
  8. Wang, L.; Liang, T. Anomalous abundance and redistribution patterns of rare earth elements in soils of a mining area in Inner Mongolia, China. Environ. Sci. Pollut. Res. 2016, 23, 11330–11338. [Google Scholar] [CrossRef]
  9. Thomas, P.J.; Carpenter, D.; Boutin, C.; Allison, J.E. Rare earth elements (REEs): Effects on germination and growth of selected crop and native plant species. Chemosphere 2013, 96, 57–66. [Google Scholar] [CrossRef] [Green Version]
  10. Li, J.; Verweij, R.A.; van Gestel, C.A. Lanthanum toxicity to five different species of soil invertebrates in relation to availability in soil. Chemosphere 2018, 193, 412–420. [Google Scholar] [CrossRef]
  11. Tang, W.; Wang, G.; Zhang, S.; Li, T.; Xu, X.; Deng, O.; Luo, L.; He, Y.; Zhou, W. Physiochemical responses of earthworms (Eisenia fetida) under exposure to lanthanum and cerium alone or in combination in artificial and contaminated soils. Environ. Pollut. 2021, 296, 118766. [Google Scholar] [CrossRef]
  12. Pagano, G.; Thomas, P.J.; Di Nunzio, A.; Trifuoggi, M. Human exposures to rare earth elements: Present knowledge and research prospects. Environ. Res. 2019, 171, 493–500. [Google Scholar] [CrossRef] [PubMed]
  13. Wei, B.; Li, Y.; Li, H.; Yu, J.; Ye, B.; Liang, T. Rare earth elements in human hair from a mining area of China. Ecotoxicol. Environ. Saf. 2013, 96, 118–123. [Google Scholar] [CrossRef] [PubMed]
  14. Li, Y.; Yu, H.; Zheng, S.; Miao, Y.; Yin, S.; Li, P.; Bian, Y. Direct Quantification of Rare Earth Elements Concentrations in Urine of Workers Manufacturing Cerium, Lanthanum Oxide Ultrafine and Nanoparticles by a Developed and Validated ICP-MS. Int. J. Environ. Res. Public Health 2016, 13, 350. [Google Scholar] [CrossRef] [PubMed] [Green Version]
  15. Majumdar, S.; Trujillo-Reyes, J.; Hernandez-Viezcas, J.A.; White, J.C.; Peralta-Videa, J.R.; Gardea-Torresdey, J.L. Cerium Biomagnification in a Terrestrial Food Chain: Influence of Particle Size and Growth Stage. Environ. Sci. Technol. 2016, 50, 6782–6792. [Google Scholar] [CrossRef]
  16. Hawthorne, J.; Roche, R.D.L.T.; Xing, B.; Newman, L.A.; Ma, X.; Majumdar, S.; Gardea-Torresdey, J.; White, J.C. Particle-Size Dependent Accumulation and Trophic Transfer of Cerium Oxide through a Terrestrial Food Chain. Environ. Sci. Technol. 2014, 48, 13102–13109. [Google Scholar] [CrossRef]
  17. Bardgett, R.D.; Van Der Putten, W.H. Belowground biodiversity and ecosystem functioning. Nature 2014, 515, 505–511. [Google Scholar] [CrossRef]
  18. Wardle, D.A.; Bardgett, R.D.; Klironomos, J.N.; Setala, H.; van der Putten, W.H.; Wall, D.H. Ecological Linkages Between Aboveground and Belowground Biota. Science 2004, 304, 1629–1633. [Google Scholar] [CrossRef]
  19. Schloter, M.; Dilly, O.; Munch, J. Indicators for evaluating soil quality. Agric. Ecosyst. Environ. 2003, 98, 255–262. [Google Scholar] [CrossRef]
  20. Li, S.; Zhao, B.; Jin, M.; Hu, L.; Zhong, H.; He, Z. A comprehensive survey on the horizontal and vertical distribution of heavy metals and microorganisms in soils of a Pb/Zn smelter. J. Hazard. Mater. 2020, 400, 123255. [Google Scholar] [CrossRef]
  21. Jiao, S.; Liu, Z.; Lin, Y.; Yang, J.; Chen, W.; Wei, G. Bacterial communities in oil contaminated soils: Biogeography and co-occurrence patterns. Soil Biol. Biochem. 2016, 98, 64–73. [Google Scholar] [CrossRef]
  22. Bajaj, S.; Singh, D.K. Biodegradation of persistent organic pollutants in soil, water and pristine sites by cold-adapted microorganisms: Mini review. Int. Biodeterior. Biodegradation 2015, 100, 98–105. [Google Scholar] [CrossRef]
  23. Gonzalez, V.; Vignati, D.A.; Leyval, C.; Giamberini, L. Environmental fate and ecotoxicity of lanthanides: Are they a uniform group beyond chemistry? Environ. Int. 2014, 71, 148–157. [Google Scholar] [CrossRef] [PubMed]
  24. Dushyantha, N.; Batapola, N.; Ilankoon, I.M.S.K.; Rohitha, S.; Premasiri, R.; Abeysinghe, B.; Ratnayake, N.; Dissanayake, K. The story of rare earth elements (REEs): Occurrences, global distribution, genesis, geology, mineralogy and global production. Ore Geol. Rev. 2020, 122, 103521. [Google Scholar] [CrossRef]
  25. Guan, H.; Li, J.; Mou, Y.; Gao, W.; Zhang, C. Spatial Heterogeneity of Rare Earth Elements Accumulation in the Soil Surrounding Bayan Obo Mining Area. Rare Earth. 2021, 42, 27–35. [Google Scholar] [CrossRef]
  26. Xu, C.; Campbell, I.H.; Kynicky, J.; Allen, C.M.; Chen, Y.; Huang, Z.; Qi, L. Comparison of the Daluxiang and Maoniuping carbonatitic REE deposits with Bayan Obo REE deposit, China. Lithos 2008, 106, 12–24. [Google Scholar] [CrossRef]
  27. Wang, L.; Liang, T. Accumulation and fractionation of rare earth elements in atmospheric particulates around a mine tailing in Baotou, China. Atmospheric Environ. 2014, 88, 23–29. [Google Scholar] [CrossRef]
  28. Wang, L.; Liang, T.; Zhang, Q.; Li, K. Rare earth element components in atmospheric particulates in the Bayan Obo mine region. Environ. Res. 2014, 131, 64–70. [Google Scholar] [CrossRef]
  29. Guan, H.; Jinxia, L.W.; Jun, M. Community Composition and Seasonal Variation of Ground-Dwelling Arthropods Communities in Desert Steppe around Bayan Obo Mine. J. Inn. Mong. Univ. 2022, 53, 77–85. [Google Scholar] [CrossRef]
  30. Bao, S.D. Soil and Agricultural Chemistry Analysis; China Agriculture Press: Beijing, China, 2000; pp. 355–356. [Google Scholar]
  31. Guo, H.; Nasir, M.; Lv, J.; Dai, Y.; Gao, J. Understanding the variation of microbial community in heavy metals contaminated soil using high throughput sequencing. Ecotoxicol. Environ. Saf. 2017, 144, 300–306. [Google Scholar] [CrossRef]
  32. Magoč, T.; Salzberg, S.L. FLASH: Fast length adjustment of short reads to improve genome assemblies. Bioinformatics 2011, 27, 2957–2963. [Google Scholar] [CrossRef] [Green Version]
  33. Caporaso, J.G.; Kuczynski, J.; Stombaugh, J.; Bittinger, K.; Bushman, F.D.; Costello, E.K.; Fierer, N.; Gonzalez Peña, A.; Goodrich, J.K.; Gordon, J.I.; et al. QIIME allows analysis of high-throughput community sequencing data. Nat. Methods 2010, 7, 335–336. [Google Scholar] [CrossRef] [PubMed] [Green Version]
  34. Edgar, R.C.; Haas, B.J.; Clemente, J.C.; Quince, C.; Knight, R. UCHIME improves sensitivity and speed of chimera detection. Bioinformatics 2011, 27, 2194–2200. [Google Scholar] [CrossRef] [PubMed] [Green Version]
  35. Edgar, R.C. UPARSE: Highly accurate OTU sequences from microbial amplicon reads. Nat. Methods 2013, 10, 996–998. [Google Scholar] [CrossRef] [PubMed]
  36. Quast, C.; Pruesse, E.; Yilmaz, P.; Gerken, J.; Schweer, T.; Yarza, P.; Peplies, J.; Glöckner, F.O. The SILVA Ribosomal RNA Gene Database Project: Improved Data Processing and Web-Based Tools. Nucleic Acids Res. 2013, 41, D590–D596. [Google Scholar] [CrossRef]
  37. Chao, Y.; Liu, W.; Chen, Y.; Chen, W.; Zhao, L.; Ding, Q.; Wang, S.; Tang, Y.-T.; Zhang, T.; Qiu, R.-L. Structure, Variation, and Co-occurrence of Soil Microbial Communities in Abandoned Sites of a Rare Earth Elements Mine. Environ. Sci. Technol. 2016, 50, 11481–11490. [Google Scholar] [CrossRef]
  38. Liu, J.; Liu, W.; Zhang, Y.; Chen, C.; Wu, W.; Zhang, T.C. Microbial communities in rare earth mining soil after in-situ leaching mining. Sci. Total Environ. 2020, 755, 142521. [Google Scholar] [CrossRef]
  39. Jelusic, M.; Lestan, D. Effect of EDTA washing of metal polluted garden soils. Part I: Toxicity hazards and impact on soil properties. Sci. Total Environ. 2014, 475, 132–141. [Google Scholar] [CrossRef]
  40. Wang, X.F. Concentration and Fractionation of Rare Eanh Elements in Soils SuHDunding RareEanh Ore Area. Rock Miner. Anal. 2019, 38, 137–146. [Google Scholar] [CrossRef]
  41. Liu, J.; He, X.-X.; Lin, X.-R.; Chen, W.-C.; Zhou, Q.-X.; Shu, W.-S.; Huang, L.-N. Ecological Effects of Combined Pollution Associated with E-Waste Recycling on the Composition and Diversity of Soil Microbial Communities. Environ. Sci. Technol. 2015, 49, 6438–6447. [Google Scholar] [CrossRef]
  42. Luo, C.; Deng, Y.; Liang, J.; Zhu, S.; Wei, Z.; Guo, X.; Luo, X. Exogenous rare earth element-yttrium deteriorated soil microbial community structure. J. Rare Earths 2018, 36, 430–439. [Google Scholar] [CrossRef]
  43. Wei, Z.; Hao, Z.; Li, X.; Guan, Z.; Cai, Y.; Liao, X. The effects of phytoremediation on soil bacterial communities in an abandoned mine site of rare earth elements. Sci. Total Environ. 2019, 670, 950–960. [Google Scholar] [CrossRef] [PubMed]
  44. Luo, Y.; Wang, F.; Huang, Y.; Zhou, M.; Gao, J.; Yan, T.; Sheng, H.; An, L. Sphingomonas sp. Cra20 Increases Plant Growth Rate and Alters Rhizosphere Microbial Community Structure of Arabidopsis thaliana Under Drought Stress. Front. Microbiol. 2019, 10, 1221. [Google Scholar] [CrossRef] [PubMed] [Green Version]
  45. Khan, A.L.; Waqas, M.; Asaf, S.; Kamran, M.; Shahzad, R.; Bilal, S.; Khan, M.A.; Kang, S.-M.; Kim, Y.-H.; Yun, B.-W.; et al. Plant growth-promoting endophyte Sphingomonas sp. LK11 alleviates salinity stress in Solanum pimpinellifolium. Environ. Exp. Bot. 2016, 133, 58–69. [Google Scholar] [CrossRef]
  46. Magnani, D.; Solioz, M. How Bacteria Handle Copper. In Molecular Microbiology of Heavy Metals; Springer: New York, NY, USA, 2007; pp. 259–285. [Google Scholar] [CrossRef]
  47. Asaf, S.; Numan, M.; Khan, A.L.; Al-Harrasi, A. Sphingomonas: From diversity and genomics to functional role in environmental remediation and plant growth. Crit. Rev. Biotechnol. 2020, 40, 138–152. [Google Scholar] [CrossRef]
  48. Chen, A.; Shi, Q.; Ouyang, Y.; Chen, Y. Effect of Ce3+ on membrane permeability of Escherichia coli cell. J. Rare Earths 2012, 30, 947–951. [Google Scholar] [CrossRef]
  49. Peng, L.; Weiying, Z.; Xi, L.; Yi, L. Structural Basis for the Biological Effects of Pr(III) Ions: Alteration of Cell Membrane Permeability. Biol. Trace Element Res. 2007, 120, 141–147. [Google Scholar] [CrossRef] [PubMed]
  50. Azarbad, H.; Niklińska, M.; van Gestel, C.A.; van Straalen, N.M.; Röling, W.F.; Laskowski, R. Microbial community structure and functioning along metal pollution gradients. Environ. Toxicol. Chem. 2013, 32, 1992–2002. [Google Scholar] [CrossRef] [PubMed]
  51. Bardgett, R.D.; Wardle, D.A.; Yeates, G.W. Linking above-ground and below-ground interactions: How plant responses to foliar herbivory influence soil organisms. Soil Biol. Biochem. 1998, 30, 1867–1878. [Google Scholar] [CrossRef]
  52. Das, S.K.; Varma, A. Role of Enzymes in Maintaining Soil Health. In Soil Enzymology; Springer: Berlin/Heidelberg, Germany, 2010; pp. 25–42. [Google Scholar] [CrossRef]
  53. Ma, J.; Qin, J.; Ma, H.; Zhou, Y.; Shen, Y.; Xie, Y.; Xu, D. Soil characteristic changes and quality evaluation of degraded desert steppe in arid windy sandy areas. PeerJ 2022, 10, e13100. [Google Scholar] [CrossRef]
  54. Na, X.; Yu, H.; Wang, P.; Zhu, W.; Niu, Y.; Huang, J. Vegetation biomass and soil moisture coregulate bacterial community succession under altered precipitation regimes in a desert steppe in northwestern China. Soil Biol. Biochem. 2019, 136, 107520. [Google Scholar] [CrossRef]
  55. Dion, P. Microbiology of Extreme Soils; Springer: New York, NY, USA, 2008. [Google Scholar]
  56. Kalam, S.; Basu, A.; Ahmad, I.; Sayyed, R.Z.; El-Enshasy, H.A.; Dailin, D.J.; Suriani, N.L. Recent Understanding of Soil Acidobacteria and Their Ecological Significance: A Critical Review. Front. Microbiol. 2020, 11, 580024. [Google Scholar] [CrossRef] [PubMed]
  57. Gupta, S.; Graham, D.W.; Sreekrishnan, T.; Ahammad, S.Z. Exploring the impacts of physicochemical characteristics and heavy metals fractions on bacterial communities in four rivers. J. Environ. Manag. 2023, 325, 116453. [Google Scholar] [CrossRef]
  58. He, Y.; Wang, H.; Liu, Y.; Zuo, M.; Wang, X.; Shen, Y.; Li, G.; Hu, Y.; Zhao, M.; Yang, Y.; et al. Distribution and Variation of Soil Bacterial Community of Two Lead-Zinc Tailings in Qinling Mountains. Geomicrobiol. J. 2022, 39, 1–11. [Google Scholar] [CrossRef]
Figure 1. Location of the study area.
Sustainability 14 15629 g001
Figure 2. Correlation analysis between REE and other environmental factors. BM: plant biomass; CR: plant coverage; SP: plant species richness; EC: electrical conductivity; SI: soil texture (<0.02 mm) of soil; WR: water content; TOM: total organic matter; TOC: total organic carbon; TN: total nitrogen; TP: total phosphorus; LR: light REEs (La, Ce, Pr, Nd, Sm, and Eu); HR: heavy REEs (Gd, Tb, Dy, Ho, Er, Tm, and Yb); total REEs (La, Ce, Pr, Nd, Sm, Eu, Gd, Tb, Dy, Ho, Er, Tm, and Yb), *, **, and *** indicate significant relationship of p < 0.05, p < 0.01, and p< 0.001, respectively.
Sustainability 14 15629 g002
Figure 3. Principal component analysis (PCA) based on environmental factors (physicochemical characteristics as variables), clustered based on the similarity of the environmental factors of 36 sample plots.
Sustainability 14 15629 g003
Figure 4. α-diversity of soil microbial communities in the sampling sites. Two α-diversity indexes were discussed, including Observed_species richness (A) and Shannon diversity (B). Different letters represent significant differences (p < 0.05).
Sustainability 14 15629 g004
Figure 5. NMDS ordination plots derived from the Bray−Curtis distance matrix. The stresses score was 0.169, indicating acceptable results. Area I (S1 and S2) is shown in red, area II (S3, S4, S5, and S6) is shown in green, and area III (S7, S8, and S9) is shown in blue.
Sustainability 14 15629 g005
Figure 6. Relative abundance of phylum (A) and genus (B) of bacterial community detected in the soils from sampling sites. For the purpose of comparison, the number of sequences of samples was set at the same depth level.
Sustainability 14 15629 g006
Figure 7. Variation partitioning of bacterial communities by fourteen environmental factors in four categories (i.e., plant community, physical properties, nutrients content, and soil elements content) were taken into consideration. Soil elements contents include LREEs (La, Ce, Pr, Nd, Sm, and Eu), HREEs (Gd, Tb, Dy, Ho, Er, Tm, and Yb), heavy metal elements (Cu, Pb, Zn, and Cr) as shown in Table 1. * and **, indicate p < 0.05, and p < 0.01, respectively.
Sustainability 14 15629 g007
Table 1. Soil properties of the studied sites.
SitesPlant Community PropertiesSoil Physicochemical PropertiesSoil Nutrients ContentsSoil Elements Content
BM (g)CR (%)SPpHEC (μs/cm)SI (%)WR (%)OM(g/kg)OC(g/kg)TN (g/kg)TP (g/kg)LREE (μg/g)HREE (μg/g)REE (μg/g)HM (μg/g)
S153.14 ± 10.22 a25.00 ± 1.75 bc7.17 ± 0.76 ab8.07 ± 0.24 c1.45 ± 0.08 b52.6 ± 7.21 ab4.34 ± 0.52 a29.41 ± 2.62 ab17.06 ± 1.52 ab1.92 ± 0.08 ab0.05 ± 0.02 a1032.98 ± 506.28 a31.99 ± 8.24 a1064.93 ± 514.5 a418.80 ± 32.24 a
S243.83 ± 5.23 ab27.17 ± 3.57 ab7.17 ± 0.8 ab8.39 ± 0.15 ab1.67 ± 0.13 ab48.72 ± 3.72 bc4.47 ± 0.3 a26.86 ± 1.24 ab15.58 ± 0.71 ab1.76 ± 0.06 bc0.04 ± 0.01 b889.17 ± 105.18 a25.58 ± 1.75 b914.77 ± 106.5 a291.77 ± 6.05 b
S336.13 ± 4.01 bc24.08 ± 0.63 bcd4.25 ± 0.43 d8.28 ± 0.02 abc1.65 ± 0.02 ab48.16 ± 0.77 bc2.71 ± 1.07 bcd24.13 ± 0.68 b14.00 ± 0.4 b1.57 ± 0.03 c0.03 ± 0 b486.75 ± 119.05 b20.94 ± 1.43 bc507.70 ± 120.4 b285.93 ± 12.1 b
S416.29 ± 4.88 d17.00 ± 3.68 ef4.42 ± 0.95 d8.24 ± 0.09 abc1.67 ± 0.04 ab44.42 ± 1.04 c2.11 ± 0.19 d28.43 ± 1.44 ab16.49 ± 0.84 ab1.8 ± 0.07 bc0.03 ± 0.01 b506.8 ± 80.85 b21.67 ± 1.85 bc528.47 ± 82.4 b 248.77 ± 12.7 b
S515.11 ± 3.12 d14.58 ± 1.44 f5.83 ± 0.52 bc7.95 ± 0.22 bc1.65 ± 0.03 ab45.57 ± 2.97 c2.48 ± 0.17 cd31.45 ± 3.87 a18.24 ± 2.25 a1.98 ± 0.27 ab0.03 ± 0 b326.52 ± 21.65 b20.28 ± 1.74 bc346.80 ± 23.37 b277.13 ± 9.63 b
S621.08 ± 3.47 d19.42 ± 2.24 de5.00 ± 0.75 cd8.18 ± 0.4 bc1.6 ± 0.14 ab49.00 ± 0.51 bc2.33 ± 0.09 cd30.91 ± 4.75 a17.93 ± 2.76 a1.98 ± 0.26 ab0.03 ± 0 b338.92 ± 15.54 b19.64 ± 0.24 c358.53 ± 15.75 b299.27 ± 33.86 b
S721.99 ± 3.45 d20.83 ± 1.76 cde7.08 ± 0.8 ab8.46 ± 0.14 a1.81 ± 0.41 a56.85 ± 1.37 a2.9 ± 0.14 bcd28.57 ± 1.42 ab16.57 ± 0.83 ab1.99 ± 0.12 ab0.03 ± 0 b298.01 ± 42.53 b19.13 ± 1.39 c317.13 ± 42.28 b259.63 ± 4.25 b
S834.09 ± 5.56 c27.5 ± 2.38 ab5.42 ± 0.14 cd8.75 ± 0.1 a1.79 ± 0.06 a59.23 ± 3.17 a3.07 ± 0.36 bc27.3 ± 4.19 ab15.84 ± 2.43 ab1.87 ± 0.25 abc0.03 ± 0 b241.25 ± 60.92 b16.63 ± 2.12 c257.90 ± 62.91 b287.57 ± 14.12 b
S946.51 ± 2.71 a30.00 ± 4.16 a7.58 ± 1.04 a8.70 ± 0.02 a1.85 ± 0.05 a59.12 ± 5.56 a3.31 ± 0.12 b29.9 ± 2.41 a17.34 ± 1.4 a2.12 ± 0.03 a0.03 ± 0 b200.91 ± 29.43 b16.13 ± 1.5 c217.05 ± 30.94 b292.73 ± 15.01 b
BM: plant biomass; CR: plant coverage; SP: plant species richness; EC: electrical conductivity; SI: clay content (<0.02 mm) of soil; WR: water content; OM: total organic matter; OC: total organic carbon; TN: total nitrogen; TP: total phosphorus; LREEs: light REEs (La, Ce, Pr, Nd, Sm, and Eu); HREEs: heavy REEs (Gd, Tb, Dy, Ho, Er, Tm, and Yb); REEs: total rare earth elements (La, Ce, Pr, Nd, Sm, Eu, Gd, Tb, Dy, Ho, Er, Tm, and Yb); HM: heavy metal elements (Cu, Pb, Zn, and Cr). Data of EC are transformed by lg (X + 1). Data are average value ± standard error; Small letters represent significant differences between sites (p < 0.05). Means compared using one-way ANOVA.
Table 2. The correlation (r) and significance (p) values of linear regressions between relative abundances of bacterial taxon and REEs (rare earth elements), TP (total phosphorus), pH, EC (electrical conductivity), WR (water content), and SI (soil texture). Values in bold indicate significant correlations (p < 0.05). REEs: total rare earth elements (La, Ce, Pr, Nd, Sm, Eu, Gd, Tb, Dy, Ho, Er, Tm, and Yb); TP: total phosphorus; EC: electrical conductivity; SI: clay content (<0.02 mm) of soil; WR: water content. Bold indicates it is significant “r” value.
TaxaREETPpHECWRSI
rprprprprprp
Actinobacteriota−0.4800.003−0.0390.8230.3920.0180.1070.536−0.2340.170−0.2090.222
Verrucomicrobiota0.3380.0440.2990.077−0.5330.001−0.4070.0140.0530.757−0.4070.014
Planctomycetota0.3640.0290.3580.032−0.1970.250−0.1730.3130.1980.248−0.1760.305
Gemmatimonadetes0.5760.0000.4950.020−0.4220.010−0.4320.0090.2200.198−0.4210.011
Abditibacteriota0.5300.0010.3970.017−0.2710.109−0.2350.1670.1930.258−0.2590.128
YC-ZSS-LKJ1470.5550.0000.6000.000−0.1930.259−0.4990.0020.5680.0000.0140.934
Subgroup_100.5890.0000.5890.000−0.2340.169−0.3840.0210.3630.030−0.2740.106
Sphingomonas0.6710.0000.6180.000−0.1290.452−0.2260.1840.4300.009−0.3370.044
Roseisolibacter0.7040.0000.5850.000−0.4260.010−0.4080.0130.3580.032−0.5000.002
Adhaeribacter0.3330.0470.2320.1720.5500.7500.3040.0710.1470.147−0.2540.135
Abditibacterium0.5300.0010.3970.017−0.2710.244−0.2350.1670.2580.258−0.2590.128
Pseudomonas−0.3490.037−0.3240.0540.2850.0920.2650.118−0.1340.4350.0380.826
Candidatus_Udaeobacter0.3110.0650.2730.107−0.5200.001−0.3980.0160.0460.788−0.4030.015
Publisher’s Note: MDPI stays neutral with regard to jurisdictional claims in published maps and institutional affiliations.