Abstract
Recent empirical research indicates that South Africa’s present level of wealth and energy, given its fast-expanding population, is unsustainable. Studies in this domain focus on the impact of economic growth and energy use on environmental quality; the role of the real estate market on environmental quality in South Africa is ignored in the emerging literature. The current study aims to deliver a fresh empirical analysis in this context by analyzing the impact of South Africa’s real estate sector expansion and renewable energy sources on carbon emissions. Using the newly developed “bootstrap autoregressive distributed lag (ARDL) approach”, the results of the empirical investigation showed that renewable energy improves South Africa’s environmental quality. The current research also shows that the South African real estate industry has a negative impact on the environment. According to the current research, South African policymakers should create new regulations for the sustainable real estate sector to improve environmental quality by encouraging the usage of and investment in renewable energy.
1. Introduction
Globally energy demand is rising due to economic activities and is one of the most pressing challenges in the twenty-first century because of its significant consequences on global warming [1,2,3,4,5,6,7]. According to global energy balance figures, the world’s energy supply has increased from 6.098 Mtoe in 1973 to 14.282 Mtoe in 2018 (International Energy Agency (IEA), 2020), primarily due to high demand for consumption in economic activities. Because nonrenewable energy sources (fossil fuels) account for 80% of total energy demand [2], the energy sector is the major source of “greenhouse gas (GHG) emissions”, particularly carbon dioxide emissions (CO2), accounting for around two-thirds of overall emissions in the environment [8]. Under the sustainable development goals (SDG-7), environmental degradation is a critical concern to ensure sustainable economic growth (SEG), particularly in developing economies [9,10,11,12,13]. Although many factors have fatal effects on environmental quality, CO2 is the leading factor in the dangers of temperature, weather, and the ecosystem of the environment [14,15,16]. Therefore, international agreements (Paris Agreement 2015, Kyoto Protocol) have been established by global economies to combat global climate challenges, reduce CO2 emission levels, and obtain sustainable economic growth without compromising ecological quality [17]. Numerous research papers have examined the role of several factors such as FDI (foreign direct investments), “financial development, renewable energy, and the population” on environmental quality [18,19,20,21,22,23,24,25,26,27]. Based on our knowledge, only a handful of limited studies, such as those by Qashou et al. [28] and Wei and Kong [29], have explored the consequence of the real estate market on environmental quality.
Over the past two decades, green construction and sustainability have been persistent themes in the sector. However, the real estate industry is still evolving. Green buildings are considered the norm and mainstream and are expected to provide sustainable features in homes and commercial buildings. According to the National Association of Homebuilders, “homebuyers want—and will pay more for—sustainable features like energy-efficient appliances, windows, and the like, alongside features that ensure better air quality. As younger generations are expected to enter the homebuying market, this socially conscious group is looking out for green features and sustainability that is built in”. On the other hand, several of these concepts should hold true for investors wishing to purchase or enhance rental homes. The greatest renter pool is probably made up of youngsters, and possibly Gen Z, of today who are concerned about reducing their carbon footprint. Therefore, to enrich the existing literature, more studies are needed to validate the findings on the subject referred to. Consequently, the relationship between real estate and environmental quality in the context of South Africa is the primary topic of this research article.
South Africa’s economy is the continent’s most developed, high-tech, diverse, upper-middle-income, and third-biggest economy. The gross domestic product (GDP) of South Africa rebounded in 2021 and increased by 6.4% compared to a pandemic-induced 6.4% decline in 2020. According to Ali et al. [30], South Africa is expected to become the world’s leading producer of economic growth in the near future among the “BRICS economies (Brazil, Russia, India, China, and South Africa)”, due to rapid economic growth.
Energy is the lifeblood of the South African economy, and obtaining, processing, and disseminating energy commodities and services is a major enterprise that creates jobs and value across the economy. As a result, South Africa’s usage of nonrenewable energy sources such as fossil fuels (FF) has grown dramatically. In 2018, coal dominated the energy supply with 65% of the primary energy share; however, crude oil, renewable energy, natural gas, and nuclear energy accounted for 18%, 11%, 3%, and 2%, respectively, of South Africa’s energy supply (South African Energy Sector report, 2021) [31]. In addition to that, Figure 1 shows that fossil fuel energy consumption is the primary energy source in South Africa when compared to renewable energy consumption.
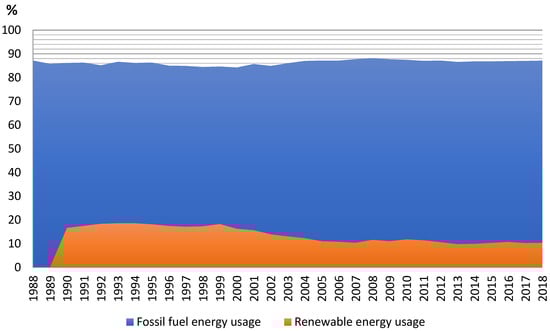
Figure 1.
Fossil fuel and renewable energy usage comparison in South Africa.
Source: Author
The South African real estate market has improved in recent years due to the increase in economic activity and the growth of urbanization. The real estate market became one of the strongest sectors in South Africa, despite subsequent lockdowns and uncertainties surrounding Coronavirus (COVID-19). In 2020, first-time buyers boosted and fueled the market, taking advantage of rate cuts and low-interest rates (South Africa Residential Real Estate Market, 2021) [32]. The real estate sector plays a critical role in its growth. Despite the economic damage caused by Coronavirus disease (COVID-19), the real estate sector potentially contributes ZAR191 billion, with a direct contribution of ZAR46 billion, to national income. Furthermore, increased spending and lending in the real estate market injects much-needed liquidity into the economy.
Our study advocates that the real estate market may influence carbon emissions via two channels: energy usage and sustainable growth. Household wealth and borrowing rates will benefit from a substantial recovery in the real estate sector, resulting in more investment and sustainable economic development. Many empirical research studies have shown that the real estate sector has a substantial influence on economic growth in this environment [28,33,34,35,36,37]. These studies show that when the real estate market improves, so do household spending and company investment, resulting in better economic growth rates. The considerable effect of the real estate market on economic activity will result in a surge in investment in this sector. As a result, non-renewable energy use increases, contributing to higher emissions.
The current study addresses a vacuum in the literature by filling it in three strategic ways based on the deficiencies identified in earlier empirical investigations. First, a handful of limited research studies have endeavored to explore the effect of the real estate market on environmental quality, such as those by Qashou et al. [28], who explored how the real estate industry in Turkey affected environmental quality, and Wei and Kong [29], who explored the influence of real estate development on environmental degradation in a “panel of 30 provinces of China” spanning data from 2000 to 2013. It is worth mentioning that none of the researchers have looked at how the real estate sector affects environmental quality in Africa. The primary distinction of the current study is that it evaluates the impact of South Africa’s real estate sector, the region’s biggest polluter, on environmental quality. As an indication of environmental quality, the research utilized emissions calculated in “metric tons per capita”. Additionally, the goal of the current study is to evaluate the impact of the real estate market on the degree of environmental quality using real income, renewable energy, and non-renewable energy for the data collected between 1988 and 2018. Second, the available empirical research has shown a methodological deficit. Several techniques, including “ARDL and Granger causality”, have been used in recent empirical research to examine the influence of renewable energy and economic growth on environmental quality. The “ARDL bootstrap model” is rarely utilized. As a result, the main objective of the current study is to provide fresh empirical evidence by employing a new ARDL cointegration approach. According to McNown et al. [38], the new “ARDL test” is preferred over classic Pesaran [39] “co-integration tests” due to its capability to foresee when resolving power and size constraint concerns, as well as other aspects that traditional co-integration tests do not address. Furthermore, this study uses “Zivot and Andrews [40] (ZA) and Clemente-Montaes-Reyes [41] (CMR)” to assess integration due to its advantage of taking into account the dates of “structural breaks”. Finally, this intends to highlight a number of key policy implications for government and policymakers in South Africa for sustainable development utilizing real estate market indexes, income, and non-renewable and renewable energy channels.
The following is a breakdown of the research structure: Section 2 of this paper delineates the analysis of the empirical literature review and the finding of existing gaps in the literature. Section 3 turns the spotlight on the methods that have been harnessed to accomplish the objectives of this study. Following the conclusion and policy implications in the final part, the empirical data and discussion are provided in Section 4.
2. Literature Review
2.1. Renewable Energy and Environmental Equality
The unequivocal desire to reduce CO2 emissions has prompted the need for clean sources of energy. Consequently, researchers from the field of energy and environmental economies have given it paramount consideration. The literature on “renewable energy (RE) and CO2 emissions” is getting much admiration day by day, notably in various developed economies. However, in South Africa, the literature is stranded. Various indicators have been employed to determine “environmental quality”, ranging from CO2 emissions to “ecological footprint (EF) and material footprint” which depict negative and positive indicators, respectively. The goal of this study is to see how renewable energy and the real estate market affect South Africa’s environmental quality. This necessitates further in-depth research on the issue. Panel data analysis and time series have both been used in studies to undertake research. For panel data analysis, see [42,43,44,45,46,47]. Between 1995 and 2011, Apergis et al. [48] examined the link between renewable energy and CO2 emissions in Sub-Saharan Africa (SSA). The outcome demonstrated that RE improves environmental quality. Similarly, da Silva et al. [39] in the case of 17 SSA, analyzed the determining factor of RE. The results revealed that “fossil fuel price, population growth, imports, and CO2 emissions” are the critical hurdles to RE use. Hu et al. [44], for 25 underdeveloped nations from 1996–2012, investigated the “role of trade in commercial service and RE in CO2 emissions”. The results indicated that RE decreases CO2 emissions. Furthermore, they went on to say that “trade in commercial services and use of RE can help these countries achieve green growth”. [49]. Bekun et al. [50] used a “Pooled Mean Group” (PMG) in the case of 16 European Union (EU) nations and established that RE is a vital mitigant of CO2 emissions. They further reiterated that when green energy sources are used, SDGs are attainable. Yazdi and Beygi [51] used the PMG between 1985 and 2015 for 25 African countries. The analysis indicated that RE reduces CO2 emissions, proving the validity of the Environmental Kuznets Curve (EKC) postulate. Additionally, Haldar and Sethi [52] probed the link between RE, GDP, and emissions in underdeveloped nations and affirmed the presence of the EKC postulated. For 25 SSA nations, Zoundi [53] found that RE decreased CO2 emissions. However, in the short and long term, the influence of RE is eclipsed by non-RE. A similar finding was affirmed by Inglesi-Lotz and Dogan [54], who used a “panel evaluation method robust to cross-sectional dependence” for 10 SSA nations from 1980 to 2011 to examine the impact of RE versus non-RE on emissions. Nathaniel and Iheonu [42] examined the influence of ‘renewable and non-renewable energy consumption’ on CO2 emissions for 19 African nations, using the “Augmented Mean Group (AMG)” for the time period 1990–2014. The outcome indicated that RE decreases emissions insignificantly, while non-RE increases CO2 emissions. Sahoo and Sethi [55] “explored the link between RE, non-RE, human capital, globalization, and natural resources on ecological footprint from 1990 to 2016, using the Westerlund cointegration method, Mean Group (MG), Augmented Mean Group (AMG) and Dynamic common correlated effects (DCCE) for developing countries”. The “Fully Modified Ordinary Least Square-FMOLS and Dynamic Ordinary Least Square-DOLS approaches” are used to test for robustness, as is the “Dumitrescu and Hurlin causality test”. The discoveries showed that non-RE reduces the quality of the environment while RE improves it. Xue et al. [56] examined the effects of RE use on the environmental footprints of four South Asian “fossil fuel-dependent nations: Bangladesh, India, Pakistan, and Sri Lanka using the panel cross-sectional dependency, slope heterogeneity, and structural break issues from 1990–2016. The results disclose that RE use increases ecological quality while non-RE declines it. Similarly, using the same method and variables in eight Asian nations, Sharma et al. [57] affirm that RE boosts environmental quality.
However, Jebli and Youssef [58] revealed that the use of RE increased emissions for five North African nations. Using 38 nations from the IEA from 1995 to 2015, Khan and Hou [59] applied panel analysis and affirmed that RE reduces the quality of the environment. Farhani et al. [60] studied the long-term impact of GDP and energy use on emissions by means of FMOLS, DOLS, and PMG for five “North African countries (Morocco, Algeria, Tunisia, Libya and Egypt” from 1971–2014. The analysis indicated that an expansion in energy usage creates a decline in environmental quality.
Ben Jebli et al. [43] used the data from 1980–2010 in the case of 24 SSA nations. They found a neutral causal association between RE and CO2 emissions. Furthermore, an inverse relationship was found, but it was insignificant. Nathaniel and Khan [61], in the case of the “Association of Southeast Asian Nations-ASEAN” nations found that RE usage does not affect the EFs of these nations. However, no RE was noticed driving EFs. Nathaniel et al. [62] studied the effects of RE and non-RE usage on EFs and affirmed that RE has a neutral link with EFs in the “Middle East and North Africa-MENA” nations as a whole. Thus, these studies suggested that promoting RE does not assure a decline in EF. Therefore, it is imperative to explore the association in various countries.
For time-series analysis, see [63]. Using the DOLS, FMOLS, and ARDL methods, Zhang et al. [64] investigated the impact of RE and non-RE use on emissions in Pakistan. The results confirmed that green energy has drastically reduced CO2 in Pakistan. Moreover, a similar study conducted by Majeed et al. [63] for Pakistan suggested the same findings as that of Zhang et al. [64]. In China, Chen et al. [65], using data from 1980 to 2014, found that RE use lessened the adverse effect of emissions there. Majeed et al. [63] used the “Non-Linear Autoregressive Distributed Lag Model-NARDL” in Pakistan and examined the link among “aggregate and disaggregate energy consumption and environmental quality”. They affirmed that only negative shocks have a considerable effect on EFs. On the contrary, the study of Menyah and Wolde-Rufael [66] for the United States revealed that RE use does not lead to a reduction in CO2 emissions. However, none of these studies employed the “bootstrap ARDL” to study the link between RE and emissions in South Africa.
2.2. Real Estate Market and Environmental Equality
The literature on the relationship between the real estate market and CO2 emissions is thin; only a few studies have been conducted [29,67,68]. This requires further investigation of the subject. Qashou et al. [28] investigated the influence of the real estate sector on Turkey’s CO2 emissions from 1988 to 2018, using the “Bootstrap Autoregressive Distributed Lag (BARDL)”. The study revealed that the real estate market reduces environmental quality in Turkey both in the short- and long-run. Wei1 and Kong, [29] “analyzed the effect of real estate investment on CO2 emissions, in 30 provinces, municipalities, and autonomous regions in China from 2000 to 2013”. The study suggested that increased real estate investment increases CO2 emissions. Furthermore, they highlighted that real estate investment (“residential house investment in provinces and eastern regions”) is more detrimental to emissions.
However, scholars have examined the link between environmental quality and other markets; for instance, Chen et al. [69] examined the “shadow price of CO2 of 38 double-digit-growth Chinese industrial sectors from 1980 to 2008” using the directional distance function. The outcome suggested that the fundamental values of the CO2 shadow price of all sectors tend to increase progressively with the light sector higher than the heavy sector”. Bai [70] also explored the association between industrial development and emissions in China between 1987 and 2008. The findings revealed that the development of “tertiary industry” raises the level of CO2 emissions in China. Samour et al. [24] assessed the influence of bank development on CO2 emissions in Turkey using ARDL. A positive association was found between emissions and bank development. Similarly, Tahir et al. [71], Isiksal and Joof [72], and Baloch et al. [73] confirm the same results.
2.3. Economic Growth and Environmental Quality
The link between growth and CO2 emissions has also been widely studied. Employing the “bootstrap panel unit root tests and cointegration techniques from 1981–2005 in the case of 12 MENA countries”, Arouri et al. [74] explored the link between GDP and CO2 emissions. The findings showed that CO2 emissions decreased even though the region showed high economic expansion. Al-mulali et al. [75] used FMOLS between 1980 and 2010 for 18 “South American nations”. The analysis showed an “inverted U-shape” relation between GDP and CO2, thus validating the “Environmental Kuznets curve hypothesis”. Song et al. [76] use “74 key environmental monitoring cities in China, using the vertical and horizontal grading method to construct comprehensive index of environmental quality” between 2005 and 2017 to examine the link between economic expansion and environmental quality. They concluded that deepening economic growth enhances environmental quality. Nathaniel et al. [77] used the “augmented mean group (AMG) and the common correlated effect mean group (CCEMG) in the case of Latin American and Caribbean countries (LACC) from 1990 to 201results confirm that economic expansion increases emissions. Nathaniel [78] explored the effect of economic complexity on EF and CO2 emissions using “heterogeneity and cross-sectional dependence in ASEAN countries between 1990–2016”. The results revealed that “economic complexity and economic growth raise CO2 emissions and EF”. Isiksal et al. [79] in Central Asia and Joof et al. [80] in BRICS countries affirmed similar results. Using the PMG on “Mexico, Indonesia, Nigeria, and Turkey (MINT)” countries between 1975 and 2010, Joof and Isiksal [81] explored the link among human capital, export diversification, economic growth, and CO2. The analysis suggests that economic growth and the quadratic term of GDP have an inverse effect on emissions in the long term but are not significant in the short run.
In China, Shahabaz et al. [82] employed the ARDL and found a bidirectional causation between CO2. Furthermore, they highlighted that GDP increases CO2 emissions. Mirza and Kanwal (2017) applied the “ARDL and VECM-Vector Error Correction Model” in Pakistan between 1971 and 2009. The findings suggested that CO2 and GDP have a feedback causal relationship. Adejumo [83] investigated the relationship between the environment and economic growth in Nigeria using the ARDL from 1970 to 2014. The analysis suggested that rainfall stimulates environmental quality and economic growth. Natural resources, on the other hand, reduce ecological quality while increasing economic expansion but decreasing per capita economic growth. Recently, [30,84,85,86,87,88,89,90,91,92,93] analyzed the linkage between economic growth and environmental quality in different countries. According to these empirical studies, economic growth has a significant impact on environmental quality.
Based on the literature discussed above, we made the following deductions or conclusions: only a few studies examine the link between the real estate market and CO2 emissions; Qashou et al. [28] explored how Turkey’s real estate industry affected environmental quality, and Wei and Kong [29] explored the influence of real estate development on environmental degradation in a “panel of 30 provinces of China” spanning data from 2000 to 2013. However, none of the researchers have looked at how the real estate sector affects environmental quality in Africa, specifically in South Africa, which is the largest CO2 emitter in the region.
3. Econometric Methodology
This study mainly aims to demonstrate the impact of the real estate sector, renewable and non-renewable energy utilization, and income on the degree of environmental quality in South Africa. The theoretical linkage among the focused variables is presented as follows:
in Equation (1) above, represents South Africa’s carbon emissions, and represents the real estate market index. GDP in USD (2010 = 100). represents the proportion of RE (“renewable energy utilization from the total energy utilization”). represents total non-RE (“non-renewable energy utilization such as coal, petroleum, gas, etc.”). The entire series was transformed into a natural logarithm. Figure 2 shows the time series plot of the series at the natural logarithm, indicating various economic fluctuations and policy changes in South Africa. The data examined in the study ranges from 1988 to 2018. Table 1 contains information on the targeted data’s origin and description.
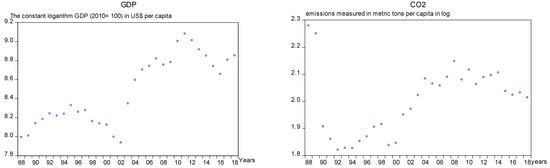
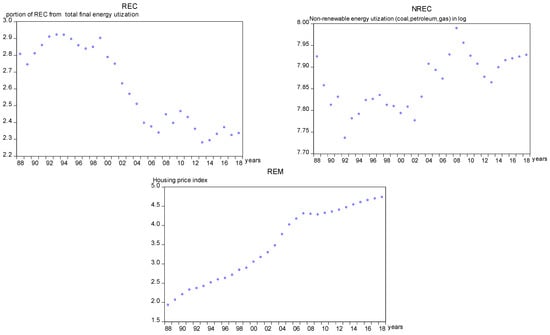
Figure 2.
Time series plot of the test series.

Table 1.
Shows the variables’ descriptions and data sources.
Stationarity and Co-Integration Tests
To evaluate the integration of the targeted variables, Zivot and Andrews [40] and Clemente–Montañes–Reyes [41] assessments have been used. The main advantages of the assessments used were that they took into account the dates of structural failure. There are focused variables that can be used to determine co-integration. The study utilized newly developed bootstrap (ARDL) testing. In this context, the and are utilized on lagged facets and dependent and independent facets, respectively, to distinguish between two degenerate cases. The case happens when the on all lagged variables is statistically significant, the on the lagged independent variable is statistically significant, but the t on the lagged dependent variable is statistically not significant. The second degenerate case occurs when the on all lagged focused variables is statistically significant, the on the lagged dependent variable is significant, while the on a lagged independent variable is statistically not significant. McNown et al. [38] introduced the “bootstrap ARDL technique” to overcome this issue by introducing an additional on the degenerate case , which in turn provides a robust finding of the integration status of the examined model. A new feature in bootstrap ARDL testing aims to address the stability issue. In this manner, just one chosen variable is accepted by the critical values of the conventional ARDL of the co-integration model as being endogenous. The crucial values in the recently created ARDL tests, however, permit all targeted variables to be endogenous. The level of co-integration among the focused variables will be approved if the values of (), (), and () exceed the “Critical Value-CV” as shown by the bootstrap approach. The ARDL test expression is as follows:
In Equation (2), denotes the error term; ∆ symbolizes the “first difference process”; is the constant expression; “, and ” denote coefficients in long-term and short-term variables; r means lags order; and is the ECM, “error correction term” reflecting speed of adjustment among variables.
To reinforce that empirical analysis is performed correctly, the final article employs some diagnostic evaluations, namely, the “Ramsey RESET” test; and the “Autoregressive Conditional Heteroskedasticity” (ARCH test, the normality test, and the Breush–Pagan–Godfrey heteroskedasticity test. Otherwise, the study utilized the “CUSUM and CUSUM-square” assessments to reinforce that the empirical analysis is tested correctly. To determine the short- and long-term causal relations that exist among the series, the “Granger causality” analysis is employed. In this analysis, () defines the variations of short-term level variations from long-run symmetry. The is presented in Equations (3–7):
where ∆ means the “first difference” and is the lagged ECT. Causation among series in the short run is assessed using the “Wald test (F) statistics”. Figure 3 depicts the structure of this paper’s econometric methodology.
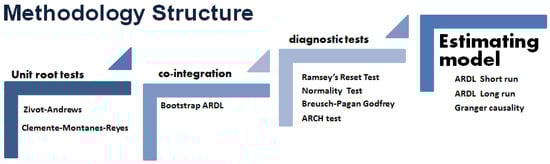
Figure 3.
Econometrics methodology structure.
4. Empirical Results and Discussion
In Table 2 and Table 3, the findings illustrate that CO2, REM, Y, REC, and NRE variables are integrated and stationary at the first order (. In this way, the study findings provide empirical evidence that study facets are “integrated at the I(1) level”. Hence, Equation (1) revealed the co-integration model. The findings of the “bootstrap ARDL model” are reported in Table 4. The statistical outcomes confirm that the values of the three co-integration assessments (the “, , and ”) are higher than the “bootstrap ARDL CVs”. These outcomes reinforce that the co-integration among the CO2, REM, Y, RE, and NRE is valid.
Table 2.
The findings of the ZA unit root assessment.
Table 3.
The CMR unit root test assessment.
Table 4.
The bootstrap ARDL co-integration approach.
The outcomes of the ARDL technique in the short- and long-runs are shown in Table 5. The results demonstrate that, at a 1% level of significance, the real estate market is positively and substantially linked with carbon emissions, both in the short- and long-term. In South Africa, a 1% increase in the real estate market is accompanied by a 0.113% reduction in carbon emissions over the medium term, but over the long run, it is detrimental to the environment. These outcomes are in line with Qashou et al. [28] and Wei and Kong [29]. In view of the results of this study, it is suggested that the stakeholders in South Africa, particularly the government, environmentalists, and policymakers consider green sources to build green houses that have a beneficial effect on the environment. Furthermore, investors must be encouraged to invest in real estate market projects that reduce environmental impacts while providing a standard living environment to the next generation.
Table 5.
ARDL test results.
Additionally, the data demonstrate a positive and significant relationship between real income and CO2 emissions across both short- and long-time periods, with a significance level of one in South Africa, where carbon emissions significantly rise by 2.221% and 1.131% over the course of the medium- and long-terms, respectively, for every 1% growth in real income. These results concur with those of [76]. The results of this do not validate the “Environmental Kuznets Curve (EKC) hypothesis” which presents an inverted U-shaped association between environment and income. The results suggest that South Africa must use clean energy sources to boost its economy without affecting the environment in the long- or short-run.
The results show that NREC is responsible for worsening the environmental quality of the study nation. This revealed that in the medium- and long-run, a 1% increase in NREC resulted in 1.992 and 1.445% increases in carbon emissions in South Africa, respectively. Accordingly, a 1% increase in RE reduced CO2 over the medium and long term by 0.252 and 0.44%, respectively. This outcome is in line with the inferences of [56,69]. According to the results, utilizing renewable energy sources is more climate-friendly as compared to non-renewable sources. Therefore, the South African authorities, particularly the government, must encourage clean and green projects such as solar systems, hydropower stations, and wind energy. Moreover, fossil fuel use must be taxed to discourage and minimize its usage. The industry must be funded and encouraged to shift the energy system away from fossil fuels and toward renewable energy sources.
According to in the results, the production functions change to a long-run equilibrium route, with a 5.1% speed adjustment from the short- to the long-run. The stability of the research model was verified using diagnostic tests, “CUSUM, and CUSUM square tests”. Table 4 displays the results of the diagnostic tests. The “Breush–Pagan–Godfrey heteroscedasticity test” results show that there is no autocorrelation, and the examined model is homoscedastic. Furthermore, the normality test ensures that the study model has a normal distribution, whereas the “Ramsey RESET test ” ensures that the model is stable and correct. Figure 4 and Figure 5 show the “CUSUM and CUSUM square tests”. According to Figure 4 and Figure 5, the model has been correctly built “when the green line falls inside the brown and green lines”.
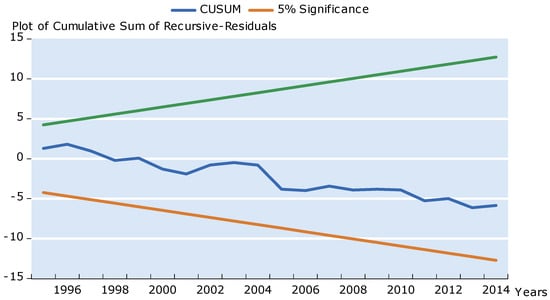
Figure 4.
Plot of CUSUM test.
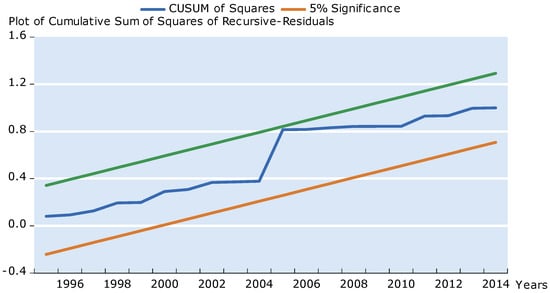
Figure 5.
Plot of CUSUM of squares test.
Using a cointegrated testing series, the VECM is employed in this work to assess the causal association. In order to promote green energy in “South Africa” for the long-term growth of energy, we may make some reasonable recommendations by examining the causal link between the components under examination. Table 6 shows that in the long-run, the South African real estate market, real income, usage of renewable and non-renewable energy, and carbon emissions are all causally related. Furthermore, the results suggest that in the short-term there is a one-way causal relationship between the examined variables (REM, Y, RE, NRE, and CO2). Additionally, the findings reveal a one-way causal relationship between the real estate market, REC, income, and NRE. These estimates show that the South African real estate industry has a significant impact on carbon emissions via NREC and real income channels. However, this result indicates that the real estate sector can have a significant influence on emissions. As a result, the current study proposes that authorities in South Africa should leverage real estate expansion to encourage renewable energy investment. The conclusions of the present study are critical for South Africa in terms of altering its energy mix by including more renewable energy sources.
Table 6.
Results of the Granger causality testing approach.
5. Conclusions and Policy Implications
The existing status of energy and wealth in South Africa, despite a fast-rising population, appears to be untenable, according to current empirical literature. The influence of economic expansion and energy usage on environmental quality is the focus of most studies in this field; the influence of the REM (real estate market) on environmental quality in South Africa is mostly neglected in the existing literature. In this light, the current study attempts to give a unique empirical analysis of the impact of real estate sector development and external debt on carbon emissions in South Africa by utilizing the newly developed “bootstrap autoregressive distributed lag (BARDL)” testing from 1988 to 2018. Empirical evidence suggests that renewable energy improves environmental quality in South Africa in both the long- and short-term. Furthermore, the results demonstrate that both immediately and over time, the real estate market has a detrimental effect on environmental quality. Similarly, real income and NRE are significantly positive and strongly correlated with CO2 emissions across both short- and long-time periods, at a 1% level of significance. In the short-term, the “Granger causality test” demonstrated a unidirectional causal relationship between the variables investigated (REM, Y, RE, NRE, and CO2). Additionally, the findings reveal a one-way causal relationship between the real estate market, REC, income, and NRE.
Having been a fossil fuel-rich nation, South Africa is largely dependent on non-RE energy, considering its catastrophic impacts on the environment. Previous and current findings, including this study, have affirmed that RE curtails air pollution (CO2 emissions). In order to protect its natural environment from depletion and enhance energy generation, it is incumbent on the South African authorities to aggressively invest in renewable energies such as solar, biogas, wave power, geothermal, and tidal power. This will ensure a decline in CO2 emissions, thereby leading to a sustainable environment and “green growth” [95]. It does not imply that South Africa is unaware of the benefits of RE and has not initiated programs to stimulate and invest in RE. In actuality, over the years, South Africa has heavily financed RE projects. For example, on the commercial use of biomass, the Minister of Finance in his budget speech of 2002 announced a reduction in the fuel levy on diesel produced from biomass by 30%. In addition, PetroSA has produced an environmentally friendly product called eco-diesel, which is already available around Cape Town [96]. Regardless of these promising investments, “the result is simply a tiny speck of good that suggests that movements towards green energy might just be a wild goose chase after all”. This indicates that formal policies are not sufficient for achieving clean energy. The culprits could be weak institutions [78].
The policy recommendations are, firstly, that as a fossil-dependent country, in order to protect its natural environment from depletion and improve energy generation, it is incumbent on the South African authorities to aggressively invest in renewable energies such as solar, biogas, wave power, geothermal, and tidal power. However, considering the infrastructural and technological constraints, improving the share of RE in the aggregate energy profile might not be easily attained by South Africa. Thus, in addition to promoting RE consumption, conventional ‘fossil fuels’ should be gradually replenished with comparatively fewer toxic substitutes. These can be considered "transitional fuels" until the dynamics limiting South Africa’s RE sector growth are overcome. Secondly, to initiate an epitomic transition from “carbon-intensive industries and energies to a service-oriented economy” thereby leading to changes in economic structure as a result and assisting in alleviating the problems of climate change. Thirdly, it is necessary to introduce technological innovations (carbon capture and storage, etc.) in the production and power sectors to uphold energy efficacy. Finally, economic reform by the government to initiate and uphold policies to “decarbonize the economy” and offer a favorable environment that stimulates clean energy. In order to achieve the “Sustainable Development Goals” South Africa should strengthen its institutions.
Furthermore, real estate was found to increase the level of emissions in South Africa. Real estate is perceived to impact the environment through various channels, notable among which are energy consumption, deforestation, and economic growth. Real estate development may trigger the cutting of trees or the destruction of forest resources, which can adversely affect the quality of the environment. Similarly, expansion of the real estate market may increase household consumption of non-renewable energy, thus decreasing air quality. Additionally, real estate augments investment growth, thereby stimulating economic activities; economic expansion raises energy use and eventually increases CO2 emissions.
In this regard, our analysis establishes numerous policy consequences for South African authorities. Primarily, authorities should initiate, promote, and guide real estate firms to invest in R&D to devise new expertise, methods, and strategies so as to lower environmental degradation in construction. Secondly, persuade, subsidize, and give incentives for firms to use ecologically friendly building materials. Third, promote the use of renewable energies (wind energy, solar energy, etc.). Fourthly, authorities should initiate taxonomy regulations to guide the investment decisions of real estate firms toward a sustainable environment. This can be achieved by creating awareness among stakeholders in the real estate industry, building and strengthening the law enforcement institutions, and developing the necessary capacity to enable them to assess the environmental impacts arising from the activities of this sector. Finally, authorities should initiate a policy coordination among all the facets of the economy, especially with the financial sector, which provides capital to the real estate industry, because low or zero-carbon emissions cannot be achieved in the absence of finance. In conclusion, South African firms should strive to develop “low-carbon buildings” by importing suitable technology that supports low emissions. Additionally, the building standards should factor in minimum pollution requirements.
However, the limitation of the current work is the unavailability of assessed data after 2018 for some selected valuables. Future empirical research should be devoted to assessing the effect of real estate markets on the level of ecological quality using other panel and time series methods. Areas for future research may include using a panel technique as well as dividing South Africa into different provinces or regions to explore the most impacted regions.
Author Contributions
Conceptualization, methodology, software, formal analysis, investigation, and writing and revision—original draft, A.J., A.S. and D.B.-L.; conceptualization and investigation, D.B.-L. and A.S.; data curation, writing and revision—original draft, F.J.; conceptualization, supervision, and writing—original draft, M.A. and T.T.; supervision and writing—original draft, D.B.-L. and A.J.; writing—review and editing, A.S. All authors have read and agreed to the published version of the manuscript.
Funding
This work is supported by the Hainan Provincial Social Science Project 2022, project number: HNSK (QN) 22-60.
Institutional Review Board Statement
Not applicable.
Informed Consent Statement
Not applicable.
Data Availability Statement
The data that support the findings of this study are available for sharing from the corresponding authors upon reasonable request.
Conflicts of Interest
The authors declare no conflict of interest.
References
- Liu, H.; Liang, S.; Cui, Q. The nexus between economic complexity and energy consumption under the context of sustainable environment: Evidence from the LMC countries. Int. J. Environ. Res. Public Health 2021, 18, 124. [Google Scholar] [CrossRef] [PubMed]
- Umar, M.; Farid, S.; Naeem, M.A. Time-frequency connectedness among clean-energy stocks and fossil fuel markets: Comparison between financial, oil and pandemic crisis. Energy 2022, 240, 122702. [Google Scholar] [CrossRef]
- Awan, A.; Alnour, M.; Jahanger, A.; Onwe, J.C. Do technological innovation and urbanization mitigate carbon dioxide emissions from the transport sector? Technol. Soc. 2022, 71, 102128. [Google Scholar] [CrossRef]
- Ozturk, I.; Ullah, S. Does digital financial inclusion matter for economic growth and environmental sustainability in OBRI economies? An empirical analysis. Resour. Conserv. Recycl. 2022, 185, 106489. [Google Scholar] [CrossRef]
- Jahanger, A.; Usman, M.; Murshed, M.; Mahmood, H.; Balsalobre-Lorente, D. The linkages between natural resources, human capital, globalization, economic growth, financial development, and ecological footprint: The moderating role of technological innovations. Resour. Policy 2022, 76, 102569. [Google Scholar] [CrossRef]
- Ibrahim, R.L.; Al-mulali, U.; Ozturk, I.; Bello, A.K.; Raimi, L. On the criticality of renewable energy to sustainable development: Do green financial development, technological innovation, and economic complexity matter for China? Renew. Energy 2022, 199, 262–277. [Google Scholar] [CrossRef]
- Huang, Y.; Haseeb, M.; Usman, M.; Ozturk, I. Dynamic association between ICT, renewable energy, economic complexity and ecological footprint: Is there any difference between E-7 (developing) and G-7 (developed) countries? Technol. Soc. 2022, 68, 101853. [Google Scholar] [CrossRef]
- IEA. World Energy Investment 2020; IEA: Paris, France, 2020; Available online: https://www.iea.org/reports/worldenergy-investment-2020 (accessed on 14 October 2022).
- Akram, R.; Umar, M.; Xiaoli, G.; Chen, F. Dynamic linkages between energy efficiency, renewable energy along with economic growth and carbon emission. A case of MINT countries an asymmetric analysis. Energy Rep. 2022, 8, 2119–2130. [Google Scholar] [CrossRef]
- Jahanger, A.; Usman, M.; Balsalobre-Lorente, D. Linking institutional quality to environmental sustainability. Sustain. Dev. 2022. [Google Scholar] [CrossRef]
- Yu, Y.; Radulescu, M.; Ifelunini, A.I.; Ogwu, S.O.; Onwe, J.C.; Jahanger, A. Achieving carbon neutrality pledge through clean energy transition: Linking the role of green innovation and environmental policy in E7 countries. Energies 2022, 15, 6456. [Google Scholar] [CrossRef]
- Farooq, S.; Ozturk, I.; Majeed, M.T.; Akram, R. Globalization and CO2 emissions in the presence of EKC: A global panel data analysis. Gondwana Res. 2022, 106, 367–378. [Google Scholar] [CrossRef]
- Usman, M.; Jahanger, A.; Makhdum, M.S.A.; Radulescu, M.; Balsalobre-Lorente, D.; Jianu, E. An empirical investigation of ecological footprint using nuclear energy, industrialization, fossil fuels and foreign direct investment. Energies 2022, 15, 6442. [Google Scholar] [CrossRef]
- Sadiq, M.; Kannaiah, D.; Khan, G.Y.; Shabbir, M.S.; Bilal, K.; Zamir, A. Does sustainable environmental agenda matter? The role of globalization toward energy consumption, economic growth, and carbon dioxide emissions in South Asian countries. Environ. Dev. Sustain. 2022, 1–20. [Google Scholar] [CrossRef]
- Jiang, T.; Yu, Y.; Jahanger, A.; Balsalobre-Lorente, D. Structural emissions reduction of China’s power and heating industry under the goal of “double carbon”: A perspective from input-output analysis. Sustain. Prod. Consum. 2022, 31, 346–356. [Google Scholar] [CrossRef]
- Jahanger, A.; Yu, Y.; Awan, A.; Chishti, M.Z.; Radulescu, M.; Balsalobre-Lorente, D. The impact of hydropower energy in malaysia under the EKC hypothesis: Evidence from quantile ARDL approach. SAGE Open 2022, 12, 21582440221109580. [Google Scholar] [CrossRef]
- Hasanov, F.J.; Khan, Z.; Hussain, M.; Tufail, M. Theoretical framework for the carbon emissions effects of technological progress and renewable energy consumption. Sustain. Dev. 2021, 29, 810–822. [Google Scholar] [CrossRef]
- Rai, S.K.; Rawat, A. Exploring the nexus between environment quality, economic development and industrialization in BRICS nations: The role of technological innovation and income inequality. Environ. Sci. Pollut. Res. 2022, 29, 37842–37853. [Google Scholar] [CrossRef]
- Li, X.; Ullah, S. Caring for the environment: How CO2 emissions respond to human capital in BRICS economies? Environ. Sci. Pollut. Res. 2022, 29, 18036–18046. [Google Scholar] [CrossRef]
- Ehigiamusoe, K.U.; Lean, H.H.; Babalola, S.J.; Poon, W.C. The roles of financial development and urbanization in degrading environment in Africa: Unravelling non-linear and moderating impacts. Energy Rep. 2022, 8, 1665–1677. [Google Scholar] [CrossRef]
- Güngör, H.; Abu-Goodman, M.; Olanipekun, I.O.; Usman, O. Testing the environmental Kuznets curve with structural breaks: The role of globalization, energy use, and regulatory quality in South Africa. Environ. Sci. Pollut. Res. 2021, 28, 20772–20783. [Google Scholar] [CrossRef]
- Lorember, P.T.; Jelilov, G.; Usman, O.; Işık, A.; Celik, B. The influence of renewable energy use, human capital, and trade on environmental quality in South Africa: Multiple structural breaks cointegration approach. Environ. Sci. Pollut. Res. 2021, 28, 13162–13174. [Google Scholar] [CrossRef] [PubMed]
- Sarkodie, S.A.; Adams, S. Renewable energy, nuclear energy, and environmental pollution: Accounting for political institutional quality in South Africa. Sci. Total Environ. 2018, 643, 1590–1601. [Google Scholar] [CrossRef] [PubMed]
- Akadiri, S.S.; Adebayo, T.S.; Riti, J.S.; Awosusi, A.A.; Inusa, E.M. The effect of financial globalization and natural resource rent on load capacity factor in India: An analysis using the dual adjustment approach. Environ. Sci. Pollut. Res. 2022, 29, 89045–89062. [Google Scholar] [CrossRef] [PubMed]
- Ozturk, I.; Acaravci, A. CO2 emissions, energy consumption and economic growth in Turkey. Renew. Sustain. Energy Rev. 2010, 14, 3220–3225. [Google Scholar] [CrossRef]
- Jahanger, A.; Chishti, M.Z.; Onwe, J.C.; Awan, A. How far renewable energy and globalization are useful to mitigate the environment in Mexico? Application of QARDL and spectral causality analysis. Renew. Energy 2022, 201, 514–525. [Google Scholar] [CrossRef]
- Jahanger, A.; Yu, Y.; Hossain, M.R.; Murshed, M.; Balsalobre-Lorente, D.; Khan, U. Going away or going green in NAFTA nations? Linking natural resources, energy utilization, and environmental sustainability through the lens of the EKC hypothesis. Resour. Policy 2022, 79, 103091. [Google Scholar] [CrossRef]
- Qashou, Y.; Samour, A.; Abumunshar, M. Does the real estate market and renewable energy induce carbon dioxide emissions? Novel evidence from Turkey. Energies 2022, 15, 763. [Google Scholar] [CrossRef]
- Wei, F.; Kong, Y. A Study of the Influence of Real Estate Development in China on CO2 Emissions. Emerg. Mark. Financ. Trade 2021, 55, 323–336. [Google Scholar] [CrossRef]
- Ali, M.; Tursoy, T.; Samour, A.; Moyo, D.; Konneh, A. Testing the impact of the gold price, oil price, and renewable energy on carbon emissions in South Africa: Novel evidence from bootstrap ARDL and NARDL approaches. Resour. Policy 2022, 79, 102984. [Google Scholar] [CrossRef]
- South African Energy Sector Report. Available online: https://www.energy.gov.za/files/media/explained/2021-South-African-Energy-Sector-Report.pdf (accessed on 12 October 2022).
- South Africa Residential Real Estate Market. 2021. Available online: https://housingfinanceafrica.org/app/uploads/2022/03/V4-National-Property-Market-Report-4-March-2022-FINAL-2.pdf (accessed on 12 October 2022).
- Liao, S. An ant colony algorithm model construction on the impact of urban real estate value and national economic changes. Sci. Program. 2022, 2022, 9616177. [Google Scholar] [CrossRef]
- Nguyen, M.L.T.; Bui, T.N. Stock market, real estate market, and economic growth: An ARDL approach. Invest. Manag. Financ. Innov. 2019, 16, 290. [Google Scholar]
- Filotto, U.; Giannotti, C.; Mattarocci, G.; Scimone, X. Residential mortgages, the real estate market, and economic growth: Evidence from Europe. J. Prop. Invest. Financ. 2018, 36, 552–577. [Google Scholar] [CrossRef]
- Korsakienė, R.; Tvaronavičienė, M. Processes of economic development: Case of Lithuanian real estate sector. Entrep. Sustain. Issues 2014, 1, 162–172. [Google Scholar] [CrossRef] [PubMed]
- Jahanger, A. Impact of globalization on CO2 emissions based on EKC hypothesis in developing world: The moderating role of human capital. Environ. Sci. Pollut. Res. 2022, 29, 20731–20751. [Google Scholar] [CrossRef] [PubMed]
- McNown, R.; Sam, C.Y.; Goh, S.K. Bootstrapping the autoregressive distributed lag test for cointegration. Appl. Econ. 2019, 50, 1509–1521. [Google Scholar] [CrossRef]
- Pesaran, M.H.; Shin, Y.; Smith, R.J. Bounds testing approaches to the analysis of level relationships. J. Appl. Econom. 2001, 16, 289–326. [Google Scholar] [CrossRef]
- Zivot, E.; Andrew, D. Further evidence of great crash, the oil price shock and unit root hypothesis. J. Bus. Econ. Stat. 1992, 10, 251–270. [Google Scholar]
- Clemente, J.; Montañés, A.; Reyes, M. Testing for a unit root in variables with a double change in the mean. Econ. Lett. 1998, 59, 175–182. [Google Scholar] [CrossRef]
- Nathaniel, S.P.; Iheonu, C.O. CO2 abatement in Africa: The role of renewable and non-renewable energy consumption. Sci. Total Environ. 2019, 679, 337–345. [Google Scholar] [CrossRef]
- Ben, J.M.; Ben Youssef, S.; Ozturk, I. The role of renewable energy consumption and trade: Environmental Kuznets curve analysis for sub-Saharan Africa countries. Afr. Dev. Rev. 2015, 27, 288–300. [Google Scholar]
- Hu, H.; Xie, N.; Fang, D.; Zhang, X. The role of renewable energy consumption and commercial services trade in carbon dioxide reduction: Evidence from 25 developing countries. Appl. Energy 2018, 211, 1229–1244. [Google Scholar] [CrossRef]
- Jahanger, A.; Usman, M. Investigating the role of information and communication technologies, economic growth, and foreign direct investment in the mitigation of ecological damages for achieving sustainable development goals. Eval. Rev. 2022. [Google Scholar] [CrossRef]
- Jahanger, A.; Yang, B.; Huang, W.-C.; Murshed, M.; Usman, M.; Radulescu, M. Dynamic linkages between globalization, human capital, and carbon dioxide emissions: Empirical evidence from developing economies. Environ. Dev. Sustain. 2022, 1–29. [Google Scholar] [CrossRef]
- Tugcu, C.T.; Ozturk, I.; Aslan, A. Renewable and non-renewable energy consumption and economic growth relationship revisited: Evidence from G7 countries. Energy Econ. 2012, 34, 1942–1950. [Google Scholar] [CrossRef]
- Apergis, N.; Jebli, M.B.; Youssef, S.B. Does renewable energy consumption and health expenditures decrease carbon dioxide emissions? Evidence for sub-Saharan Africa countries. Renew. Energy 2018, 127, 1011–1016. [Google Scholar] [CrossRef]
- Da Silva, P.P.; Cerqueira, P.A.; Ogbe, W. Determinants of renewable energy growth in Sub-Saharan Africa: Evidence from panel ARDL. Energy 2018, 156, 45–54. [Google Scholar] [CrossRef]
- Bekun, F.V.; Alola, A.A.; Sarkodie, S.A. Toward a sustainable environment: Nexus between CO2 emissions, resource rent, renewable and nonrenewable energy in 16-EU countries. Sci. Total Environ. 2019, 657, 1023–1029. [Google Scholar] [CrossRef]
- Yazdi, S.K.; Beygi, E.G. The dynamic impact of renewable energy consumption and financial development on CO2 emissions: For selected African countries. Energy Sources Part B Econ. Plan. Policy 2018, 13, 13–20. [Google Scholar] [CrossRef]
- Haldar, A.; Sethi, N. Effect of institutional quality and renewable energy consumption on CO2 emissions−an empirical investigation for developing countries. Environ. Sci. Pollut. Res. 2020, 28, 15485–15503. [Google Scholar] [CrossRef]
- Zoundi, Z. CO2 emissions, renewable energy and the Environmental Kuznets Curve, a panel cointegration approach. Renew. Sustain. Energy Rev. 2017, 72, 1067–1075. [Google Scholar] [CrossRef]
- Inglesi-Lotz, R.; Dogan, E. The role of renewable versus non-renewable energy to the level of CO2 emissions a panel analysis of sub- Saharan Africa’s Βig 10 electricity generators. Renew. Energy 2018, 123, 36–43. [Google Scholar] [CrossRef]
- Sahoo, M.; Sethi, N. The intermittent effects of renewable energy on ecological footprint: Evidence from developing countries. Environ. Sci. Pollut. Res. 2021, 28, 56401–56417. [Google Scholar] [CrossRef] [PubMed]
- Xue, L.; Haseeb, M.; Mahmood, H.; Alkhateeb, T.T.Y.; Murshed, M. Renewable energy use and ecological footprints mitigation: Evidence from selected South Asian economies. Sustainability 2021, 13, 1613. [Google Scholar] [CrossRef]
- Sharma, R.; Sinha, A.; Kautish, P. Does renewable energy consumption reduce ecological footprint? Evidence from eight developing countries of Asia. J. Clean. Prod. 2021, 285, 124867. Available online: https://mpra.ub.uni-muenchen.de/id/eprint/104277 (accessed on 14 October 2022). [CrossRef]
- Jebli, M.B.; Youssef, S.B. The role of renewable energy and agriculture in reducing CO2 emissions: Evidence for North Africa countries. Ecol. Indic. 2017, 74, 295–301. [Google Scholar] [CrossRef]
- Khan, I.; Hou, F. The dynamic links among energy consumption, tourism growth, and the ecological footprint: The role of environmental quality in 38 IEA countries. Environ. Sci. Pollut. Res. 2021, 28, 5049–5062. [Google Scholar] [CrossRef]
- Farhani, S.; Kadria, M.; Guirat, Y. The role of energy and environmental quality in exploring the economic sustainability: A new appraisal in the context of North African countries. Sustainability 2021, 13, 13990. [Google Scholar] [CrossRef]
- Nathaniel, S.; Khan, S.A.R. The nexus between urbanization, renewable energy, trade, and ecological footprint in ASEAN countries. J. Clean. Prod. 2020, 272, 122709. [Google Scholar] [CrossRef]
- Nathaniel, S.; Anyanwu, O.; Shah, M. Renewable energy, urbanization, and ecological footprint in the Middle East and North Africa region. Environ. Sci. Pollut. Res. 2020, 27, 14601–14613. [Google Scholar] [CrossRef]
- Majeed, M.T.; Tauqir, A.; Mazhar, M.; Samreen, I. Asymmetric effects of energy consumption and economic growth on ecological footprint: New evidence from Pakistan. Environ. Sci. Pollut. Res. 2021, 28, 32945–32961. [Google Scholar] [CrossRef]
- Zhang, S.; Liu, X.; Bae, J. Does trade openness affect CO2 emissions: Evidence from ten newly industrialized countries? Environ. Sci. Pollut. Res. 2017, 24, 17616–17625. [Google Scholar] [CrossRef] [PubMed]
- Chen, Y.; Wang, Z.; Zhong, Z. CO2 emissions, economic growth, renewable and nonrenewable energy production and foreign trade in China. Renew. Energy 2019, 131, 208–216. [Google Scholar] [CrossRef]
- Menyah, K.; Wolde-Rufael, Y. CO2 emissions, nuclear energy, renewable energy and economic growth in the US. Energy Policy 2010, 38, 2911–2915. [Google Scholar] [CrossRef]
- Zhang, L.; Yang, B.; Jahanger, A. The role of remittance inflow and renewable and non-renewable energy consumption in the environment: Accounting ecological footprint indicator for top remittance-receiving countries. Environ. Sci. Pollut. Res. 2022, 29, 15915–15930. [Google Scholar] [CrossRef] [PubMed]
- Yang, B.; Ali, M.; Hashmi, S.H.; Jahanger, A. Do income inequality and institutional quality affect CO2 emissions in developing economies? Environ. Sci. Pollut. Res. 2022, 29, 42720–42741. [Google Scholar] [CrossRef] [PubMed]
- Chen, S.Y.; Yan, F.S.; Wu, R.C. Capital deepening, productivity improvement and carbon dioxide emissions in China: An analysis of factors of industrial, regional and energy structure adjustment. Financ. Trade Econ. 2010, 12, 111–119. (In Chinese) [Google Scholar]
- Bai, W.G. Demonstrative analysis of China industry development and carbon dioxide let basing on VAR mode. Spec. Zone Econ. 2011, 3, 286–287. (In Chinese) [Google Scholar]
- Tahir, T.; Luni, T.; Majeed, M.T.; Zafar, A. The impact of financial development and globalization on environmental quality: Evidence from South Asian economies. Environ. Sci. Pollut. Res. 2021, 28, 8088–8101. [Google Scholar] [CrossRef] [PubMed]
- Xin, Y.; Li, H.; Adebayo, T.S.; Awosusi, A.A. Asymmetric linkage between biomass energy consumption and ecological footprints in top ten biomass-consuming nations. Econ. Res. -Ekon. Istraživanja 2022, 1–26. [Google Scholar] [CrossRef]
- Baloch, M.A.; Ozturk, I.; Bekun, F.V.; Khan, D. Modeling the dynamic linkage between financial development, energy innovation, and environmental quality: Does globalization matter? Bus. Strat. Environ. 2021, 30, 176–184. [Google Scholar] [CrossRef]
- Arouri, M.E.H.; Youssef, A.B.; M’Henni, H.; Rault, C. Energy consumption, economic growth and CO2 emissions in Middle East and North African countries. Energy Policy 2012, 45, 342–349. [Google Scholar] [CrossRef]
- Al-Mulali, U.; Tang, C.F.; Ozturk, I. Estimating the Environment Kuznets Curve hypothesis: Evidence from Latin America and the Caribbean countries. Renew. Sustain. Energy Rev. 2015, 50, 918–924. [Google Scholar] [CrossRef]
- Song, W.; Ye, C.; Liu, Y.; Cheng, W. Do China’s urban–environmental quality and economic growth conform to the environmental Kuznets curve? Int. J. Environ. Res. Public Health 2021, 18, 13420. [Google Scholar] [CrossRef]
- Nathaniel, S.P.; Nwulu, N.; Bekun, F. Natural resource, globalization, urbanization, human capital, and environmental degradation in Latin American and Caribbean countries. Environ. Sci. Pollut. Res. 2021, 28, 6207–6221. [Google Scholar] [CrossRef]
- Nathaniel, S.P. Economic complexity versus ecological footprint in the era of globalization: Evidence from ASEAN countries. Environ. Sci. Pollut. Res. 2021, 28, 64871–64881. [Google Scholar] [CrossRef]
- Awosusi, A.A.; Adebayo, T.S.; Altuntaş, M.; Agyekum, E.B.; Zawbaa, H.M.; Kamel, S. The dynamic impact of biomass and natural resources on ecological footprint in BRICS economies: A quantile regression evidence. Energy Rep. 2022, 1, 1979–1994. [Google Scholar] [CrossRef]
- Joof, F.; Samour, A.; Tursoy, T.; Ali, M. Climate change, insurance market, renewable energy, and biodiversity: Double-materiality concept from BRICS countries. Environ. Sci. Pollut. Res. 2022. [CrossRef] [PubMed]
- Adebayo, T.S.; Awosusi, A.A.; Uhunamure, S.E.; Shale, K. Race to achieving sustainable environment in China: Can financial globalization and renewable energy consumption help meet this stride? Sci. Prog. 2022, 105, 00368504221138715. [Google Scholar] [CrossRef]
- Shahbaz, M.; Khan, S.; Tahir, M.I. The dynamic links between energy consumption, economic growth, financial development and trade in China: Fresh evidence from multivariate framework analysis. Energy Econ. 2013, 40, 8–21. [Google Scholar] [CrossRef]
- Adejumo, O.O. Environmental quality vs. economic growth in a developing economy: Complements or conflicts. Environ. Sci. Pollut. Res. 2019, 27, 6163–6179. [Google Scholar] [CrossRef]
- Kartal, M.T.; Samour, A.; Adebayo, T.S.; Depren, S.K. Do nuclear energy and renewable energy surge environmental quality in the United States? New insights from novel bootstrap Fourier Granger causality in quantiles approach. Prog. Nucl. Energy 2023, 155, 104509. [Google Scholar] [CrossRef]
- Wang, C.; Raza, S.A.; Adebayo, T.S.; Yi, S.; Shah, M.I. The roles of hydro, nuclear and biomass energy towards carbon neutrality target in China: A policy-based analysis. Energy 2023, 262, 125303. [Google Scholar] [CrossRef]
- Kirikkaleli, D.; Adebayo, T.S.; Khan, Z.; Ali, S. Does globalization matter for ecological footprint in Turkey? Evidence from dual adjustment approach. Environ. Sci. Pollut. Res. 2021, 28, 14009–14017. [Google Scholar] [CrossRef]
- Zhang, L.; Li, Z.; Kirikkaleli, D.; Adebayo, T.S.; Adeshola, I.; Akinsola, G.D. Modeling CO2 emissions in Malaysia: An application of Maki cointegration and wavelet coherence tests. Environ. Sci. Pollut. Res. 2021, 28, 26030–26044. [Google Scholar] [CrossRef] [PubMed]
- He, X.; Adebayo, T.S.; Kirikkaleli, D.; Umar, M. Consumption-based carbon emissions in Mexico: An analysis using the dual adjustment approach. Sustain. Prod. Consum. 2021, 27, 947–957. [Google Scholar] [CrossRef]
- Bilal, A.; Li, X.; Zhu, N.; Sharma, R.; Jahanger, A. Green technology innovation, globalization, and CO2 emissions: Recent insights from the OBOR economies. Sustainability 2021, 14, 236. [Google Scholar] [CrossRef]
- Li, X.; Ozturk, I.; Majeed, M.T.; Hafeez, M.; Ullah, S. Considering the asymmetric effect of financial deepening on environmental quality in BRICS economies: Policy options for the green economy. J. Clean. Prod. 2022, 331, 129909. [Google Scholar] [CrossRef]
- Abbasi, K.R.; Hussain, K.; Haddad, A.M.; Salman, A.; Ozturk, I. The role of financial development and technological innovation towards sustainable development in Pakistan: Fresh insights from consumption and territory-based emissions. Technol. Forecast. Soc. Change 2022, 176, 121444. [Google Scholar] [CrossRef]
- Jahanger, A.; Usman, M.; Balsalobre-Lorente, D. Autocracy, democracy, globalization, and environmental pollution in developing world: Fresh evidence from STIRPAT model. J. Public Aff. 2021, 22, e2753. [Google Scholar] [CrossRef]
- Yang, B.; Jahanger, A.; Usman, M.; Khan, M.A. The dynamic linkage between globalization, financial development, energy utilization, and environmental sustainability in GCC countries. Environ. Sci. Pollut. Res. 2021, 28, 16568–16588. [Google Scholar] [CrossRef]
- WDI. World Bank Database. 2022. Available online: https://data.worldbank.org/ (accessed on 14 October 2022).
- Bekun, F.V.; Emir, F.; Sarkodie, S.A. Another look at the relationship between energy consumption, carbon dioxide emissions, and economic growth in South Africa. Sci. Total Environ. 2019, 655, 759–765. [Google Scholar] [CrossRef] [PubMed]
- IEA. IEA Bioenergy Report. 2022. Available online: https://www.ieabioenergy.com/wp-content/uploads/2022/04/IEA-Bioenergy-Annual-Report-2021.pdf (accessed on 14 October 2022).


Publisher’s Note: MDPI stays neutral with regard to jurisdictional claims in published maps and institutional affiliations. |
© 2022 by the authors. Licensee MDPI, Basel, Switzerland. This article is an open access article distributed under the terms and conditions of the Creative Commons Attribution (CC BY) license (https://creativecommons.org/licenses/by/4.0/).