Article

Straw Bale Building as a Low-Tech Solution: A Case Study in Northern Poland

by
Michał Pierzchalski
Faculty of Architecture, Warsaw University of Technology, ul. Koszykowa 55, 00-659 Warszawa, Poland
Sustainability 2022, 14(24), 16511; https://doi.org/10.3390/su142416511
Submission received: 22 September 2022 / Revised: 1 December 2022 / Accepted: 6 December 2022 / Published: 9 December 2022
(This article belongs to the Special Issue A Diversified Approach to Mitigate Crises in Urbanized Areas)

Abstract

:
There is a growing interest in low-tech technologies, drawing on the tradition of building with organic and unprocessed materials. One such technology is straw bale constructions. This paper presents an example of a timber-frame building in which straw bales were used as wall filling. The building is located in northern Poland and is a small, year-round single-family dwelling. Based on the available literature and experimental studies, it can be concluded that straw bale technology carries several potential threats related to the selected technology, quality of workmanship, and climatic conditions. The article describes the measurements of the air tightness of the building, the heat transfer coefficient U and the analysis of the humidity of straw walls. The study results confirm the risks related to the low air tightness of the building and the risk of water vapour condensation in the external partitions.

1. Introduction

Since the twentieth century, there has been a growing interest in building with on-site technologies from locally available and unprocessed materials, often waste from agricultural production. These include buildings made from rammed earth, hemp concrete, thermal insulation from plant fibres, or sheep’s wool and straw. Straw bales have been used in construction since the invention of the horse-powered agricultural baler in the 1870s [1,2]. The use of this type of material is associated with problems such as unusual construction processes (such as the preparation of straw bales on site), uncertainty about the repeatability of physical parameters, biological corrosion risk, fire risk, or animal pests that inhabit the building [1].
Straw is a waste product of agriculture and is used in various ways—shredded and left on the field, it is an excellent source of humus. It is also used as a substrate in animal husbandry, as a product for mushroom bedding producers, and finally, for burning for energy. Every year after the harvest, huge quantities of straw appear on the market. Tlaiji [3] indicates that in France, 10% of the straw produced yearly would be enough to insulate all the housing built yearly.
From 1990 to the present, increasing interest in straw bale technology can be seen [3]. The USA is the clear leader; among European countries, it is France and the UK. At least 1500 such buildings have been constructed in Europe, that is how many are listed in the European Straw Building Association’s database [4]. This type of building is also being constructed in Poland, but it is still a small number in relation to western European countries. The Polish government do not keep statistics on the construction of straw bale houses, so the exact number of such realisations is unknown.
Many European countries have associations that are enthusiastic about straw building, and they promote this technology and bring together people who are interested in building straw houses (e.g., the German Fasba [5], the French RFCP [6], or the Austrian ASBN [7]). Thanks to these and similar organisations, technical studies of straw elements are carried out. The organisations are also involved in activities to regulate this area of construction and to develop technical specifications for straw and straw-building products. In Poland, such organisations are the Ogólnopolskie Stowarzyszenie Budownictwa naturalnego (OSBN) [8] and the Foundation Cohabitat [9]. In Poland, legal issues regarding straw bale construction have not been regulated.
Straw bales can be used as non-structural thermal insulation (structural infill) and load-bearing structures [10]. The second solution is advantageous as huge amounts of structural timber can be saved [2]. This study will analyse a building using a non-load-bearing straw bale.
When designing the building and selecting the heating installations, it is necessary to perform a projected energy performance. One of the input elements is the heat transfer coefficient (U-value). It is, therefore, essential to determine this parameter correctly at the design stage. Compressed straw can achieve different thermal conductivity coefficients λ. This factor is influenced by the type of grain, arrangement of stalks along heat fluxes, and compression (density of the straw bales) [3,11]. As the density increases, the thermal conductivity decreases until it reaches a certain value, after which it stabilises and then starts to increase [11]. Table 1 below summarises the thermal conductivity coefficients of straw bales based on publications by various authors.
Other physical parameters of the straw bales are summarised in Table 2.
The energy standard of a building depends, among other things, on the quality and parameters of external partitions. Therefore, the U factor, the occurrence of thermal bridges inside the partitions, air tightness, and the humidity level inside the walls are of key importance. Moisture in the walls reduces the thermal resistance of insulating materials and increases the risk of mould. In the case of buildings made of natural materials such as straw and clay, the use of vapour-barrier films or OSB boards to reduce diffusion does not seem to be friendly from the point of view of the future inhabitant. That is why it is worth trying to build walls made of straw and clay open to diffusion. However, research shows that this can be risky due to the possibility of condensation and the risk of mould growth. Such a risk was described by Latif [28], Pihelo [29], and in the case of straw bale: Straube [30], Pritchard [1], Douzane [18], Marques [31], Bennett [32], Langmans [33], Robinson [34], and Bronsema [35]
The purpose of the research is to verify theoretical and design assumptions using an existing building. This article presents research carried out on an existing straw bale building, built in 2020. The author measured the wall’s heat transfer coefficient U-value, the humidity inside the wall, and the air tightness of the building. Similar studies of existing residential buildings inhabited by residents were performed by Douzane [18] and Ashour [36]. Douzane et al. studied a wood-framed building filled with straw bales that was built in France. Laboratory and in situ tests of the thermal conductivity of the walls and hygrothermal properties (temperature and relative humidity) were performed. Parameters related to indoor comfort were also analysed [18]. Ashour et al. studied a timber-framed building with straw bale infill, which was built in Germany. The experimental work included compression tests, moisture content, the thermal stability of bales, and the pH of straw [36].
The cases mentioned concerned buildings located in warmer climates with a lower number of heating degree days (HDD) (France—Somme Department: 2608, Germany—Bayern: 3359 compared to Poland—Olsztynski Region: 3713 [37]). Condensation of water vapour can be more problematic in climates with lower winter temperatures. In addition, the aforementioned moisture analyses of buildings in France and Germany took into account the relative humidity directly, and in this study, the water content analysis was used using the Krick’s formula [26] based on the Brunauer–Emmett–Teller (BET) theory. The present research work indicates that the in situ measured parameters may deviate from the design assumptions. These factors may be associated with a higher energy demand than assumed and may be a risk associated with mould growth inside the external walls. The study’s main aim is to verify the theoretical and design assumptions made in reality on an existing building.

2. Materials and Methods

The object of the research is a building constructed in the village of Zyndaki in the Warmińsko-Mazurskie Voivodeship in northern Poland. The building is a single-family dwelling which can be used all year round. The building is shown in Figure 1.
The total usable area in the building is 58.45 m2, and the floor area is 78.53 m2. The usable area is calculated in accordance with the Polish Standard PN-ISO 9836: 2022-07, in which the usable area does not include the area where the height is less than 1.4 m and is reduced by 50% of the area if the height is from 1.4–2.2 m. The living room is a two-storey room with a height of 3.2 to 4.7 m. The layout of the rooms is shown in the plans in Figure 2 and Figure 3, the cross-section of the building and the detail of the straw bale wall is shown in Figure 4.
For buildings used irregularly, such as holiday homes, straw bale technology is better than the most commonly used masonry technology in Poland. This is because it takes a relatively long time for the perceptible temperature to stabilise after a prolonged period of absence. The house used in this study is situated in the open on a small hill—this location exacerbates the effect of wind on the building’s performance.The building’s structure is based on double-beam timber columns spaced at intervals of 62 cm. The building structure can be seen in Figure 5.
Wheat straw bales were placed between the structural posts of the walls and compressed on-site with straps and tensioners. The walls were then plastered on both sides with clay, which was obtained on-site. The process of stacking the straw can be seen in Figure 6, and the plastering with clay can be seen in Figure 7.
The making of the straw bale infill and the plastering with clay was done by unskilled workers—the author of this article, family, and friends. The research attempted to verify that the calculation assumptions made for the following were met in practice:
  • Heat transfer coefficient of external walls U-value;
  • Analysis of condensation inside the envelope;
  • Airtightness of the building.

2.1. Heat Transfer Coefficient of External Walls

The U-value of walls made with straw bale technology can be calculated using data from literature or as a result of measurements of the actual partition. The most accurate measurements can be obtained from tests in a laboratory. In situ measurements can also be made, but these tests can be subject to errors and may not be sufficiently accurate. However, in situ testing has the benefit of testing an actual wall made on-site with available technologies. A determination of the thermal conductivity coefficient U can be obtained from the literature. During the preparation of the building design, the thermal conductivity coefficient λ = 0.08 (W/(mK)) was assumed for straw bales [15,20,22,25]. A partition consisting of the following layers (from the outside) was assumed for the calculations:
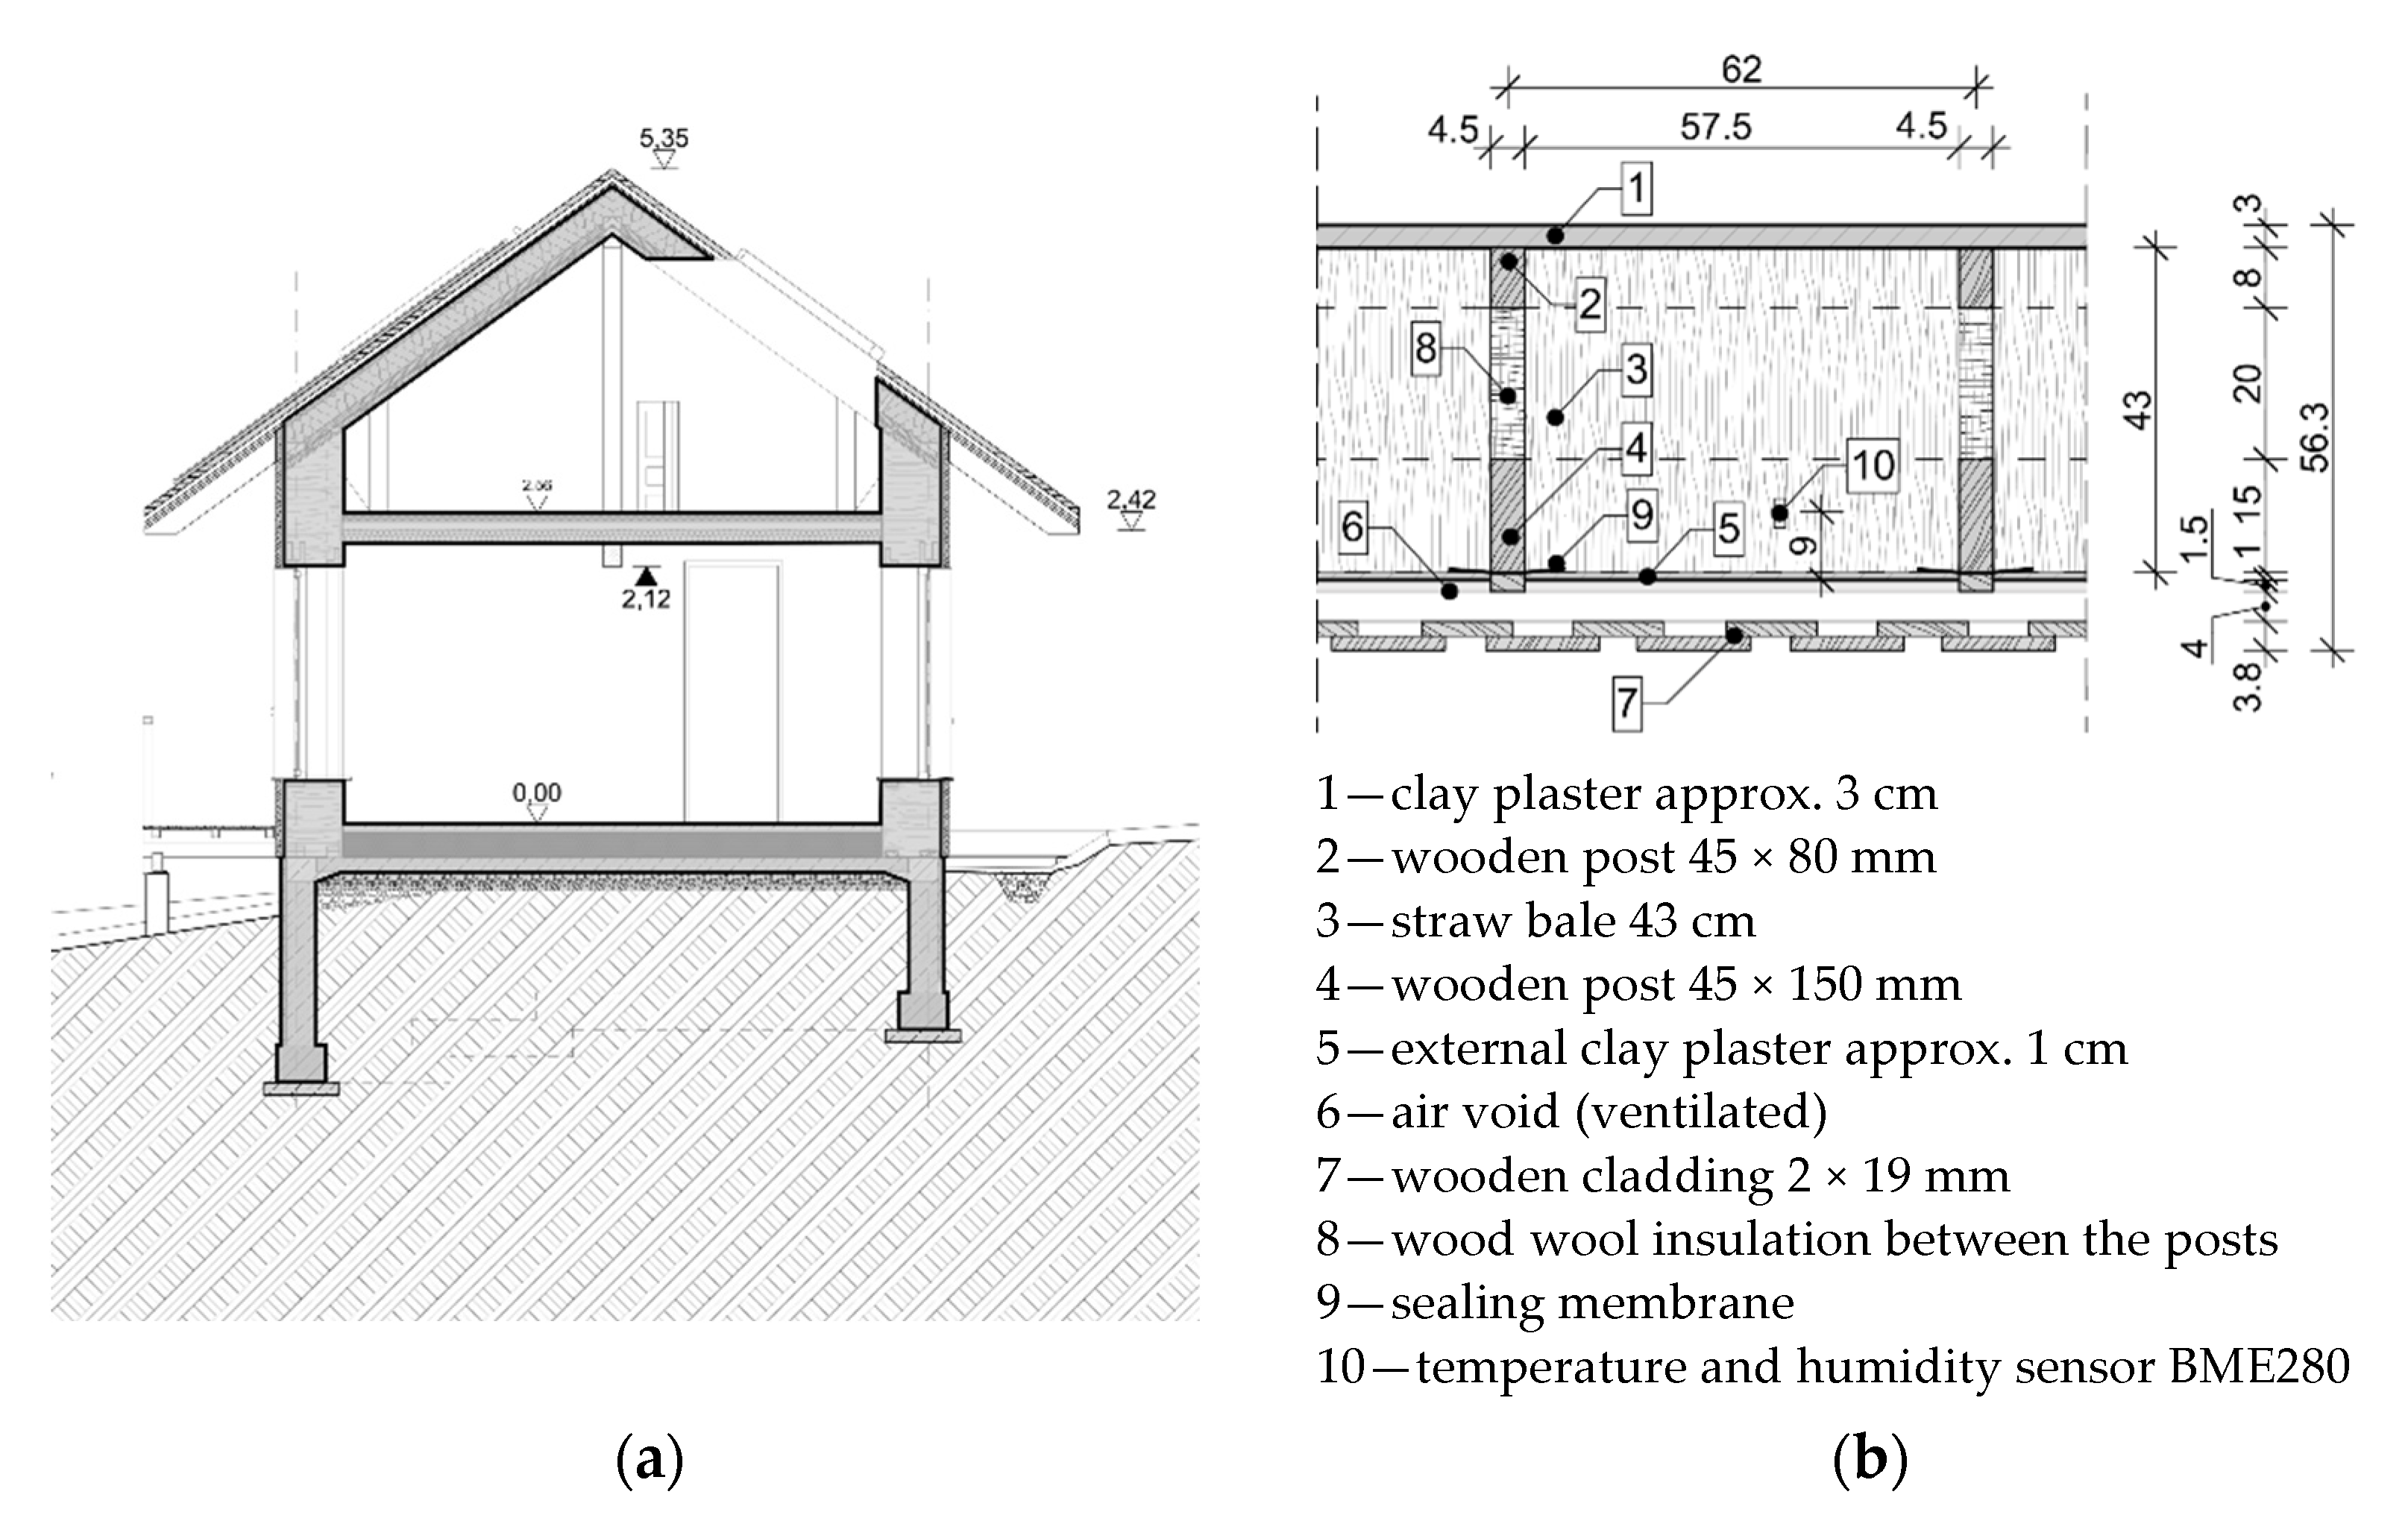
  • 1.9 cm timber cladding (not included in the U-value calculation).
  • Ventilation void 4 cm (not included in U-value calculations).
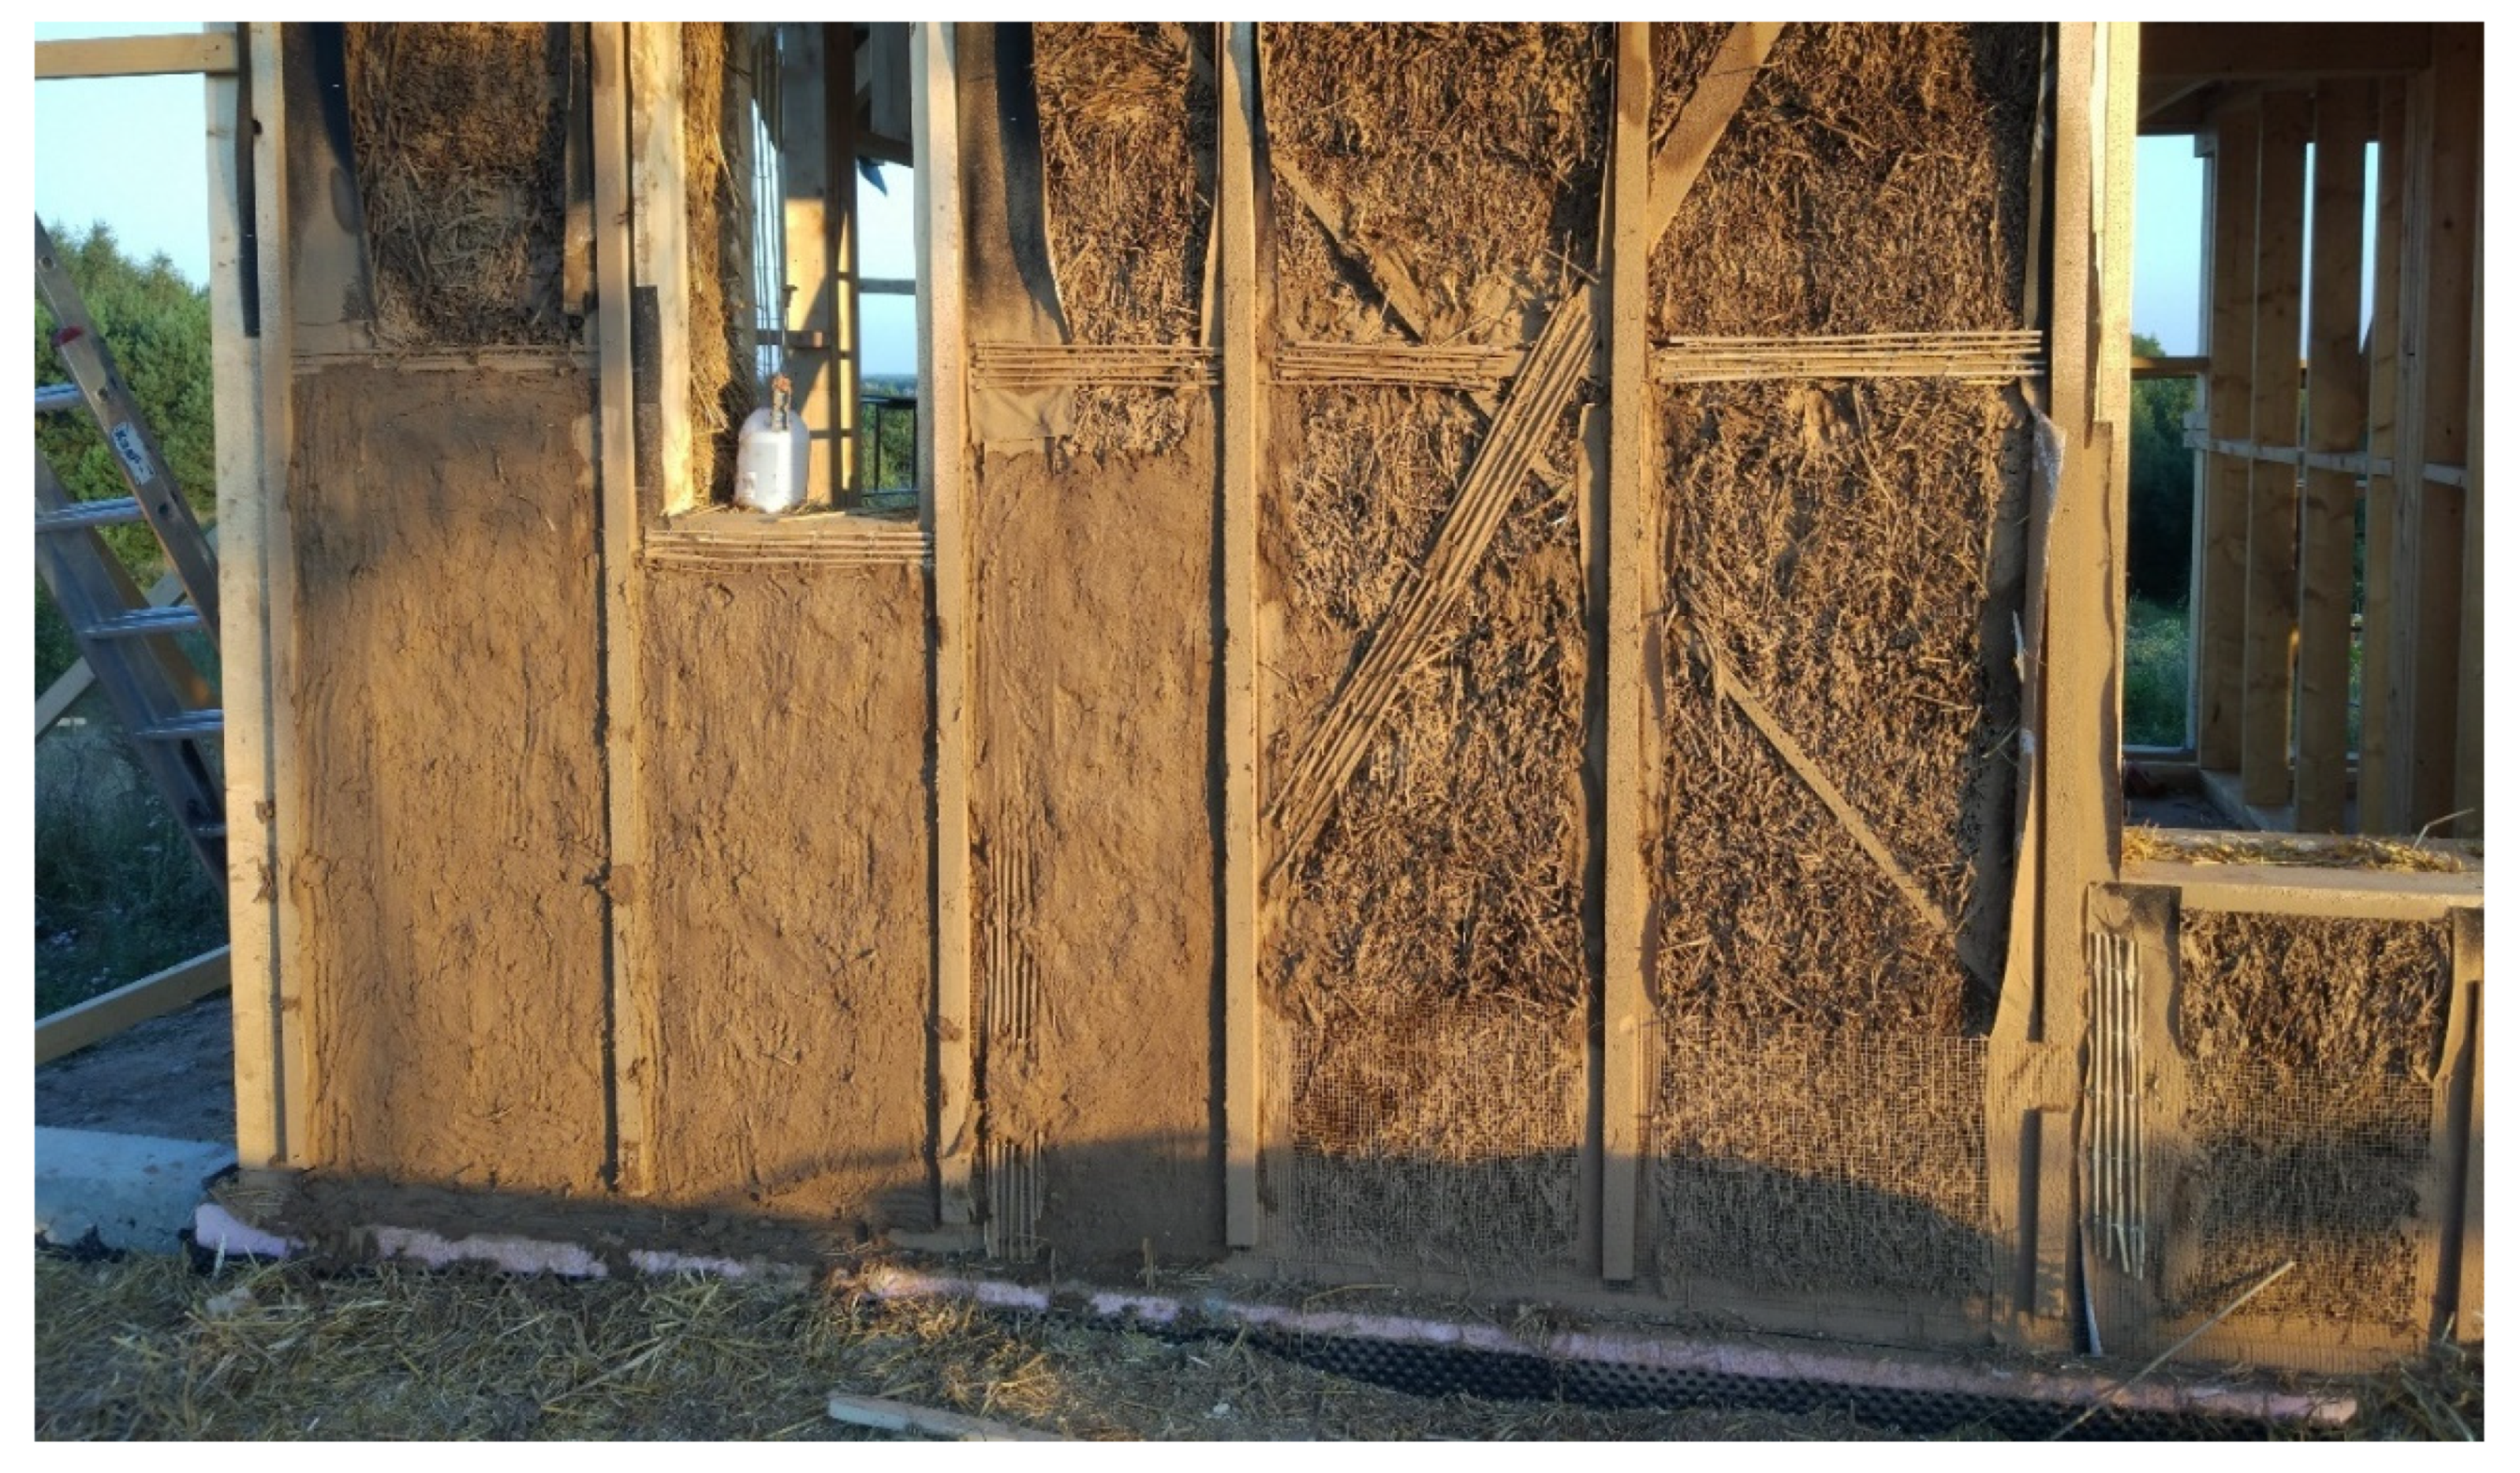
  • Clay plaster 1 cm.
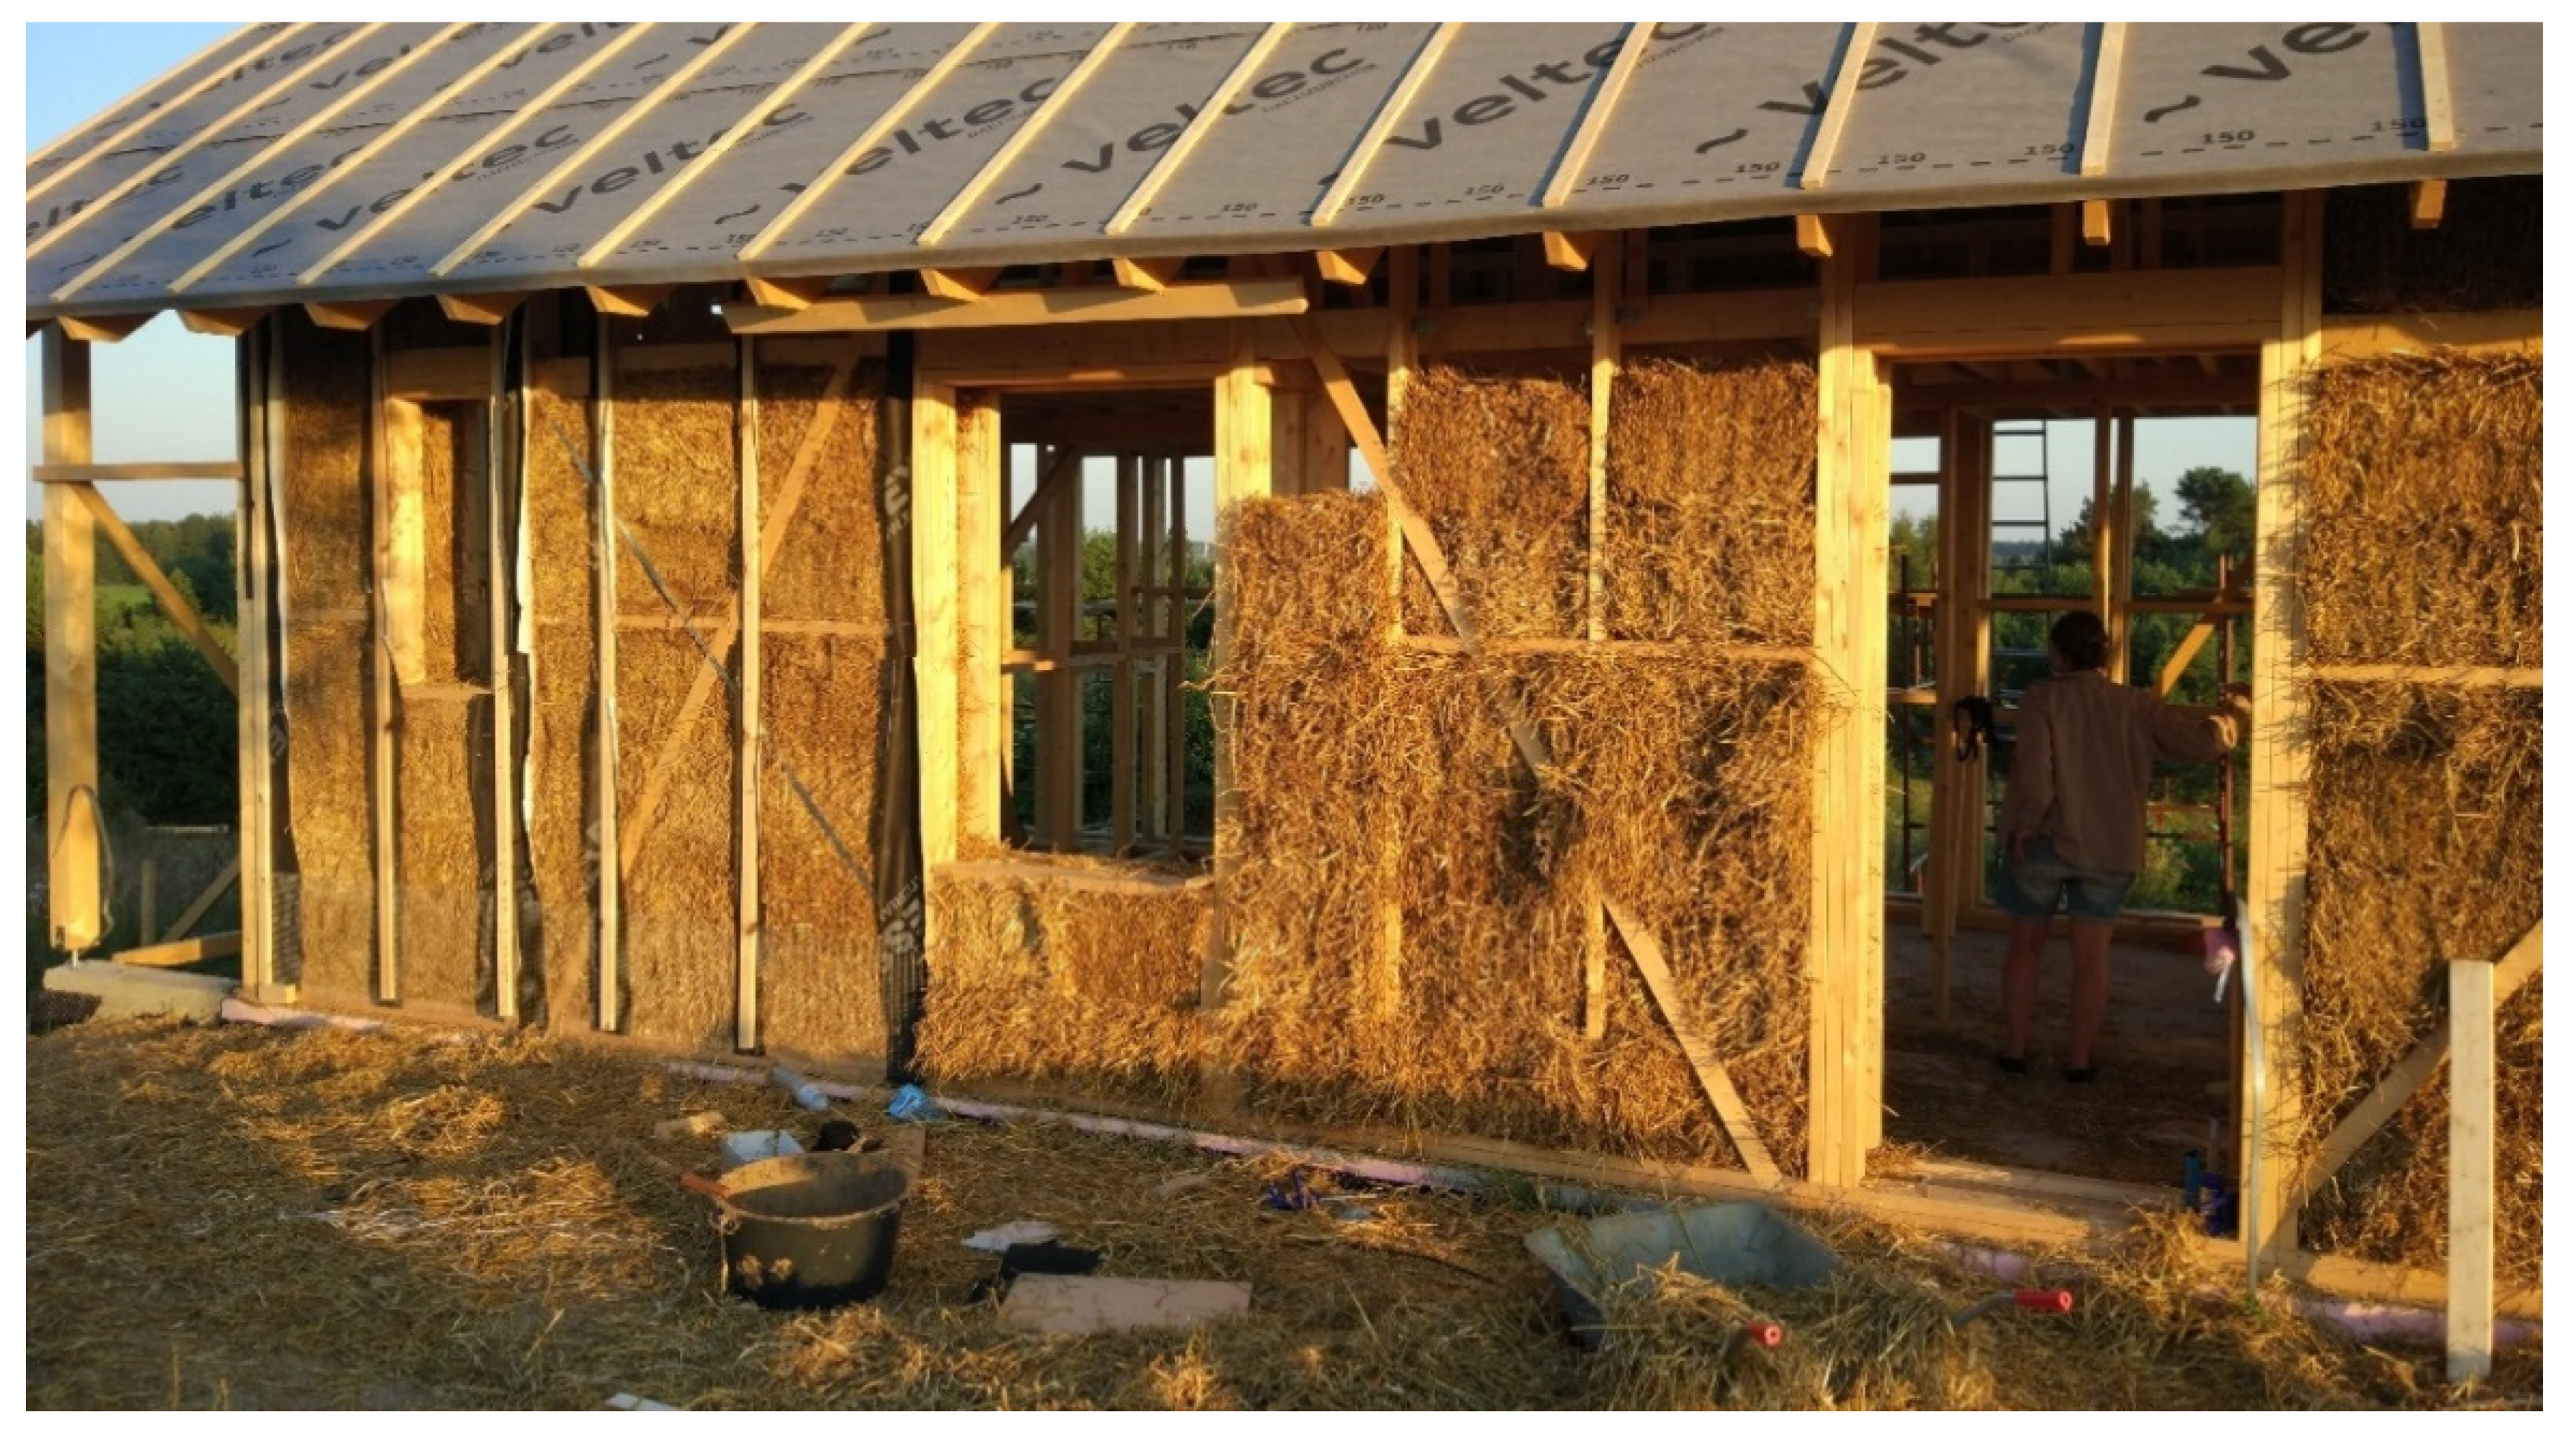
  • 4.5 × 15 cm and 4.5 × 8 cm double branch posts every 62 cm (between the axes), between straw bales 43 cm thick (along the wall). Across the wall, between the posts, there is a thermal insulation made of wood wool (λ = 0.038 W/mK).
  • Clay plaster 3–4 cm.
  • All layers of the wall are shown in Figure 4b.
The calculated heat transfer coefficient is U = 0.18 [W/m2K].
To verify the actual coefficient, in situ measurements were taken. Measurements were taken using the gSKIN greenTEG kit:
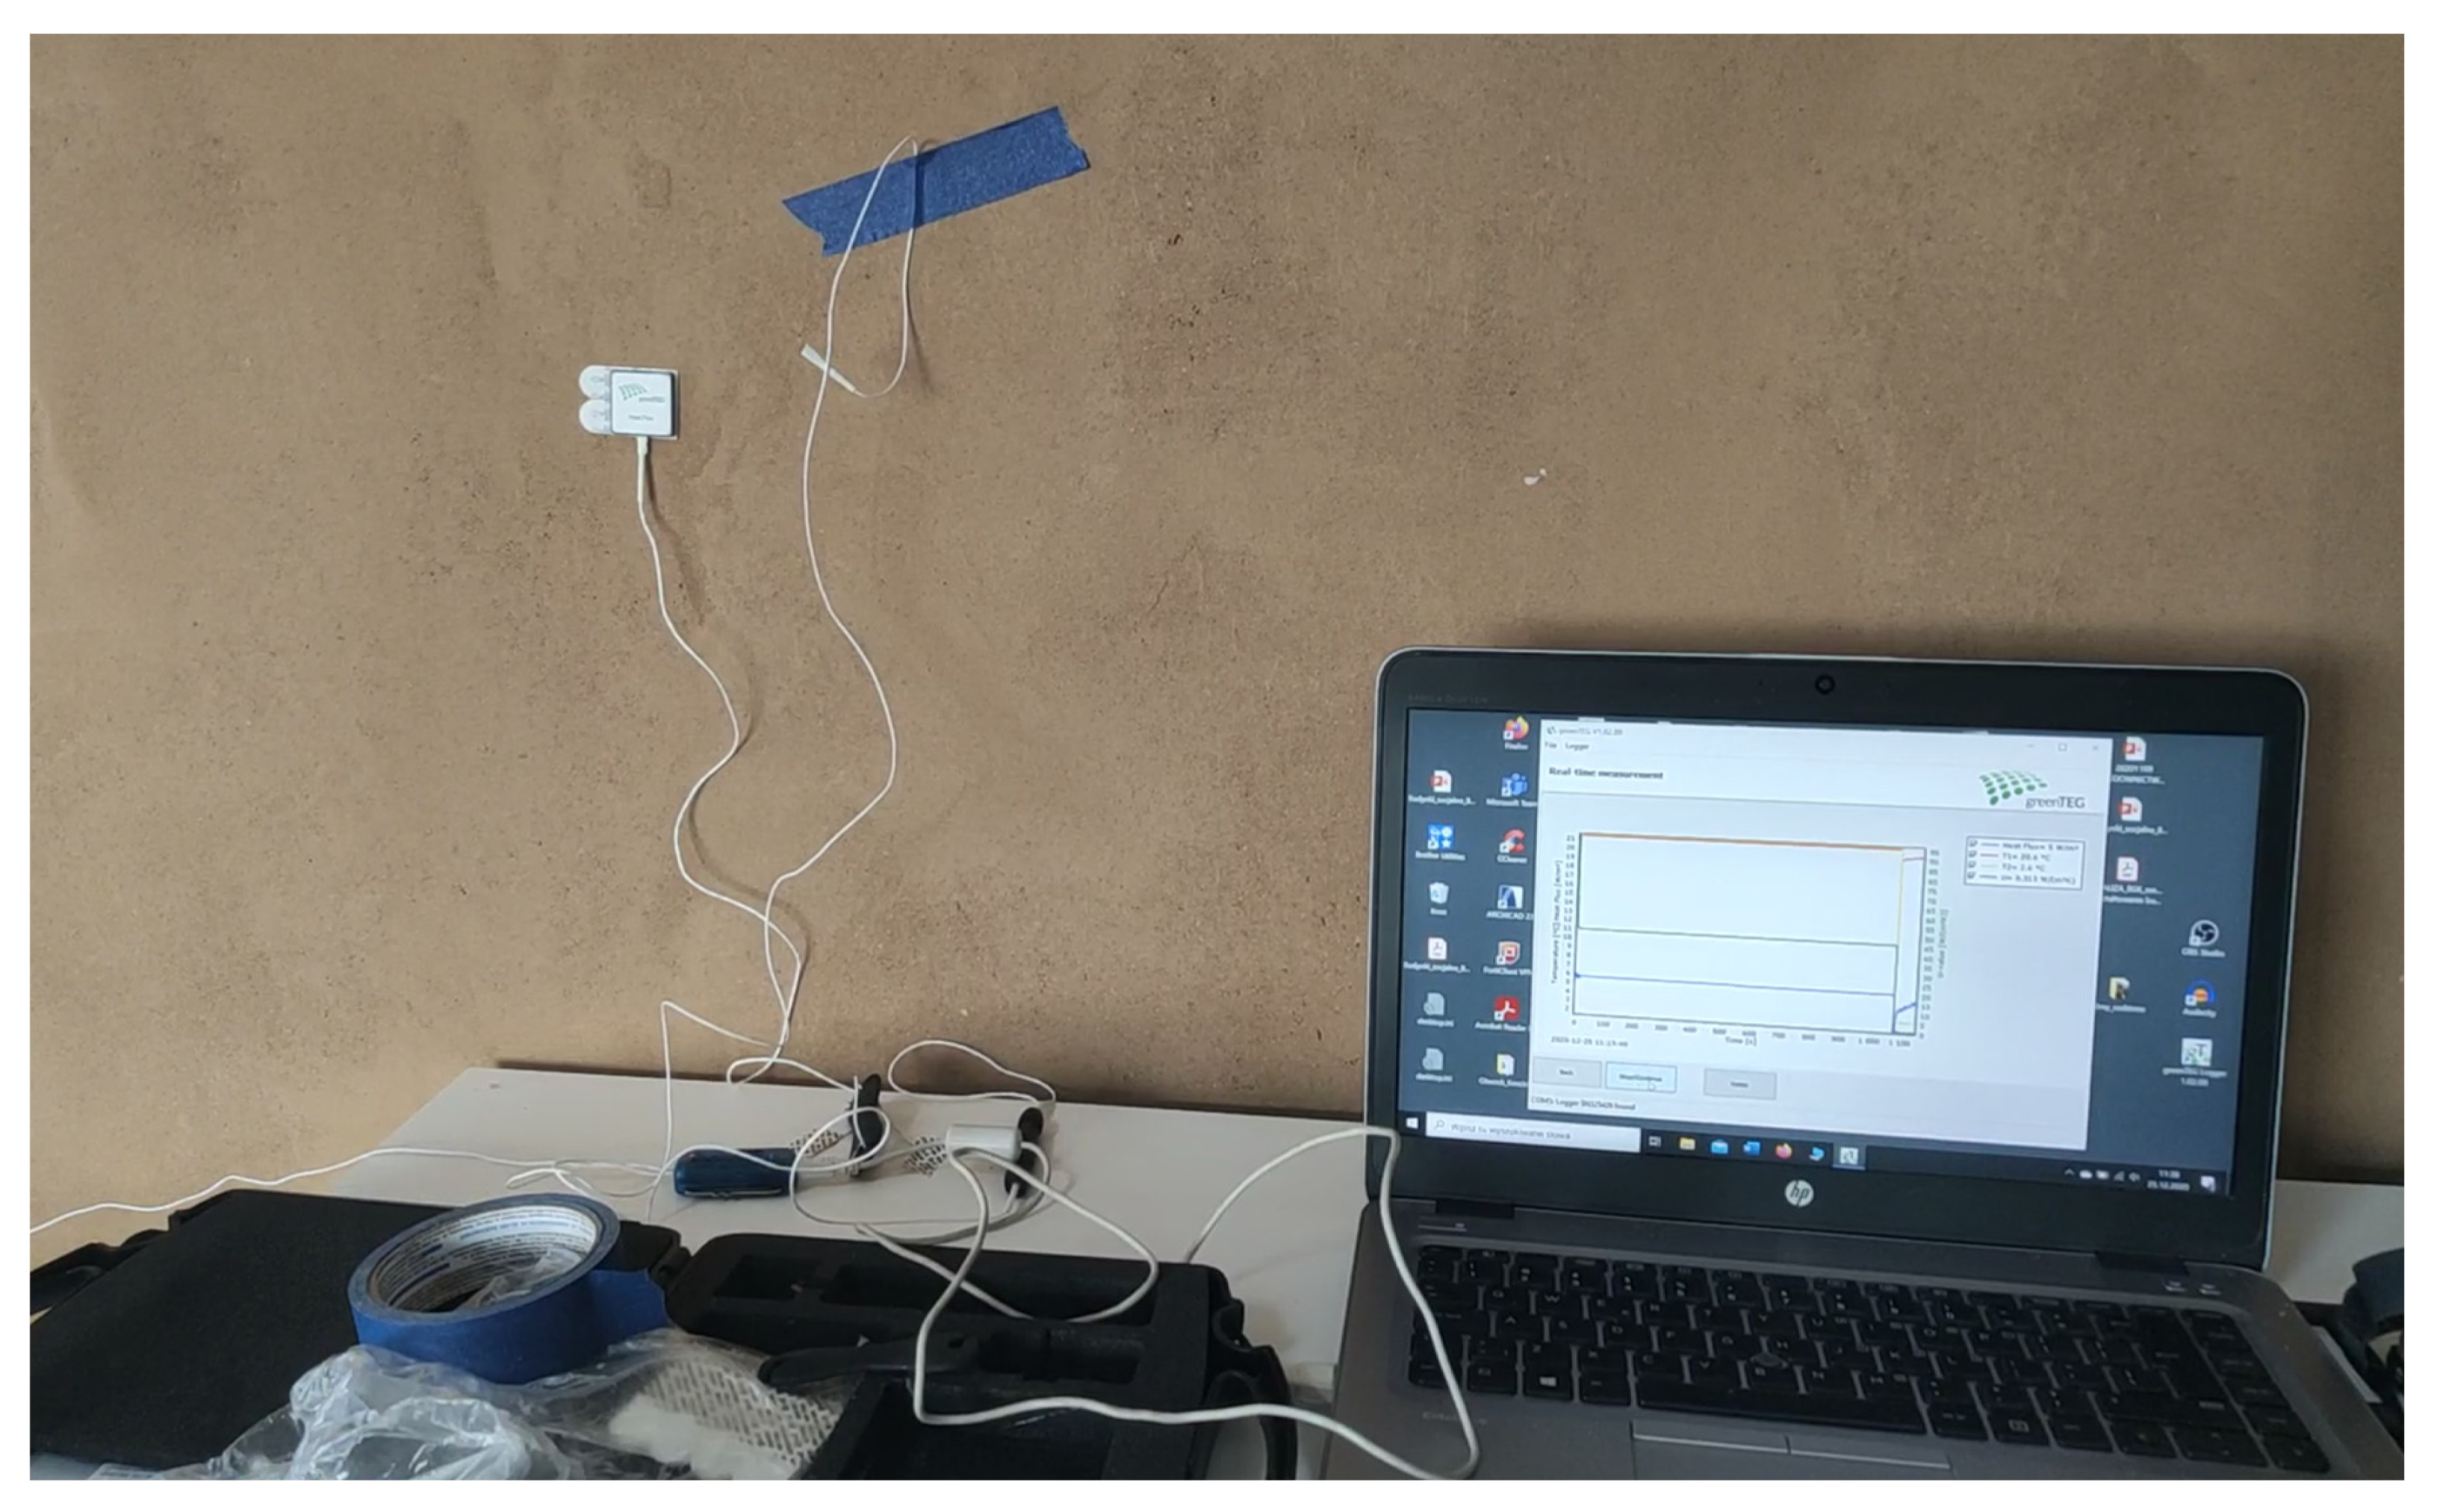
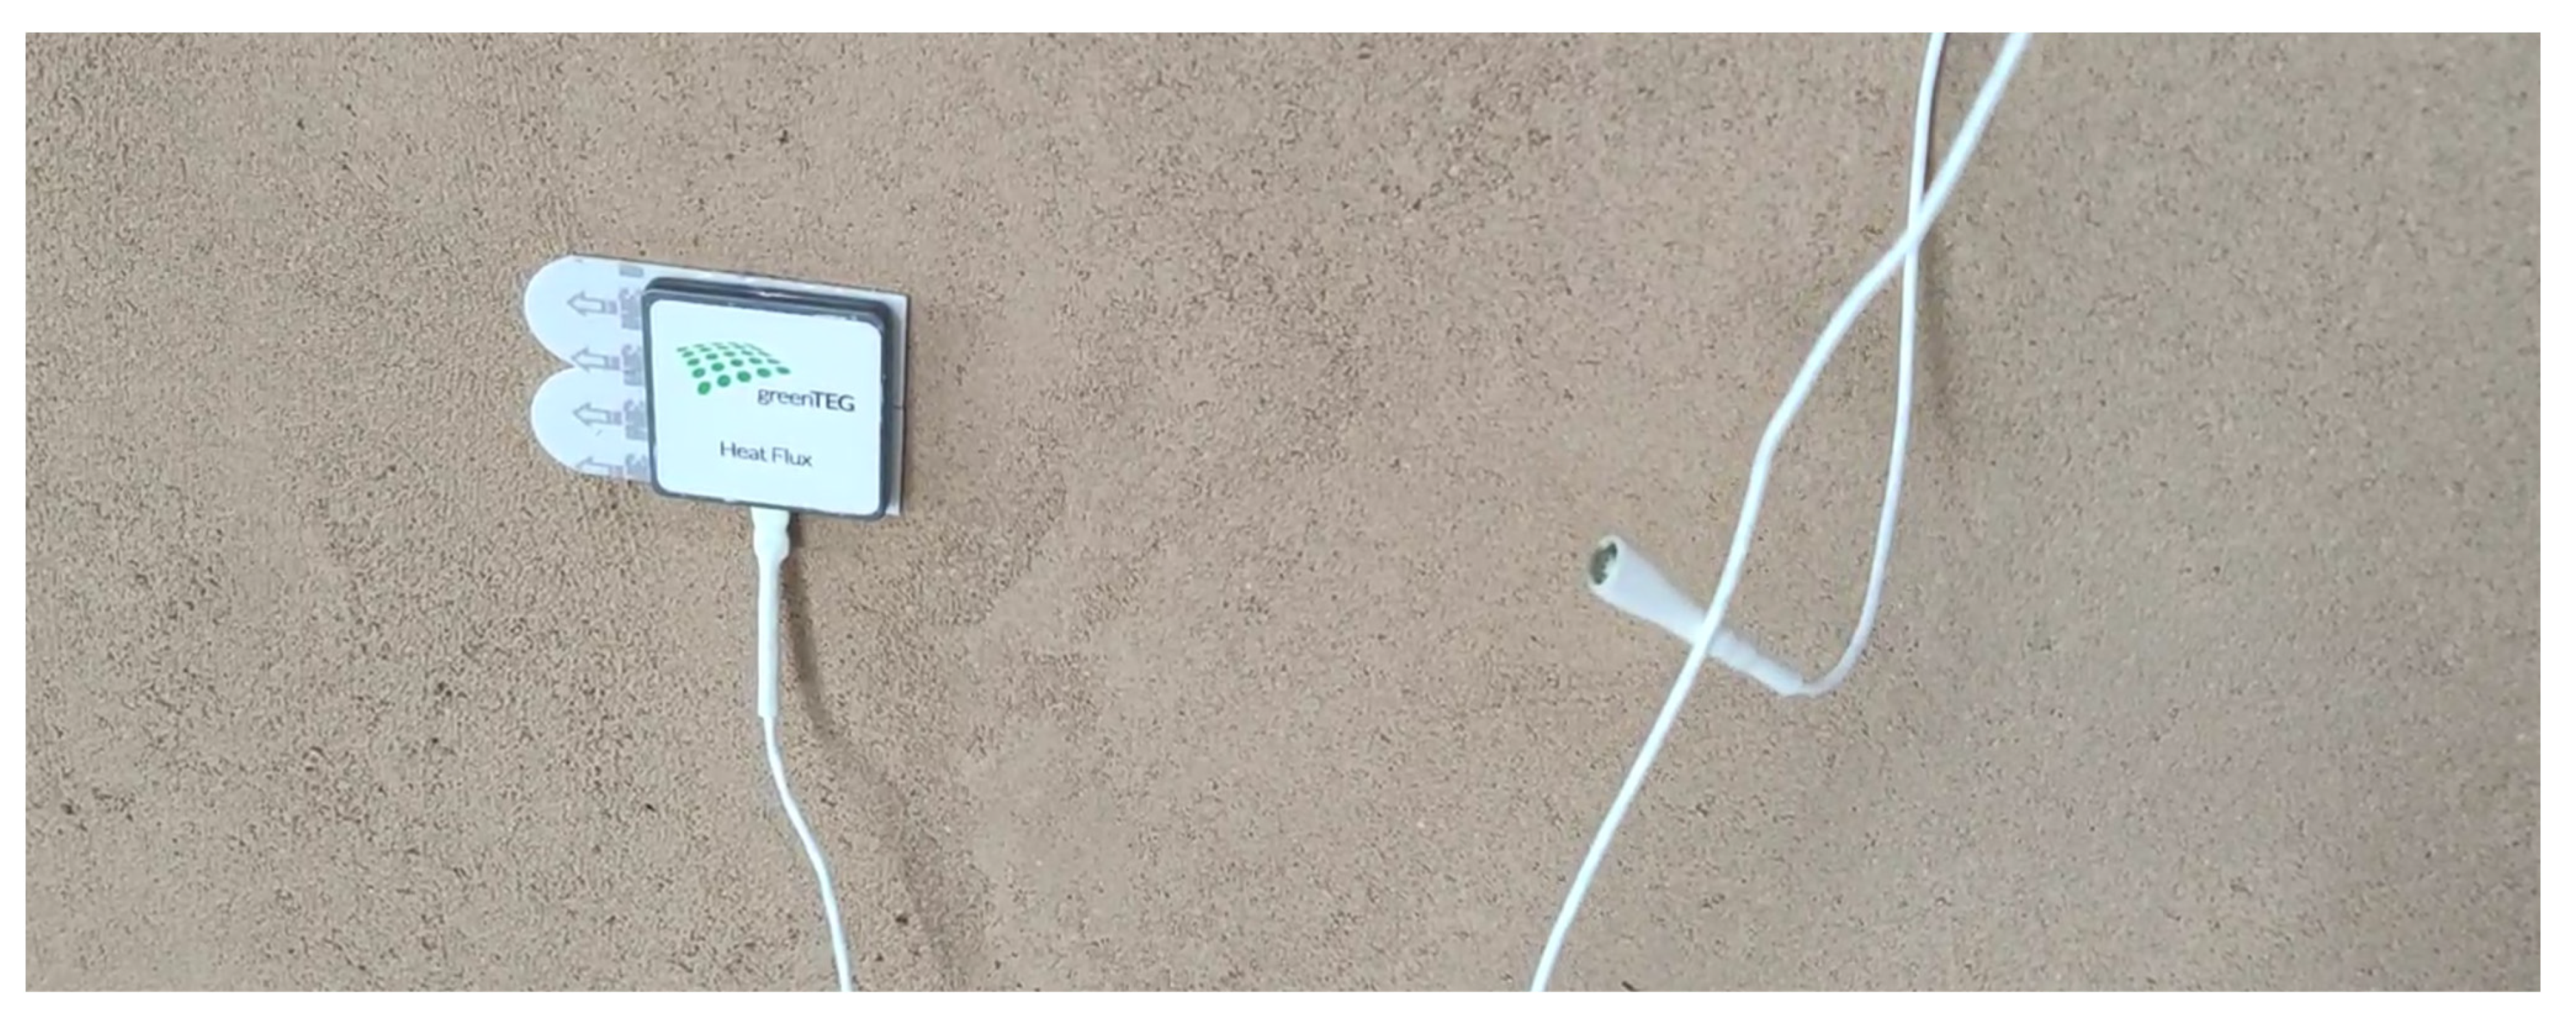
  • gSKIN KIT-2615C developed by greenTEG AG, Rümlang, Switzerland.
  • (Heat flux sensor gSKIN-XO, logger DLOG-4231 with two temperature sensors),
  • greenTEG logger software v1.02.09 developed by greenTEG AG, Rümlang, Switzerland.
Figure 8 shows the U-factor test bench. Figure 9 shows the gSKIN sensor and temperature sensor during measurement.
The heat flux sensor was placed in the centre of the field between the wooden structural posts inside the partition to minimise the influence of thermal bridging. Computationally, the influence of wall posts does not significantly change the U coefficient. In the case of calculations using the Audytor OZC 7.0 Pro software developed by SANKOM Sp. z o.o., Warsaw, Poland, the difference is 0.001 (W/m2K). The spacing between the posts at the test location was 62 cm (in the axes).

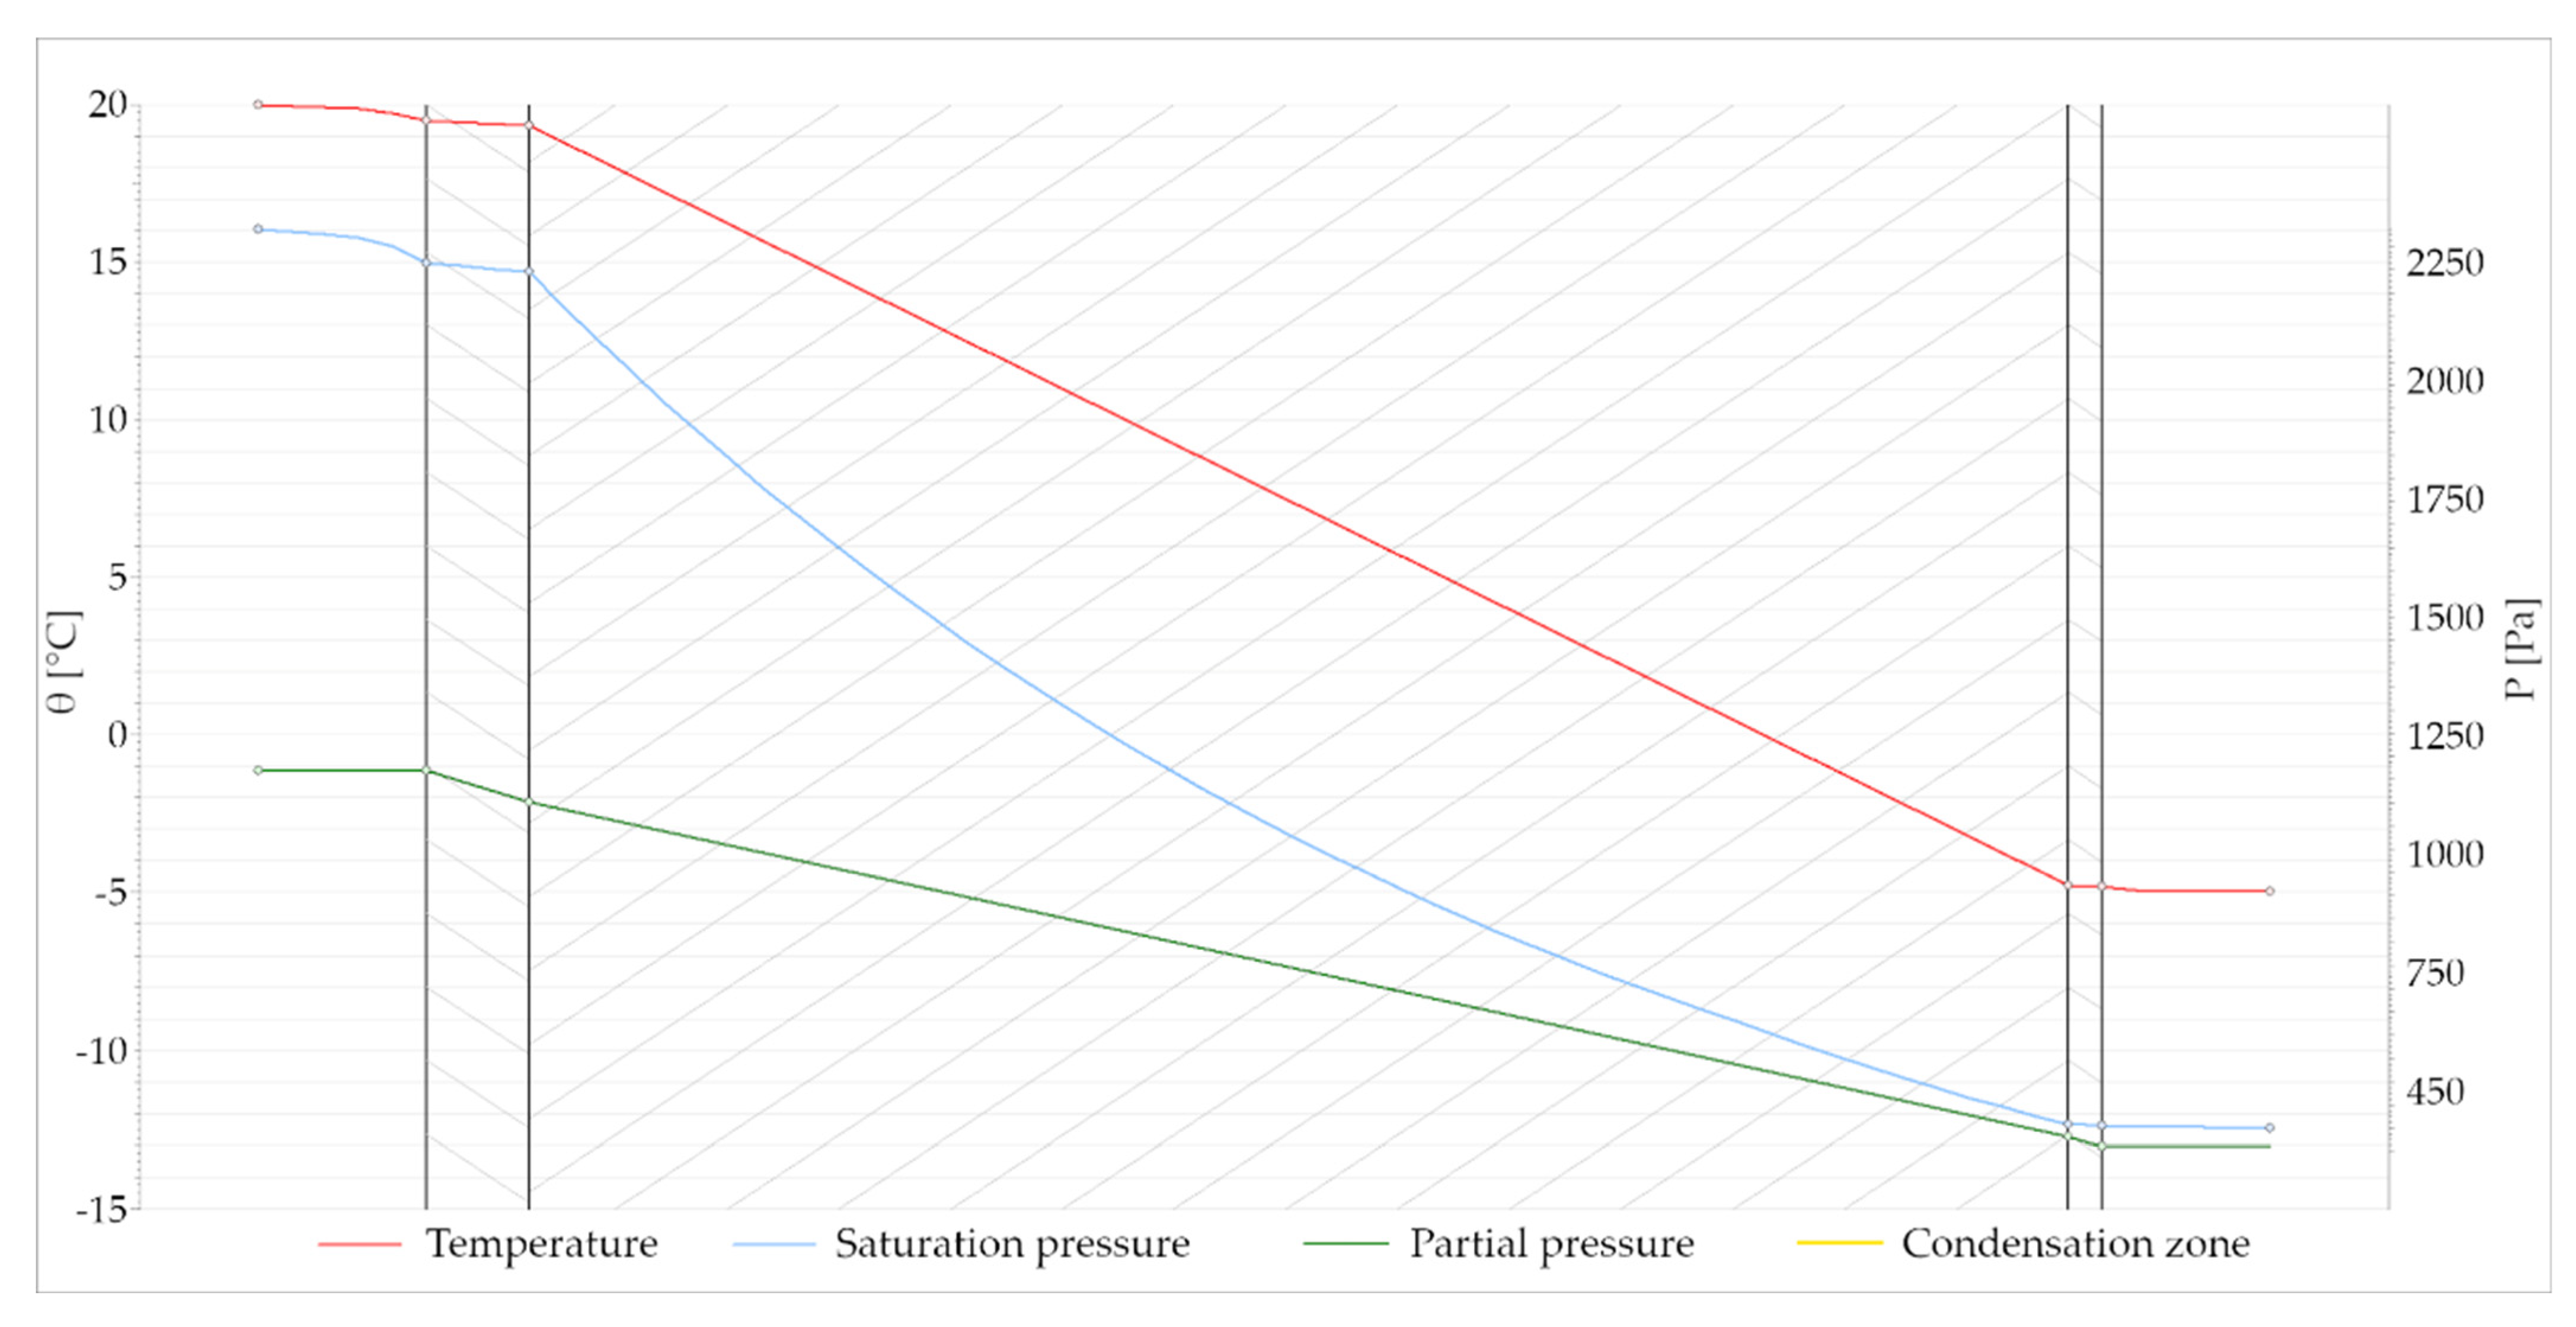
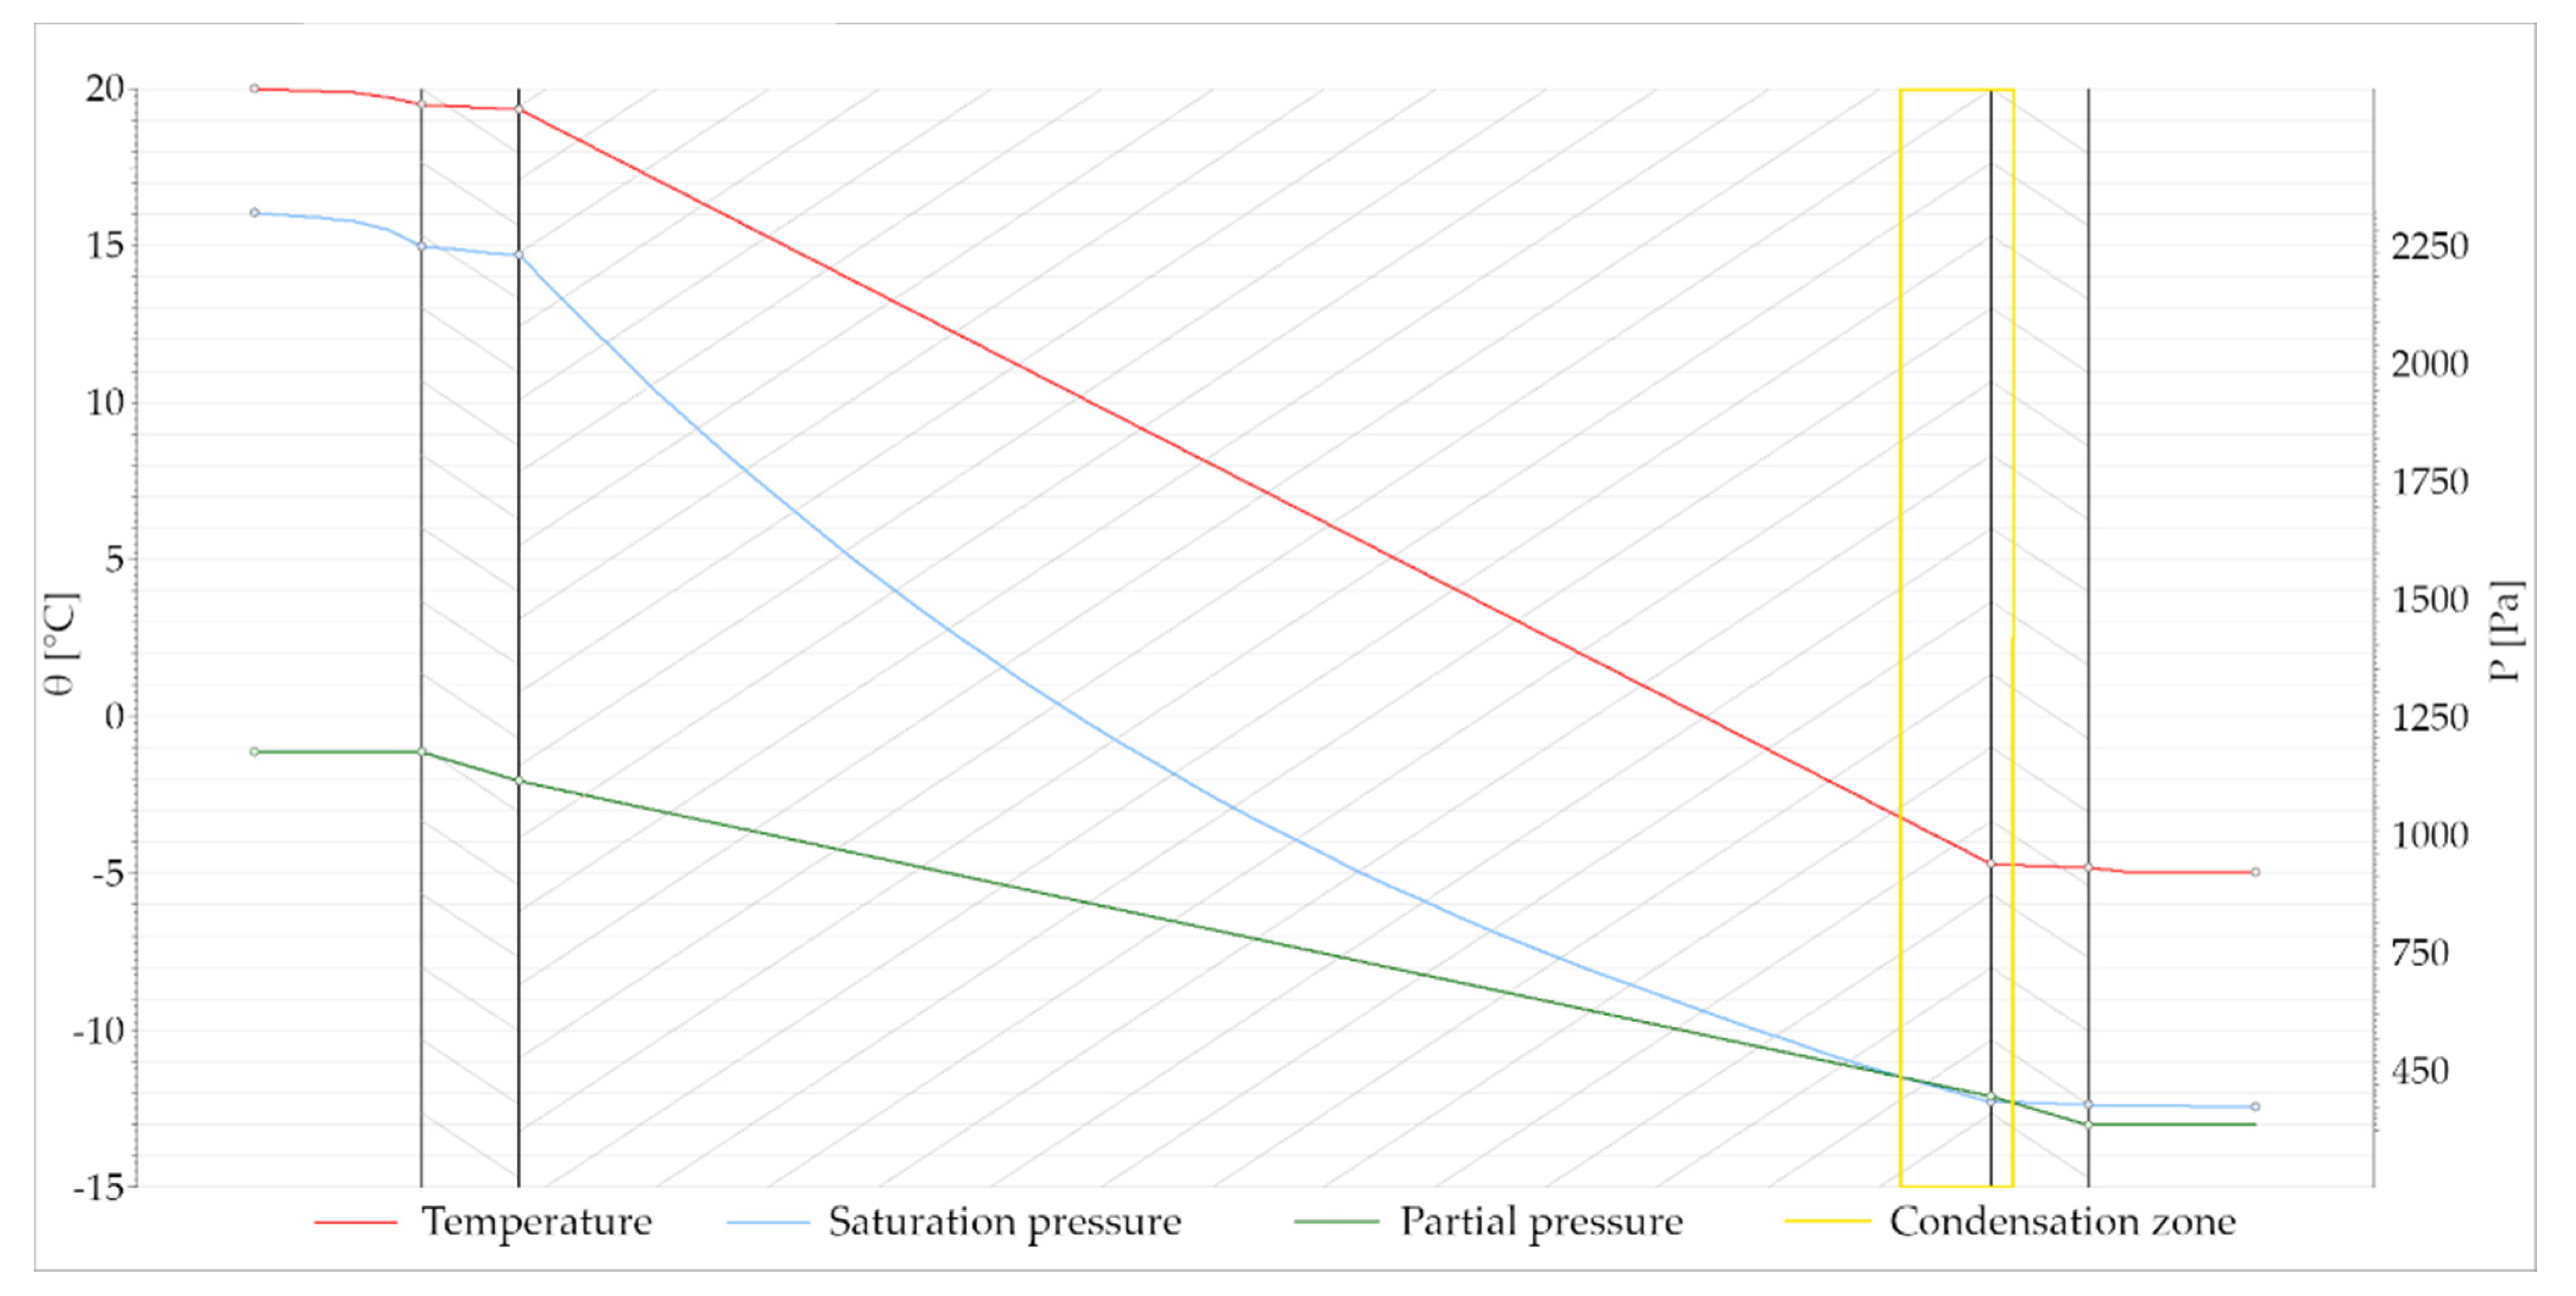
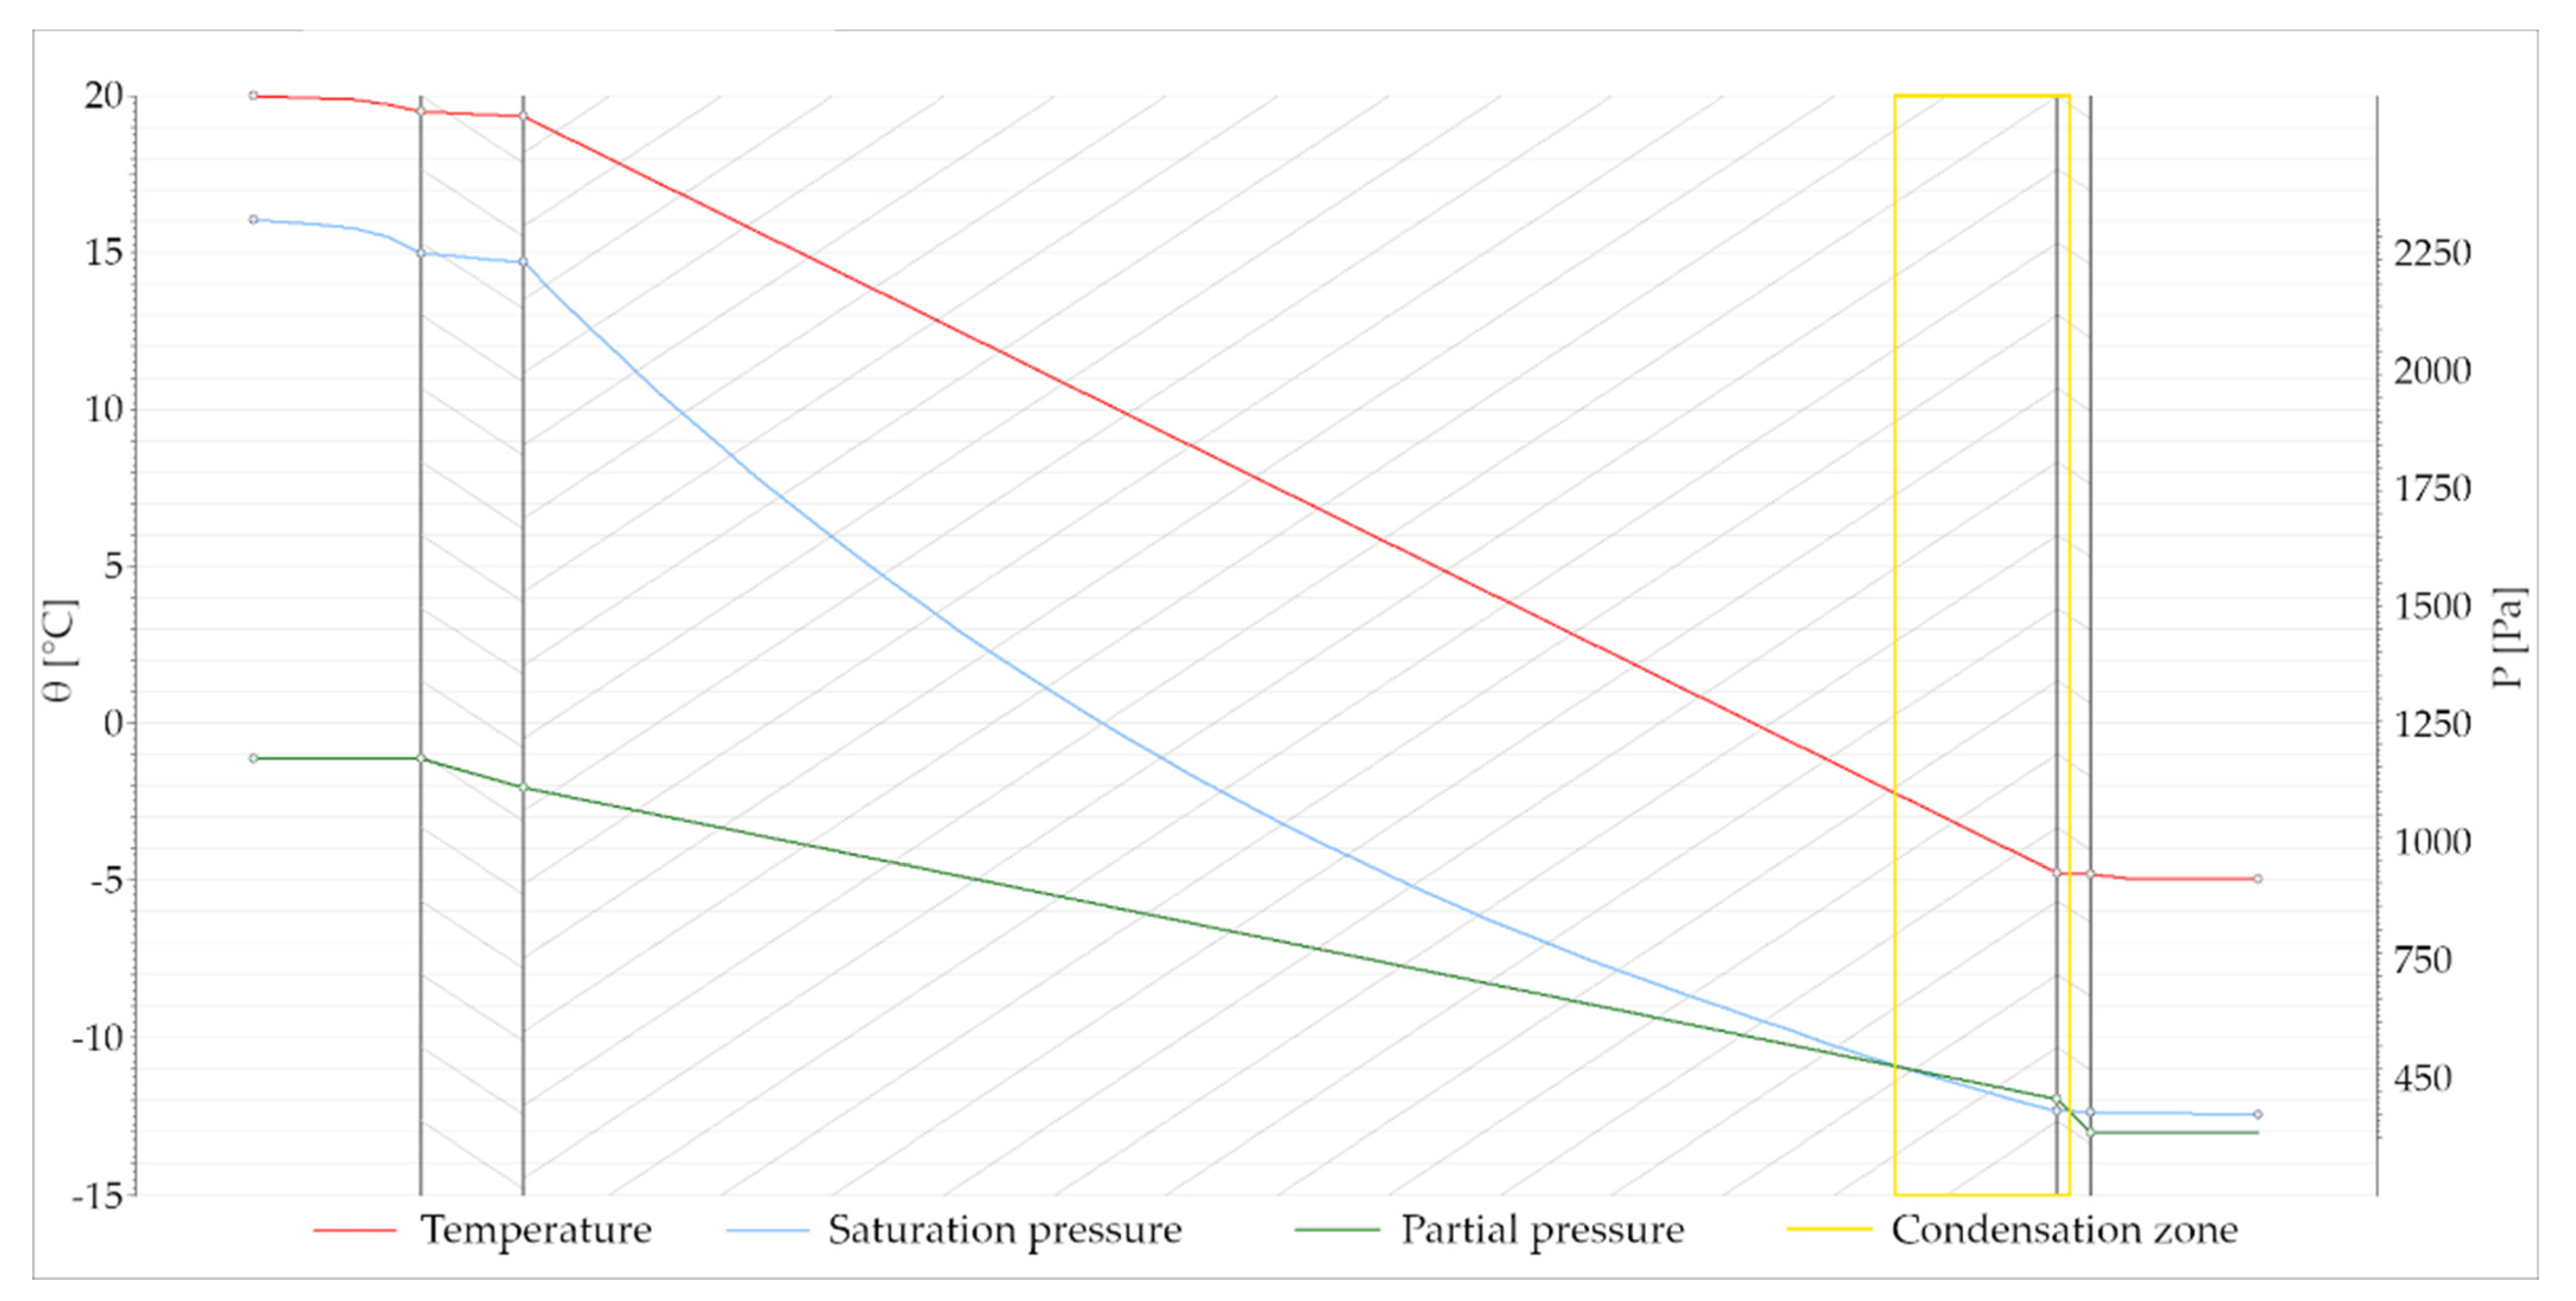
2.2. Analysis of Condensation Inside the Envelope

Based on the above data, a moisture analysis was carried out in accordance with PN- EN ISO 13788:2013-05. The analysis was carried out using AudytorOZC 7.0 Pro software. The analysis showed no risk of condensation. However, the month of January can be risky, with condensation occurring under unfavourable conditions. The distribution of water vapour pressure in the partition during the month of January is shown in Figure 10.
It should be added here that if a different thickness of external render is used or a render with a higher diffusion resistance than clay is used (e.g., lime render), the risk of condensation inside the envelope increases. A variant with a 3 cm thick external clay render is shown in Figure 11, and with a 1 cm thick lime render in Figure 12.
The principle to be followed here is that the walls should be designed in such a way that the materials with the highest diffusion resistance are closest to the interior, and the last outer layers have the lowest possible diffusion resistance (lower than the inner layer). Another solution that would reduce the risk of condensation is to use lime plaster or clay plaster with linseed varnish on the inside. Linseed varnish increases the diffusion resistance of plasters [21,38].
Actual moisture parameters were performed using Bosch BME280 sensors mounted inside the building envelope on the north and south sides of the building. The sensors are connected to microcontrollers with ESPEasy software [39]. A proprietary set-up was used for data collection and processing, consisting of a local server (server 1) based on a Raspberry Pi4 microcomputer with Domoticz open soure software located in the building in Zyndaki, and a data server (server 2) based on a Raspberry Pi4 micro- computer located in Warsaw with InfluxDB (developed by and Grafana software. The humidity and temperature sensors were Bosch BME280 connected to microcontrollers with Easy ESP software. Measurements were taken every 5 min using the BME280 sensors. In walls, due to the lower dynamics of changes, measurements are performed less frequently—every 10 min, and data are only saved if the value has changed. The data were then sent to server1 and a database on server 2. This design is because server1 does not have a public IP address and is difficult to access remotely.
The BME280 sensors were located in the straw near the outer layer (approximately 9 cm from the outer layer). Figure 13 shows other temperature sensors (DS18B20) imaging the temperature distribution inside the wall.
Based on the moisture content tables developed by Krick [26] (Table 3) and the straw water content formula (based on BET theory) [26], the water content was determined for the selected periods at the turn of the years 2021 and 2022.
Krick’s Formula (1) for calculating the mass water content of wheat straw was used to convert the water content [26]:
u = 0.036 40 φ 1 φ 1 11 φ 10 + 10 φ 11 1 + 39 φ 40 φ 11 ( 0.00017 ( θ 40 ) 2 0.00421 ( θ 40 ) + 1 )
where:
u—mass water content (g/g),
φ—relative humidity in the straw
θ—the temperature in the straw (°C).
The time interval from 1 January to 31 March 2022 was analysed. Below is a graph (Figure 14) showing occupant presence (carbon dioxide concentration measurement) and indoor relative humidity. It can be seen that humidity increases when there are occupants in the building. Therefore, this period was of particular interest to the study.
Subsequently, the external and internal temperatures and the humidity inside the two external walls—north and south—were checked over the same period. The graph in Figure 15 shows periods (straight sections) where data were not recorded (probably due to an error in the measuring apparatus). Four periods were selected for further analysis: (a) 2 January 2022–10 January 2022; during this period, the occupants were present, and the outside temperature fell from about 5 °C to −5 °C. (b) 15 January 2022–24 January 2022, no occupants stayed during this period. The outdoor temperature was slightly higher, from 1 °C to −3 °C. (c) 31 January 2022–10 February 2022, occupants stayed during this period. Internal humidity was higher, and the temperature was between −5 °C and 6 °C. (d) 13 March 2022–22 March 2022, a period when no occupants were present, and the outside temperature rose, reaching up to 13 °C during the day and dropping below 0 °C at night.

2.3. Building Airtightness Tests

Two blower door tests were carried out on 10 December 2020 and 13 September 2022. The first blower door test was carried out before the last layer of internal plaster was applied to two walls in the living room. The external plastering was carried out after two layers had been applied—the first was a spray of clay, followed by a thin layer of hand-laid clay. Once the clay had dried, cracks were visible. Between the first and second leakage tests, the following work was done to seal the walls:
  • Sealing of electrical sockets;
  • Eliminating cracks in the interior plaster by deepening and widening the crack and then filling in with clay;
  • Completing the final coat of plaster in the living room;
  • Completing the loss of external plaster.
External cladding of the façade was also carried out, but this does not affect the airtightness of the building. Testing was carried out by Prusdis in accordance with Standard ISO 9972:2015 using method B, after sealing the ventilation and drainage ducts. Equipment used in these tests included: Retrotec 3000SR fan, Retrotec DM-2 pressure gauge and Retrotec FanTestic 5.8.37 software.
In addition, a thermal imaging inspection was carried out during the first leakage test as part of the external wall leakage verification test. The test was performed with an IR camera—Flir E8 camera (with a thermal detector sensitivity of 0.06 °C and a temperature measurement accuracy of +/−2 °C or +/−2%). For the thermal imaging inside the building, the infrared emissivity coefficient ε = 0.9 was assumed. A thermal imaging survey from outside the building and a survey inside the building were carried out. The interior survey was carried out at a generated negative pressure of approximately −35 Pa. Temperature in the building—approximately +22 °C, outdoor temperature approximately −3.0 °C. The sky was partly cloudy. There was no precipitation. The wind blew from a southerly direction up to 12 m/s.
Thanks to this survey [40], it was confirmed that there were no typical thermal bridges inside the wall, and these were only mainly leaks and discontinuities in the external plaster.

3. Results

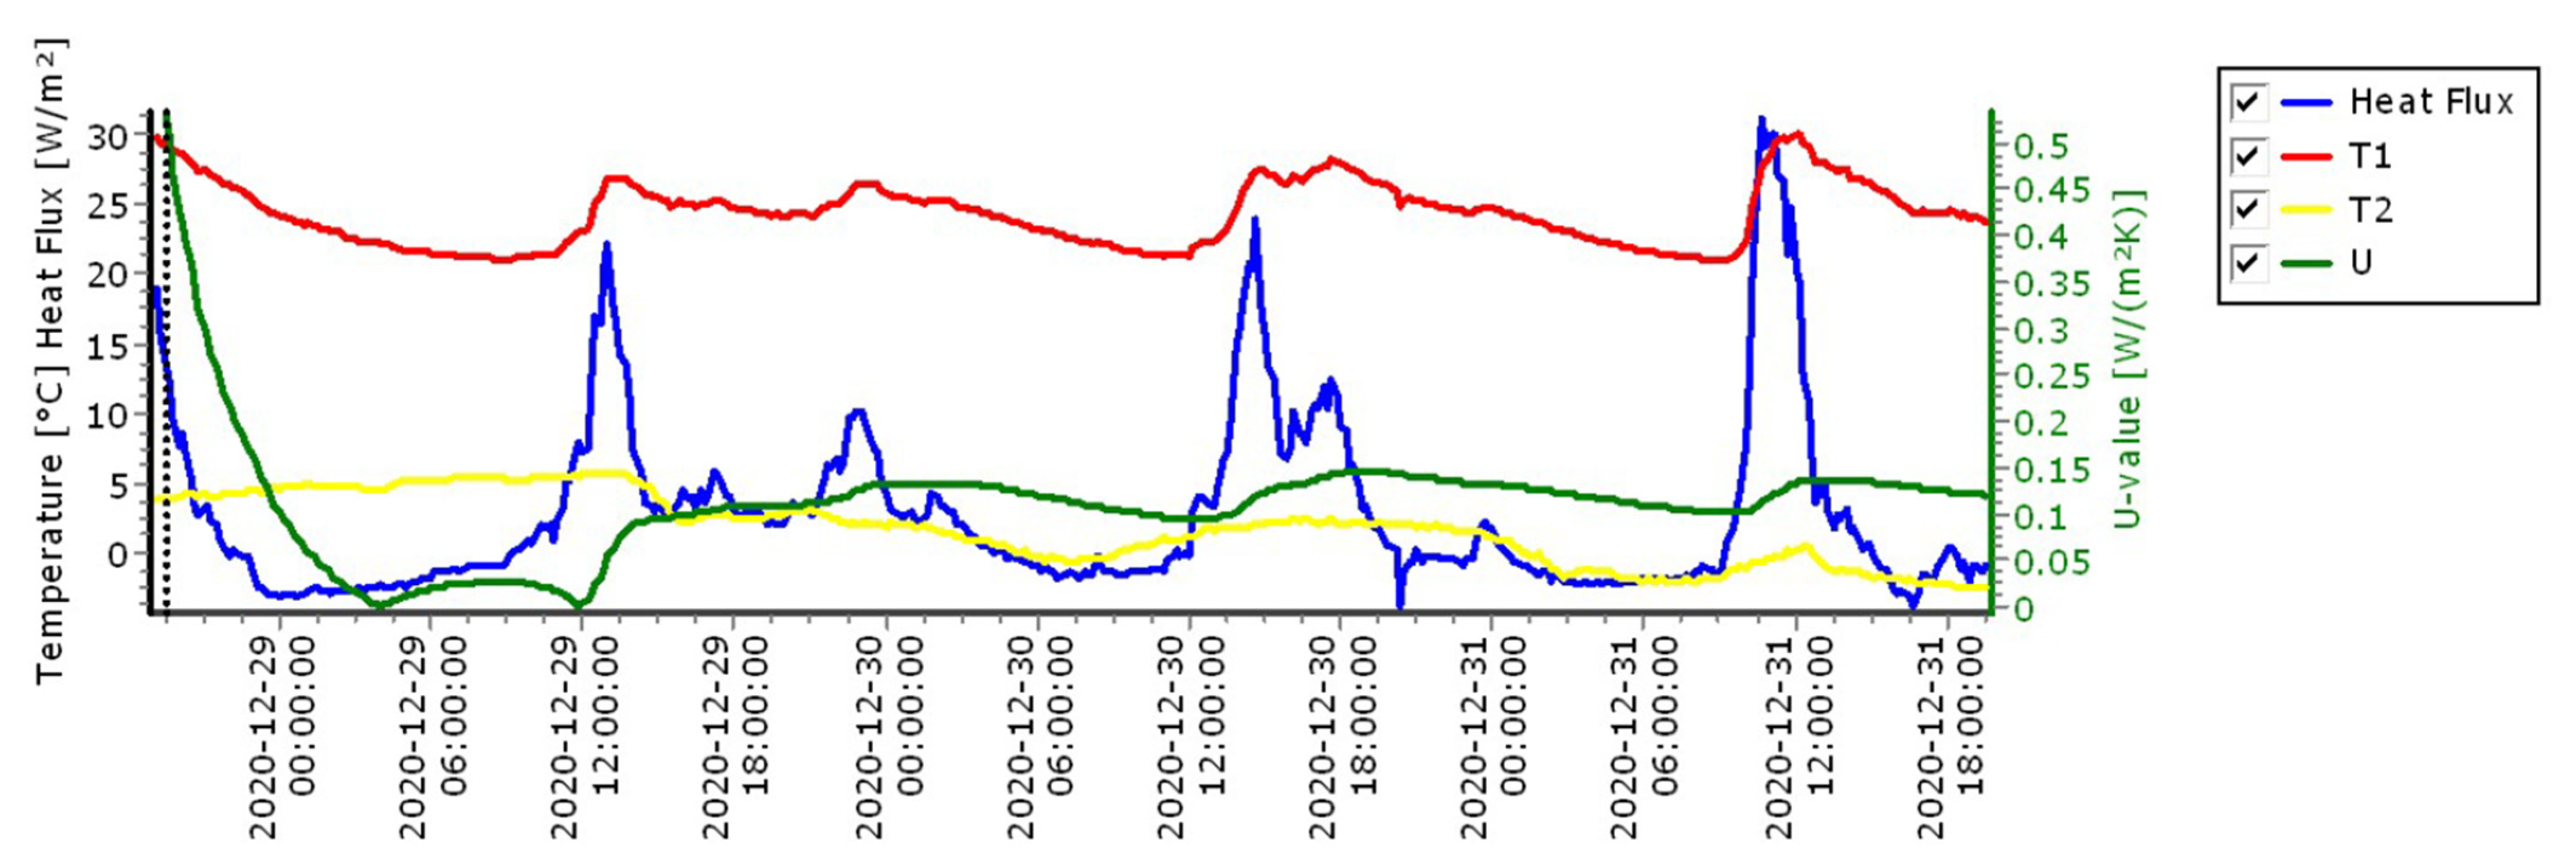
3.1. Testing the Thermal Conductivity Coefficient U-Value

Twelve in situ U-value measurements were made, only one of which met all the conditions of ISO 9869-1:2014, with a minimum duration of 72 h for each measurement. Basic requirements for measuring the U-value of a partition:
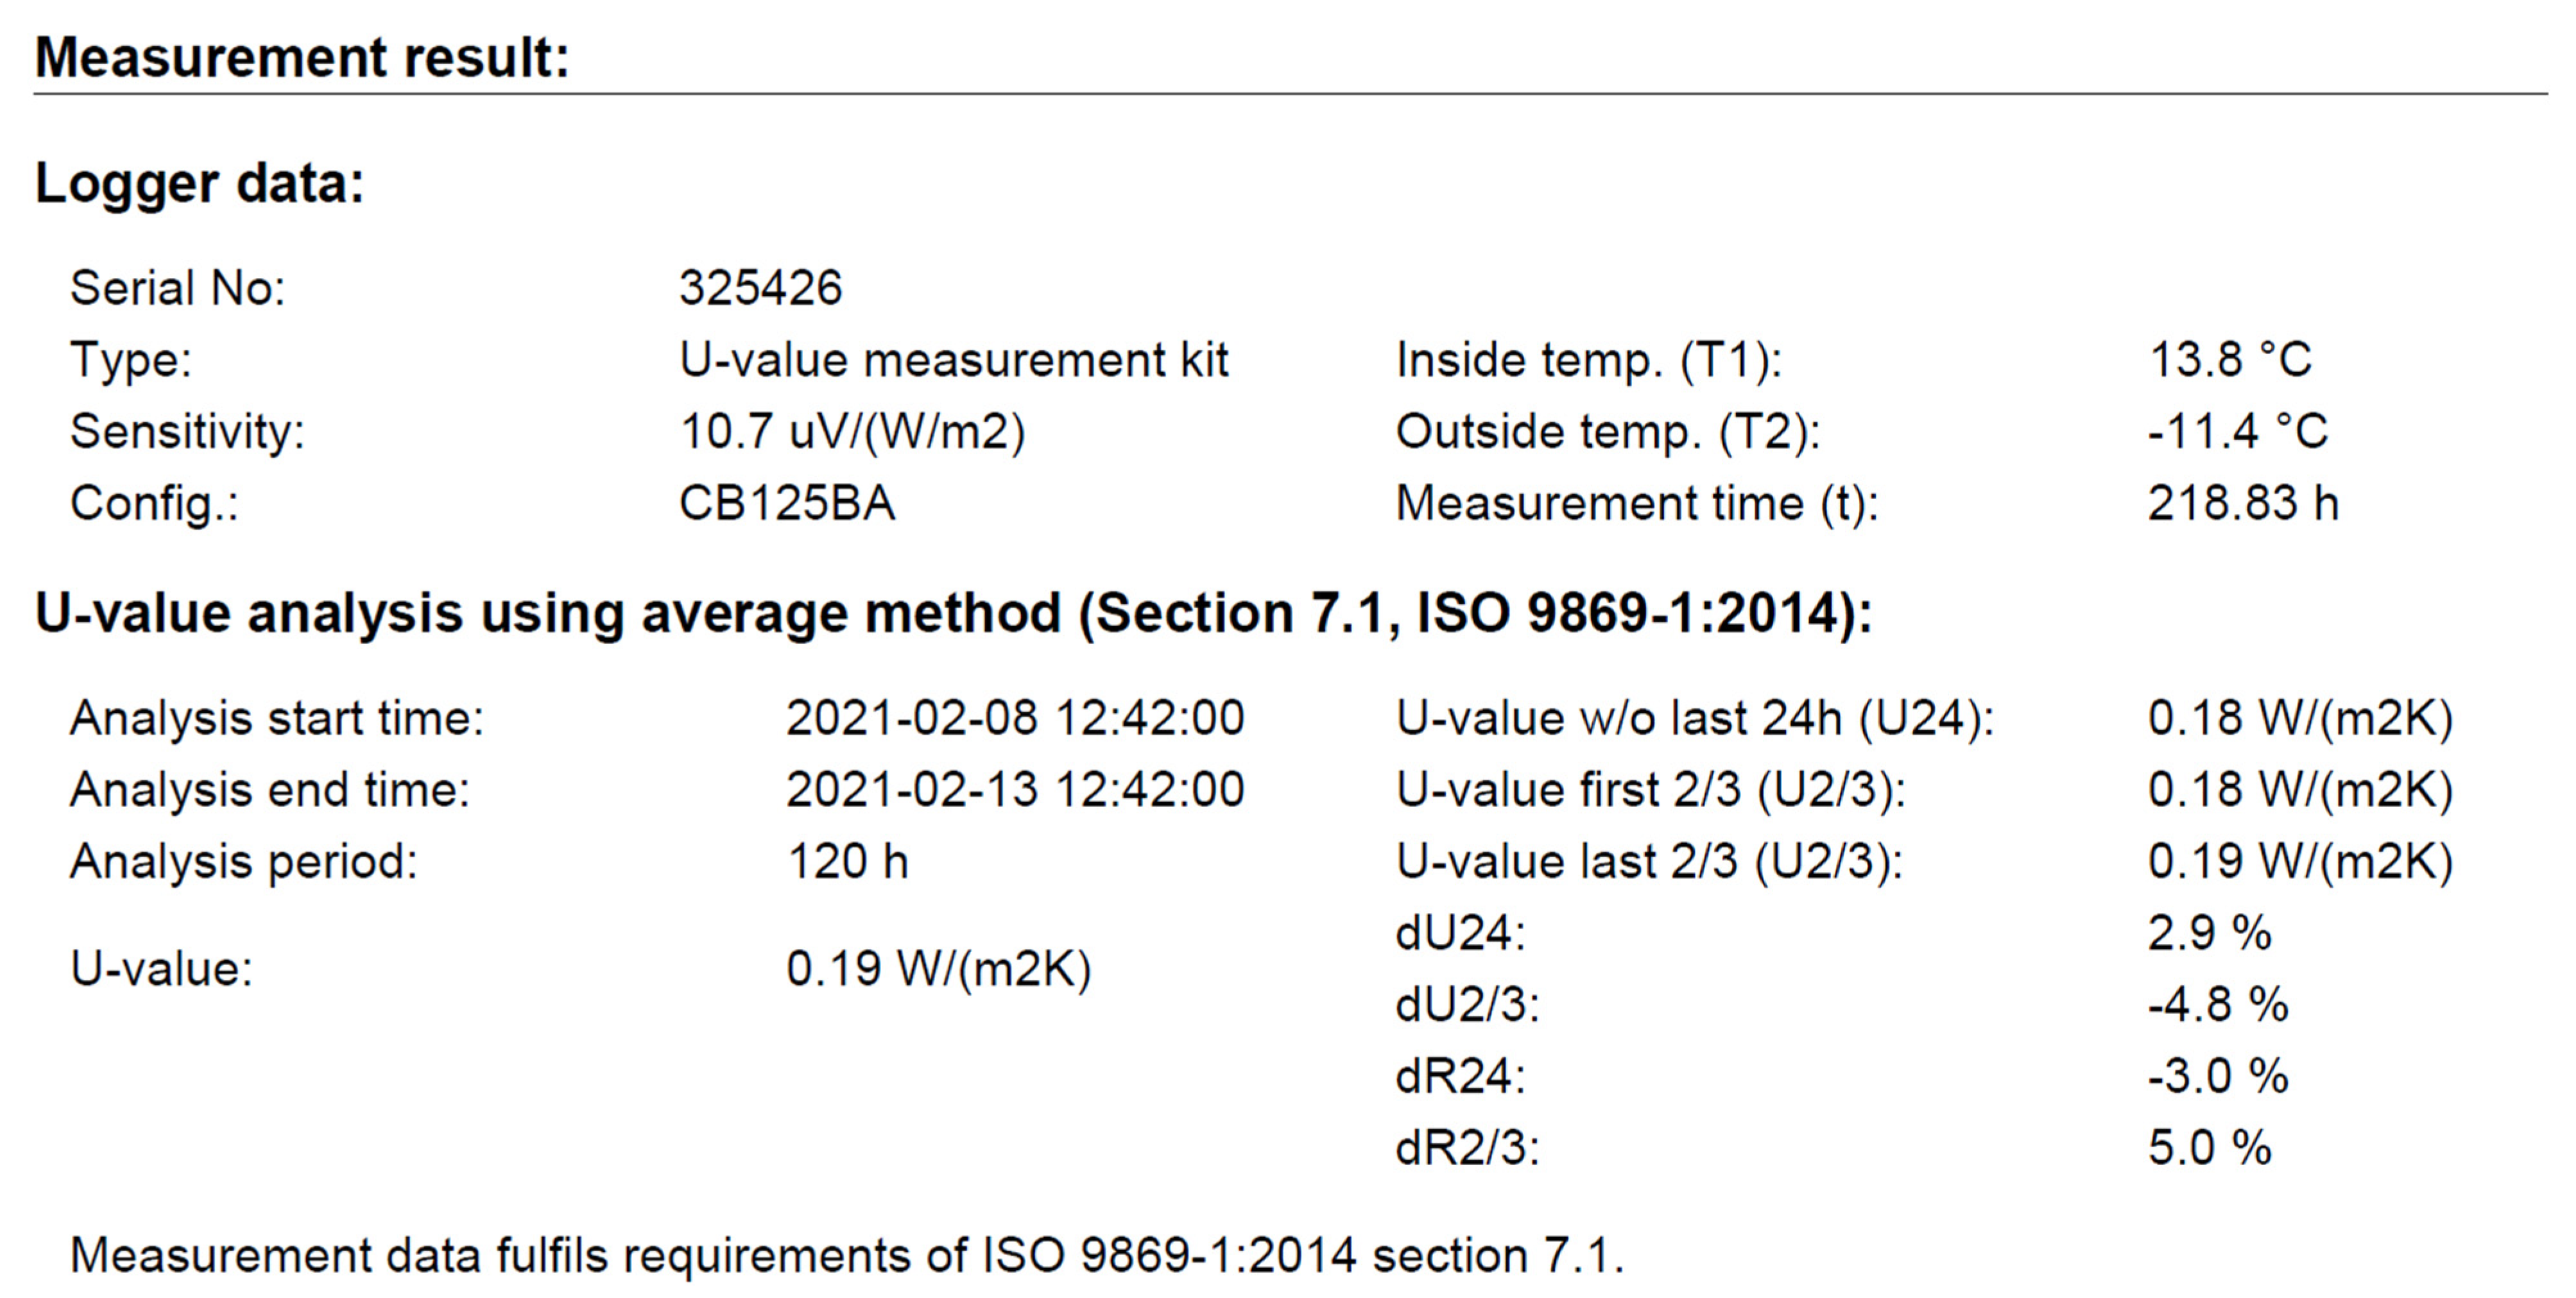
  • Measurement duration min. 72 h (+ total multiple of 24). The greenTEC software automatically calculates the relevant time frame.
  • The U-value obtained at the end of the test does not deviate by more than 5% from the value obtained during the first 24 h.
  • The U-value obtained during the first 2/3 of the entire measurement period does not deviate by more than 5% from the values obtained during the last 2/3 of the entire measurement period.
  • The change in the heat stored in the wall is ≤ 5% of the heat passing through the wall.
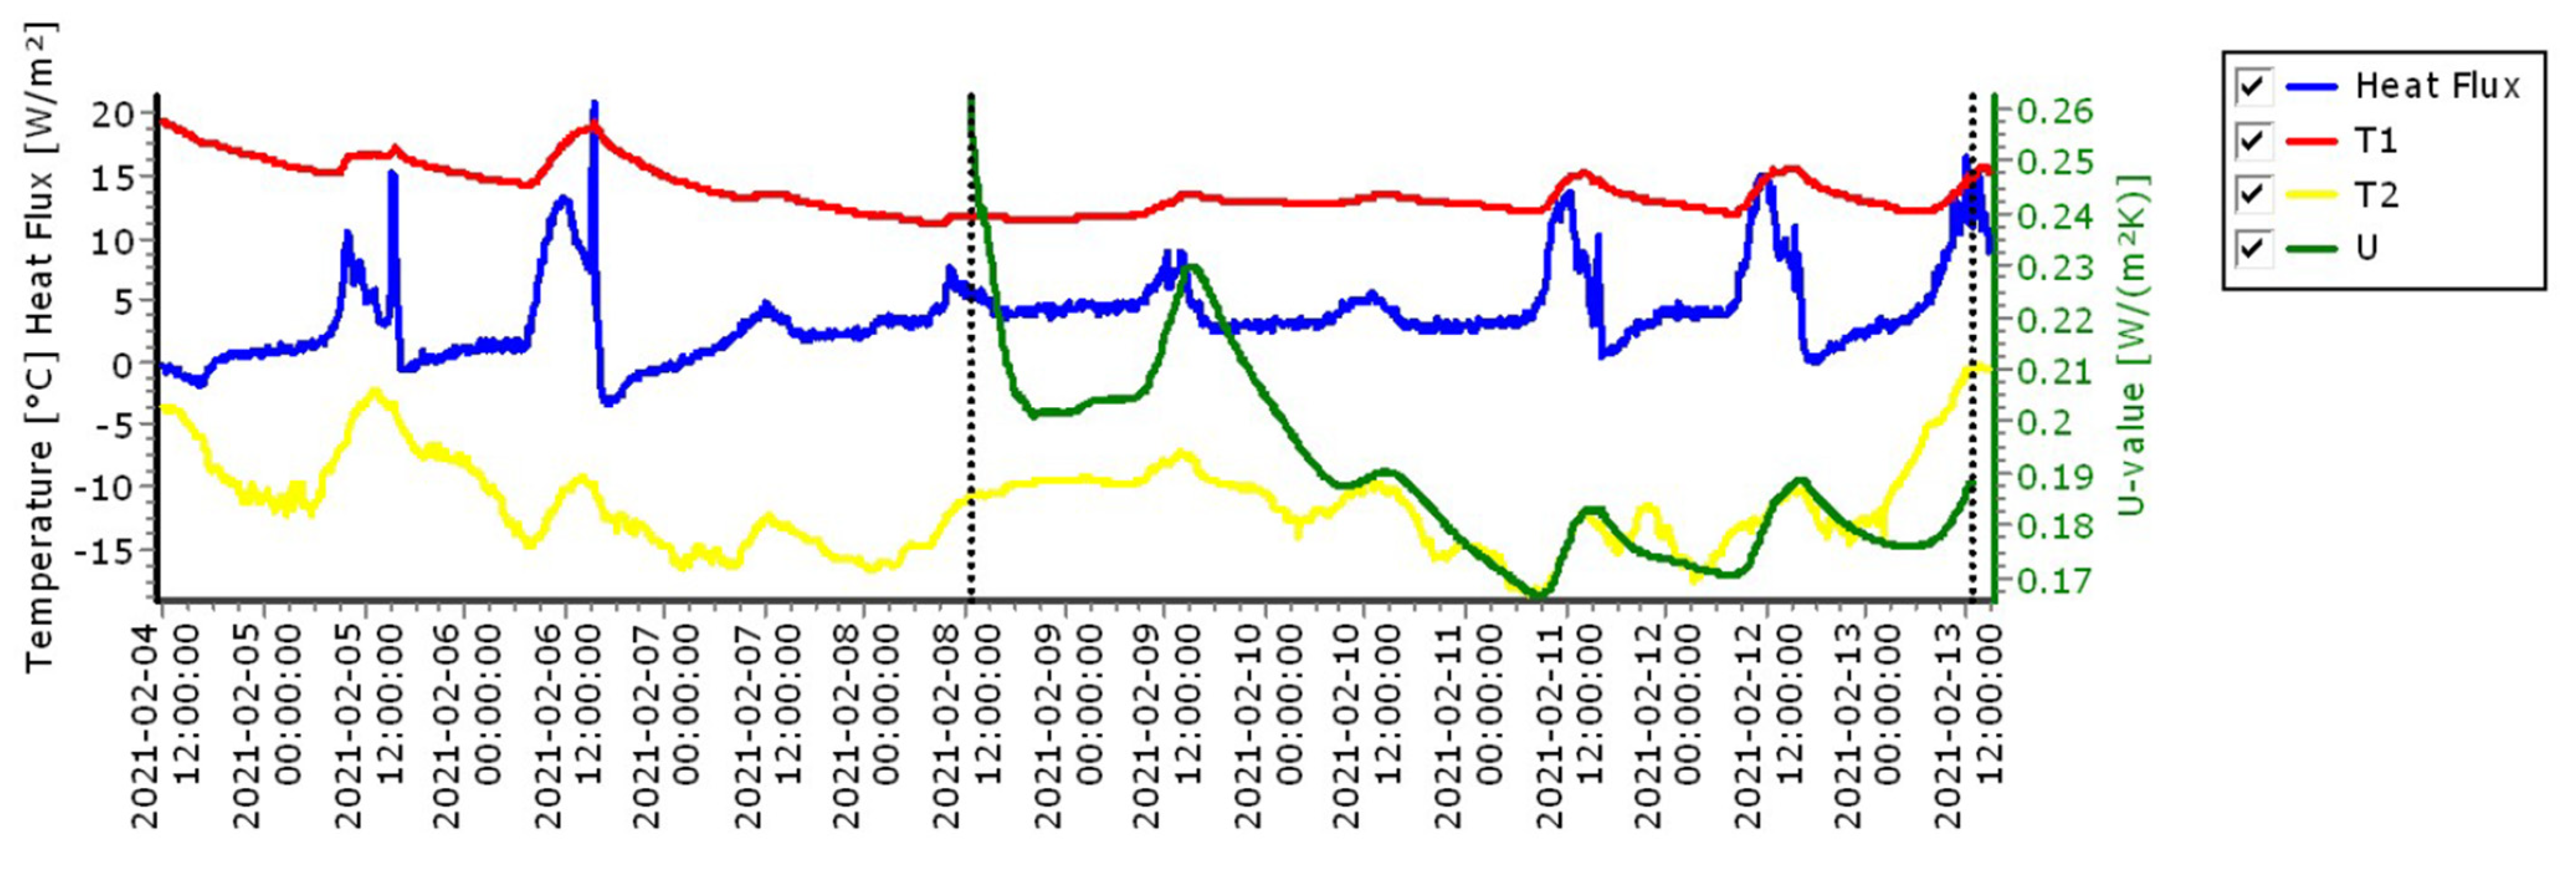
  • The measurement meeting the above requirements took place on 13 February 2021 (measurements from 12:42 on 08 February 2021 to 12:42 on 13 February 2021). The partial U-values were 0.18 W/(m2K) and 0.19 W/(m2K). The calculated U-value is 0.19 W/(m2K). The results are shown in Figure 16 and Figure 17.
It should be noted that previous measurements indicated a U-value of 0.12–0.15 W/(m2K) but, as a result of a significant jump in air temperatures, were not considered compliant with ISO 9869-1:2014. The course of these measurements is shown in Figure 18.
The measured thermal conductivity coefficient deviated slightly from the calculated coefficient (which was 0.184 W/m2K). This may indicate insufficient straw density or incorrect in situ measurements. For this reason, it is advisable to repeat the measurements elsewhere in the building and during more stable temperature conditions.

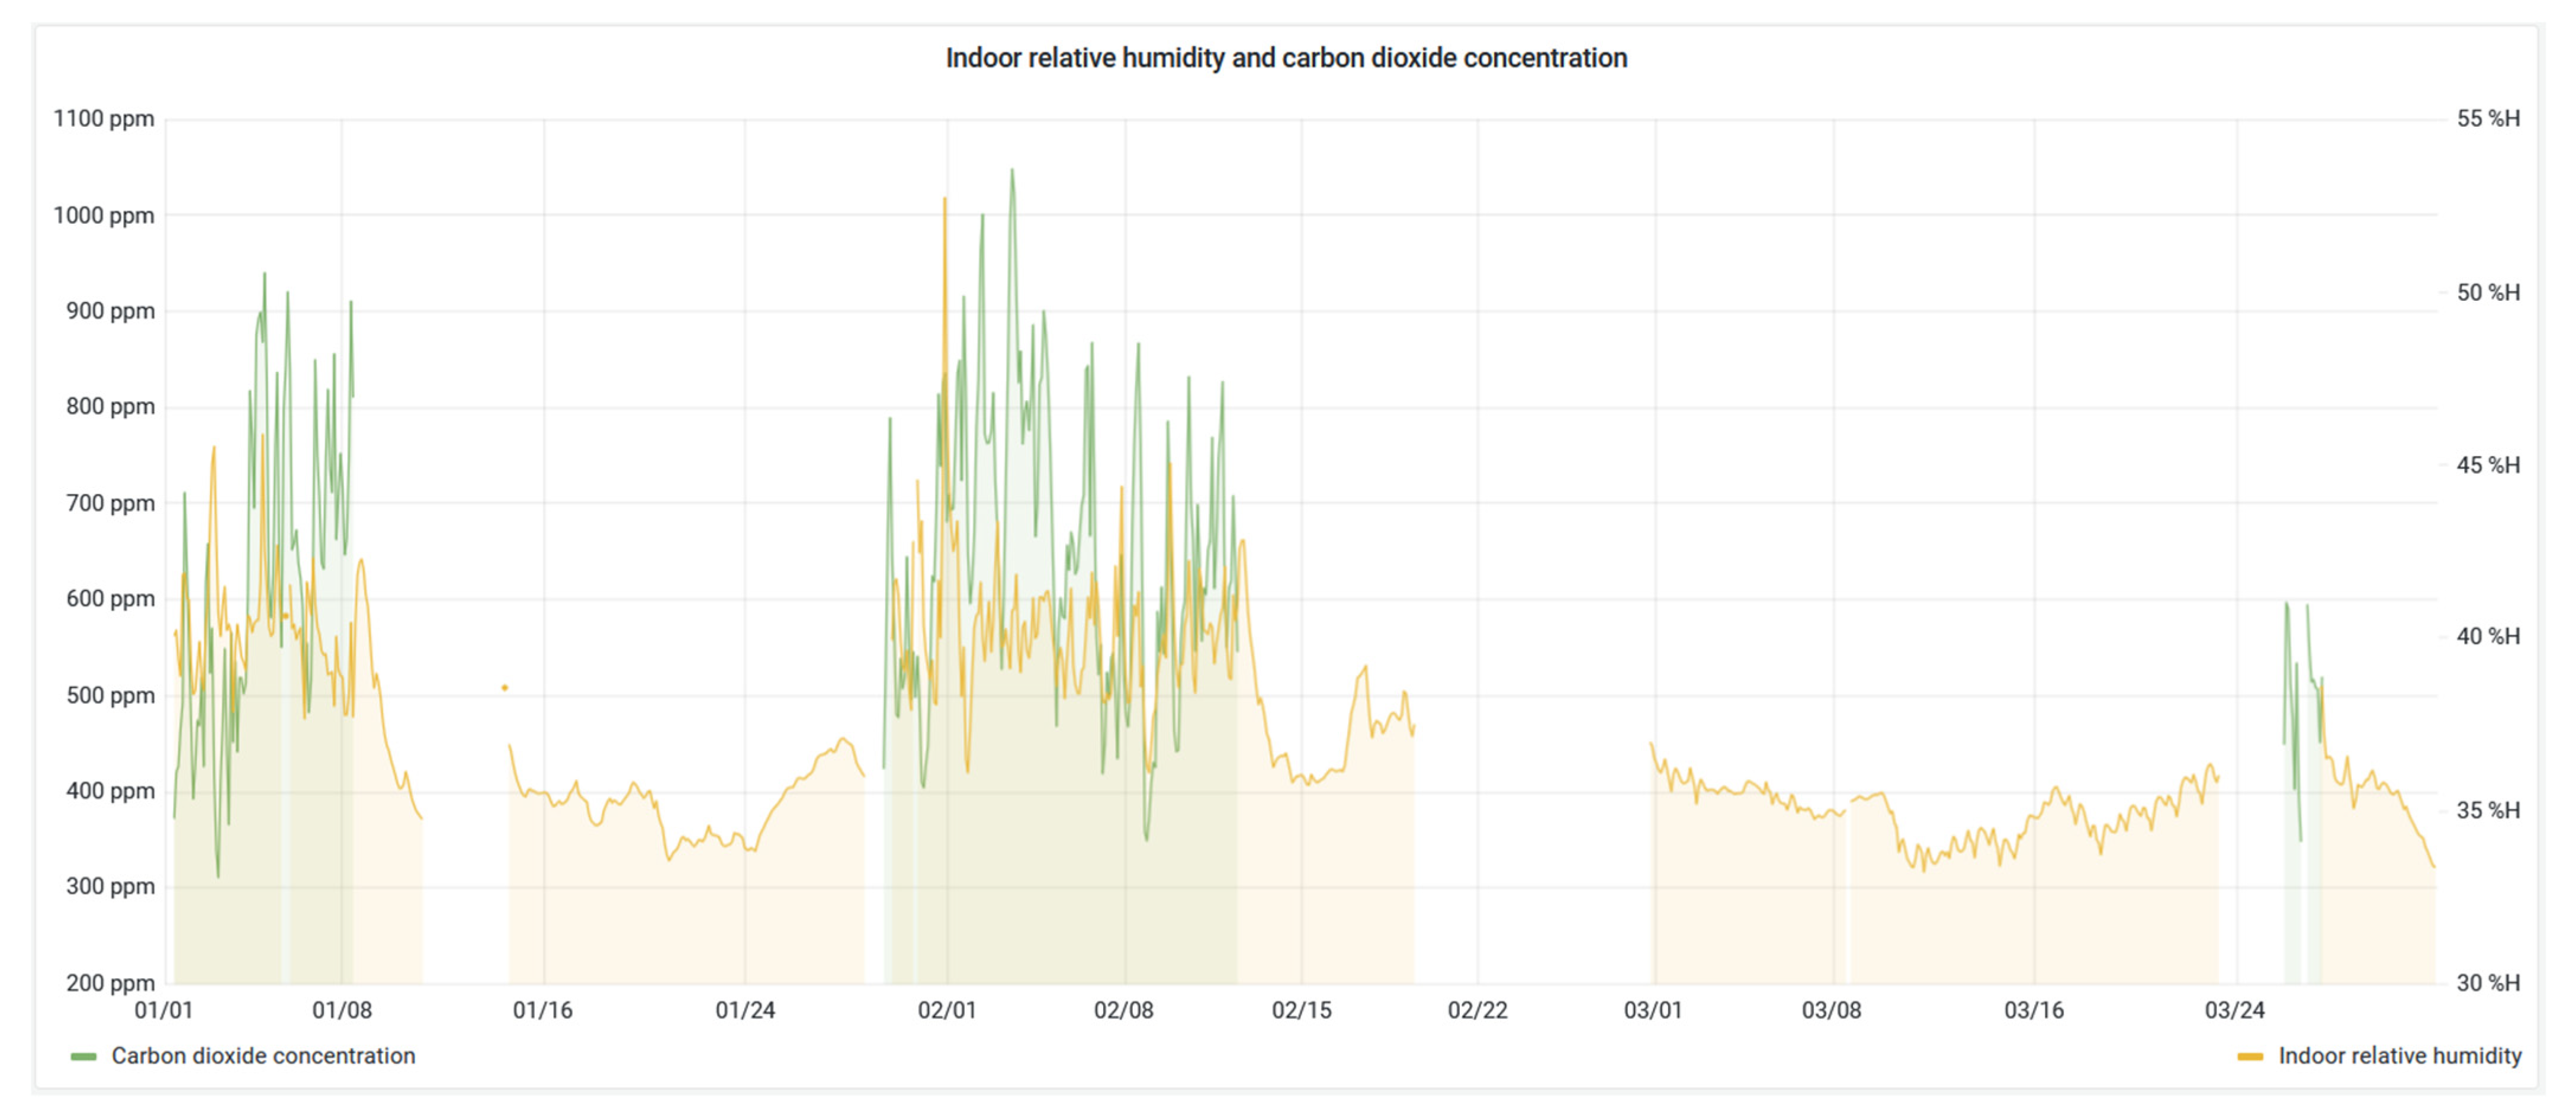
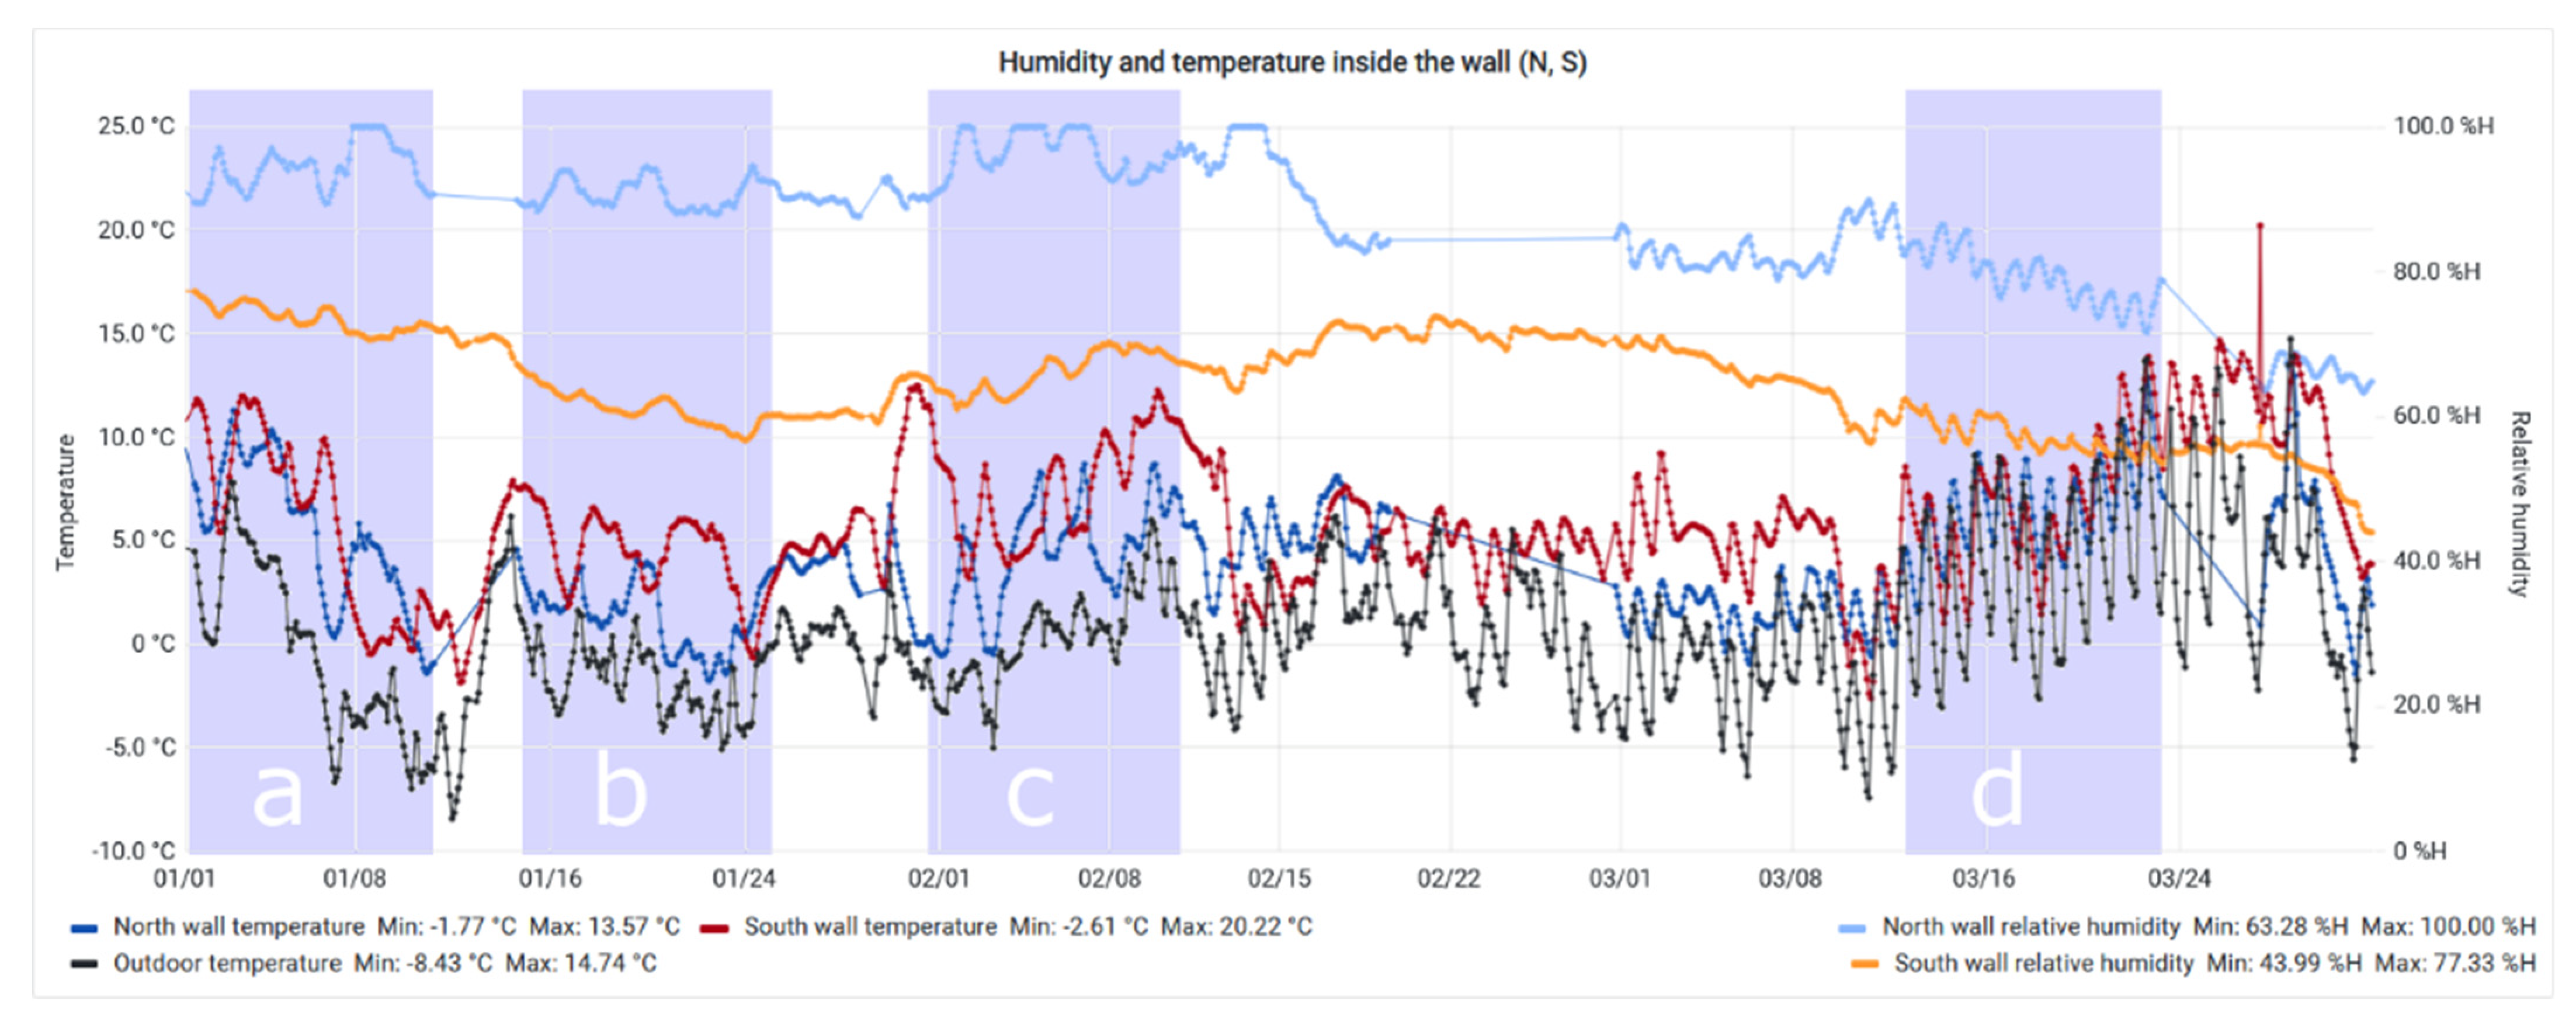
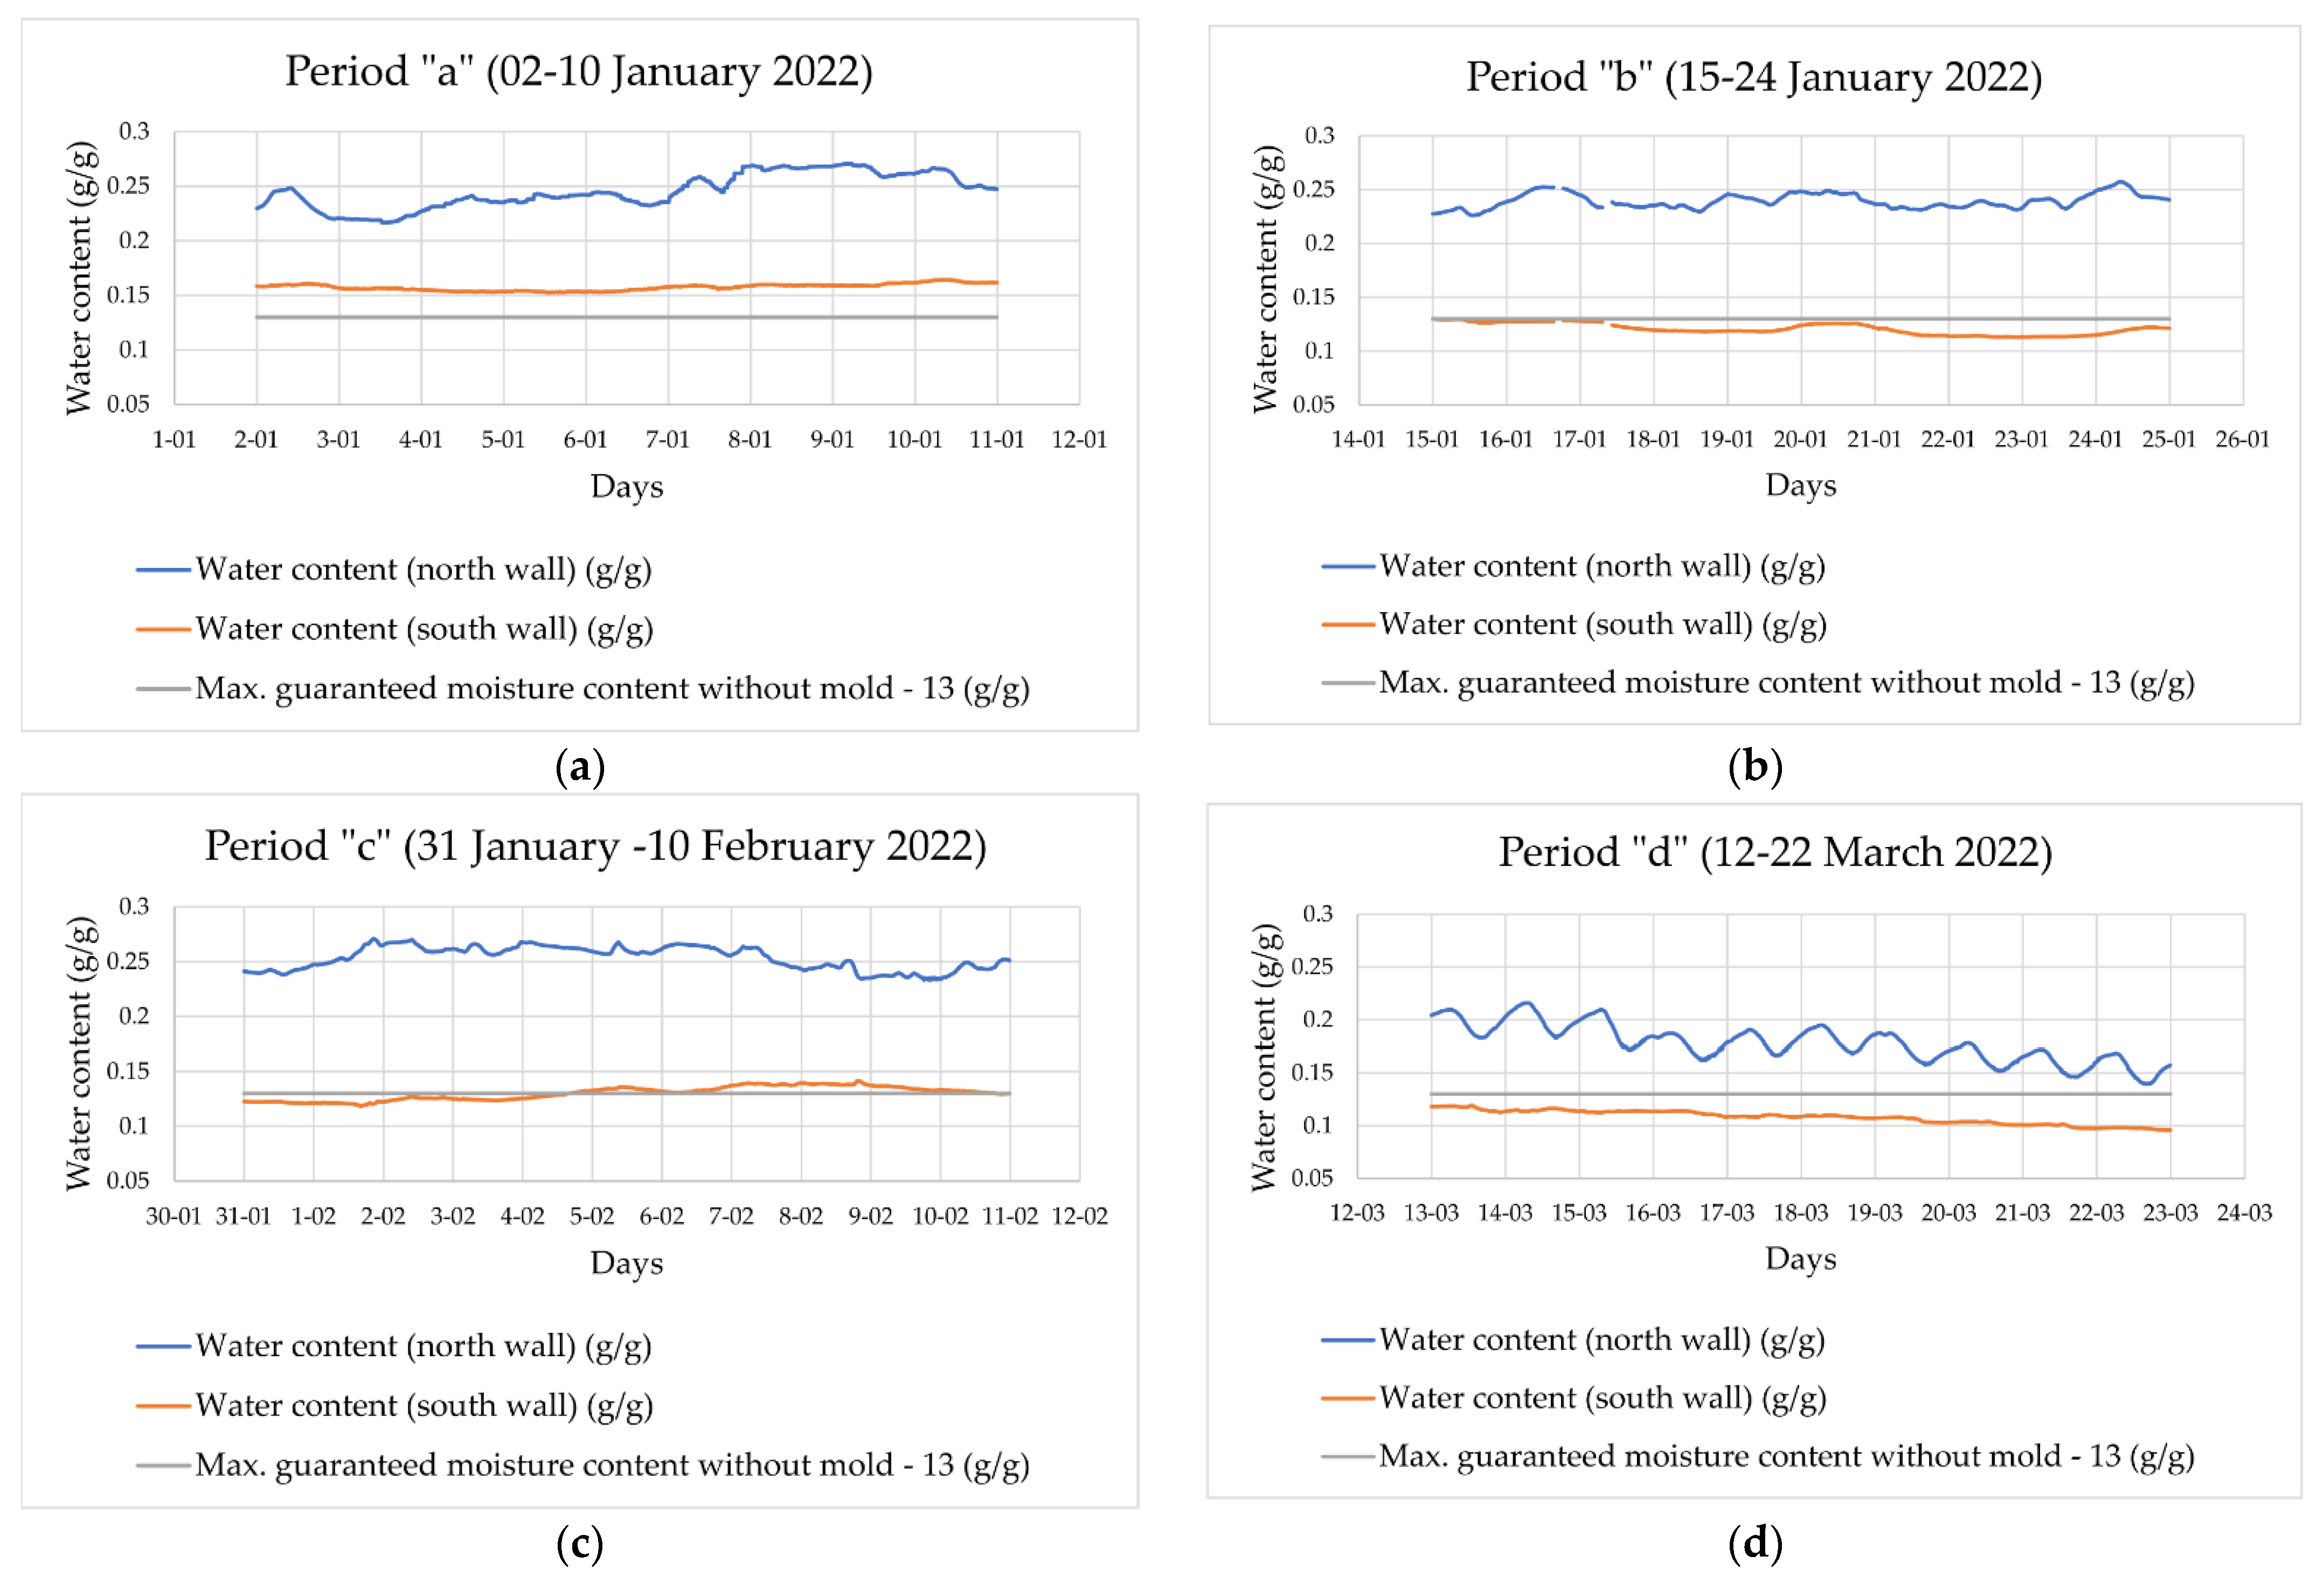
3.2. Analysis of Condensation Inside the Envelope

Calculations were carried out according to the procedure described in the Section 2. Below are graphs (Figure 19) showing the water content of the straw in g/g for each period time.
During the periods analysed at the measurement site, the water content of the straw on the north side far exceeded the limits considered safe. The excess water gradually began to evaporate in the spring months, as can be seen in the graph in period ‘d’. It is not entirely clear what the cause is and why there is such a large difference between the north and south walls. The most likely cause is air leakage in the building, both inside and outside, and the prevailing southward winds. In addition, the loss of external plaster at the sensor location could additionally contribute to increased air flows near the sensor. January is a month with prevailing winds from the south and south-westerly direction. These are characterised by low temperatures, high humidity, and high speed. In addition, the building is situated on a hill. This may indicate why the north wall was at particular risk of condensation occurring. A wind diagram based on a typical meteorological year at the station in Kętrzyn (22 km away) is shown in the Figure 20.
A meteorological station has not been installed at the study site to confirm this. Further tests will be carried out using an additional weather station recording wind strength and direction.
The fact that the leakage was not very good was confirmed by air leakage tests and a thermal imaging survey.

3.3. Airtightness of the Building

During the Blower Door Tests, the requirements of ISO 9972:2015 were met in terms of weather conditions—the static pressure value during the test did not exceed +/−5.0 Pa.
The test apparatus used meets the requirements of ISO 9972:2015 (current calibration certificates are enclosed).
The total result of the first test on 10 December 2020 was n50 = 5.33 (h−1), which is significantly below expectations. The results are shown in the Table 4.
Another Blower Door Test was performed on 13 September 2022. The test was performed with the same apparatus by Prusdis. The test indicated an improvement. The leakage result was n50 = 4.183 (h−1), this is an improvement of 1.147 (h−1). The results are shown in the Table 5. The overpressure test indicated that the Effective leakage area at 10 Pa.

4. Discussion

The research concerned three selected issues in the building examined in situ, such as the study of the thermal conductivity coefficient (U-value) of external walls, air tightness, and the risk of water condensation in the walls.
Based on calculations, the author assumed a design U-value of 0.184 (W/m2K), while measurements indicated U = 0.19 (W/m2K). The actual value obtained is still below the national requirements of U ≤ 0.20 (W/m2K) for external walls. It should be noted that this is a one-time on site measurement, which is associated with the risk of inaccurate measurement. Other authors (e.g., [42,43]) indicate that a wall constructed on-site under unfavourable conditions, often by unskilled workers, may deviate from the assumed standard. This type of study often shows over- or underperformance. Based on works by other authors, this type of study can indicate results that deviate from the assumed results by up to 100% [34]. This problem is particularly evident for walls with low U-values and large thicknesses. In addition, Gaspar [35] points to the problem of temperature variation, test duration or accuracy of the measuring equipment. In in situ measurements of low U-value facades, low heat flux is obtained, which reduces the accuracy of the measurement. In addition, O’Hegarty [42] indicates that the design U-values are not achievable for highly insulated walls in practice.
In situ studies of the U-value in non-homogeneous walls, as in this case, should take into account the possible influence of thermal bridges. In the case of the tests described in this article, the influence of the wooden structure on the change of the U coefficient is small, approximately 0.001 (W/m2K). This is due to the use of insulating material between wooden posts with twice as much thermal insulation as straw. However, in the case of a different design, measurements should be made in a different way, for example as described by Atsonios et al. [44], using two or more heat-flux sensors simultaneously.
Another problematic issue is the risk of condensation or too-high levels of straw moisture. In the tested building, there was a situation in which the moisture content exceeded the value of 0.13 [g/g], which is the limit indicated by Krick [26]. These values could be influenced by cracks in the plaster and other anomalies but also by the diffusion-open structure.
Other authors have pointed out the risk of water condensation, e.g., Pritchard [1] points out that people’s lifestyles have changed to ‘high temperature’ and ‘high vapour’ lifestyles over more than 100 years of this technology. Avoiding water penetration appears to be largely a matter of good detailing and competent construction. Dampness can be influenced by poor internal ventilation, high interior moisture, leaks in internal coatings and plasters, and climate. This model study was carried out by Pritchard [1], as well as analyses in three different climates: Cardiff, Aberdeen, and Bordeaux, where in several places, the wall conditions reached moisture levels that would be necessary for the initial germination of mould spores. This high level of moisture occurred at the junction between the straw and the external render.
The studies mentioned in the introduction, carried out independently by Douzane and Ashour [18,36] that measured the humidity of two straw bale buildings in France and Germany, did not indicate a similar risk of condensation in the envelope. The structure of the walls is very similar to the walls used in the analysed building in Poland. In the case of the house described by Douzane, 4 cm limestone plaster was used on the outside and wood-based panels on the inside. In the case of the second building described by Ashour, straw bales were plastered on both sides with 2 cm thick lime plaster. The differences in the humidity of the walls may result from different climatic characteristics, for example, the lower values of heating degree days are indicated in introduction, the quality of plastering and airtightness, better stability of the lime plaster (no shrinkage cracks), and the measurements themselves.
The comparison of the discussed studies with selected tests of moisture content of straw bale walls in existing and inhabited residential buildings or research stations of other authors is presented in Table 6.
In the research carried out by Robinson [34], the influence of weather conditions (rainfall) on changes in straw moisture was observed. Due to the lack of inhabitants, this type of research mainly points to the threat of rainfall and moisture introduced from the outside. Because Robinson and Douzane recorded different results for different positions of the sensors inside the wall, it would be advisable to repeat the tests using three moisture meters and temperature sensors in extreme positions (inside, outside right next to the plaster layer, and in the middle of the beam straw). Ashour further admitted that the timing of some measurements was too short, especially the relative humidity in bales.
Unlike other cases, the building in this study has additional protection against rain in the form of wooden formwork. It can therefore be assumed that most of the moisture came from inside the building as a result of water vapour diffusion.
The limits of relative humidity in a straw wall are indicated by the authors at the level of 80% or 85% [18]. In his work, Bronsema [35] pointed out that the adoption of this one criterion is insufficient, for example, the temperature is important, which may favour or inhibit the development of the fungus. For the research described in this article, the limit value indicated by Krick [26] was adopted. Limit values indicated by various authors are listed in Table 7.
The influence of air tightness of the strawbale building on the condensation phenomenon is indicated by other authors, e.g., Straube [30] and Brojan et al. [45]. Brojan described the air tightness test carried out in a laboratory and an existing building in Radomlje, Slovenia. The building has similar dimensions to the one analysed in this article but has a better compactness ratio. The first test showed tightness at the level of n50 = 9.99 (h−1). After the cracks were repaired, a second test was performed, which showed the tightness of n50—7.52 (h−1). In the article, Brojan [45] also mentioned Racusin’s findings [46] that the average airtightness of straw bale buildings n50 is 5.12 (h−1) (maximum 11.81 (h−1), minimum 2.5 (h−1)). The results of these tests are similar to the values achieved when testing the building described in this article (n50 = 5.33 (h−1), n50 = 4.18 (h−1)). Therefore, it can be concluded that achieving a low tightness as required for energy-efficient or passive buildings (n50 = 0.6 (h−1), n50 = 1.0 (h−1)) requires special measures and careful consideration of many construction details.

5. Conclusions

A study of an existing residential building in Zyndaki made using straw bale technology points to a number of risks. The first is not reaching the assumed energy standard based on energy performance calculations, one of the most important elements of which is the heat transfer coefficient U of external walls. The calculated thermal conductivity coefficient of a straw bale wall with a total thickness of 47 cm was U = 0.19 (W/m2K). The result was slightly below the assumed parameters of U = 0.184 (W/m2K). The result, which was lower than assumed, could have had, among others, insufficient air tightness of the building. Therefore, it is advisable to perform the test again after the building has been resealed with more stable thermal conditions inside and in windless weather. Such a test is planned for early 2023.
The air tightness in the building was tested twice. The result of the first test carried out on 10 December 2020 was n50 = 5.33 (h−1). The other test performed after sealing the external walls on 13 September 2022 amounted to n50 = 4.183 (h−1), an improvement of 1.147 (h−1).
During January 2022, the moisture content of the tested building exceeded the value of 0.13 (g/g) indicated as the limit value for wheat straw [26]. This is the value above which there is a risk of mould. The northern wall recorded a value of 0.22 (g/g). It may have been the result of air leakage and too low diffusion resistance of internal plasters.
All these elements may influence each other. For example, poor air tightness of the partitions may cause increased humidity and water condensation in the wall. On the other hand, increasing the humidity deteriorates the thermal conductivity coefficient, the lower value of which increases the risk of condensation.
Avoiding this risk is possible through good detailing and competent construction, good ventilation inside (which allows low relative humidity of the internal air), and making internal plasters with increased diffusion resistance, e.g., clay plasters with linseed varnish or lime plasters. Exterior plasters with low diffusion resistance, for example, clay plasters, should be protected by a ventilated façade against precipitation. It is advisable to install a weather station to determine the direction and strength of the wind. A weather station will help to interpret the measurements better, especially as the building is located on a hill.
Despite these disadvantages, the comfort of living in this particular building is very high. In addition, such solutions undoubtedly have ecological benefits, such as using straw or other natural materials with a low carbon footprint.
Straw bale buildings in different parts of the world differ in details. Depending on the location of grain crops, climatic conditions in a given year, and the method of harvesting and compression, the final product in the form of straw bales may have slightly different parameters. Furthermore, elements influencing the described parameters may result from different ways of constructing the building, for example, work done by unskilled workers and different types of plastering with clay. Climate differences in which the building is used are another element affecting the parameters of the building. Unfortunately, there is only a small database in the literature on straw buildings in the cool climate of the northern hemisphere. For these reasons, the author hopes that the above work will add new value to this field of research.

Funding

This research was funded by Warsaw University of Technology, Faculty of Architecture grant number 504/04541/1010/43.010006.

Institutional Review Board Statement

Not applicable.

Informed Consent Statement

Not applicable.

Data Availability Statement

Our production editor has completed thorough layout work for the references. Thank you for your cooperation.

Conflicts of Interest

The authors declare no conflict of interest.

References

  1. Pritchard, M.B.; Pitts, A. Evaluation of strawbale building: Benefits and risks. Archit. Sci. Rev. 2006, 49, 372–384. [Google Scholar] [CrossRef]
  2. Jacques, S.L. Strawbale Construction. In Design for Sustainability: A Sourcebook of Integrated Ecological Solutions; Birkeland, J., Ed.; Taylor & Francis Group: London, UK, 2002; pp. 197–199. [Google Scholar] [CrossRef]
  3. Tlaiji, G.; Ouldboukhitine, S.; Pennec, F.; Biwole, P. Thermal and mechanical behavior of straw-based construction: A review. Constr. Build. Mater. 2022, 316, 125915. [Google Scholar] [CrossRef]
  4. European Straw Building Association ESBA and UP STRAW Achievements. Available online: https://strawbuilding.eu/ (accessed on 21 September 2022).
  5. FASBA—Fachverband Strohballenbau Deutschland e.V. Available online: https://fasba.de/ (accessed on 1 December 2022).
  6. RFCP—Le Réseau Français de la Construction Paille. Available online: https://www.rfcp.fr/ (accessed on 1 December 2022).
  7. ASBN—Austrian Strawbale Network. Available online: https://baubiologie.at/strohballenbau/) (accessed on 1 December 2022).
  8. Ogólnopolskie Stowarzyszenie Budownictwa Naturalnego. Available online: http://www.osbn.pl (accessed on 1 December 2022).
  9. Zatylny, M. Uwarunkowania Formalno-Prawne dla Budownictwa Naturalnego w Europie i Polsce ze Szczególnym Uwzględnieniem Zastosowania Kostek Słomy; Program Narodów Zjednoczonych ds. Rozwoju (UNDP): Warszawa, Poland, 2014. [Google Scholar]
  10. Lehner, P.; Horňáková, M.; Vlček, P.; Teslík, J. Experimental investigation of two test setups on straw bales used as load-bearing elements of buildings. Buildings 2021, 11, 539. [Google Scholar] [CrossRef]
  11. Ashour, T.; Wu, W. Using of barley straw as building material. In Barley: Production, Cultivation and Uses; Elfson, S.B., Ed.; Nova Science Publishers, Inc.: Hauppauge, NY, USA, 2011; pp. 273–300. [Google Scholar]
  12. Pierzchalski, M. Architektoniczna Optymalizacja Budynków Mieszkalnych Jednorodzinnych w Zakresie Oddziaływania na Środowisko Naturalne Przy Wykorzystaniu Oceny Cyklu Życia (LCA). Ph.D. Thesis, Politechnika Warszawska, Warsaw, Poland, 2019. [Google Scholar]
  13. Goodhew, S.; Griffiths, R. Sustainable earth walls to meet the building regulations. Energy Build. 2005, 37, 451–459. [Google Scholar] [CrossRef]
  14. Shea, A.; Wall, K.; Walker, P. Evaluation of the thermal performance of an innovative prefabricated natural plant fibre building system. Build. Serv. Eng. Res. Technol. 2013, 34, 369–380. [Google Scholar] [CrossRef] [Green Version]
  15. Munch-Andersen, J.; Andersen, B.M. Straw Bale Houses—Design and Material Properties, Danish Building and Urban Research. Available online: http://www.baubiologie.at/download/jma_slides_halmhuse.pdf (accessed on 1 December 2022).
  16. Costes, J.-P.; Evrard, A.; Biot, B.; Keutgen, G.; Daras, A.; Dubois, S.; Lebeau, F.; Courard, L. Thermal conductivity of straw bales: Full size measurements considering the direction of the heat flow. Buildings 2017, 7, 11. [Google Scholar] [CrossRef] [Green Version]
  17. D’Alessandro, F.; Bianchi, F.; Baldinelli, G.; Rotili, A.; Schiavoni, S. Straw bale constructions: Laboratory, in field and numerical assessment of energy and environmental performance. J. Build. Eng. 2017, 11, 56–68. [Google Scholar] [CrossRef]
  18. Douzane, O.; Promis, G.; Roucoult, J.M.; Le, A.D.T.; Langlet, T. Hygrothermal performance of a straw bale building: In situ and laboratory investigations. J. Build. Eng. 2016, 8, 91–98. [Google Scholar] [CrossRef]
  19. Bau EPD GmbH. EPD—Environmental Product Declaration; EPD-FASBA-2014-1-ECOINVENT; Baustroh Fachverband Strohballenbau Deutschland (FASBA) e.V.: Verden, Germany, 2014. [Google Scholar]
  20. Janowska-Renkas, E.; Król, A.; Pochwała, S.; Pałubski, D.; Adamska, M.; Klementowski, I. The Fire Resistance and Heat Conductivity of Natural Construction Material Based on Straw and Numerical Simulation of Building Energy Demand. Energies 2022, 15, 1155. [Google Scholar] [CrossRef]
  21. Minke, G.; Krick, B. Straw Bale Construction Manual: Design and Technology of a Sustainable Architecture; Birkhäuser Verlag GmbH: Basel, Switzerland, 2020. [Google Scholar]
  22. Chaussinand, A.; Scartezzini, J.L.; Nik, V. Straw bale: A waste from agriculture, a new construction material for sustainable buildings. Energy Procedia 2015, 78, 297–302. [Google Scholar] [CrossRef]
  23. Lal, R. Sequestering carbon in soils of agro-ecosystems. Food Policy 2011, 36 (Suppl. S1), S33–S39. [Google Scholar] [CrossRef]
  24. Building Research Institute (ITB). Badanie Współczynnika Przewodzenia Ciepła Kostek Słomy; Nr pracy: 02236/15/Z00NG (LFS00-02236/15/Z00NF); Building Research Institute: Warsaw, Poland, 2015. [Google Scholar]
  25. Minke, G.; Krick, B. Podręcznik Budowania z Kostek Słomy, Podstawy, Konstrukcje, Przykłady; Fundacja Cohabitat: Łódź, Poland, 2015. [Google Scholar]
  26. Krick, B. Untersuchung von Strohballen und Strohballenkonstruktionen Hinsichtlich Ihrer Anwendung für ein Energiesparendes Bauen Unter Besonderer Berücksichtigung der Lasttragenden Bauweise; Kassel University Press GmbH: Kassel, Germany, 2008; Available online: http://www.uni-kassel.de/upress/online/frei/978-3-89958-422-6.volltext.frei.pdf (accessed on 1 December 2022).
  27. González, A.D. Energy and carbon embodied in straw and clay wall blocks produced locally in the Andean Patagonia. Energy Build. 2014, 70, 15–22. [Google Scholar] [CrossRef]
  28. Latif, E.; Ciupala, M.A.; Tucker, S.; Wijeyesekera, D.C.; Newport, D.J. Hygrothermal performance of wood-hemp insulation in timber frame wall panels with and without a vapour barrier. Build. Environ. 2015, 92, 122–134. [Google Scholar] [CrossRef] [Green Version]
  29. Pihelo, P.; Kikkas, H.; Kalamees, T. Hygrothermal Performance of Highly Insulated Timber-frame External Wall. Energy Procedia 2016, 96, 685–695. [Google Scholar] [CrossRef] [Green Version]
  30. Straube, J. BSD-112: Building Science for Strawbale Buildings. Building Science Corporation, 30 January 2009. Available online: https://www.buildingscience.com/documents/digests/bsd-112-building-science-for-strawbale-buildings (accessed on 5 November 2022).
  31. Marques, B.; Tadeu, A.; Almeida, J.; António, J.; de Brito, J. Characterisation of sustainable building walls made from rice straw bales. J. Build. Eng. 2020, 28, 101041. [Google Scholar] [CrossRef]
  32. Bennett, J.; Butler, J.; Jones, B.; Sutherland, E. Straw Construction in the UK; Technical Guide First Edition; School of Natural Building: Todmorden West Yorkshire, UK, 2022. [Google Scholar]
  33. Langmans, J.; Versele, A.; Roels, S. On the Hygrothermal Performance of Straw Bale Wall Elements in Belgium. 2014. Available online: http://nimbusvault.net/publications/koala/sebra (accessed on 1 December 2022).
  34. Robinson, J.; Aoun, H.K.; Davison, M. Determining Moisture Levels in Straw Bale Construction. Procedia Eng. 2017, 171, 1526–1534. [Google Scholar] [CrossRef]
  35. Bronsema, N.R. Moisture Movement and Mould Management in Straw Bale Walls for a Cold Climate; University of Waterloo: Waterloo, Belgium, 2010. [Google Scholar]
  36. Ashour, T.; Georg, H.; Wu, W. Performance of straw bale wall: A case of study. Energy Build. 2011, 43, 1960–1967. [Google Scholar] [CrossRef]
  37. Eurostat. Heating and Cooling Degree Days—Statistics. May 2022. Available online: https://ec.europa.eu/eurostat/statistics-explained/index.php?title=Heating_and_cooling_degree_days_-_statistics (accessed on 21 November 2022).
  38. Fromme, I.; Herz, U. Lehm- und Kalkputze: Mörtel Herstellen, Wände Verputzen, Oberflächen Gestalten; Öekobuch Verlag GmbH: Rastede, Germany, 2012. [Google Scholar]
  39. Lets Control It—ESPEasy. Available online: https://www.letscontrolit.com/wiki/index.php?title=Main_Page (accessed on 12 September 2022).
  40. Prus, S. Raport z Kontroli Termowizyjnej Nr 10/12/2020/TR 001; Prusdis: Sędziszów, Poland, 2020. [Google Scholar]
  41. Prus, S. Raport Badania Szczelności Powietrznej Obudowy Budynku; Prusdis: Sędziszów, Poland, 2020. [Google Scholar]
  42. O’Hegarty, R.; Kinnane, O.; Lennon, D.; Colclough, S. In-situ U-value monitoring of highly insulated building envelopes: Review and experimental investigation. Energy Build. 2021, 252, 111447. [Google Scholar] [CrossRef]
  43. Gaspar, K.; Casals, M.; Gangolells, M. In situ measurement of façades with a low U-value: Avoiding deviations. Energy Build. 2018, 170, 61–73. [Google Scholar] [CrossRef]
  44. Atsonios, I.A.; Mandilaras, I.D.; Kontogeorgos, D.A.; Founti, M.A. Two new methods for the in-situ measurement of the overall thermal transmittance of cold frame lightweight steel-framed walls. Energy Build. 2018, 170, 183–194. [Google Scholar] [CrossRef]
  45. Brojan, L.; Weil, B.; Clouston, P.L. Air Tightness of Straw Bale Construction. J. Green Build. 2015, 10, 99–113. [Google Scholar] [CrossRef]
  46. Racusin, J.D.; Graham, B.; McArleton, A. Final Report for Energy Performance of Straw Bale Buildings Research Program; Montgomery Publishing: Montgomery, AL, USA, 2011. [Google Scholar]
Figure 1. Single-family straw bale dwelling under study. Photo: Michał Pierzchalski.
Sustainability 14 16511 g001
Figure 2. Ground floor plan. 1—vestibule (5.64 m2), 2—living room (24.49 m2), 3—bathroom (5.81 m2), 4—bedroom (12.47 m2), 5—utility room (2.76 m2), 6—sauna (2.50 m2). Own drawing.
Sustainability 14 16511 g002
Figure 3. Attic floor plan. 7—room (usable area: 4.78 m2, floor area: 24.86 m2). Own drawing.
Sustainability 14 16511 g003
Figure 4. (a) The cross-section of the building, (b) detail—horizontal section of the wall. Own drawing.
Sustainability 14 16511 g004
Figure 5. The timber structure of the building. Photo: Michał Pierzchalski.
Sustainability 14 16511 g005
Figure 6. Outer wall filled with bales of compressed straw. Photo: Michał Pierzchalski.
Sustainability 14 16511 g006
Figure 7. Exterior wall in the process of being plastered with clay. Photo: Michał Pierzchalski.
Sustainability 14 16511 g007
Figure 8. Measurements of the U-value of a wall using the greenTEG sSKIN kit. The measurement software greenTEG logger is visible on the computer screen. Photo: Michał Pierzchalski.
Sustainability 14 16511 g008
Figure 9. View of the gSKIN sensor and temperature sensor. Photo: Michał Pierzchalski.
Sustainability 14 16511 g009
Figure 10. Water vapour pressure distribution in the partition. Reference variant. Internal temperature θint = 20 °C, internal relative humidity φint = 50%, outdoor temperature θext = −5 °C, outdoor relative humidity φext = 90%. Red—temperature distribution θ (°C), blue—distribution of water vapour saturation pressure Psat(Pa), green—distribution of partial pressure P (Pa). Source: Analysis performed with the AudytorOZC 7.0 Pro.
Sustainability 14 16511 g010
Figure 11. Water vapour pressure distribution in the partition. A variant with a 3 cm thick external clay render. The distance between the blue and green lines has decreased than in the reference variant—so the risk of condensation inside the partition has increased. Internal temperature θint = 20 °C, internal relative humidity φint = 50%, outdoor temperature θext = −5 °C, outdoor relative humidity φext = 90%. Red—temperature distribution θ (°C), blue—distribution of water vapour saturation pressure Psat(Pa), green—distribution of partial pressure P (Pa), yellow—condensation zone. Source: Analysis performed with the AudytorOZC 7.0 Pro.
Sustainability 14 16511 g011
Figure 12. Water vapour pressure distribution in the partition. A variant with a 1 cm thick external lime render. The distance between the blue lines has decreased than in the reference variant—so the risk of condensation inside the partition has increased. Internal temperature θint = 20 °C, internal relative humidity φint = 50%, outdoor temperature θext = −5 °C, outdoor relative humidity φext = 90%. Red—temperature distribution θ (°C), blue—distribution of water vapour saturation pressure Psat(Pa), green—distribution of partial pressure P (Pa), yellow—condensation zone. Source: Analysis performed with the AudytorOZC 7.0 Pro.
Sustainability 14 16511 g012
Figure 13. Temperature sensors (DS18B20) show the temperature distribution inside the wall on 5 January 2022. Sensors are distributed evenly throughout the thickness of the wall (45 cm). S1—sensor on the outside of the wall, S6—sensor on the interior plaster layer. The black colour (BME280) is the temperature and humidity sensor used to analyse the moisture content of the straw. Source: Author’s analysis using Grafana web application.
Sustainability 14 16511 g013
Figure 14. Visualised measurements of indoor relative humidity and carbon dioxide concentration. Carbon concentration measurements indicate periods of occupant presence. Author’s analysis using Grafana web application.
Sustainability 14 16511 g014
Figure 15. Visualisation of temperature and relative humidity measurements inside the partition. Measurements were recorded from two BME280 sensors mounted in the exterior walls on the south and north sides. The vertical axis on the left is temperature (°C), and the axis on the right is relative humidity (%). Measurements from 1 January 2022 to 31 March 2022. Source: Author’s analysis using Grafana web application.
Sustainability 14 16511 g015
Figure 16. Measurement results of the U-value of an external wall using the greenTEC kit. The measurement is in accordance with ISO 9869-1:2014. Source: GreenTEG logger v1.02.09 report.
Sustainability 14 16511 g016
Figure 17. Measurements of the U-value of an external wall using the greenTEC kit. The measurement is in accordance with ISO 9869-1:2014. Source: GreenTEG logger v1.02.09 report.
Sustainability 14 16511 g017
Figure 18. Measurements of the U-value of an external wall using the greenTEC kit. The measurement did not comply with ISO 9869-1:2014. Source: GreenTEG logger v1.02.09 report.
Sustainability 14 16511 g018
Figure 19. Analysis charts showing the water content of straw in g/g for selected time periods: (a) 2 January 2022–10 January 2022, (b) 15 January2022–24 January 2022, (c) 31 January 2022–10 February 2022, (d) 13 March 2022–22 March 2022. Source: own calculations.
Sustainability 14 16511 g019
Figure 20. Climatic analysis of wind conditions at the Kętrzyn weather station for a typical meteorological year in the month of January. Source: A Screenshot from Climate Consultant 6.0 developed by The Society of Building Science Educators (SBSE).
Sustainability 14 16511 g020
Table 1. Summary of thermal parameters of straw bale. Source: [12] based on other authors summarised in column 4.
Volumetric Mass
Density (kg/m3)
Thermal Conductivity
Coefficient λ (W/mK)
Data Source
Parallel Position
of Steams
Perpendicular
Position of Steams
600.0670.067[13]
630.059-[14]
750.0560.052[15] from [16]
750.0570.052[15,17]
800.072 (λ10 dry)0.051 (λ10 dry)[18]
800.067 (λ0)0.046 (λ0)[18]
62/810.0820.057[15]
87.40.062-[14]
-0.0610.048[18]
900.0600.056[15,17]
85–115 (nominal 100)-0.044 (λ10 dry)/0.052[19]
100-0.038 1[15,17]
about 1000.073 (λD) 2-[18]
105.56 30.081 30.069 3[20]
90–1100.0800.052[21]
107–1140.064-[14]
about 1500.0600.048[15,17]
-0.08 ± 0.0050.080 ±0.005[22]
- 0.045[5] from [16]
about 80–1000.085 4-4
1 Similar results were obtained in studies carried out by the German Forschungsinstitut für Wärmeschutz using the heat flux sensor method and by the Austrian GrAT Gruppe Angepasste Technologie using the hot plate method. These results do not seem to be possible to obtain under real conditions under the incorporation of straw bales in a building [23]. 2 During the tests carried out by the Instytut Techniki Budowlanej (ITB), 10 samples were tested, the lowest λ coefficient of which was 0.06958 (W/(mK)) and the highest 0.0708 (W/(mK)) [24]. 3 The average value from the measurements of the 10 samples tested by Janowska-Renkas [20]. 4 Value was calculated based on in situ wall measurements in this study. It was assumed that the influence of a possible thermal bridge in the place of occurrence of wooden posts is negligible due to additional insulation with a better insulator than straw.
Table 2. Physical parameters of straw bales. Source: own compilation based on publications indicated in the last column.
ParameterValueUnitData Source
Water vapor diffusion resistance factor, μ2-[25]
Specific heat1.8 ± 0.1kJ/kg K[22]
Specific resistance of air flow1.7(kPa s)/m2[24]
Embodied Energy227MJ/Mg[26]
Embodied carbon (without carbon capture)6.68kg CO2/m3Mean of [19,27]
Embodied carbon (with carbon capture)−127.13kg CO2/m3[19]
Volumetric density70–100kg/m3[24,25,26]
Table 3. Maximum guaranteed moisture content without risk of mould. Source: [26].
Type of CerealMaximum Guaranteed Moisture Content without Mould u (g/g)
Wheat 10.13
Barley0.15
Rye0.12
Spelt0.13
Hemp fibre0.12
Miscanthus0.09
1 Wheat straw was used in the study building.
Table 4. The results of the first Blower Door Test performed on 10 December 2020. Source: Airtightness testing report of the building envelope [41].
Results95% Confidence IntervalUncertainty
Air flow at 50 Pa, V50 (m3/h)1045938.51160+/−10.7%
Air changes at 50 Pa, n50 (h−1)5.3347355920+/−11.1%
Table 5. The results of the second Blower Door Test performed on 13 September 2022. Source: Retrotec FanTestic 5.8.37 software.
Results95% Confidence IntervalUncertainty
Air flow at 50 Pa, V50 (m3/h)819.62754.2890.7+/−8.3%
Air changes at 50 Pa, n50 (h−1)418338134554+/−8.8%
Table 6. Comparison of selected results of moisture content of straw bale walls in existing and inhabited residential buildings or test rigs made by other authors. Source: Robinson et al., Bronsema, Douzane et al., Ashour, and the results of this research.
Location, Type of BuildingType of WallsMethod of MeasurementResultsAuthors
Lincolnshire, UK
A test rig (uninhabited)
Wheat straw-bale with a lime mortar mix (around 20 mm externally and 10 mm internally)Moisture content using a Timerbermaster and Balemaster resistance meterMax. 80–85% RH,
Moisture content 20%, peak even 25%
Robinson, Aoun, and Davison [34]
Waterloo, Canada
The Building Engineering Group (BEG) test facility at the University
of Waterloo (uninhabited)
Two straw bale walls: (a) with cement-lime plasters a. 2.5 cm, (b) with earth-straw plasters a. 2.5 cmRelative humidity, moisture content and temperature sensors RH over 80% in the long term (in winter), moisture content over 20% in winter (even over 40%)Bronsema [35]
Voyennes, France
Single-family residential building
Straw bale with average 3.5 cm-thick external layer. 13 mm plasterboard on the insideType-T thermocouples and HMP60 humidity probe (temperature and relative humidity)Maximum value was 82% RH,
19.5% moisture content 1
Douzane et al. [18]
Bavaria, Germany,
Single-family residential building
Straw bale with calcium stucco outside plaster 2 cm and inside plaster 2 cm. Combined temperature and relative humidity sensors of the type of Negative Temperature Coefficient (NTC)Moisture content a. 11%
pH value 7.29
Ashour, Georg, and Wu [36]
Zyndaki, Poland, Single-family residential buildingWheat straw bale with clay plaster, internal plaster average 3 cm, external average 1 cm. Additional wooden outer cladding (with ventilated air gap)Combined temperature and relative humidity sensor BME280Moisture content 0.22 (g/g) (22%)
RH up to 100%
Research covered in this article
1—Based on the sorption isotherm data, estimated an approximate value of 19.5% of moisture content by Douzane.
Table 7. Comparison of the maximum values of moisture content or relative humidity. Source: Krick, Douzane et al., Ashour et al., Straube.
Type of StrawMaximum Values for Water Content or Relative HumidityAuthor
Wheat0.13 (g/g) (13%) moisture contentKrick [26]
Barley0.15 (g/g) (15%) moisture contentKrick [26]
Generally straw20% moisture contentDouzane et al. [18]
Generally straw15% moisture contentAshour et al. [36]
Generally straw80% RHStraube [30]
Generally straw85% RHDouzane et al. [18]
Publisher’s Note: MDPI stays neutral with regard to jurisdictional claims in published maps and institutional affiliations.

