Article

Global Assessment of Groundwater Stress Vis-à-Vis Sustainability of Irrigated Food Production

1
Department of Civil Engineering, University of Victoria, Victoria, BC V8P 5C2, Canada
2
Waterplan (YC S21), San Fransisco, CA 94115, USA
3
Department of Infrastructure Engineering, University of Melbourne, Melbourne, VIC 3010, Australia
4
AgFE Department, Indian Institute of Technology Kharagpur, Kharagpur 721302, West Bengal, India
5
School of Earth and Environmental Sciences, The University of Queensland, Brisbane, QLD 4072, Australia
*
Author to whom correspondence should be addressed.
Sustainability 2022, 14(24), 16896; https://doi.org/10.3390/su142416896
Submission received: 19 October 2022 / Revised: 30 November 2022 / Accepted: 8 December 2022 / Published: 16 December 2022
(This article belongs to the Special Issue Groundwater Vulnerability and Sustainability)

Abstract

:
Due to poor water resources management, groundwater-dependent agriculture induces substantial stress on several aquifer systems worldwide, which poses a serious threat to water and food security. However, only a few studies have addressed this vital issue. This study aimed to evaluate stress on aquifers due to the overuse of groundwater for food production and explore pathways for stress reduction via improved irrigation efficiency and productivity. Groundwater stress was characterized using the ratio of water use to availability, with consideration for environmental flows. The results indicated that out of 107 countries—dependent on groundwater irrigation, about half are overexploiting groundwater, while one-fifth of these countries are extracting moderately-to heavily. Over 90% of the non-renewable groundwater abstraction occurs in 7 countries. Further, about 450 million tonnes (Mt) of global annual food production is from non-renewable groundwater exploitation. If the existing irrigation efficiency is increased to 90%, current groundwater stress would be reduced by 40%. Additionally, in unstressed regions, it would be possible to produce additional 300 Mt of food by using saved water while maintaining groundwater stress at acceptable levels. Moreover, improved water productivity in conjunction with increased irrigation efficiency could reduce the current level of unsustainable food production by 47%. These results provide important insights into the dynamics of irrigation stress on groundwater systems, and the role of managerial interventions.

1. Introduction

Irrigated agriculture contributes 40% of global food production from 17% of agricultural land and is the backbone of food security [1,2]. According to the FAO, irrigation has improved the economic output of developing countries by more than 400% [3]. Groundwater, once a temporary source for irrigation during dry seasons, has now become the primary source particularly in water-limited areas. Year-round availability and minimal infrastructure requirements make groundwater irrigation an attractive choice for farmers around the world. Although withdrawn for varying purposes, 70% of groundwater withdrawal is for irrigation [4,5,6]. Counterbalancing its benefits, excessive irrigation has led to serious environmental and resource issues such as water scarcity, waterlogging and salinity [5,7]. For sustainable groundwater resource development, water abstracted from groundwater storage needs to be recharged either naturally or artificially. However, in water-limited areas, abstraction rates often far exceed recharge rates. This results in declining groundwater storage and may lead to the drying of aquifers or the use of fossil groundwater which cannot be replenished, with impacts on water availability for both humans and the environment [8]. This is of great concern considering the increasing world population and changing climate. According to van Dijk et al. [9], there could be a 35% to 56% increase in global food demand between 2010 and 2050. The links between groundwater stress and groundwater irrigated food production will be further complicated in the future by changing climate. This accelerated rate of change will affect water resources in a variety of ways [9,10,11,12]. Compared with surface water, less attention has been given to studying climate change impacts on groundwater. Climate and population driven increases in irrigation demand and the subsequent shift to greater use of groundwater for irrigation have resulted in lowering of groundwater tables to an unsustainable level in many parts of the world [13,14,15,16,17]. Eventually, the drop in the water table adversely affects groundwater dependent food production. Thus, a feedback loop is formed. Without fundamental changes, this will impose greater pressure on both surface and groundwater resources. Therefore, there is an urgent need to assess groundwater stress, the factors causing it and potential pathways to stress reduction.
Numerous studies have attempted to quantify large-scale groundwater depletion using various techniques such as global hydrological models [2,18,19,20,21] and GRACE satellite data [22,23,24,25]. Most have used two similar global hydrological models, PCRGlobWB [2,14,18,19,21,26] and WaterGAP [19,20,27]. The use of a common model and methodology risks replicating analytical biases, hence there is a benefit in comparing estimates from different approaches. Another limitation of existing studies is that they have not considered environmental flow requirements [8,28]. Neglecting this component leads to overestimation of water availability for extraction, leading to an underestimation of stress [8,29]. Of the many studied mentioned earlier, only Gleeson et al. [21] and Dalin et al. [30] consider environmental flow requirement in the analysis. Furthermore, despite intensive evidence of irrigation as a dominant cause of groundwater depletion, only a few studies have explicitly examined the relationship between these two factors at a global scale [2,20,30]. Wada et al. [2] quantified irrigation demands met from renewable and non-renewable groundwater extraction. Building on the work of Wada et al. [2], Dalin et al. [30] quantified the groundwater depletion embedded in global food production and trade. Neither of the studies examined adaptations to remedy groundwater stress or quantification of the impact of any sustainable managerial interventions. This study aims to: (1) estimate groundwater stress globally at a resolution of 0.5° (55 × 55 km at equator) and aggregate it at the national scale; (2) estimate the amount of food produced from unsustainable groundwater extraction; and (3) examine potential scenarios for reducing groundwater stress and increasing sustainable food production. This study adopts a spatial analysis approach that integrates information on groundwater recharge, groundwater extraction, irrigation productivity and environmental baseflow requirements to analyze groundwater stress globally. The nonrenewable groundwater abstraction for irrigation and the use-withdrawal ratio were used to assess the stress imposed by food production on global aquifers. This is an alternate approach to existing studies, which enables to assess the existing studies independent of the model uncertainties. The environmental base flow requirement is also taken into account. In addition, a novel attempt to quantify the effect of different managerial interventions in groundwater stress management through improved irrigation efficiency and crop productivity is also included in the paper. These methods quantitatively evaluate the alternatives of groundwater stress reduction without compromising the food production.

2. Materials and Methods

2.1. Computation of Groundwater Stress

The stress on groundwater systems due to irrigation was assessed in this study by estimating two factors (1) non-renewable groundwater abstraction for irrigation (NRGA) and (2) groundwater stress index (SR). NRGA was defined as the volume of groundwater extracted for irrigation purposes in excess of natural groundwater replenishment rates (inclusive of allowance for environmental flow requirements). This definition is a modified form of ‘non-renewable groundwater abstraction’ from Wada et al. [2], which focused only on gross irrigation demand. In this study, we reduced recharge by an estimate of the EBFR from the groundwater system when estimating renewable available water (see Section 2.2 for more details).
N R G A = I W W g w ( R E B F R )
S R = I W R g w η ( R E B F R ) = I W W g w ( R E B F R )
where,
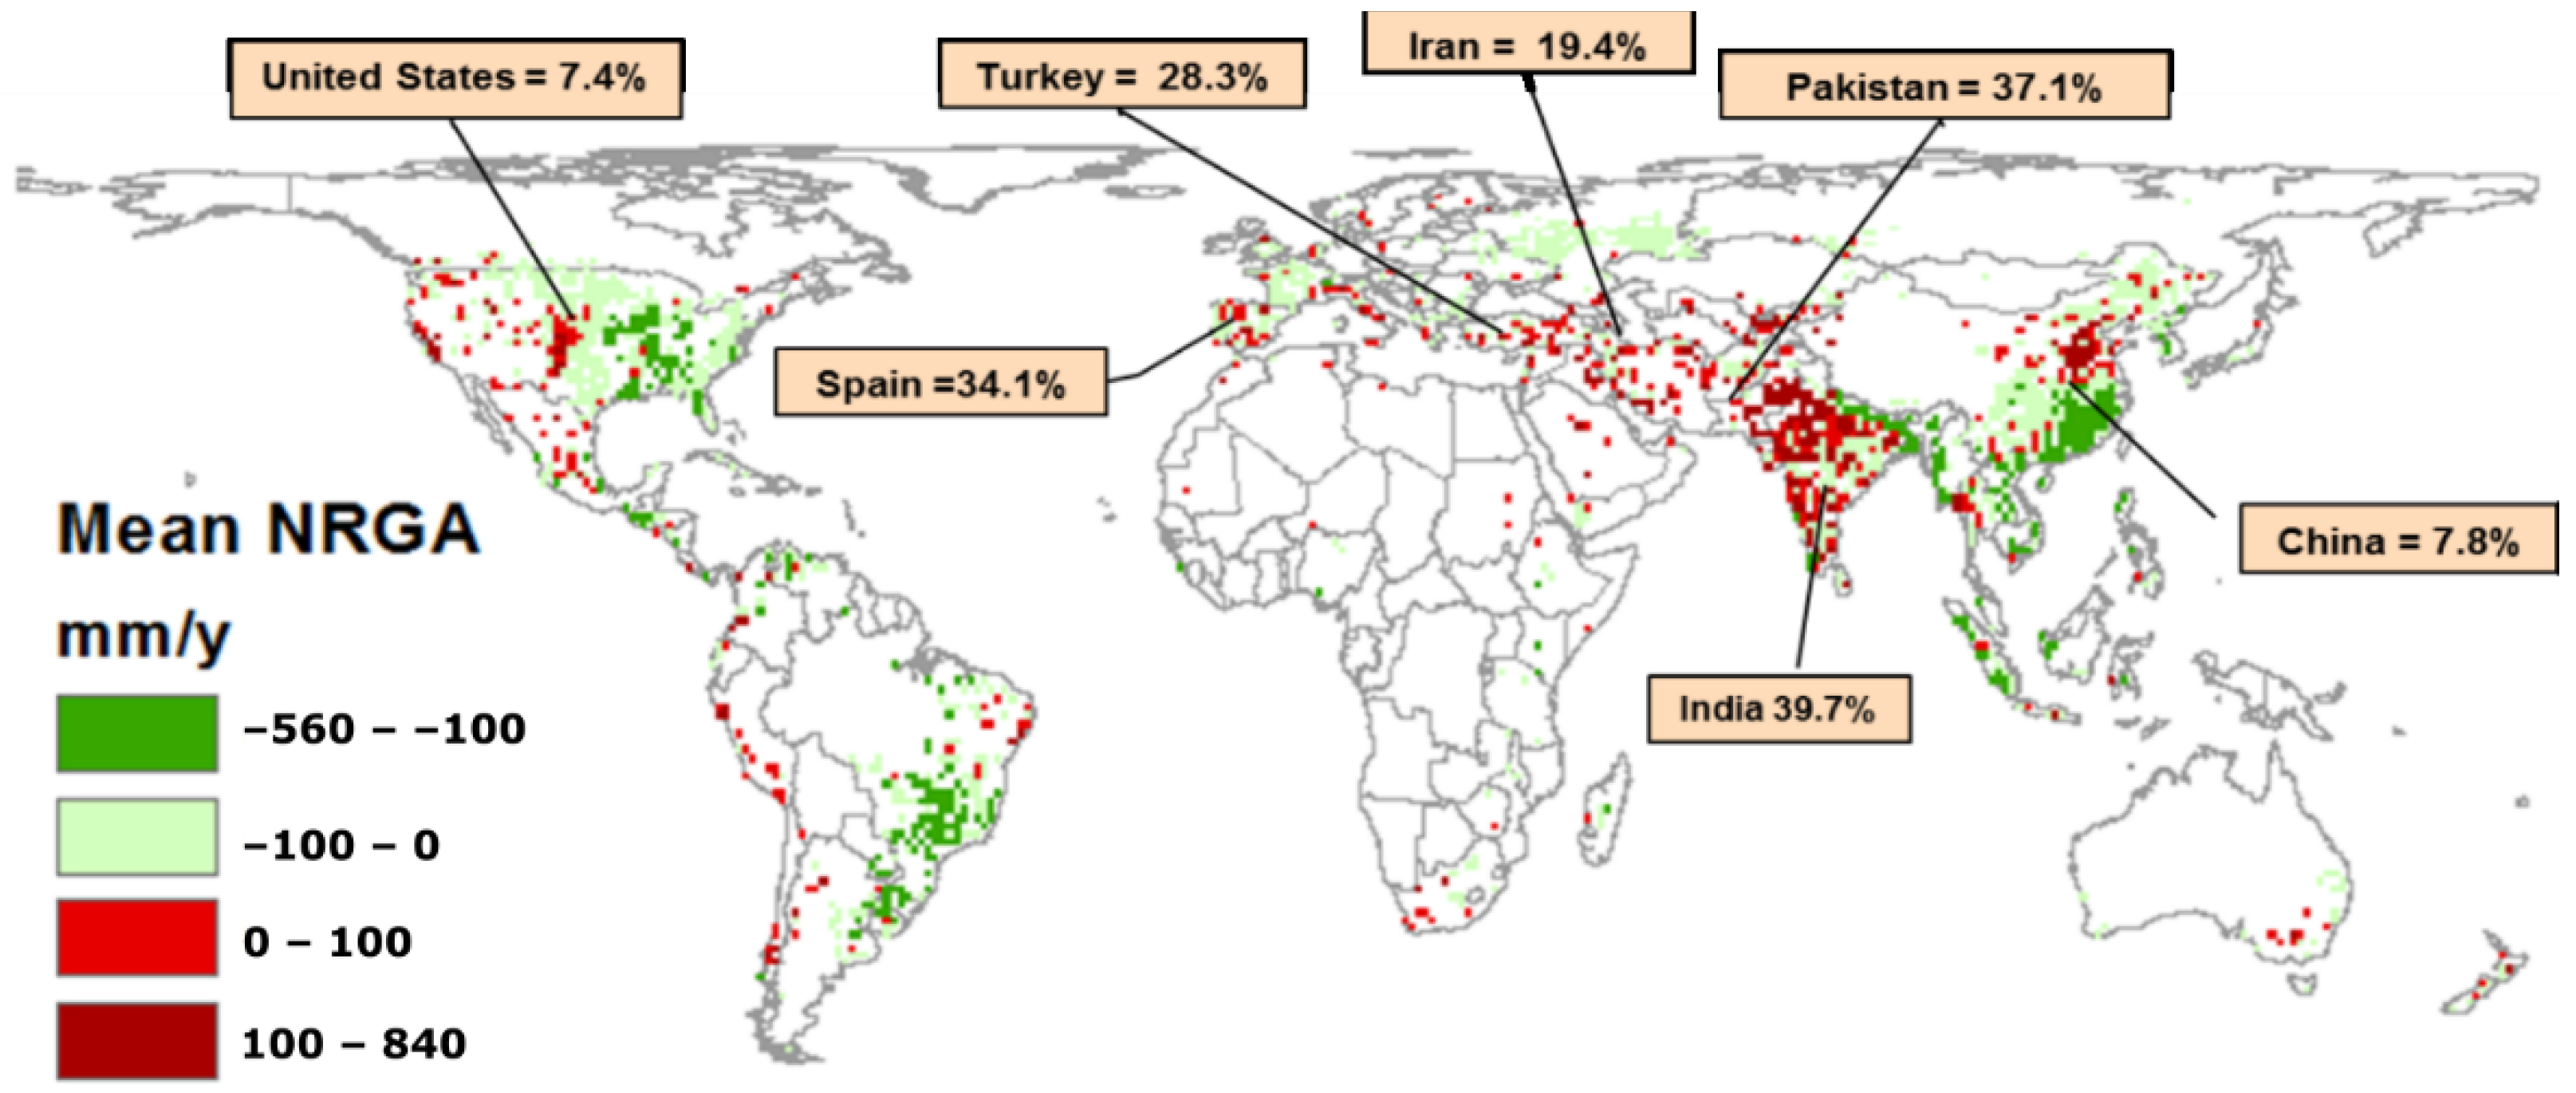
  • NRGA = Non-renewable groundwater abstraction for irrigation (mm year−1)
  • IWWgw = Irrigation water withdrawal from groundwater (mm year−1)
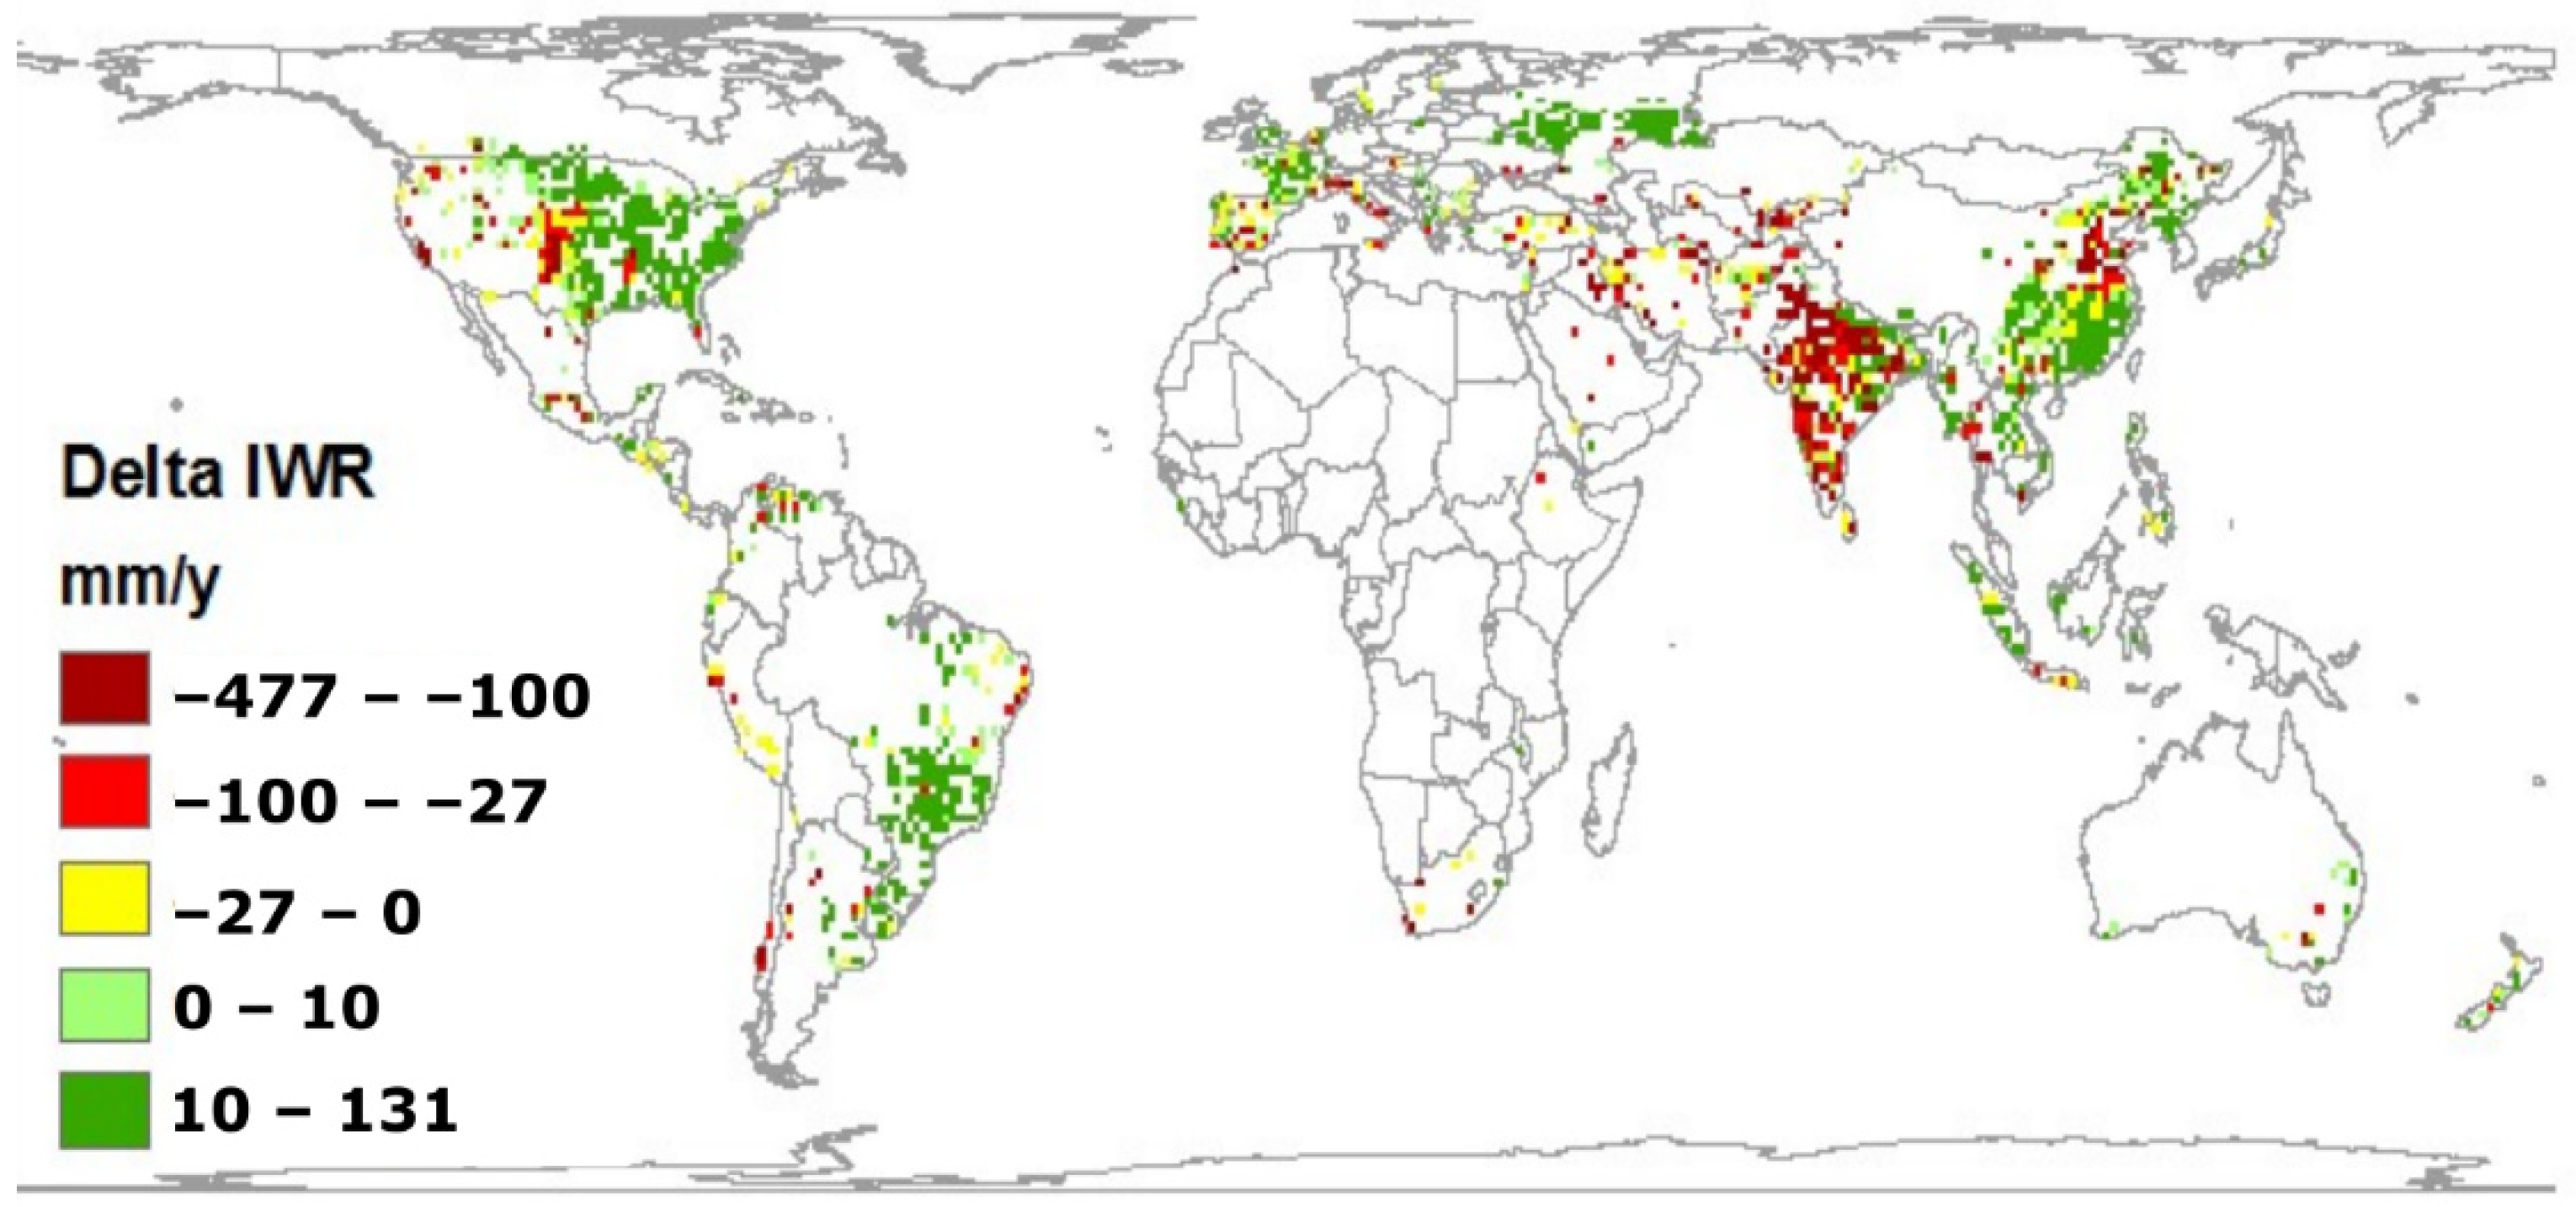
  • IWR = Irrigation water requirement met from groundwater (mm year−1)
  • R = Groundwater recharge (mm year−1)
  • EBFR = Environmental baseflow requirement (mm year−1)
  • SR = Groundwater Stress index (-)
  • H = Country-level irrigation efficiency (-)
Stress in the aquifer system due to irrigation was assessed by calculating the groundwater stress index (SR). SR is defined as the ratio of groundwater use to groundwater availability (Equation (2)) and it is quite similar to the UN Commission on Sustainable Development water scarcity index [31] (see Section 2.2 and Section 2.3 for the details on water use and availability calculations). The SR values used in this study were classified using the Water Stress Index (WSI) scale proposed by Smakhtin [32] (Table 1). According to the WSI scale, SR < 1 means the rate of groundwater extraction is less than the annual groundwater renewal minus environmental requirement, while SR > 1 means that the groundwater extraction exceeds the annual groundwater availability. In the present study, annual stress indices were calculated and then averaged over three decades using the most recently available global land use (i.e., irrigation information). The groundwater stress analysis was conducted by averaging annual stress indices for a period of 34 years (1981 to 2014). The irrigated land use data was only available for 2005 and therefore, the results represent a recent climatological average for the 2005 land use condition.

2.2. Estimation of Groundwater Availability for Irrigation

In this study, the water availability was calculated as the recharge per 0.5° grid cell less the EBFR in that grid. The groundwater recharge estimates used were obtained from a global groundwater recharge model developed by the authors [33]. This is an empirical model for estimating diffuse rainfall recharge. The model estimates groundwater recharge at an annual time step and a spatial resolution of 0.5° (~55 km at equator). The model simulation was conducted for a period of 34 years (1981 to 2014) and a long-term average was used for further analysis. Recharge estimated from the model does not account for recharge by artificial means, riverine recharge or irrigation return flows. The model considered each grid as a bucket without any inter pixel transfer of water. The cells with groundwater irrigation were directly extracted from model outputs. EBFR was estimated using the base flow index method. EBFR was calculated assuming that the percentage contribution from groundwater systems to environmental flow is equal to the baseflow index of the region. It was also assumed that groundwater was the only source of baseflow in each grid. This provides an upper-bound estimate of sustainably allocable water which assumes all groundwater output flows into rivers rather than evaporating, for example through groundwater dependent wetland systems.

2.3. Estimation of Water Use

Water use was estimated as the total groundwater withdrawn for irrigation, which was estimated by dividing the irrigation water requirement (IWR) with country-specific irrigation efficiency. IWR was modelled using the FAO GlobWAT model [34]. This high-resolution model runs at a spatial resolution of 5 arcmin and the model is in the public domain. The main advantage of using GlobWAT over other existing large-scale crop models is that it simulates incremental crop evapotranspiration resulting from irrigation. This model calculates global water balance in two steps: (1) one-dimensional vertical water balance to calculate rainfed evaporation and evaporation from irrigated areas and (2) horizontal water balance to calculate discharge from the basin considering the net irrigation demand. The crop evapotranspiration (ETc) is calculated by multiplying reference crop evapotranspiration (ET0) (calculated by FAO Penman Monteith method) with a growth-stage specific crop coefficient (Kc) (Equation (3)). The Kc values were derived from Global Agricultural Systems Map [35]. Four different Kc values were used per crop corresponding to four growth stages viz., initial/sowing phase, development phase, mid phase and last/harvest phase. The grid-based ETc was area weighted based on the proportion of irrigated area per grid. Thereafter the amount of evapotranspiration due to rain (ETrain) was subtracted from total ETc to obtain incremental evapotranspiration due to irrigation (ETinc-irri) (Equation (4)), which corresponds to the total IWR per grid. The calculation of IWR was done at monthly time steps, and then aggregated to provide annual IWR values for further analysis. Discharge components of the GlobWAT model have previously been validated against discharge data from the Global River Discharge Database [34].
E T c ( t ) = k c × E T 0 ( t )
E T i n c i r r ( t ) = E T c ( t ) E T r a i n ( t )

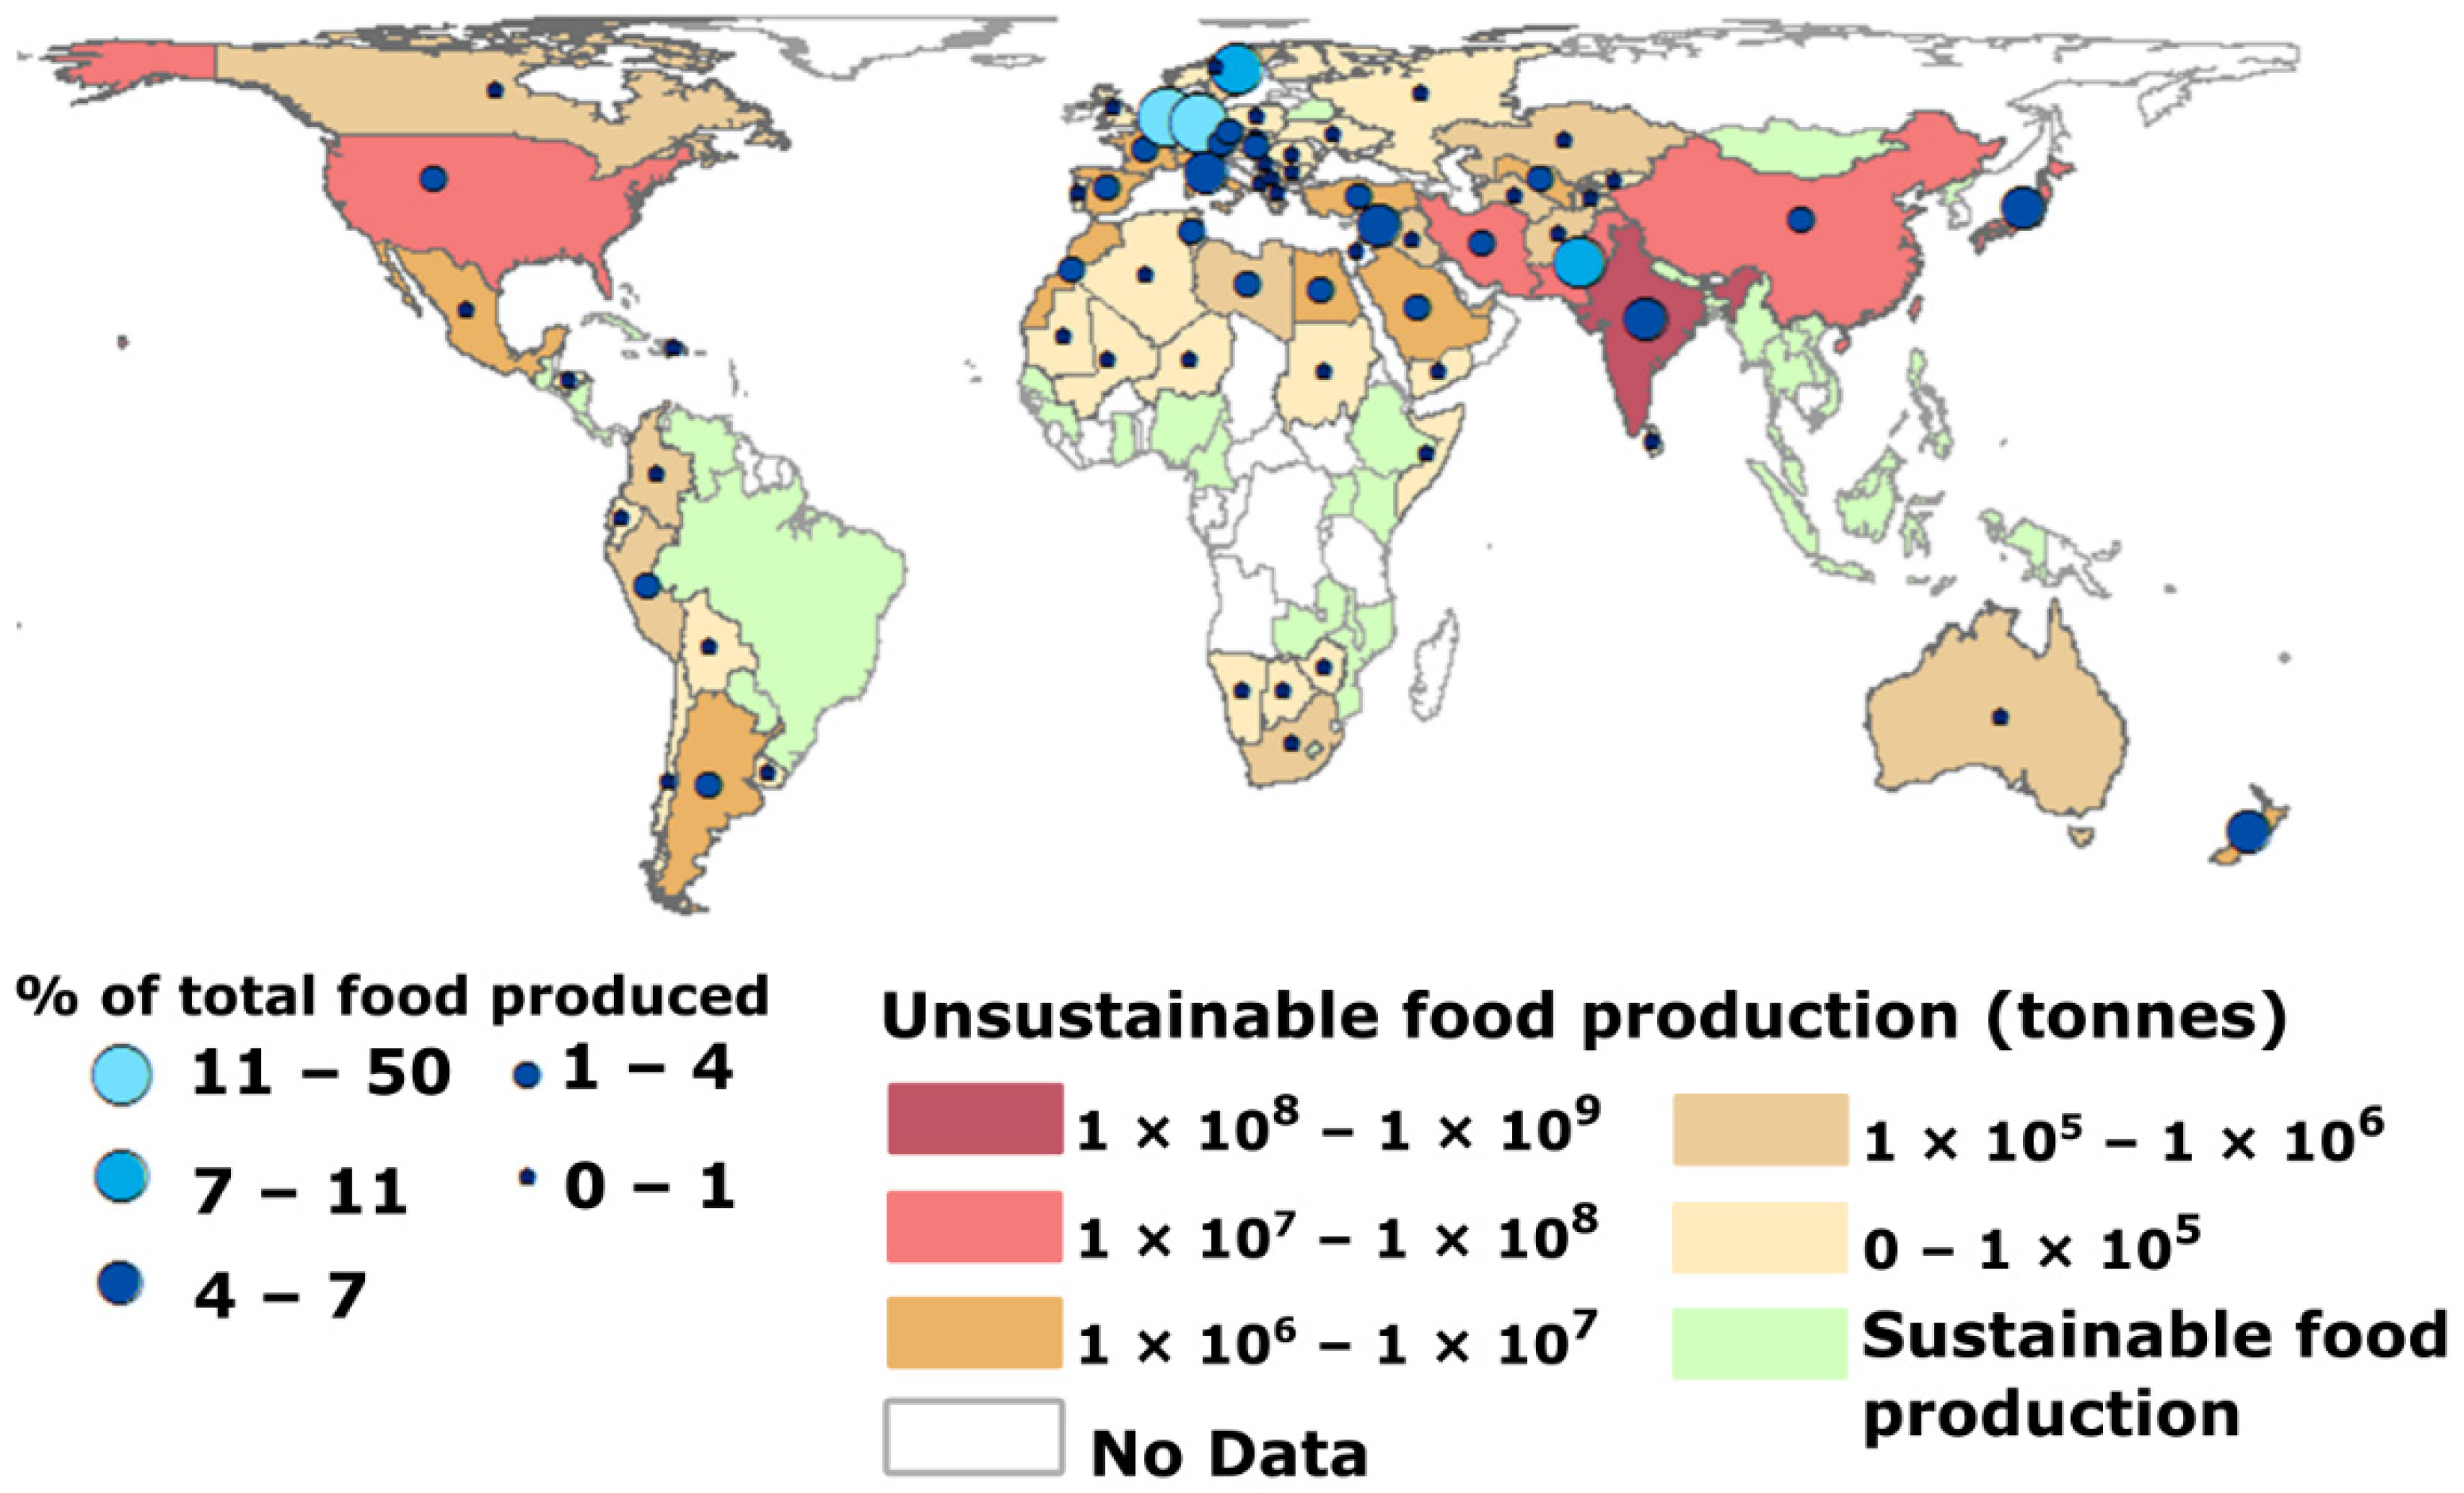
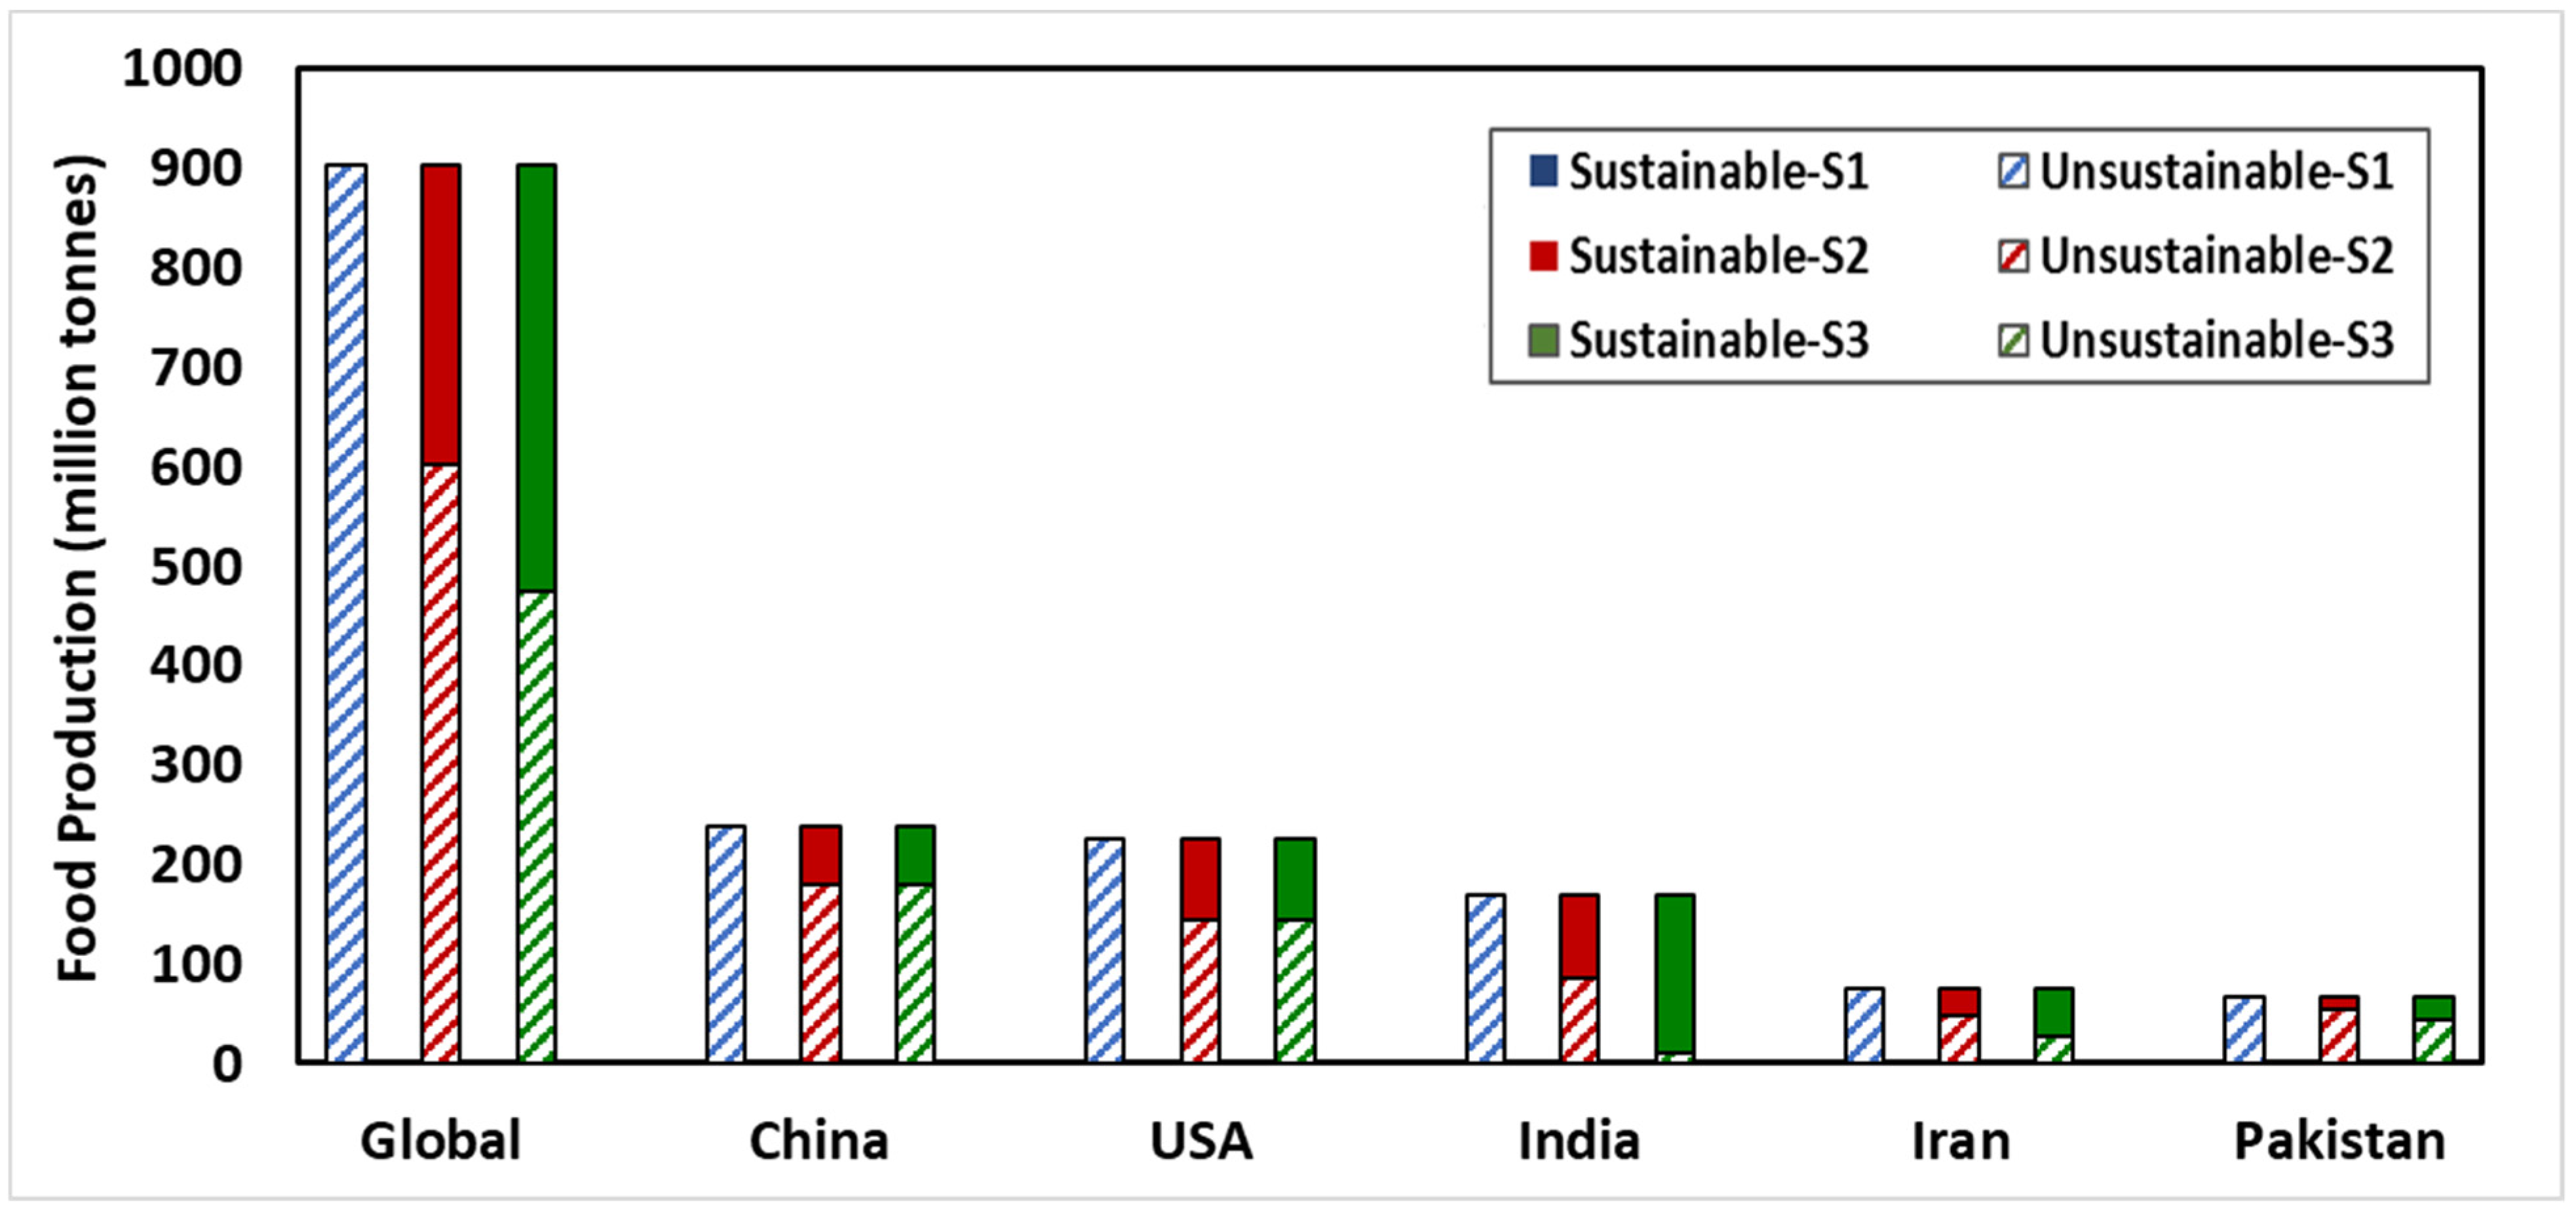
2.4. Unsustainable Food Production from Groundwater

The amount of food produced using non-renewable groundwater per country was calculated using production datasets from FAOSTAT (http://www.fao.org/faostat/en/#data [last date of access: 4 May 2017]). Total production using groundwater by country was calculated using average yield per hectare (which is an average of irrigated and rainfed yield) and total groundwater irrigated area (Equation (5)). This estimate was divided by the national groundwater withdrawal for irrigation to estimate yield per unit of groundwater withdrawn (Ypgw) (Equation (6)).
Y g w = Y t o t × A I g w
Y p g w = Y g w I W W g w
Y p n r g b = Y p g w × N R G A
where
  • Ygw = Total food production from groundwater irrigated area (tonnes)
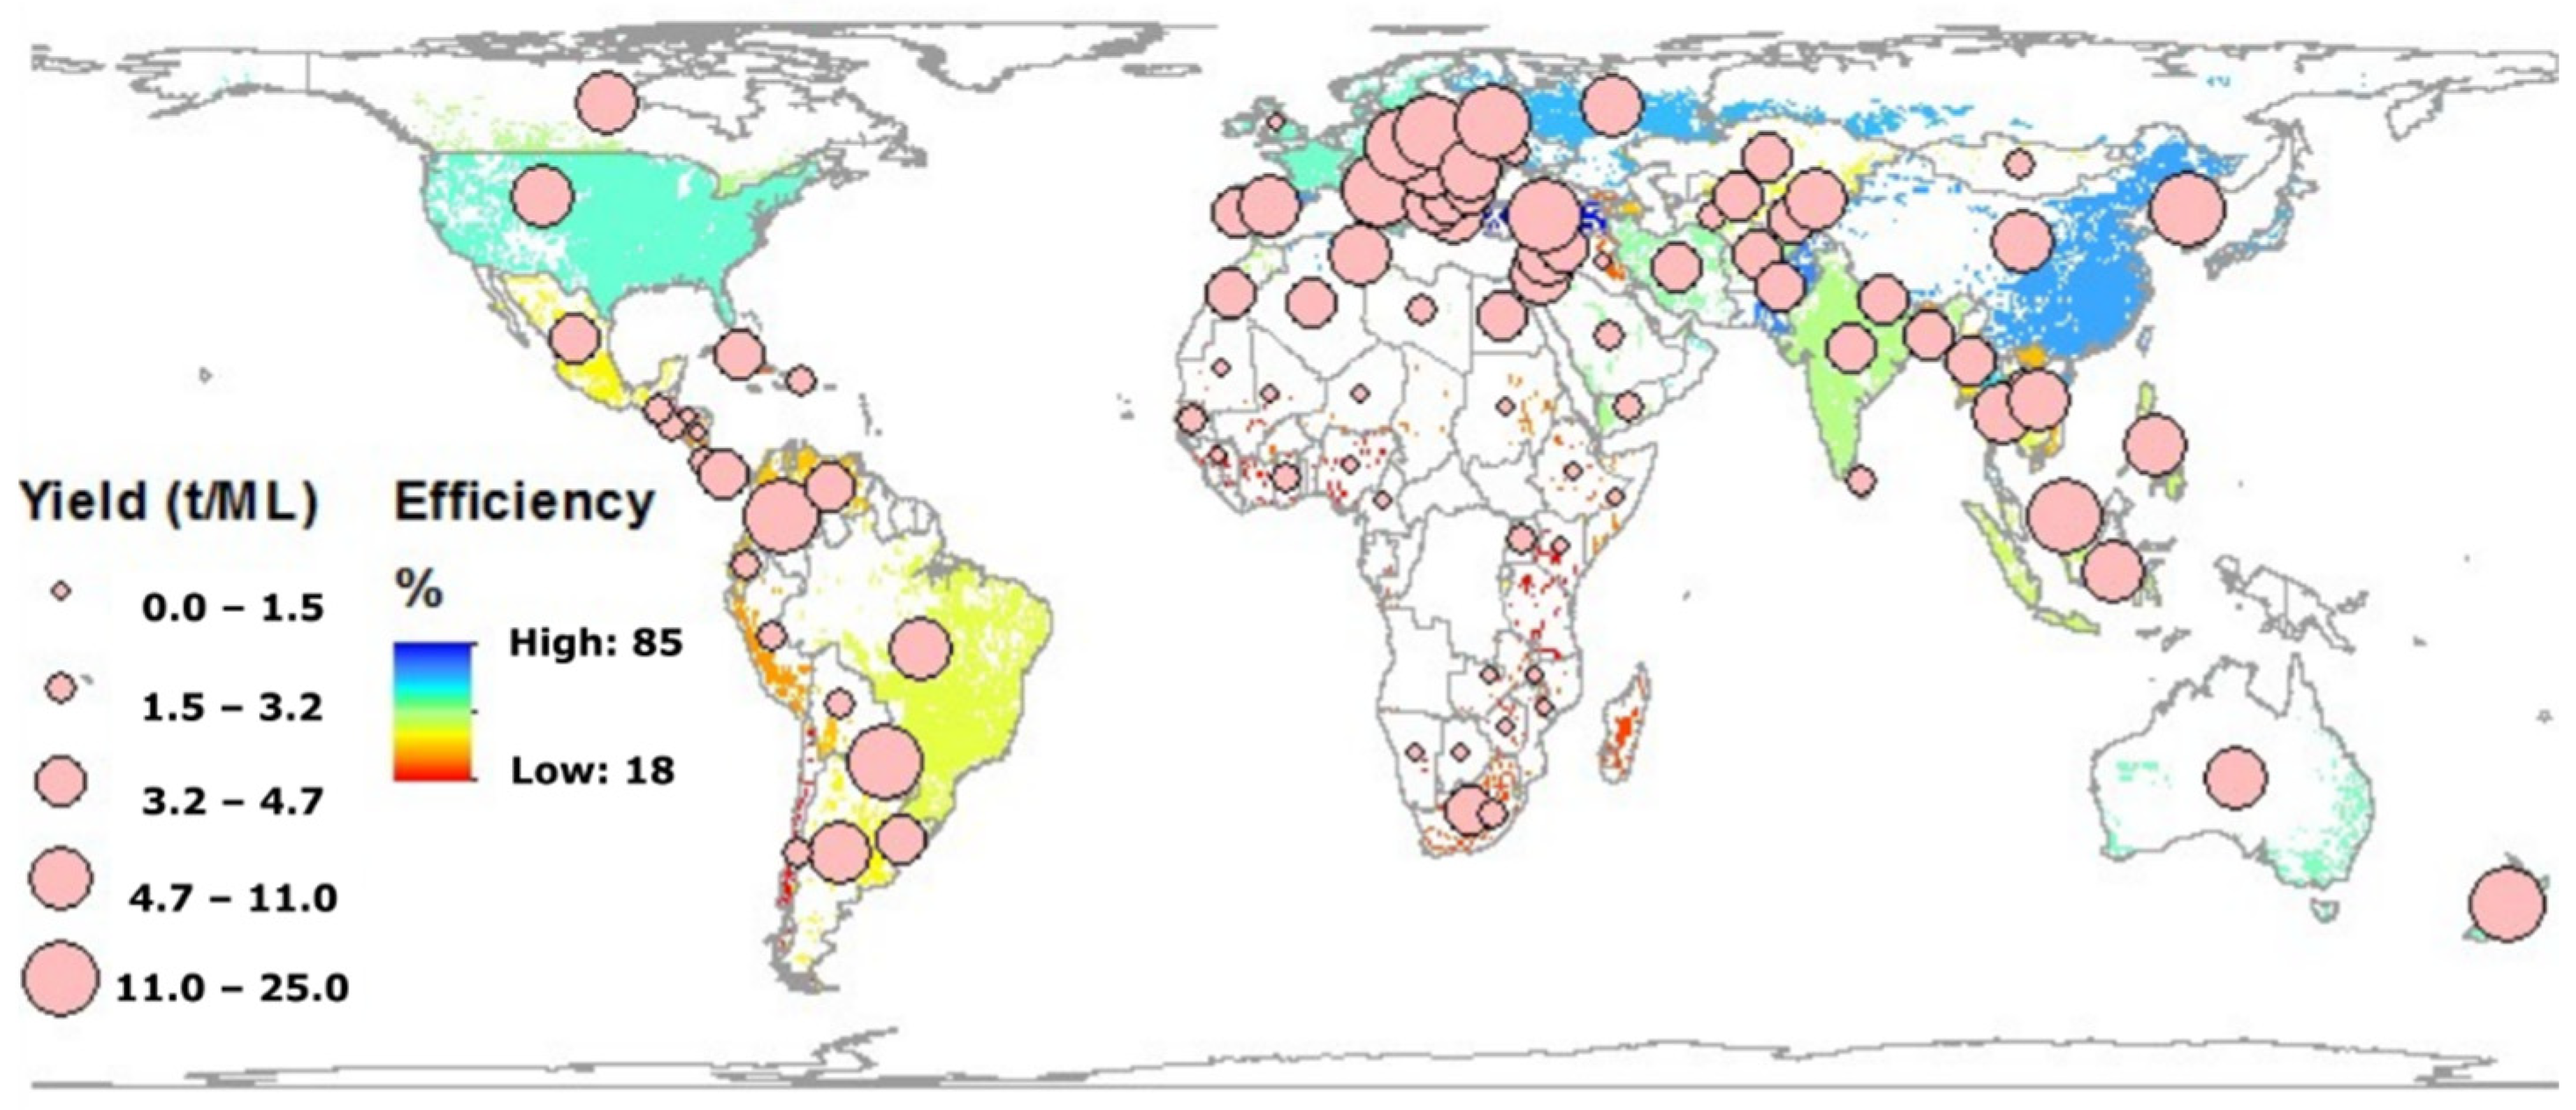
  • Ytot = Average yield from irrigated area (t ha−1)
  • AIgw = Total groundwater irrigated area (ha)
  • Ypgw = Yield from groundwater withdrawn (t ML−1)
  • Ypnrgb = Yield from non-renewable groundwater abstraction (t ML−1)
  • IWWgw = Groundwater withdrawn for irrigation (ML)
The association between NRGA and food production (in tonne) by country was estimated using Ypgw (Figure 1). The yield per unit of groundwater withdrawal varied from 0.2 t ML−1 (Mauritania in Africa) to 26.7 t ML−1 (France in Europe). Europe had the highest yield per ML of groundwater withdrawal (~20 t ML−1) followed by Oceania (~15 t ML−1), Asia and America (~5 t ML−1), and Africa (~1.5 t ML−1).
Unsustainable food production from groundwater irrigation was estimated using an upper limit for SR of 0.6 for sustainable extraction (Base case scenario; S1) and estimating yield associated with the volume of groundwater extraction above this limit. After quantifying the impact of food production on groundwater stress, some possibilities for reducing stress were evaluated. Two potential pathways for reducing groundwater stress and ensuring food security are: (a) improving irrigation efficiency (efficiency scenarios) by delivering a higher proportion of extracted groundwater to the plant, and (b) increasing the productivity or yield per unit of applied water in addition to improving irrigation efficiency (High efficiency and yield scenario; S3). In the former case, the irrigation efficiency of every nation was assumed to be increased to 90% (High efficiency scenario; S2); which is an ambitious goal limit. Hence, a second efficiency scenario was also considered, where the efficiency of every country was assumed to be improved to 75% of the difference between current and 90% efficiency (Moderate efficiency scenario; S2a). These three scenarios are summarized in Table 2.
The percentage change in SR for each efficiency scenario was calculated using Equation (7). In the high efficiency and yield scenario, the efficiency was raised to 90% all over the globe and the irrigation productivity was raised to 8 t/ML, which is two times the current global mean irrigation productivity. The yield scenario gives a holistic perspective of groundwater stress remediation without compromising food security.
S R = ( 1 η η n e w ) × 100
where
  • η = Current irrigation efficiency
  • ηnew = Efficiency in different scenarios

2.5. Data Sources

The data needed for calculating groundwater irrigation SR and unsustainable food production were obtained from the public domain. Food production estimates used the country-wise irrigated food production statistics obtained from FAOSTAT for 150 countries [36]. Total irrigated food production was calculated for each country as the sum of total cereal, pulses, root, fruits, nuts and vegetable production in a country. Total food production per country was then averaged from 1981 to 2014. Groundwater irrigated areas were extracted using the Global Map of Irrigated Areas version 5 [37]. This gridded irrigated land-use map has a resolution of 5 arc minutes and was obtained from the Food and Agricultural Organization (FAO)-AQUASTAT. The reference years of this dataset ranged from 2002 to 2008 and the data were compiled from various national and subnational agencies [38]. On average, the data correspond to the year 2005. The area considered in this study comprises both fully groundwater irrigated areas and joint groundwater and surface water irrigated areas. Due to the lack of a source-based split in the joint use areas, these areas were assumed to be 50% groundwater irrigated and 50% surface water irrigated. Apart from the datasets mentioned above, the data required for calculating R (viz., precipitation, potential evapotranspiration and land use) and IWR (viz., precipitation, coefficient of variability of precipitation, number of rainfall days, reference evaporation, soil moisture storage capacity, and vegetation type coefficient) are described in Mohan et al. [33]. The global base flow index map was obtained from the European Commission’s Global Streamflow Characteristics Dataset [39,40] and the percentage of mean annual runoff required for environmental flow was obtained from the Global Environmental Flow Information System of the International Water Management Institute [32,41].

3. Results

3.1. Non-Renewable Groundwater Abstraction and Stress Index

The global distribution of long-term average irrigation induced groundwater SR and NRGA are shown in Figure 2 and Figure 3, respectively. The total NRGA was estimated as 207.15 km3 year−1. Out of the 107 countries under investigation, about half have positive NRGA; however, 92% of NRGA is from only 7 countries (India (63.3 km3 year−1), USA (34.7 km3 year−1) Pakistan (22.2km3 year−1), China (26.9 km3 year−1), Iran (28.2 km3 year−1), Mexico (10.6 km3 year−1) and Spain (4.9 km3 year−1)). This clearly indicates that global groundwater depletion is confined to a few regions of the world. The groundwater stressed regions mostly consist of the northeastern parts of the Indian sub-continent (mainly the Indus and Ganga-Brahmaputra basins), the Northwestern parts of China (mainly the North China Aquifer system and the Song-Liao basin), Western USA (mainly the Northern Great Plains Aquifers, the Ogallala Aquifer and the California Central Valley Aquifer System), the Middle East (mainly the Arabian Aquifer System), and a few areas of Italy and Spain. Our estimates of NRGA are comparable both in spatial pattern and in regional and global temporal averages with the existing studies on irrigation impact on groundwater depletion (Table 3). According to our results, overexploitation of groundwater is present in 37% of countries, and moderate to heavily stressed groundwater systems are present in 22% of countries (Figure 2). Most global studies of groundwater depletion have not reported any stress in any regions of Europe [21,42,43,44]. In contrast, this study reveals that some parts of southern Europe have moderate to heavy stress. The main reason for this difference in the stress level between these studies is that environmental flow requirements (EBFR) have been taken into account in this study. When environmental requirements are considered, high levels of groundwater stress are also discernible in many parts of Spain, Italy, Portugal and France (Figure 2b) but the stress scenario changes if the EBFR is ignored. Some recent studies have identified that irrigation in the Mediterranean region is impacting environmental flow which corroborates the findings of this study [28,45].
The percentage of irrigated area with positive deficit (given in boxes) was using the following equation
P e r c e n t a g e   p o s i t i v e   d e c f i c i t   a r e a   p e r   c o u n t r y = G r o u n d w a t e r   i r r i g a t e d   a r e a   w i t h   N R G A   g r e a t e r   t h a t   0 T o t a l   g r o u n d w a t e r   i r r i g a t e d   a r e a p e r   c o u n t r y × 100

3.2. Unsustainable Food Production from Groundwater

We defined the unsustainable food production as food produced causing a stress of SR ≥ 0.6. Figure 4 shows the difference between the estimated current withdrawal and the hypothetical withdrawal if the stress is limited to a sustainable level (SR ≤ 0.6). The negative values (red zone) show the regions where the groundwater withdrawal under current condition is higher than that recommended in stress limiting scenarios. Globally, 137.3 km3 of groundwater is withdrawn for irrigated food production unsustainably every year. This estimate is slightly different from the NRGA given in Table 3, as it was constrained by the SR. In other words, this estimate can be considered as the lower limit of unsustainable abstraction. India, Pakistan, United States and China were at the forefront in withdrawing more than the recommended level of groundwater abstraction for irrigation (i.e., 119 km3 year−1). This unsustainable irrigation water withdrawal was translated into the unsustainable food production using FAOSTAT production data (Figure 5). Considering the lower limit of NRGA, 7.3% (903 Mt) of the total global food production is associated with unsustainable groundwater abstraction. In this scenario, 86% of unsustainable food production is jointly produced by India (169 Mt), Pakistan (67 Mt), China (238 Mt), Iran (75 Mt), and USA (225 Mt).

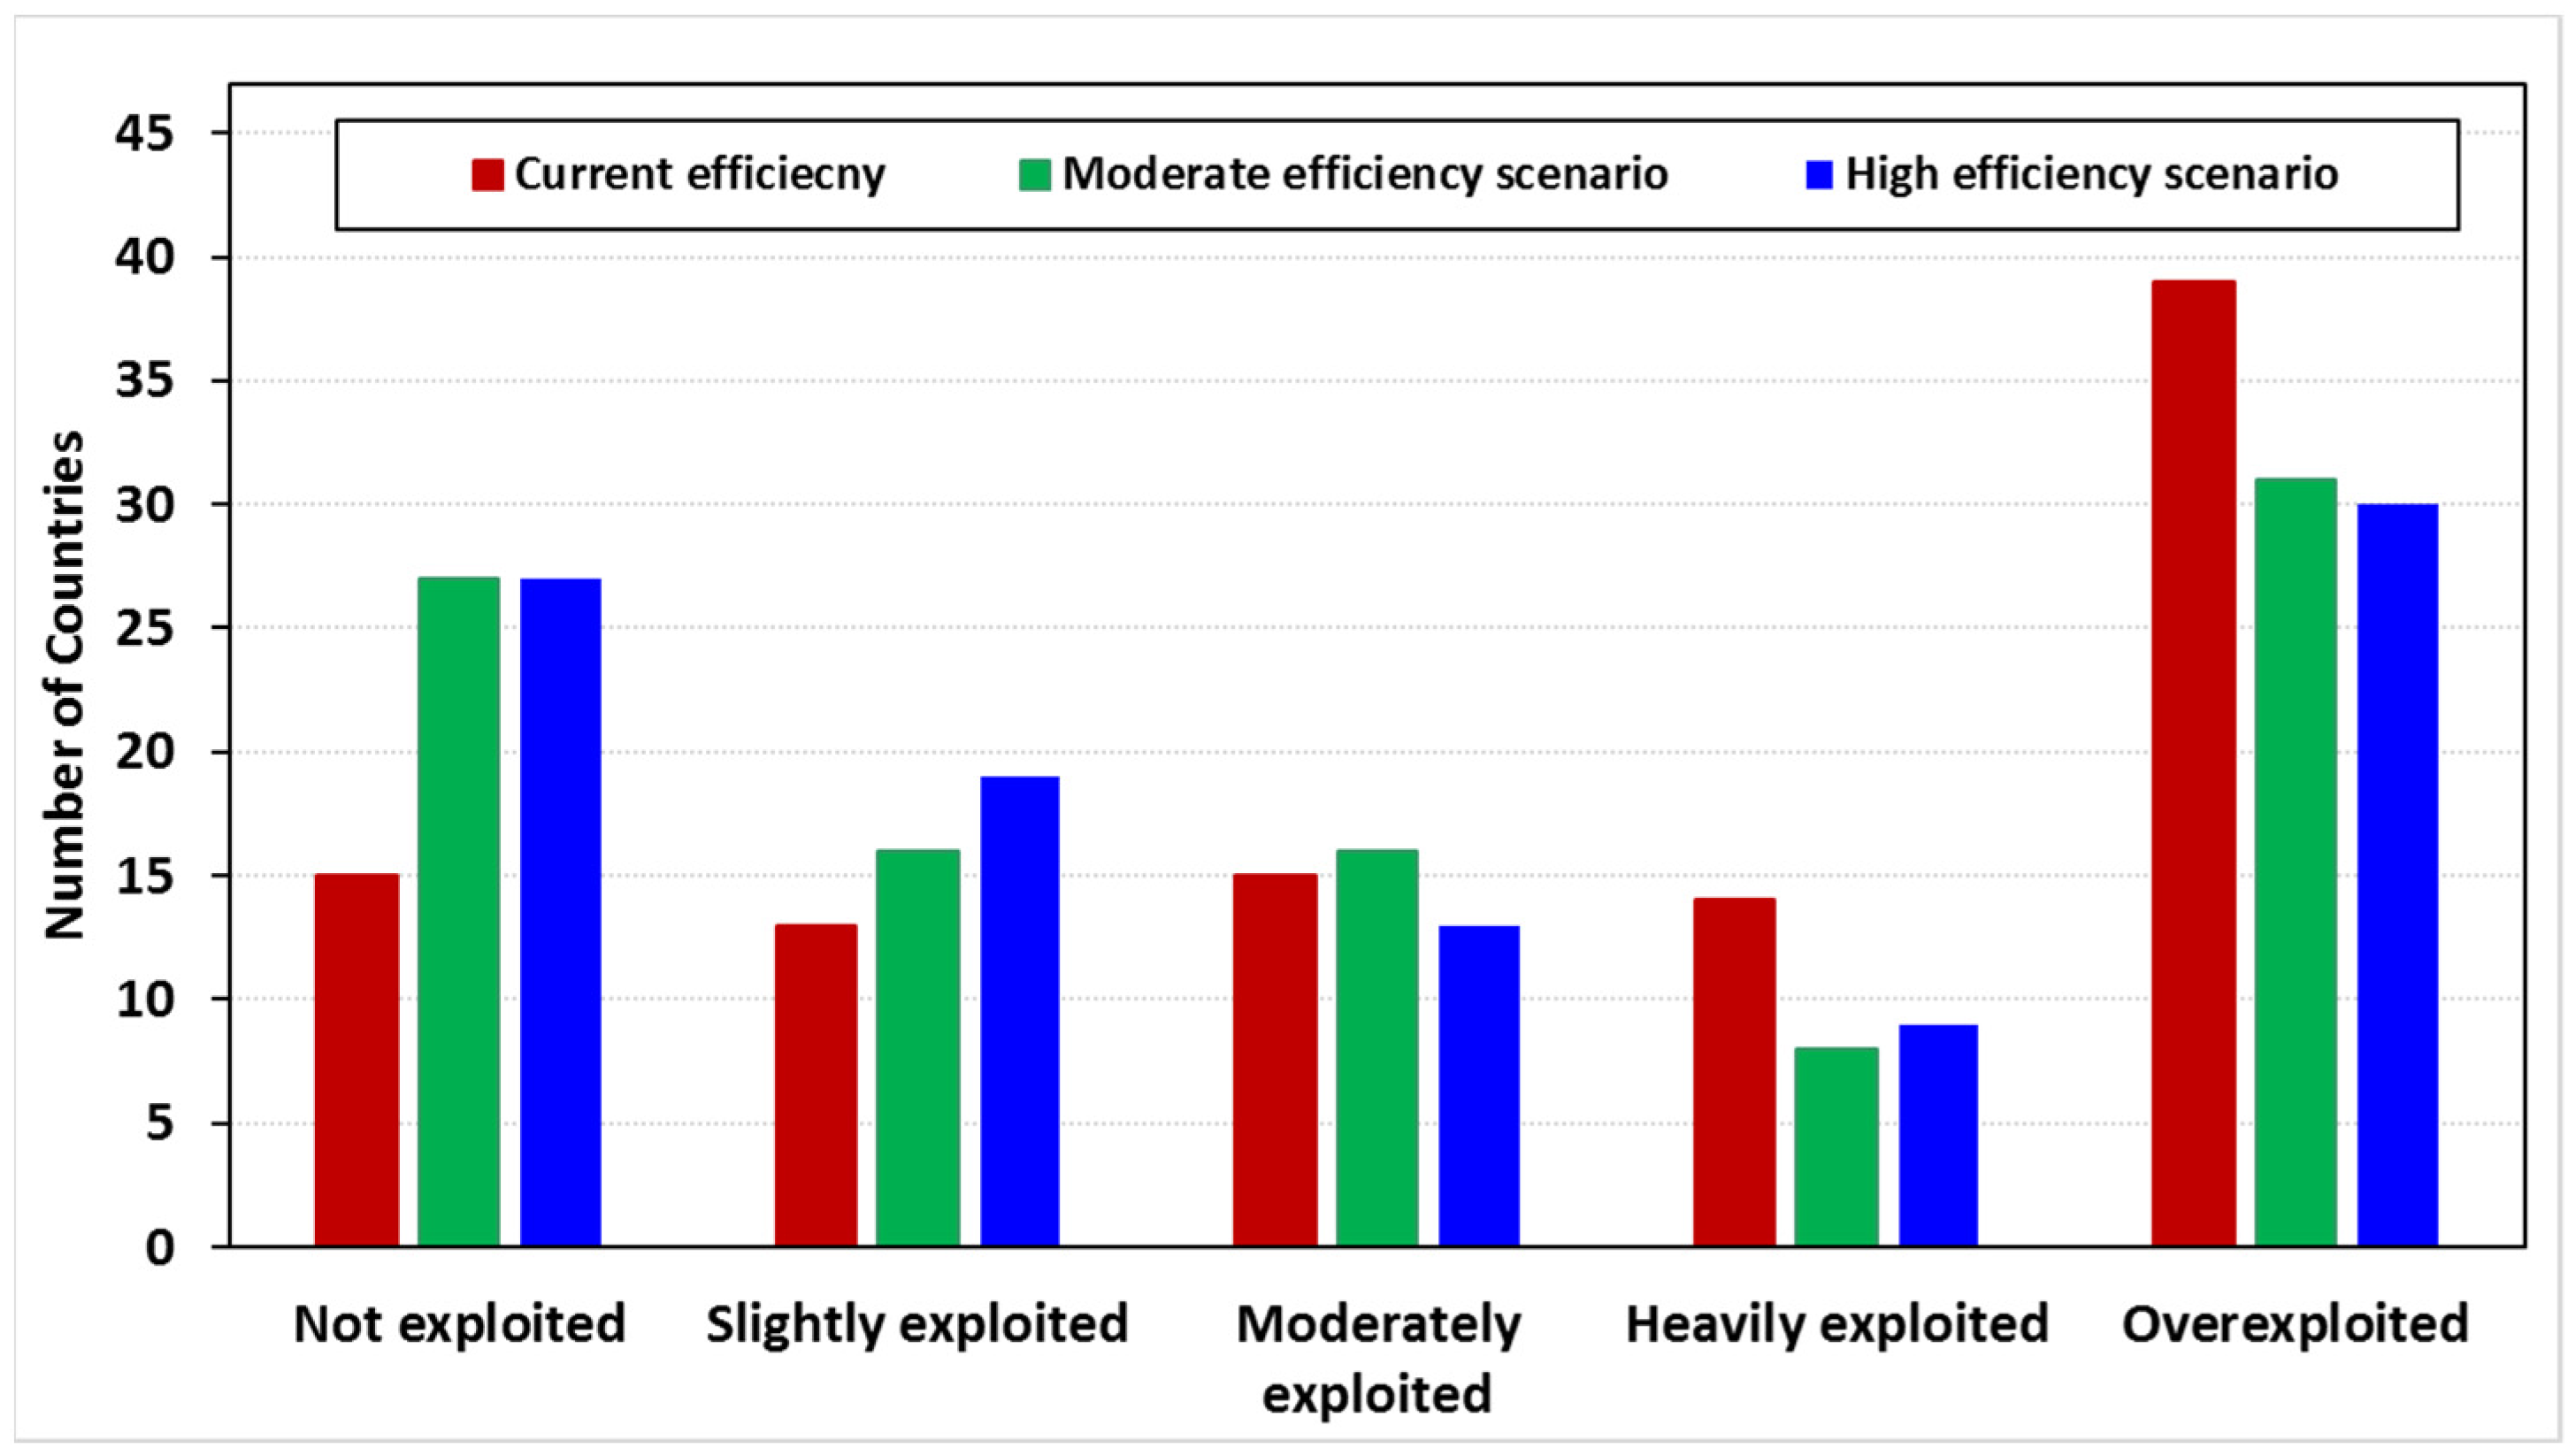
3.3. Groundwater Stress Reduction Scenarios

As the above results demonstrate the need for finding a balance between food production and groundwater withdrawal, we examined the degree to which the current status could be improved by increasing irrigation efficiency and productivity. Figure 6a,b show the percentage change in SR under high and moderate efficiency scenarios, respectively. The map shows 47% and 40% stress reduction due to reduction in volume of groundwater abstraction in high and moderate efficiency scenarios, respectively. When irrigation efficiency was increased to 90% (high case), the number of countries in the overexploitation category was reduced from 39 to 31, and the number of countries with low stress increased from 15 to 27 (Figure 7). Aggregated over India, China, Pakistan, Iran and the USA, increasing efficiency to 90% accounted for a reduction of groundwater irrigation abstraction by 43 km3 year−1, which is equivalent to 24% of the total NRGA by these countries.
The above only considered groundwater stress reduction due to improved efficiency and showed that such measures alone could not eliminate stress. Given a future with increasing food demand and decreasing water availability, an approach for improving sustainable food production through a combination of improved efficiency and yield was considered. Under the base case scenario (Scenario S1), globally 903 million tonnes (Mt) of food are produced by overstressing groundwater systems. By increasing global irrigation efficiency to 90% (Scenario S2), 300 Mt of food can be produced from previously wasted water. This could reduce unsustainable food production by one third. In addition to efficiency improvements, if irrigation productivity were increased to 8 t ML−1 in the low yield regions (Scenario S3), the same total food production could be achieved from groundwater irrigation with only 475 Mt of unsustainable food production globally (Figure 8). Figure 8 shows the change in food production using non-renewable groundwater under the three scenarios in five major groundwater depletion hotspots. The major increase in sustainable food production was in India where 83 Mt (Scenario S2) and 157 Mt (Scenario S3) of unsustainable food production became sustainable.

4. Discussion

Due to increased food demand and the subsequent expansion of irrigated food production, groundwater resources are being overexploited in several parts of the world. According to the United Nations, the world will need to feed 0.6 and 1.8 billion extra people by 2030 and 2050, respectively, compared with 2022 [46]. This will intensify the stress on groundwater, which highlights the need for improved management of global groundwater resources. A scientific understanding of stress on groundwater systems is essential for managing this vital resource. This study was conducted with the objective of evaluating stress induced by irrigated food production on groundwater systems. Stress on the system was estimated as a ratio of irrigation water demand to estimated groundwater available for extraction accounting for environmental needs.
Globally, there is an extremely uneven distribution of groundwater stress ranging from SR < 0.1 to SR > 1 (Figure 2 and Figure 3). Groundwater irrigated areas do not always coincide with the aquifers having high water availability. Currently, the increasing pumping depth in the irrigated areas in the heavily groundwater-dependent countries like India and USA makes the groundwater irrigation an uneconomic option particularly in economically backward communities [13,47,48]. It is worth mentioning that many countries with high volumes of unsustainable abstraction also have other groundwater irrigated areas with more potential for groundwater extraction. This is particularly so in China and the USA, where some regions of non-renewable groundwater use exist, and there are other areas in which water demand is less than the extraction potential of the aquifer system. A spatial rearrangement of food production in these regions could ensure sustainable water availability. However, water is not the only factor for agricultural production, rather it is also constrained by other factors such as land availability, land suitability and climatic conditions [49,50]. The results of this study, which identify potential hotspot areas of overexploitation, have important implications for national and international governance of water resources, and can help identify dependence on groundwater, thereby ensuring a more sustainable redistribution of demand.
Taking into account environmental flow requirements when assessing groundwater stress is of prime importance. The results show that the exclusion of environmental requirements leads to underestimates of stress in most regions, especially Europe (Figure 2). A very high proportion of rivers in Europe are supported by a large proportion of the baseflow [32]. In the Mediterranean countries such as Spain and Italy, and in parts of the United Kingdom, the groundwater contribution to environmental flow is high due to the large baseflow index and high hydraulic connectivity between surface water and groundwater. When the EBFR is deducted from the available groundwater resource, these countries tend to move into the over-stressed category. This accentuates the importance of considering EBFR in the assessment, planning and prediction of groundwater resources [51]. Reinforcing this standpoint, Jagermeyr et al. [28] reported that 41% of the global surface and groundwater irrigation is at the expense of environmental flow. The projected drier conditions in southern and central Europe will increase the irrigative demand further reducing groundwater contributions to environmental flow [5]. Moreover, Henriksen et al. [52] and Blanco-Gutiérrez et al. [45] reported that the excessive irrigation water use in Spain and Denmark are placing environmental flow demands at risk and tampering the goal of European Water Framework Directive [52] to meet ‘good ecological status’. Furthermore, 20% of the farmers’ income in these regions are at stake of environmental flow requirements [28].
We found that food production in countries such as India, Pakistan, the USA, Iran and China placed the greatest stress on groundwater resources. A tenth of the world is fed with food produced by overstressing groundwater. We also found that extremely high irrigation efficiency (90%) could save 50 million ML of water which can either be used to reduce water stress by 46% or to increase food production by 300 Mt, while maintaining stress at a reasonable (SR ≤ 0.6) level. Further, if efficiency improvements are reinforced by increased productivity, an additional 400 Mt of food could be produced while maintaining SR ≤ 0.6. (Figure 6, Figure 7 and Figure 8). It should be noted that the increased irrigation efficiency in S2 and S3 scenarios will lead to reduced leaching in the root zone [53]. The leaching is vital in areas with higher salinity water sources for maintaining soil health and increased crop production [53,54]. As the leaching factor is highly site specific and irrigation water quality dependent, it is an issue requiring further investigation. To investigate the sensitivity of results to irrigation efficiency, a supplementary scenario (S2a) is considered in this study, in which the irrigation efficiency is limited to 75% of the assumed maximum achievable limit (i.e., 90% efficiency). Even with an increase of 75% of the maximum achievable efficiency, the current groundwater stress can be reduced by 40%.
A combination of management practices like demand-based irrigation scheduling and engineering practices like zero wastage irrigation systems can effectively increase irrigation efficiency [55,56,57]. Institutional level strategies like water pricing, water capping and awareness training for end users can also lead to a better use of irrigation water and greater productivity [58]. Despite being promising solutions for saving groundwater, these management interventions are difficult to implement in under-developed and developing countries due to social, financial, legal and institutional constraints [59,60]. Financial and technological aid to developing and under-developed countries, which are among those experiencing maximum water stress, can improve the health of aquifers.
Despite providing a deeper understanding of current groundwater irrigation stress and analyzing possible stress remediation strategies, this study has some underlying assumptions and limitations. Due to the lack of data on source-based water use in conjunctive irrigation areas, 50% of the irrigation in those areas was assumed to be from groundwater. This study does not account for return flows or inter pixel spatial flows of groundwater and considers only the rainfall recharge as the source of water available for irrigation. Additionally, the yield statistics per country used in this study is an average of rainfed yield and irrigated yield which could lead to overestimation in rainfed regions. Another major limitation is due to the quality of the global datasets required for the analysis. Most of the inputs such as irrigation efficiency, food production and area under irrigation were obtained from the FAO and other international institutions. These data are a compilation of various national and sub-national statistics. Data quality from some national agencies is poor leading to a higher uncertainty in the estimates for that region. In addition, estimates reported in this study are at a national scale, which means that the effects of spatial variability on agricultural systems within countries that could also have significant effects on stress might have not been captured. Further, the groundwater abstraction for irrigation is likely to be underestimated because not all areas irrigated by groundwater are recorded in the national and FAO statistics. Finally, one of the inconsistencies with the data used in this study is the temporal range. Both water availability and water use were estimated as an average over the period of 34 years (1981 to 2014). However, the irrigated area was an average representation between 2002 and 2008. This means the results from this study should be interpreted as an estimate of climatological groundwater stress for recent land use conditions.

5. Conclusions

In this study, the potential impact of selected management interventions for remediating groundwater stress without compromising food security were examined by modelling potential impacts of improved irrigation efficiency and productivity. Stress on the system was estimated via the ratio of irrigation water demand to groundwater available for extraction. Unlike previous studies, available groundwater estimates accounted for environmental requirements by subtracting EBFR from natural recharge in the system. Crop-specific irrigation water requirements were modelled using the GlobWAT model developed by FAO. The magnitude of groundwater overexploitation was evaluated by quantifying the amount of unsustainable food production for each country. Finally, potential management interventions for remediating groundwater stress without compromising food security were examined by improving irrigation efficiency and increasing irrigation productivity. The scope of this study was restricted to the estimated groundwater irrigated areas of the world.
The analysis showed that ~40% of the total irrigated food producing regions of the world are over exploiting groundwater resources. Although groundwater stress is a widespread phenomenon, 92% of non-renewable groundwater abstraction is from only seven countries (India, Pakistan, China, USA, Iran, Mexico, and Spain). This non-renewable groundwater abstraction results in the production of 900 Mt of food. Due to the high dependency on unsustainable food production, reducing groundwater stress by simply decreasing extraction is not a feasible solution. Therefore, we examined two pathways for remediating groundwater stress: (i) by improving irrigation efficiency, and (ii) by increasing both productivity and efficiency. We found that increased irrigation efficiency can save 50 million ML of water which can either be used to reduce current stress by 47% (by reducing NRGA) or to produce additional 300 Mt of food while maintaining stress at an acceptable level. Furthermore, if the efficiency improvement is reinforced by increased productivity, 400 Mt of food can be produced without increasing stress on the groundwater system. In reality, achieving these improvements is a major challenge for most countries, especially developing countries because they necessitate substantial transformation in water management and farming systems through technical interventions and smart governance.

Author Contributions

C.M. and A.W.W. devised the conceptual and analysis framework of this study with inputs from M.K.J. and Y.W.; C.M. performed the data compilation, analysis and produced the results and visualization shown in the study, discussing together with A.W.W., Y.W. and M.K.J.; A.W.W., Y.W. and M.K.J. contributed to paper writing and the interpretation of the results. C.M. took the lead in writing the manuscript. All authors provided critical feedback and helped shape the research, analysis, and manuscript. All authors have read and agreed to the published version of the manuscript.

Funding

The first author received funding from Canada First Research Excellence Fund (CFRE) and Melbourne International Research Scholarship (MIRS) at the time of this research.

Data Availability Statement

All the data and/or code used in this study will be made available on request.

Acknowledgments

The authors would like to acknowledge the University of Melbourne for providing computational and other technical facilities for this research, and the international agencies that provided the data required for this study.

Conflicts of Interest

The authors declare no conflict of interest.

References

  1. Bin Abdullah, K. Use of Water and Land for Food Security and Environmental Sustainability. Irrig. Drain. 2006, 55, 219–222. [Google Scholar] [CrossRef]
  2. Wada, Y.; van Beek, L.P.H.; Bierkens, M.F.P. Nonsustainable Groundwater Sustaining Irrigation: A Global Assessment. Water Resour. Res. 2012, 48. [Google Scholar] [CrossRef]
  3. Khan, S.; Tariq, R.; Yuanlai, C.; Blackwell, J. Can Irrigation Be Sustainable? Agric. Water Manag. 2006, 80, 87–99. [Google Scholar] [CrossRef]
  4. Tracy, J.; Johnson, J.; Konikow, L.F.; Miller, G.; Porter, D.; Sheng, Z.; Sibray, S. Aquifer Depletion and Potential Impacts on Long-Term Irrigated Agricultural Productivity; Council for Agricultural Science and Technology: Ames, IA, USA, 2019. [Google Scholar]
  5. de Graaf, I.E.; Gleeson, T.; Sutanudjaja, E.H.; Bierkens, M.F. Environmental Flow Limits to Global Groundwater Pumping. Nature 2019, 574, 90–94. [Google Scholar] [CrossRef]
  6. National Ground Water Association. Facts about Global Groundwater Usage. 2016. Available online: https://www.ngwa.org/Fundamentals/Documents/globalgroundwater-use-fact-sheet.pdf (accessed on 8 June 2017).
  7. Krishan, G.; Bisht, M.; Ghosh, N.C.; Prasad, G. Groundwater Salinity in Northwestern Region of India: A Critical Appraisal. In Environmental Processes and Management; Springer: Cham, Switzerland, 2020; pp. 361–380. [Google Scholar]
  8. Gleeson, T.; Richter, B. How Much Groundwater Can We Pump and Protect Environmental Flows through Time? Presumptive Standards for Conjunctive Management of Aquifers and Rivers. River Res. Appl. 2018, 34, 83–92. [Google Scholar] [CrossRef]
  9. van Dijk, M.; Morley, T.; Rau, M.L.; Saghai, Y. A Meta-Analysis of Projected Global Food Demand and Population at Risk of Hunger for the Period 2010–2050. Nat. Food 2021, 2, 494–501. [Google Scholar] [CrossRef]
  10. Dragoni, W.; Sukhija, B.S. Climate Change and Groundwater: A Short Review. SP 2008, 288, 1–12. [Google Scholar] [CrossRef]
  11. Green, T.R.; Taniguchi, M.; Kooi, H.; Gurdak, J.J.; Allen, D.M.; Hiscock, K.M.; Treidel, H.; Aureli, A. Beneath the Surface of Global Change: Impacts of Climate Change on Groundwater. J. Hydrol. 2011, 405, 532–560. [Google Scholar] [CrossRef] [Green Version]
  12. Taylor, R.G.; Scanlon, B.; Döll, P.; Rodell, M.; Van Beek, R.; Wada, Y.; Longuevergne, L.; Leblanc, M.; Famiglietti, J.S.; Edmunds, M. Ground Water and Climate Change. Nat. Clim. Chang. 2013, 3, 322–329. [Google Scholar] [CrossRef] [Green Version]
  13. Jasechko, S.; Perrone, D. Global Groundwater Wells at Risk of Running Dry. Science 2021, 372, 418–421. [Google Scholar] [CrossRef]
  14. Dalin, C.; Taniguchi, M.; Green, T.R. Unsustainable Groundwater Use for Global Food Production and Related International Trade. Glob. Sustain. 2019, 2, e12. [Google Scholar] [CrossRef] [Green Version]
  15. Llamas, M.R.; Martínez-Santos, P. Intensive Groundwater Use: Silent Revolution and Potential Source of Social Conflicts. J. Water Resour. Plann. Manag. 2005, 131, 337–341. [Google Scholar] [CrossRef]
  16. Shah, T. Climate Change and Groundwater: India’s Opportunities for Mitigation and Adaptation. Environ. Res. Lett. 2009, 4, 035005. [Google Scholar] [CrossRef]
  17. Shah, T.; Singh, O.P.; Mukherji, A. Groundwater Irrigation and South Asian Agriculture: Empirical Analyses from a Large-Scale Survey of India, Pakistan, Nepal Terai and Bangladesh. In Proceedings of the IWMI-Tata Annual Partners’ Meeting, Anand, India, 17–19 February 2004; pp. 17–19. [Google Scholar]
  18. de Graaf, I.E.M.; van Beek, R.L.P.H.; Gleeson, T.; Moosdorf, N.; Schmitz, O.; Sutanudjaja, E.H.; Bierkens, M.F.P. A Global-Scale Two-Layer Transient Groundwater Model: Development and Application to Groundwater Depletion. Adv. Water Resour. 2017, 102, 53–67. [Google Scholar] [CrossRef]
  19. Gleeson, T.; Wada, Y. Assessing Regional Groundwater Stress for Nations Using Multiple Data Sources with the Groundwater Footprint. Environ. Res. Lett. 2013, 8, 044010. [Google Scholar] [CrossRef]
  20. Herbert, C.; Döll, P. Global Assessment of Current and Future Groundwater Stress With a Focus on Transboundary Aquifers. Water Resour. Res. 2019, 55, 4760–4784. [Google Scholar] [CrossRef]
  21. Gleeson, T.; Wada, Y.; Bierkens, M.F.P.; van Beek, L.P.H. Water Balance of Global Aquifers Revealed by Groundwater Footprint. Nature 2012, 488, 197–200. [Google Scholar] [CrossRef]
  22. Famiglietti, J.S.; Lo, M.; Ho, S.L.; Bethune, J.; Anderson, K.J.; Syed, T.H.; Swenson, S.C.; de Linage, C.R.; Rodell, M. Satellites Measure Recent Rates of Groundwater Depletion in California’s Central Valley. Geophys. Res. Lett. 2011, 38. [Google Scholar] [CrossRef] [Green Version]
  23. Feng, W.; Zhong, M.; Lemoine, J.-M.; Biancale, R.; Hsu, H.-T.; Xia, J. Evaluation of Groundwater Depletion in North China Using the Gravity Recovery and Climate Experiment (GRACE) Data and Ground-Based Measurements. Water Resour. Res. 2013, 49, 2110–2118. [Google Scholar] [CrossRef]
  24. Joodaki, G.; Wahr, J.; Swenson, S. Estimating the Human Contribution to Groundwater Depletion in the Middle East, from GRACE Data, Land Surface Models, and Well Observations. Water Resour. Res. 2014, 50, 2679–2692. [Google Scholar] [CrossRef]
  25. Rodell, M.; Velicogna, I.; Famiglietti, J.S. Satellite-Based Estimates of Groundwater Depletion in India. Nature 2009, 460, 999–1002. [Google Scholar] [CrossRef] [Green Version]
  26. Wada, Y.; van Beek, L.P.H.; van Kempen, C.M.; Reckman, J.W.T.M.; Vasak, S.; Bierkens, M.F.P. Global Depletion of Groundwater Resources. Geophys. Res. Lett. 2010, 37. [Google Scholar] [CrossRef] [Green Version]
  27. Tuninetti, M.; Tamea, S.; Dalin, C. Water Debt Indicator Reveals Where Agricultural Water Use Exceeds Sustainable Levels. Water Resour. Res. 2019, 55, 2464–2477. [Google Scholar] [CrossRef] [Green Version]
  28. Jägermeyr, J.; Pastor, A.; Biemans, H.; Gerten, D. Reconciling Irrigated Food Production with Environmental Flows for Sustainable Development Goals Implementation. Nat. Commun. 2017, 8, 15900. [Google Scholar] [CrossRef] [Green Version]
  29. Pastor, A.V.; Ludwig, F.; Biemans, H.; Hoff, H.; Kabat, P. Accounting for Environmental Flow Requirements in Global Water Assessments. Hydrol. Earth Syst. Sci. 2014, 18, 5041–5059. [Google Scholar] [CrossRef] [Green Version]
  30. Dalin, C.; Wada, Y.; Kastner, T.; Puma, M.J. Groundwater Depletion Embedded in International Food Trade. Nature 2017, 543, 700–704. [Google Scholar] [CrossRef] [Green Version]
  31. Raskin, P.; Gleick, P.; Kirshen, P.; Pontius, G.; Strzepek, K. Water Futures: Assessment of Long-Range Patterns and Problems. Comprehensive Assessment of the Freshwater Resources of the World; SEI: Stockholm, Sweden, 1997. [Google Scholar]
  32. Smakhtin, V.; Revenga, C.; Döll, P. A Pilot Global Assessment of Environmental Water Requirements and Scarcity. Water Int. 2004, 29, 307–317. [Google Scholar] [CrossRef]
  33. Mohan, C.; Western, A.W.; Wei, Y.; Saft, M. Predicting Groundwater Recharge for Varying Land Cover and Climate Conditions–a Global Meta-Study. Hydrol. Earth Syst. Sci. 2018, 22, 2689–2703. [Google Scholar] [CrossRef] [Green Version]
  34. Hoogeveen, J.; Faurès, J.-M.; Peiser, L.; Burke, J.; van de Giesen, N. GlobWat—A global water balance model to assess water use in irrigated agriculture. Hydrol. Earth Syst. Sci. 2015, 19, 3829–3844. [Google Scholar] [CrossRef] [Green Version]
  35. FAO. State of the World’s Land and Water Resources for Food and Agriculture (SOLAW); Food and Agriculture Organization of the United Nations: Rome, Italy; Earthscan: London, UK, 2011. [Google Scholar]
  36. FAOSTAT. Crop Production Statistics; Food and Agriculture Organization of the United Nations (FAO): Rome, Italy, 2016. [Google Scholar]
  37. Siebert, S.; Henrich, V.; Frenken, K.; Burke, J. Update of the Digital Global Map of Irrigation Areas to Version 5; FAO: Rome, Italy, 2013. [Google Scholar]
  38. FAO. AQUASTAT Main Database; Food and Agriculture Organization of the United Nations: Rome, Italy, 2016. [Google Scholar]
  39. Beck, H.E.; de Roo, A.; van Dijk, A.I.J.M. Global Maps of Streamflow Characteristics Based on Observations from Several Thousand Catchments. J. Hydrometeorol. 2015, 16, 1478–1501. [Google Scholar] [CrossRef] [Green Version]
  40. Beck, H.E.; van Dijk, A.I.J.M.; Miralles, D.G.; de Jeu, R.A.M.; (Sampurno) Bruijnzeel, L.A.; McVicar, T.R.; Schellekens, J. Global Patterns in Base Flow Index and Recession Based on Streamflow Observations from 3394 Catchments. Water Resour. Res. 2013, 49, 7843–7863. [Google Scholar] [CrossRef] [Green Version]
  41. Sood, A.; Smakhtin, V.; Eriyagama, N.; Villholth, K.G.; Liyanage, N.; Wada, Y.; Ebrahim, G.; Dickens, C. Global Environmental Flow Information for the Sustainable Development Goals; International Water Management Institute (IWMI): Colombo, Sri Lanka, 2017; Volume 168, ISBN 92-9090-847-5. [Google Scholar]
  42. Famiglietti, J.S. The Global Groundwater Crisis. Nat. Clim. Chang. 2014, 4, 945–948. [Google Scholar] [CrossRef] [Green Version]
  43. Verma, S.; Tsephal, S.; Jose, T. Pepsee Systems: Grassroots Innovation under Groundwater Stress. Water Policy 2004, 6, 303–318. [Google Scholar] [CrossRef]
  44. Richey, A.S.; Thomas, B.F.; Lo, M.-H.; Reager, J.T.; Famiglietti, J.S.; Voss, K.; Swenson, S.; Rodell, M. Quantifying Renewable Groundwater Stress with GRACE. Water Resour. Res. 2015, 51, 5217–5238. [Google Scholar] [CrossRef]
  45. Blanco-Gutiérrez, I.; Varela-Ortega, C.; Purkey, D.R. Integrated Assessment of Policy Interventions for Promoting Sustainable Irrigation in Semi-Arid Environments: A Hydro-Economic Modeling Approach. J. Environ. Manag. 2013, 128, 144–160. [Google Scholar] [CrossRef] [Green Version]
  46. UN. World Population Prospects 2022: Summary of Results; UN: New York, NY, USA, 2022; 52p. [Google Scholar]
  47. Perrone, D.; Jasechko, S. Dry Groundwater Wells in the Western United States. Environ. Res. Lett. 2017, 12, 104002. [Google Scholar] [CrossRef]
  48. Blakeslee, D.; Fishman, R.; Srinivasan, V. Way down in the Hole: Adaptation to Long-Term Water Loss in Rural India. Am. Econ. Rev. 2020, 110, 200–224. [Google Scholar] [CrossRef] [Green Version]
  49. Wang, D.; Gao, G.; Li, R.; Toktarbek, S.; Jiakula, N.; Feng, Y. Limiting Factors and Environmental Adaptability for Staple Crops in Kazakhstan. Sustainability 2022, 14, 9980. [Google Scholar] [CrossRef]
  50. Dubois, O. The State of the World’s Land and Water Resources for Food and Agriculture: Managing Systems at Risk. In The State of the World’s Land and Water Resources for Food and Agriculture: Managing Systems at Risk; FAO: Rome, Italy, 2011. [Google Scholar]
  51. Mohan, C.; Gleeson, T.; Forstner, T.; Famiglietti, J.S.; de Graaf, I.E. Quantifying Groundwater’s Contribution to Regional Environmental Flows in Diverse Hydrologic Landscapes. ESS Open Arch. 2022. [Google Scholar] [CrossRef]
  52. Bennion, H.; Battarbee, R. The European Union Water Framework Directive: Opportunities for Palaeolimnology. J. Paleolimnol. 2007, 38, 285–295. [Google Scholar] [CrossRef]
  53. Slamini, M.; Sbaa, M.; Arabi, M.; Darmous, A. Review on Partial Root-Zone Drying Irrigation: Impact on Crop Yield, Soil and Water Pollution. Agric. Water Manag. 2022, 271, 107807. [Google Scholar] [CrossRef]
  54. Ayars, J.E.; Hoffman, G.J.; Corwin, D.L. Leaching and Root Zone Salinity Control. Agric. Salin. Assess. Manag. 2012, 12, 371–403. [Google Scholar]
  55. Pérez-Blanco, C.D.; Hrast-Essenfelder, A.; Perry, C. Irrigation Technology and Water Conservation: A Review of the Theory and Evidence. Rev. Environ. Econ. Policy 2020, 14, 45–66. [Google Scholar] [CrossRef]
  56. Perry, C. Efficient Irrigation; Inefficient Communication; Flawed Recommendations. Irrig. Drain. 2007, 56, 367–378. [Google Scholar] [CrossRef]
  57. Ilyas, A.; Manzoor, T.; Muhammad, A. A Dynamic Socio-Hydrological Model of the Irrigation Efficiency Paradox. Water Resour. Res. 2021, 57, e2021WR029783. [Google Scholar] [CrossRef]
  58. Howell, T.A. Enhancing Water Use Efficiency in Irrigated Agriculture. Agron. J. 2001, 93, 281–289. [Google Scholar] [CrossRef] [Green Version]
  59. Elliott, J.; Deryng, D.; Müller, C.; Frieler, K.; Konzmann, M.; Gerten, D.; Glotter, M.; Flörke, M.; Wada, Y.; Best, N.; et al. Constraints and Potentials of Future Irrigation Water Availability on Agricultural Production under Climate Change. Proc. Natl. Acad. Sci. USA 2014, 111, 3239–3244. [Google Scholar] [CrossRef] [Green Version]
  60. Levidow, L.; Zaccaria, D.; Maia, R.; Vivas, E.; Todorovic, M.; Scardigno, A. Improving Water-Efficient Irrigation: Prospects and Difficulties of Innovative Practices. Agric. Water Manag. 2014, 146, 84–94. [Google Scholar] [CrossRef]
Figure 1. Average food production per megaliters of groundwater withdrawn for irrigation (Source: Derived from FAOSTAT (http://www.fao.org/faostat/en/#data [last date of access: 4 May 2017])).
Sustainability 14 16896 g001
Figure 2. Mean Groundwater irrigation stress index during 1981–2014: (a) including environmental flow requirements; (b) without environmental flow requirements. Note: (a) follows the WSI scale given in Table 1 and (b) follows the UN renewable stress scale where SR 0–0.1: Low stress, 0.1–0.4: High stress, 0.4–1: Extreme stress and >1: Overexploitation.
Sustainability 14 16896 g002
Figure 3. Mean non-renewable groundwater abstraction for irrigation during 19812014 with the percentage of positive deficit irrigated area for selected countries in boxes. Note: Negative NRGA indicates water availability is greater than demand, while positive NRGA indicates the opposite, and that the system is being exploited.
Sustainability 14 16896 g003
Figure 4. Unsustainable groundwater abstraction for irrigation if the SR is limited to 0.6. Positive values indicate some capacity for increased abstraction within the SR ≤ 0.6 condition.
Sustainability 14 16896 g004
Figure 5. Unsustainable food production (colored areas) by country from unsustainable groundwater extraction (tonnes), and as a percentage of total food production (circles) if SR is limited to 0.6.
Sustainability 14 16896 g005
Figure 6. Percentage reduction in SR in (a) high efficiency scenario and (b) moderate efficiency scenario. The dotted green circles indicate the regions having a high difference.
Sustainability 14 16896 g006
Figure 7. Number of countries under different groundwater stress levels for three irrigation efficiency scenarios.
Sustainability 14 16896 g007
Figure 8. Sustainable and unsustainable food production under different scenarios. Note: The hatched portions of bars indicate unsustainable part of groundwater-irrigated food production, while the filled portions of bars indicate the amount of unsustainable food production that becomes sustainable in the higher efficiency higher yield scenarios.
Sustainability 14 16896 g008
Table 1. Groundwater stress level based on the WSI scale [Modified from [32]].
SR RangeGroundwater Stress Level
(1)
0–0.1
Not exploited
(2)
0.1–0.3
Slightly exploited
(3)
0.3–0.6
Moderately exploited
(4)
0.6–1
Heavily exploited
(5)
>1
Overexploited
Table 2. Efficiency and yield improvement scenarios used in this study.
Scenario NameDescription
S1Base Case Scenario: SR ≤ 0.6
S2High Efficiency Scenario: Irrigation efficiency = 90%
S2aModerate Efficiency Scenario: Irrigation efficiency = 75% of the difference between current and maximum efficiency (90%)
S3High Efficiency and Yield Scenario: Irrigation efficiency = 90%; Irrigation productivity ≥ 8 t/ML
Table 3. Comparison of NRGA of selected countries with earlier studies.
CountryNRGA (km3 year−1) Model Used: PCRGlobWB [2]GWD 1 in Food Production (km3 year−1) Model Used: PCRGlobWB [30]GWD 1 (km3 year−1) Model Used: WaterGAP2.2a [19] GWD 1 (km3 year−1) Model Used: WaterGAP 2.2b [19]NRGA Due to Food Production (km3 year−1) This Study Models Used:–
Globwat + Empirical Recharge Model
India68.073.561.040.0 263.3
Pakistan35.027.5--22.3
China20.024.037.021.0 326.9
United States30.016.233.444.334.7
Iran20.033.3--28.2
Saudi Arabia10.012.5--1.5
Mexico11.011.1--11.2
Turkey-2.0--2.7
Global 241.4--207.2
Note: 1 GWD—Groundwater depletion; 2 Sum of GWD in Northern India, Northeastern India and Irrigated areas in Indus basin; 3 Sum of GWD in North China plain and Hai River basin.
Publisher’s Note: MDPI stays neutral with regard to jurisdictional claims in published maps and institutional affiliations.

