Abstract
Onion is one of the most widely cultivated high-value vegetables on the globe. The study of variability and genetic divergence in this crop will facilitate judicious parent selection for future breeding. The present study incorporated 20 onion genotypes to determine the genetic variability and diversity through morpho-physiological and molecular markers. The genotypes were tested for two consecutive years to determine the effects on yield-attributing and bulb-quality traits. Diversity at a molecular level with 31 simple sequence repeat (SSR) markers was determined. Adequate genetic variability existed among the genotypes, with a predominance of additive gene action regarding the inheritance of most of the characteristics. Principal component (PC) analysis detected seven PCs contributing to more than 87% of the genetic diversity in the genotypes. Total yield (kg/plot), Grade ‘C’ bulb (equatorial diameter of the bulb between 3.5 and 4.5 cm), individual bulb weight (g) and phenol content were detected as characteristics positively associated with the first two PCs. A total of 16 primers were amplified, and they produced 32 alleles in the genotypes. Genetic diversity at the morphological and molecular levels indicated moderate diversity among the tested genotypes, with the dissolution of the genotypes into six and three clusters, respectively. The present study on onion facilitates the selection of diverse parents that can generate desirable segregants in future breeding programmes.
1. Introduction
Onion (Allium cepa L.), belonging to the family Alliaceae, is an important high-value bulbous vegetable crop cultivated globally [1]. India ranks second in onion production, with an average of 22.43 million tonnes each year [2]. The onion bulb is highly nutritious and rich in flavonoids, such as quercetin, anthocyanins, fructo-oligosaccharides and organosulphur compounds [3]. Moreover, among the two species best suited for the cytotoxicity testing of pesticides are onion and garlic [4]. It has also been demonstrated that onion can be a valuable biosensor for in situ screening of the cyto–genotoxicity potential of some artificial food colours [5].
Conventional breeding efforts have been routinely practiced for an improvement in yield, bulb quality and biotic and abiotic stress management in onion. However, the complexities in its pollination behaviour due to its heterozygous nature with the presence of self-incompatibility and a long gestation period have narrowed down the genetic improvement process of this vegetable [6].
Richness in genetic diversity and the presence of adequate genetic variability are the essential prerequisites for the substantial improvement of any crop [7]. Furthermore, the knowledge of genetic diversity helps in the efficient management of germplasm and the selection of diverse parents to obtain heterotic progeny. Onion has been domesticated for a long time and cultivated, as well as adapted, in vast agro-climates, which have led to the creation of genetic variation. Unfortunately, the documentation of onion genetic diversity and the information regarding its genetic resources is limited, which promotes the urgency of assessing the genetic divergence of the genetic resources to plan a sound breeding programme [1,8].
The study of phenotypic variation through morphological markers is the simplest way of estimating the genetic diversity that exists among the genetic resources of a crop. However, morphological markers are meagre in number, as well as being highly influenced by environmental factors, and they are sometimes not able to differentiate between closely related individuals [9]. From this perspective, the utilisation of molecular markers has been successfully proven towards manoeuvring the problems associated with either morphological or biochemical markers. However, the absence of a co-dominant, robust marker system in onion due to its large genome size [10] does not justify the superiority of molecular marker systems in onion diversity programmes [11]. Recently, the use of simple sequence repeat (SSR) markers in onion has increased many-fold because of their co-dominant nature, selective neutral behaviour, easy and fast assay and high reproducibility [1]. Many workers have deployed SSR markers in onion diversity programmes [12,13,14,15].
As such, the present investigation was outlined with the following objectives: appraisal of the genetic variability of the onion genotypes based on yield-attributing and qualitative traits and assessment of the level of genetic diversity among the tested onion genotypes using morphological and molecular markers.
2. Materials and Methods
2.1. Plant. Materials and Field Experiment
The present investigation was carried out at Horticultural Research Station, Mondouri (23.5 N latitude, 89 E longitude and altitude of 9.75 m above mean sea level), Bidhan Chandra Krishi Viswavidyalaya, Nadia, West Bengal, India, during the winter seasons of2015–16 and 2016–17. The experimental material consisted of twenty genotypes of onion, including released varieties and landrace. Genotypes were raised in a randomised complete block design (RCBD) with three replications, maintaining row-to-row and plant-to-plant spacing of 15 × 10 cm. Sowing was carried out on the 2nd week of October in both the years, seedlings were transplanted in the 1st week of December, and harvesting was carried out in the last week of April. Five representative plants were selected randomly from each genotype, and they were tagged for identification at 90–100 days after transplanting. The average from these five plants was determined to record observations of 14 yield attributes (plant height, number of leaves, polar diameter, equatorial diameter, neck thickness, number of scales, days to maturity, Grade ‘A’ bulbs, Grade ‘B’ bulbs, Grade ‘C’ bulbs, individual bulb weight, marketable bulb/plot, marketable yield and total yield). Polar diameter of the bulb was recorded considering the length between the two polar ends of the bulb, whereas equatorial diameter was recorded based on the diameter at the maximum width of the bulb across the polar length with the help of Vernier calipers. Grade ‘A’ bulb was a bulb with equatorial diameter above 5.5 cm, Grade ‘B’ bulb was a bulb with equatorial diameter between 4.5 and 5.5 cm, and Grade ‘C’ bulb was a bulb with equatorial diameter between 3.5 and 4.5 cm; the % was calculated.
2.2. Estimation of Biochemical Parameter
Five representative bulbs were selected randomly from each genotype and tagged to record five biochemical traits (total soluble solids, dry matter content in bulbs, pungency, total phenol and vitamin C). A total soluble solid (TSS) was recorded with the help of pocket refractometer. Plant sulphur was determined by precipitation of sulphate from the digest as barium sulphate, with addition of barium chloride salt (turbidimetric method) following the protocol of Tandon [16]. Total phenol was estimated as per the standard protocol of Walter and Purcell [17]. It was examined spectrophotometrically with the Folin–Ciocalteu phenol reagent.
Vitamin C content of mature onion bulbs was estimated using the volumetric method, as previously described [18], as follows:5 mL of the working standard ascorbic acid solution was pipetted out into a 100 mL of conical flask, and 10 mL of 4% oxalic acid was added for titration against the dye (V1 mL). Endpoint is the appearance of pink colour. The amount of dye consumed is equivalent to the amount of ascorbic acid. The sample was extracted in 4% oxalic acid, made up to 100 mL of volume and centrifuged. Then, 5 mL of this supernatant was pipetted out and10 mL of 4% oxalic acid added and titrated against the dye (V2 mL).
Amount of ascorbic acid was calculated as follows:
mg/100 mL sample = (0.5 mg/V1 mL + V2 mL/5ml + 100 mL × 100/Wt. of the sample)
2.3. DNA Extraction and SSR Analysis
Genomic DNA was isolated through CTAB DNA extraction protocol [19] from two-week-old leaf tissue of individual plants from 20 onion genotypes grown in the field. The quality was checked in 1% agarose gel. UV absorption spectrophotometer (Beckman DU 650 model) was used to estimate the purity and concentration of the isolated genomic DNA. After quantification, the DNA was diluted to a concentration of 50 ng/μL for diversity analysis deploying SSR primers. In the present study, 31 SSR primers already utilised [20,21] were selected for molecular diversity analysis. The PCR reaction was carried out with PCR Master Mix Kit utilising a total volume of 25 μL. PCR amplifications were performed on an Eppendorf flexid thermal cycler by using the following temperature cycle: 94 °C for 3 min of initial denaturation; subsequently 35 cycles each of denaturation at 94 °C for 45 s; annealing of primer pairs at appropriate temperature (49–53 °C) for 45 s; and polymerisation at 72 °C for 1 min. Further extension was followed at 72 °C for 7 min, followed by holding the samples at 4 °C for 5 min. After that, 1% agarose gel electrophoresis was performed for the PCR-amplified products, along with 100 bp DNA ladder as a marker. The gel was visualised by staining with ethidium bromide, and banding patterns of the PCR product’s band were visualised under UV trans-illuminator and image captured for further analysis.
2.4. Statistical Analysis
Combined analysis of variance (ANOVA) was used to test significance on the total variations among genotypes for different characters using the ‘F’ test as shown in Table 1 [22]. Phenotypic (σ2p) and genotypic (σ2g) variances, phenotypic coefficient of variation (PCV), genotypic coefficient of variation (GCV) and heritability were estimated as per the procedure reported by [23]. The genetic divergence was carried out using Mahalanobis D2 statistics [24]. The genotypes were grouped into different clusters; inter- and intra-cluster distances were also computed. The procedure described by Banfield [25] was conceded for principal component analysis (PCA).

Table 1.
Combined analysis of variance for yield-attributing and bulb-quality traits in onion.
To determine genetic distance and cluster analysis of the genotypes, the SSR-amplified alleles were detected as the occurrence (1) or non-occurrence (0) of the corresponding band. The polymorphism information content (PIC) for each SSR marker was calculated to assess the informativeness of the markers. The formula was the following: PIC = 1−∑Pi2 − ∑∑Pi2 Pj2, where ‘i’ is the total number of alleles detected for SSR marker, ‘Pi’ is the frequency of the ith allele in the set of 20 genotypes investigated, and j = I +1 [26]. Resolving power of each used primer was computed as Rp = Σ Ib, where ‘Ib’ = 1 − (2 × |0.5 − p|), and ‘p’ is the measure of genotype with the band [27].
The binary data matrix was subjected to cluster analysis to determine the genetic diversity among the tested genotypes. The excel file containing the binary data was imported into Windostat Version 9.3. Similarity was calculated with the 0/1 matrix as Jaccard’s coefficient by means of SIMQUAL subroutine in SIMILARITY routine [28]. A dendrogram was constructed by employing resultant similarity matrix using the sequential agglomerative hierarchical non-overlapping (SAHN)-based unweighted pair group method with arithmetic means (UPGMA) to deduce genetic relationships.
3. Results and Discussion
3.1. Mean Performance of the Genotypes and Genetic Variability Studies
A total of15 cultivars were analysed (Bhima Super, Bhima Raj, Pusa White Flat, Bhima Shakti, Bhima Shubhra, Pusa Madhvi, NHRDF Red-2, Agrifound White, Bhima Kiran, Bhima Dark Red, Sukhsagar, Bhima Shweta, NHRDF Red-4, Pusa Red and Pusa Ridhi). Combined analysis of variance over the period of 2 years revealed a significantly higher amount of variability among the genotypes for all the yield-attributing and bulb-quality traits studied, which affirmed the presence of significant genetic variation among the onion genotypes (Table 1).
In the present study, adequate genetic variability was depicted through the mean performance of the genotypes in a box plot (Figure 1). Plant height ranged from 49.28 to 56.07 cm, with a mean value of 52.15 cm. Pusa Red was the tallest genotype, whereas Sukhsagar was the shortest genotype. The highest number of leaves was recorded in Pusa White Flat, and the lowest number of leaves was recorded in NHRDF Red-3. The polar diameter ranged from 39.43 to 60.16 mm, with a mean value of 50.05 mm. The equatorial diameter ranged from 49.88 to62.05 mm, with a mean value of 56.05 mm. The maximum equatorial diameter was recorded in Pusa Ridhi, and the minimum equatorial diameter was found in Agrifound Light Red. Regarding neck thickness, the range among the tested genotype was 5.55–12.66 mm, with a mean value of 8.30 mm. The range for the number of scales was 8.60–12.20. The mean value for days to flowering was 126 days, with a range of 110–151 days. Among the different bulb categories, the highest variability was recorded for Grade ‘B’ and Grade ‘C’ bulbs. The highest individual bulb weight was found in Bhima Kiran (59.30 g), and the lowest was found in Bhima Shakti (48.74 g). There was significant variation among the genotypes for marketable bulb, marketable yield and total yield. The highest marketable bulb/plot was recorded in Bhima Raj (138.56), while the lowest yield was observed in Pusa White Round (109.55). The highest marketable yield, as well as total yield, was recorded in NHRDF Red-4, followed by Agrifound White, while the lowest yield was observed in NHRDF Red-2.
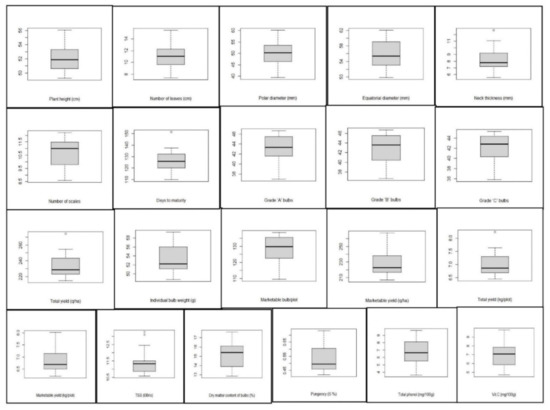
Figure 1.
Box plot view elucidating the distribution pattern regarding mean performance of various traits of 20 onion genotypes. The box represents the area from the first quartile to the third quartile. A horizontal line goes through the box at the median. The whiskers (vertical line) go from each quartile to the minimum or maximum.
In the present study, it was detected that the PCVs were greater than the consequent GCVs for all the traits, demonstrating an environmental influence on those traits (Table 2). The GCV ranged from 3.90% (plant height) to 29.28% (individual bulb weight), whereas the PCV ranged from 4.09% (plant height) to 29.37% (individual bulb weight) for the studied characteristics. In most of the biochemical traits, the differences between GCV and PCV were found to be minimum, which indicated that these characteristics were the least influenced by the environment. An estimation of heritability coupled with genetic advance as percentage over means provides greater effectiveness for selection through the exclusion of the environmental components from the total variability, thus permitting proper selection of the potential phenotype. In the present study, all the characteristics, except for plant height, showed high heritability with moderate-to-high genetic advance as % over means and, thus, reflected the predominance of additive gene action for the expression of these characteristics. Therefore, the selection of these characteristics would be efficient in this population. The outcomes of the study are consistent with those of the previous reports of Dhotre [29], Singh and Dubey [30] and Golani et al. [31] regarding high heritability with moderate-to-high GA in most of the yield-attributing traits in onion. The eigen values and % variation in the onion genotypes that were studied are given in Table 3. The level of polymorphism for SSR primers in onion genotypes is presented in Table 4.
Table 2.
Mean, range and estimates of genetic parameters of onion genotypes.
Table 3.
Eigen values and % of variation for principal components of yield-attributing and bulb-quality traits in onion genotypes.
Table 4.
Level of polymorphism for SSR primers in onion genotypes.
3.2. Genetic Divergence through Multivariate Analysis
Genetic divergence was estimated among the tested genotypes using Mahalanobis’ D2 statistic [24] to identify diverse parents for future hybridisation programmes. This statistical analysis is used to measure the degree of diversification and determines the relative portion of each component trait to total divergence. It was observed that the whole genotypes of onion were grouped into six distinctive clusters using Tocher’s method [32] (Figure 2) with the principle that the average intra-cluster D2 values should be less than the average inter-cluster D2 values. Cluster I was the largest cluster, consisting of 15 cultivars (Bhima Super, Bhima Raj, Pusa White Flat, Bhima Shakti, Bhima Shubhra, Pusa Madhvi, NHRDF Red-2, Agrifound White, Bhima Kiran, Bhima Dark Red, Sukhsagar, Bhima Shweta, NHRDF Red-4, Pusa Red and Pusa Ridhi), and all other clusters consisted of only one genotype each, i.e., Cluster II (Bhima Red), Cluster III (NHRDF Red-3), Cluster IV (Agrifound Light Red), Cluster V (NHRDF Red-1) and Cluster VI (Pusa White Round). The configuration of different lone clusters might be due to the fact that geographic barriers barred the gene flow, or exhaustive natural and human selection for diverse and adoptable gene complexes caused this genetic diversity. The mean inter- and intra-cluster distances among the six clusters are presented in (Figure 3). The inter-cluster distance ranged from 13038.90 to 46540.51, indicating the presence of a substantial amount of genetic diversity in the genetic material. The maximum inter-cluster distance was recorded between Clusters III and VI (46540.51), followed by Clusters III and IV (39137.15), whereas the lowest inter-cluster distance was recorded between Clusters II and III (13038.90). Therefore, it would be desirable to select genotypes as parents from distant clusters during the hybridisation programme to obtain highly heterotic combinations, as parents of divergent groups have a large number of contrasting alleles that can create a new recombination. Therefore, in the present study, NHRDF Red-3 and Pusa White Round would be the superior parents for the production of superior heterotic combinations. The results agreed with the finding of Arya et al. [33].
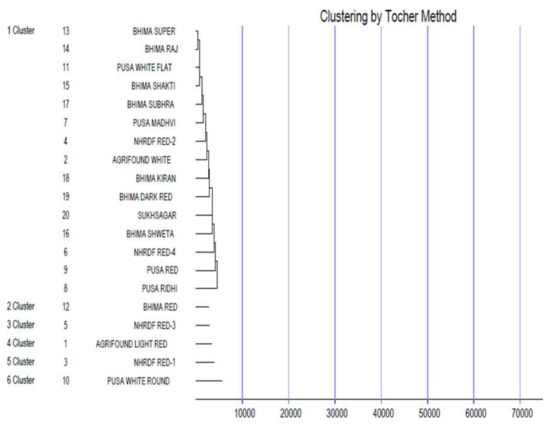
Figure 2.
Dendrogram showing clustering pattern of 20 genotypes of onion using Tocher’s method.
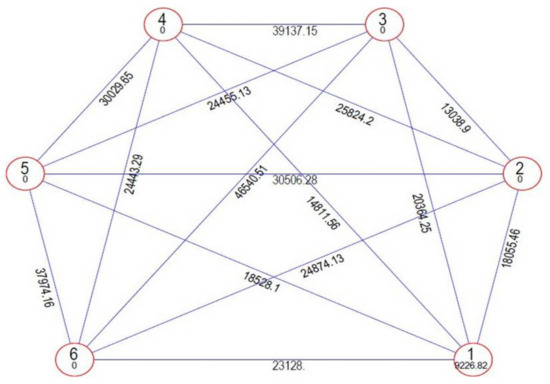
Figure 3.
Clustering configurations and their mutual relationship using the Mahalanobis/Euclidean distance method for yield-attributing and bulb-quality traits in 20 genotypes of onion.
In the present study, principal component analysis (PCA) was used to evaluate the variation among the onion genotypes. According to the PCA results (Table 3), the eigenvalue was the maximum in PC-I (4.77), followed by PC-II (4.09) and PC-III (2.95). The total variance % was the maximum in PC-I (22.70), followed by PC-II (19.49) and PC-III (14.05). The first seven PCs with eigen values >1 contributed to 87.87% of the variability amongst genotypes. A similar kind of inference was concluded by Arya et al. [33], who observed that three principal components contributed to 95.61% of the variation. In contrast, Hanci and Gokce [34] observed that nine PCs with eigen values >1 contributed to 71.84% of the variability among 96 Turkish onion accessions. However, consistent with our findings, marketable yield and total yield contributed more positively as observed with PC-I.
3.3. Genetic Divergence Study at Molecular Level
In the present study, thirty-one SSR primers were used, and they detected the differential ability to identify unique multiband phenotypes among the 20 genotypes. Out of the 31 SSR primers used, 16 microsatellites were amplified, and they produced 32 alleles in the 20 genotypes of onion. The various parameters related to the efficiency of the primers for SSR analysis are given in Table 4. The total number of alleles varied, with an average of two alleles per locus for each primer. The PICs for all the SSR primers used in this study were calculated, and they are presented in Table 4. The highest polymorphism was observed for six primers, i.e., ACM 018, gSSR 38, gSSR 39, gSSR 50, eSSR 20 and AMS 16 (0.50), while it was found to be the lowest for the primer ACM 004 (0.37), with a mean value of 0.45. The PIC value gives information on the relative ability of the marker to detect the genetic variability between accessions. A high PIC value of all the six primers (producing two alleles per locus) indicated that the primers were highly informative. This is in accordance with the previous investigations reported by Khar et al. [12], who obtained the highest PIC value of 0.89 in 34 onion accessions, while Mallor et al. [14] found the highest PIC value of 0.77 in 85 Spanish onion genotypes. All the SSR primers used in the present study formed distinct, scorable and clear-cut bands. The PCR product size obtained by amplification of SSR primers ranged from 150 to 310 bp. All 16 primers showed a high DI value (DI > 0.50), indicating that these SSR markers were informative. The maximum MI was observed for the primer ACM 326 (11.21), followed by the primer ACM 018 (9.38). The estimates of RP were established to be the maximum for the primers ACM 018 (1.90) and gSSR 50 (1.90), followed by ACM 326, gSSR 38, gSSR 39, eSSR 20 and AMS 12 (1.80). Finally, 20 onion cultivars were broadly placed into three major clusters (Figure 4) as revealed from the dendrogram generated from the unweighted pair group arithmetic average (UPGMA) cluster analysis. Cluster ‘I’ comprised the six most diverse genotypes, namely, Agrifound Light Red, Bhima Red, Bhima Raj, Agrifound White, Bhima Super and Pusa White round. Cluster ‘II’ consisted of six cultivars, and Cluster ‘III’ consisted of eight cultivars. Similar efforts have been made by Baldwin et al. [13], Mitrova et al. [15] and Khosa et al. [1] to assess divergence through deploying SSR markers, and they reported narrow genetic diversity in most instances.
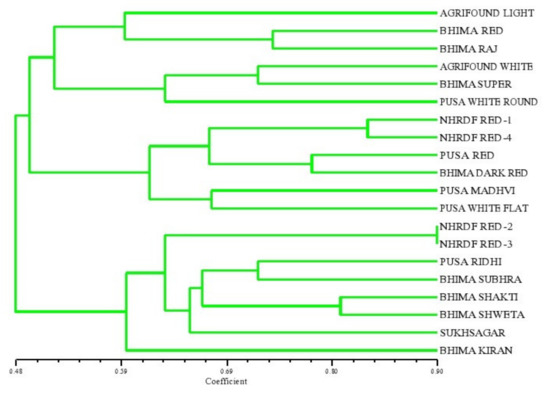
Figure 4.
Dendrogram of onion genotypes based on SSR markers.
In conclusion, it can be stated that the tested onion genotypes revealed adequate genetic variability in terms of morpho-physiological and biochemical traits. The present study successfully determined the genetic divergence present within and among the onion genotypes of India, thus facilitating the proper selection of parents in hybridisation programmes for obtaining superior heterotic progenies.
Author Contributions
Conceptualization, A.B.S. and A.C.R.; methodology, A.C.R.; software, K.P.; validation, A.B.S., A.C.R. and K.P.; formal analysis, A.D.; investigation, A.C.R.; resources, T.K.U.; data curation, A.D.; writing—original draft preparation, A.C.R.; writing—review and editing, A.B.S.,T.K.U., M.A., M.S., M.I.K., M.A.K.; visualization, I.A. and M.I.K.; supervision, A.B.S., T.K.U.; project administration, A.B.S.; funding acquisition, M.A., M.S., M.I.K., M.A.K.; A.B.S. and T.K.U.; supervision. All authors have read and agreed to the published version of the manuscript.
Funding
The authors extend their appreciation to the Deanship of Scientific Research at King Khalid University for funding this work through the Large Group Research Project under grant number (R.G.P.02/205/42).
Institutional Review Board Statement
Not applicable.
Informed Consent Statement
Patient consent was waived as studies involved only Agricultural field trial.
Data Availability Statement
All data incorporated in the manuscript.
Acknowledgments
The authors gratefully acknowledge Bidhan Chandra Krishi Viswavidyalaya (BCKV), West Bengal, for providing essential support to accomplish the research. The authors also gratefully acknowledge the University Grants Commission (UGC), New Delhi, under the Rajiv Gandhi National Fellowship for providing the doctoral scholarship of the first author. It is also acknowledged to the Deanship of Scientific Research at King Khalid University for funding to publish this work through the Group Research Project.
Conflicts of Interest
The authors declare no conflict of interest.
References
- Khosa, J.S.; McCallum, J.; Dhatt, A.S.; Macknight, R. Enhancing onion breeding using molecular tools. Plant. Breed. 2016, 135, 9–20. [Google Scholar] [CrossRef]
- Murthy, B.N.S. This is How India can Make Sure Onions are Available Throughout the Year and at Good Price. 2019. Available online: https://theprint.in/opinion/how-india-can-ensure-onions-are-all-through-year-at-good-price/334477/ (accessed on 7 December 2021).
- Goldman, I.L. Molecular breeding of healthy vegetables. EMBO Rep. 2011, 12, 96–102. [Google Scholar] [CrossRef] [PubMed]
- Bonciu, E. Evaluation of cytotoxicity of the herbicide Galigan 240 EC to plants. Sci. Pap. Ser. A Agron. 2018, 61, 175–178. [Google Scholar]
- Bonciu, E. Some observations on the genotoxicity of the yellow food dye in Allium cepa meristematic cells. Banat. J. Biotechnol. 2019, 10, 46–50. [Google Scholar] [CrossRef]
- Jayaswall, K.; Bhandawat, A.; Sharma, H.; Yadav, V.K.; Mahajan, V.; Singh, M. Characterization of Allium germplasms for conservation and sustainable management using SSR markers. IndianJ.Tradit. Knowl. 2019, 18, 193–199. [Google Scholar]
- Rivera, A.; Mallor, C.; Garces-Claver, A.; García-Ulloa, A.; Pomar, F.; Silvar, C. Assessing the genetic diversity in onion (Allium cepa L.) landraces from northwest Spain and comparison with the European variability. New Zealand J. Crop. Hortic. Sci. 2016, 44, 103–120. [Google Scholar] [CrossRef]
- McCallum, J.; Thomson, S.; Pither-Joyce, M.; Kenel, F.; Clarke, A.; Havey, M.J. Genetic Diversity Analysis and Single-nucleotide Polymorphism Marker Development in Cultivated Bulb Onion Based on Expressed Sequence Tag–Simple Sequence Repeat Markers. J. Am. Soc. Hortic. Sci. 2008, 133, 810–818. [Google Scholar] [CrossRef]
- Rodriguez, J.M.; Berke, T.; Engle, L.; Nienhuis, J. Variation among and within Capsicum species revealed by RAPD markers. Theor. Appl. Genet. 1999, 99, 147–156. [Google Scholar] [CrossRef]
- Bennett, M.D.; Leitch, I.J. Nuclear DNA Amounts in Angiosperms. Ann. Bot. 1995, 76, 113–176. [Google Scholar] [CrossRef]
- Rouamba, A.; Sandmeier, M.; Sarr, A.; Ricroch, A. Allozyme variation within and among populations of onion (Allium cepa L.) from West Africa. Theor. Appl. Genet. 2001, 103, 855–861. [Google Scholar] [CrossRef]
- Khar, A.; Lawande, K.E.; Negi, K.S. Microsatellite marker based analysis of genetic diversity in short day tropical Indian onion and cross amplification in related Allium spp. Genet. Resour. Crop. Evol. 2011, 58, 741–752. [Google Scholar] [CrossRef]
- Baldwin, S.; Pither-Joyce, M.; Wright, K.; Chen, L.; McCallum, J. Development of robust genomic simple sequence repeat markers for estimation of genetic diversity within and among bulb onion (Allium cepa L.) populations. Mol. Breed. 2012, 30, 1401–1411. [Google Scholar] [CrossRef]
- Mallor, C.; Arnedo-Andrés, M.; Garces-Claver, A. Assessing the genetic diversity of Spanish Allium cepa landraces for onion breeding using microsatellite markers. Sci. Hortic. 2014, 170, 24–31. [Google Scholar] [CrossRef]
- Mitrova, K.; Svoboda, P.; Ovesná, J. The selection and validation of a marker set for the differentiation of onion cultivars from the Czech Republic. Czech. J. Genet. Plant. Breed. 2015, 51, 62–67. [Google Scholar] [CrossRef]
- Tandon, H.L.S. Methods of Analysis of Soils, Plants, Waters and Fertilizers; Fertilizer Development and Consultation Organization: New Delhi, India, 1993. [Google Scholar]
- Walter, W.M.; Purcell, A.E. Evaluation of several methods for analysis of sweet potato phenolics. J. Agric. Food Chem. 1979, 27, 942–946. [Google Scholar] [CrossRef] [PubMed]
- Sadasivam, S.; Balasubramanian, T. Practical Manual in Biochemistry; Tamil Nadu Agricultural University: Coimbatore, India, 1987; p. 14. [Google Scholar]
- Doyle, J.J.; Doyle, J.L. A rapid DNA isolation procedure for small quantities of fresh leaf tissue. Phytochem. Bull. 1987, 19, 11–15. [Google Scholar]
- Harn, C.H.; Hur, C.-G.; Kim, J.E.; Kim, K.-H.; Song, K.H.; Hyun, J.Y.; Lee, H.-R.; Kim, H.-J. Marker Development for Onion Genetic Purity Testing using SSR Finder. Korean J. Breed. Sci. 2012, 44, 421–432. [Google Scholar] [CrossRef]
- Karic, L.; Golzardi, M.; Glamoclija, P.; Sutkovic, J. Genetic diversity assessment of Allium cepa L. cultivars from Bosnia and Herzegovina using SSR makers. Genet. Mol. Res. 2018, 17, 16039870. [Google Scholar] [CrossRef]
- Fisher, R.A.; Yates, F. Statistical Tables for Biological, Agricultural and Medical Research, 4th ed.; Oliver & Boyd: Edinburgh, UK, 1953. [Google Scholar] [CrossRef]
- Singh, R.K.; Chaudhary, B.D. Biometrical Methods in Quantitative Genetic Analysis. Biom. Methods Quant. Genet. Anal. 1977, 34, 723. [Google Scholar] [CrossRef][Green Version]
- Mahalanobis, P.C. On the generalized distance in Statistics. Proc. Natl. Acad. Sci. India Sect. B Biol. Sci. 1936, 2, 49–55. [Google Scholar]
- Banfield, C.F. Multivariate analysis in genstat. J. Stat. Comput. Simul. 1978, 6, 211–222. [Google Scholar] [CrossRef]
- Sehgal, D.; Rajpal, V.R.; Raina, S.N.; Sasanuma, T.; Sasakuma, T. Assaying polymorphism at DNA level for genetic diversity diagnostics of the safflower (Carthamus tinctorius L.) world germplasm resources. Genetics 2009, 135, 457–470. [Google Scholar] [CrossRef] [PubMed]
- Prevost, A.; Wilkinson, M.J. A new system of comparing PCR primers applied to ISSR fingerprinting of potato cultivars. Theor. Appl. Genet. 1999, 98, 107–112. [Google Scholar] [CrossRef]
- Jaccard, P. Nouvelles recherches sur la distribution florale. Bull. Société Vaud. Sci. Nat. 1908, 44, 223–270. [Google Scholar] [CrossRef]
- Dhotre, M. Studies on Genetic Diversity and Influence of Nitrogen Sources on Performance of Kharif Onion (Allium cepa var. Cepa L.). Master’s Thesis, University of Agricultural Sciences, Dharwad, India, 2009. [Google Scholar]
- Singh, R.K.; Dubey, B.K. Studies on genetic divergence in onion advance lines. Indian J. Hort. 2011, 68, 123–127. [Google Scholar]
- Golani, I.J.; Vaddoria, M.A.; Mehta, D.R.; Naliyadhara, M.V.; Dobariya, K.L. Analysis of yield components in onion. Indian J. Agric. Res. 2006, 40, 224–227. [Google Scholar]
- Akter, M.S.; Biswas, A.; Siddique, S.S.; Hossain, S.; Ivy, N.A. Estimation of Genetic Diversity in Onion (Allium cepa L.). Agriculture 2015, 13, 26–34e. [Google Scholar] [CrossRef]
- Arya, J.S.; Singh, N.; Arya, P.S.; Kant, A. Morphological variations and relationship among onion germplasm for quantitative and qualitative traits at trans-Himalaya Ladakh, India. Aust. J. Crop. Sci. 2017, 11, 329–337. [Google Scholar] [CrossRef]
- Hanci, F.; Gokçe, A.F. Molecular characterization of Turkish onion germplasm using SSR markers. Czech. J. Genet. Plant. Breed. 2016, 52, 71–76. [Google Scholar] [CrossRef]


Publisher’s Note: MDPI stays neutral with regard to jurisdictional claims in published maps and institutional affiliations. |
© 2022 by the authors. Licensee MDPI, Basel, Switzerland. This article is an open access article distributed under the terms and conditions of the Creative Commons Attribution (CC BY) license (https://creativecommons.org/licenses/by/4.0/).