Article

Detection of the Seasonally Activated Rural Areas

by
Marija Drobnjaković
*,
Milena Panić
,
Gorica Stanojević
,
Dejan Doljak
and
Vlasta Kokotović Kanazir
Geographical Institute “Jovan Cvijić” Serbian Academy of Sciences and Arts, Djure Jakšića 9, 11000 Belgrade, Serbia
*
Author to whom correspondence should be addressed.
Sustainability 2022, 14(3), 1604; https://doi.org/10.3390/su14031604
Submission received: 30 November 2021 / Revised: 30 December 2021 / Accepted: 6 January 2022 / Published: 29 January 2022

Abstract

:
Rural areas have been usually observed through agriculture; however, today, it is broadened with various activities. In Serbia, it has been characterized by unbalanced development, which has led to a declining vitality and depopulation. The main goal of this research is detection of seasonally activated rural areas in Serbia, expressed through the population fluctuation, temporary settlement, or occasional use of residential and economic facilities, and identification of spatial patterns of seasonal use. This research applied an innovative proxy—nighttime lights (NTL)—as a complementary tool to statistical analyses, which are conducted in the GIS environment. The calculation encompassed two seasonality coefficients: one based on the NTL and the second based on statistical data on tourist turnover. The spatial frame applies settlement level and micro level (pixels), while temporal includes monthly values for the period 2015–2019. The obtained results highlight tourist activity as the main cause of seasonal activation of rural areas. The largest seasonal fluctuations were registered in mountain areas and spa resorts. For mountain areas, the highest seasonality is in the winter months (peak—January/February), and lowest is in the summer season. The seasonal character of spa centers indicates the similar trend, generally less pronounced (peak—January), however, with higher seasonality during the summer.

1. Introduction

Globalization is changing and permeating spaces. It produces a territorial transformation and the new trends within economic activities [1]. It is a complex connection and interdependence of localities that reflects the compression of time and space, which in the context of rural areas turn them into a field of permanent change shaped by economic cycles, trade fluctuations, technological innovation, migrations, politics, and environment quality [2]. Rural space becomes an arena of actors that cause interdependent and multidimensional structural transformations of various elements—landscape, population, economy, and habits, introducing it to the process of restructuring [3,4].
Rural areas, for a long time, have been understood and observed through agriculture, which emerged as a dominant shaping factor. However, in the postmodern context, agriculture is gradually being replaced or broadened with different rural activities. It could not be considered as the only factor of rural development, nor could concrete rural development be achieved only through the “expropriation from agriculture” [5]. Alternatives to agriculture employment can be seen in the activities related to agricultural production (food industry, forest fruits and herbs collection, healthy food production, etc.), developing a range of service industries (tourism, recreation, crafts, trade, culture, art, etc.), and in regard to this, the development of the so-called home business [6]. With the introduction of new contents and services, rural areas are being reshaped, becoming more similar to urban ones. Therefore, the boundary between rural and urban areas is becoming less clear, with a tendency to be completely blurred [7]. A space of continuous transformations is created, which represent transitional forms between these two extreme constructs (suburbs, urban-rural continuum, metropolis, etc.) [2,8,9,10]. Overcoming urban–rural distinctions was contributed to by the more diverse development of rural areas and the creation of the multifunctional development concept [5,11].
Rural areas, in the contemporary sense, do not represent a natural-agrarian reserve. On the contrary, it has wider and more complex forms and contents. From the previously dominant agrarian monofunctionality, today, it becomes a unique complex of economic and social activities within a geospace, with multifunctional characteristics and mosaic landscape [10], striving to create polyvalent spatial forms to rural hybridity [7,12,13]. These new patterns within rural area development were identified as a post-productivism [1,2] that, in its extended meaning, as Halfacree [14] (p. 56) claims, means to “incorporate more potential rural future”. In the process of restructuring, rural areas have experienced different evolutionary phases and transformational processes of their settlement, landscape, population, and socio-economic features, adapting to the needs of rural communities within local territories [10], as well as adapting to imposed external preferences [2].
Nowadays, one of the main users of rural areas and probably the most important cause of change and development is tourism [15]. This sector is manifested through a set of different activities in rural areas [16] using its resources as a basis for development (landscapes, peace, ideology of rural idyll [17,18,19], agriculture as an activity, water, air, and cultural resources [20], etc.). Tourism is becoming one of the most important generators for development and diversification of the rural economy, connecting numerous complementary activities (agro-industrial services, handicrafts, service development, extraction of natural resources, etc.). It was pronounced in the concept of the multifunctional use of rural areas, which was driven by consumption and conservation values and the implementation of an economic reconversion [11,21]. Observed over a longer period, tourism has played a significant role in reviving rural economies [2], introducing innovations, changes in the quality of life of rural residents, and the overall impression of rural areas [22]. However, with the popularization of this activity, the rural areas are exposed to numerous pressures of the visiting seasonal population, which has specially profiled requirements. Simultaneously, this is an opportunity for preserving rural tradition and the sustainability of rural areas and communities [15,17,23,24]. In this regard, in policy terms, tourism is recognized as a stimulative tool for development of lagging peripheral and rural regions [1,22].
The rural areas in Serbia are highly diverse, which is a result of the interrelations of various morphological, historical, cultural and political circumstances, infrastructural equipment, social and functional development, and other factors. It coexists with groups of various rural localities and settlements with differences in development potentials. The pictorial rural settlement with extensive agriculture, in the form of a traditional, reminiscent settlement [25,26,27], is disappearing in Serbia. Settlements with a diversified economy and developed specialized functions, cultural and natural attractiveness, and harmonization with the development tendencies of the consumer society [28] have preconditions for sustainability and development. However, rural areas in Serbia are not characterized by balanced development, as a consequence of improperly directed and imbalanced spatial dispersion of socio-economic processes [10]. This has led to the stagnation and shrinkage of rural areas’ vitality, in sense of the economic neglect, infrastructural isolation, depopulation, and finally non-polycentricity of the settlements’ network. The mentioned problems are practically a developmental brake on rural settlements, the cause of stagnation or, in certain situations, of complete disappearance [29].

2. Framing Seasonality

Leaving the concept of a traditional village, in which people are predominantly connected to the place, area, nature, and agriculture, and adopting a modern, urbanized, multifunctional modality, the users of this type of village, i.e., rural areas, are also changing. Those areas, with the diverse development potential, become attractive to other, non-residential population (investors, seasonal workers, daily migrants, tourists, visitors, second-home residents, recreationists) [30], while areas that lack resources are exposed to intensive shrinkage, leading to gradual depopulation, depression, isolation (poor infrastructure), and institutional marginalization (closure of public institutions and other services). In that context, it is very important to recognize spatial patterns that would indicate the reutilization and the redevelopment of rural areas. The multifunctional approach to rural areas has the new form, with the more sensitive rural planning strategy, whose focus is on the rural areas’ specifics [31].
Alongside remarkable rural features that guide and shape the existence and development of rural areas, some of them are characterized by landscape, agrarian, economic characteristics or their geographical location that provides the opportunity for new forms of occasional use. This so-called seasonal activation or rural areas awakening is driven by various factors, whether it is tourism, weekend excursions, seasonal agricultural work, construction of cottages, and the revivification of settlement parts, seasonal production, cultural events, etc. [32]. Seasonality as a phenomenon induces the unbalanced usage of means necessary for economic development [33]. In the period of activation, the users in rural settlement multiplied, which affects the pressure on the existing infrastructure, services, and environment. Their scope fluctuates at different times of the year, driven by the weather, local and national events, job offers, trade market, the institutional calendar, and the operating season at accommodation sites and major attractions [34]. On the other hand, such shifts mitigate the process of depopulation in impoverished and less populated areas, leading to its seasonal activation and contributing to the sustainability of rural areas. Depopulated and endangered areas eventually could become attractive tourist destinations [22]. In this context, it is important to detect seasonal activation and identify the seasonal population as potential users of rural areas that reflect a certain vitality of settlements, which is of great importance when creating population policy measures and planning the development and organization of settlements in rural areas.
Seasonality in settlement, population, and activities is very difficult to quantify and monitor, if the research approach is based only on traditional statistical data. This could be explained with the fact that data are often out of date or lack seasonality, or other conventional means, like custom surveys, which are expensive, limited in scope, and prone to coverage and sampling errors [30,34,35]. Official statistics data detect changes in the inter-census or longer period, without the capability to show non-residential populations, and enter into fluctuations related to seasonal population movement, temporary settlement, or occasional use of housing and economic facilities; therefore, they are not able to represent changes in the use of rural areas on daily or seasonal bases.
Review of scholarly literature has shown the significant opus of papers, studies, and knowledge on the overview, depiction, and monitoring of the seasonality of human settlements, population, and activities. Some authors approach this issue from the aspect of the overall, total, or ambient population in a certain area at a given moment, in order to generate the so-called seasonal population, i.e., seasonal users of rural areas. For areas with substantial seasonal fluctuation of the population throughout the year, the estimation approach becomes exceptionally critical [35]. Rapidly increasing tourism economy and the enlargement of seasonal population and its particular demands significantly affect existing services and their carrying capacity [30], and stresses the natural environment and physical infrastructure [19].
Due to the sensitivity and delicacy of the estimation of the seasonal population, various methods are developed. Sutton, Eldvige, and Obremski [36] observed it as a part of ambient population, which is a temporally averaged measure of population that takes into account where people work, sleep, eat, drive, shop, etc. and incorporates human mobility. For the estimation of ambient population, these authors have used three models—Gridded Population of the World (GPW), LandScan, and a model derived from nighttime (NTL) satellite imagery. Smith et al. [34] observed seasonal population in the context of exposure to flood risks through the seasonally varying overnight visitor population estimates (work-placed population, overnight visitors, self-catering accommodation, in particular camping and caravanning and second-home population).
The seasonality particularly affects tourism [35,36,37,38] as an integral part of the global economy, with a focus on combating seasonality and prolonging tourism season in order to achieve a sustainable and competitive tourism development. Butler [39] defines the concept of tourism seasonality as temporal imbalance, expressed by the number of visitors, their expenditure, various traffic possibilities, employment, and admissions to attractions. Seasonality in tourism is systematic, intra-year movements in economic time series which are often caused by non-economic phenomena [40], the temporal tourism fluctuations on a daily, weekly, monthly, or annual basis [41], and could be defined as some kind of visitor pattern that repeats every year [37]. Seasonality in tourism is concerned with stable and well-established seasonal patterns [37,38,40]. It addresses the set of different causes such as: (i) nature reflected through the climate pattern (sunny days, snow falls, insolation, etc.) as important factors in the shaping of the touristic sites; (ii) institutional calendar (religious festival and holidays, pilgrimage travel, festival events, workers’ holidays, students’ and pupils’ ferries, etc.); (iii) other pull factors, such as personal preferences, social pressure, sporting season, income specificity and bonus payment, etc. [37,39,40,42,43,44]. As Ferrante et al. [38] refer, tourism seasonality appears to be a frequent research subject, which is not the case with the measurement of seasonality nor seasonal pattern classification.
Since tourism provides the majority of seasonal population, the significant corpus of scholars have observed seasonality in tourism through: the total or monthly average tourist arrivals [30,40] and NTL [45]; and indirect approaches which are based on “symptomatic variables,” such as utility usage, hotel occupancy rates, and postal deliveries, among many other metrics, even traffic counters at the border [35], while the others have opted for mobile cell or social media [46,47]. The previously most commonly used methods for measuring seasonality in tourism are based on statistical analysis and variables such as seasonal range, the seasonality ratio, the coefficient of variation, and the amplitude ratio [37]. Two of the recently most commonly used seasonality measures, based on traditional statistical data, are Gini Concentration Index and Theil Index [40,48,49,50,51]. In Serbia, various research on tourism has a significant scope, related to development of different types of tourism or tourist destination; however, a matter of seasonality is less analyzed. Only a few previous studies have focused on the seasonality in order to measure and quantify it. Approaches applied were based on traditional methods and statistical data, such as the calculation of the Gini Index, and provided insight into the seasonality of mountain destinations [48] and spa centers [52]. However, all of these suggested seasonality measures were applied on economic activity and some of the tourism elements (arrivals, occupancy rate, GDP, income, etc.). The spatial component that could indicate the area activation was insufficiently represented.
Recent studies have demonstrated that innovative, additional data sources collected from remote sensing can provide deeper insights into human activities and their spatial manifestations. More precisely, NTL are based on artificial lighting on the Earth, which is the result of population and activities distribution, providing an opportunity to determine their accurate position as well as density, with a high spatial and temporal resolution [53,54]. Therefore, traditional approaches based on statistical data could be significantly improved with inclusion of NTL images, as an innovative tool [55,56,57].
Early implementation of NTL was related to an inventory of human settlements [58], and their use was rare for a long period of time [59]. However, since the early 2000s, NTL have become a popular proxy, as a result of availability [53,55,57], global coverage, and free access [60]. The population estimation derived from the NTL imagery is very useful for overcoming limits expressed in an incomplete census of its population, or to provide inter-census estimates [36], as well as for other human activities with a lack of traditional economic and demographic statistical data or insufficient accuracy [60]. Additionally, it could be used as an important supplementary dataset to the census in decision-making processes [61].
As was determined in previous studies, if one phenomenon can be studied by applying NTL, then it should be possible to study other causally related phenomena with the same approach [62]. Accordingly, this tool has been used for exploring the various phenomena and development issues related to human activities, such as: population estimation [58,63,64,65], population density [65,66], urban extent [55,67,68], urban transition [69,70], economic development [53,58,71], and poverty [72,73].
The NTL data could be used as an alternative proxy for identifying seasonality. It provides consistency and continuity at a spatial scale that is appropriate for capturing the effects of many processes, including natural (e.g., fires, insect attacks) and anthropogenic (e.g., deforestation, urbanization, farming) disturbances [74]. Previously, it has been widely used for seasonal landscape changes and albedo monitoring [75,76,77,78,79], but recently has been introduced in human sciences [45,80] as well, particularly in tracking seasonal populations attracted by tourism [30,32,61,81]. Satellite images of NTL with monthly or seasonal distributions have been used for seasonality tracking in the activation of certain settlements [32], while providing data daily to reveal seasonal population movement at finer spatial and temporal intervals [30].
Seasonal character of rural settlements, i.e., seasonal activating of rural areas, could be understood as an important indicator for an accurate and realistic analysis of the rural areas “life cycle”. Seasonal population fluctuation, temporary settlement, or occasional use of residential and economic facilities significantly affect the overall vitality of the rural settlement. Accordingly, the main goal of this research is to detect such rural areas or localities in Serbia. Our research takes advantage of an innovative proxy—NTL, for tracking changes and seasonal activation of rural areas and identifying spatial patterns of seasonal use of rural areas. More precisely, it is applied as a tool to fill the data-gap within seasonal population estimations in rural areas that offer a new way for identification and monitoring processes in the rural settlements network.

3. Materials and Methods

In this study, a two-step methodology is applied for examining the spatial distribution of seasonal variations in population and activity. The first step of analysis refers to identification and monitoring of spatial and temporal aspects of changes in NTL, not only in space, but also in time, which has enabled detection of different intensities of seasonal changes within rural areas on the territory of Serbia. This is followed by the second step which implies a deeper understanding of the seasonality variation within detected rural areas, as well as identification of activities which represent main driving factors of the examined phenomenon. Methodology of this research is based on using remote sensing techniques, geographic information system QGIS 3.16.5 [82], and statistical analyses.

3.1. Spatial and Temporal Aspect of the Research

Research has been conducted for the territory of Serbia, located in Southeast Europe, Balkan Peninsula, with a total area of 88,499 km2 and total population 7,186,862 (Census 2011). Toward deeper understanding of the studied problem, authors have chosen a more detailed and fine-scale approach, which implies calculations of seasonality coefficient for level of settlement at the rural territory of Serbia.
Considering that the rural areas in Serbia are not strictly defined and are usually observed as being residual to urban areas in scholarly and legislative literature [10], authors opted for a similar, but modified “opposite” understanding of rural areas, which are in the focus of the research. Rural areas are observed as a non-urban area, out of the urban “skirt”. Urban areas were considered as central settlements on local territory, which are highly urbanized and populated with the most pronounced centrality and influence, in accordance with central place theory [83,84], center-periphery concept [85,86], and urban-centralized models of spatial development. After excluding these central nodes, rural areas in this research embedded 4551 rural settlements out of total number of 6170 settlements in Serbia. Settlements on the territory of Kosovo and Metohija are excluded from the analysis, due to unavailability of official statistical data
Temporal frame of this research encompasses the period 2015–2019. The approach is based on monthly data, composites of NTL satellite images, and official statistical data.

3.2. Seasonality Coefficient Based on Satellite Images of Nighttime Lights (Scos)

The freely available data from remote sensing facilitate identification of the seasonal activation of rural areas with different purposes and indicate the processes that take place in space over a longer period. In this study, the satellite images of NTL were used to estimate total population activity within a year based on the VIIRS Nighttime Day/Night Band (DNB) Composites Version 1 dataset (Earth Observation Group, Payne Institute for Public Policy, Colorado School of Mines, 2012–present) [87]. In this regard, the NTL have been used to measure ambient population in rural areas and include activity of total population (residual, seasonal agricultural workers, daily workers, visitors, tourists, recreationist, second-home residents, etc.) that were captured in rural areas at a specific time scale. To capture inter-annual variability and spatial patterns of seasonality, preformed analysis included several steps:
  • Preparation of monthly series of NTL for the territory of Serbia. Monthly cloud-free DNB composites passed stray-light corrections were used [87]. The spatial resolution of the dataset was about 500 m, while NTL emission was expressed as radiance in nW/cm2/sr. Apart from numerous advantages, there were certain weaknesses related to the usage of satellite images of NTL related to blooming effect, saturation, impact of weather conditions, surface albedo, and other sources of noise [62]. Tracking population activity was additionally affected by satellite recording time, i.e., about 1:30 a.m. Also, before the final usage, additional data preparation was necessary. In this case, preprocessing included removing negative values of radiance and interpolation of excluded pixels applying the nearest-neighbor interpolation method. After the observed distribution of radiance, the outliers were removed from the analysis. Although the first release was for several months in 2012, developed algorithms in the following years enabled additional refinements of VIIRS DNB nighttime light imagery, including stray-light correction procedure [87]. To ensure the quality of used data and to avoid variability between years, average monthly NTL were calculated for a period of five years (2015–2019). The multi-year average should eliminate variability in the time series as a product of different events, natural as well as human-induced occurrences (weather conditions, fires, ephemeral light, etc.);
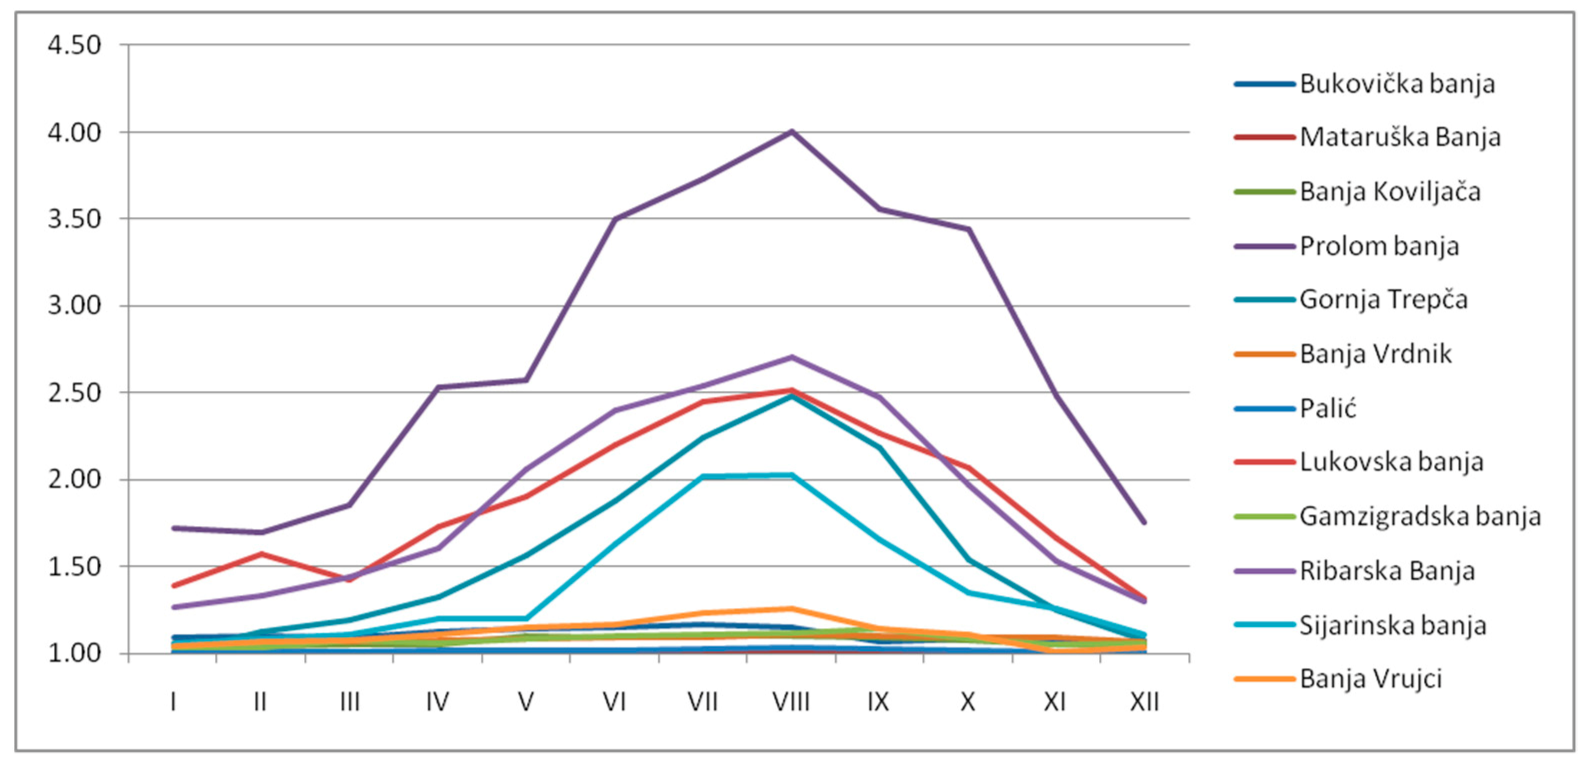
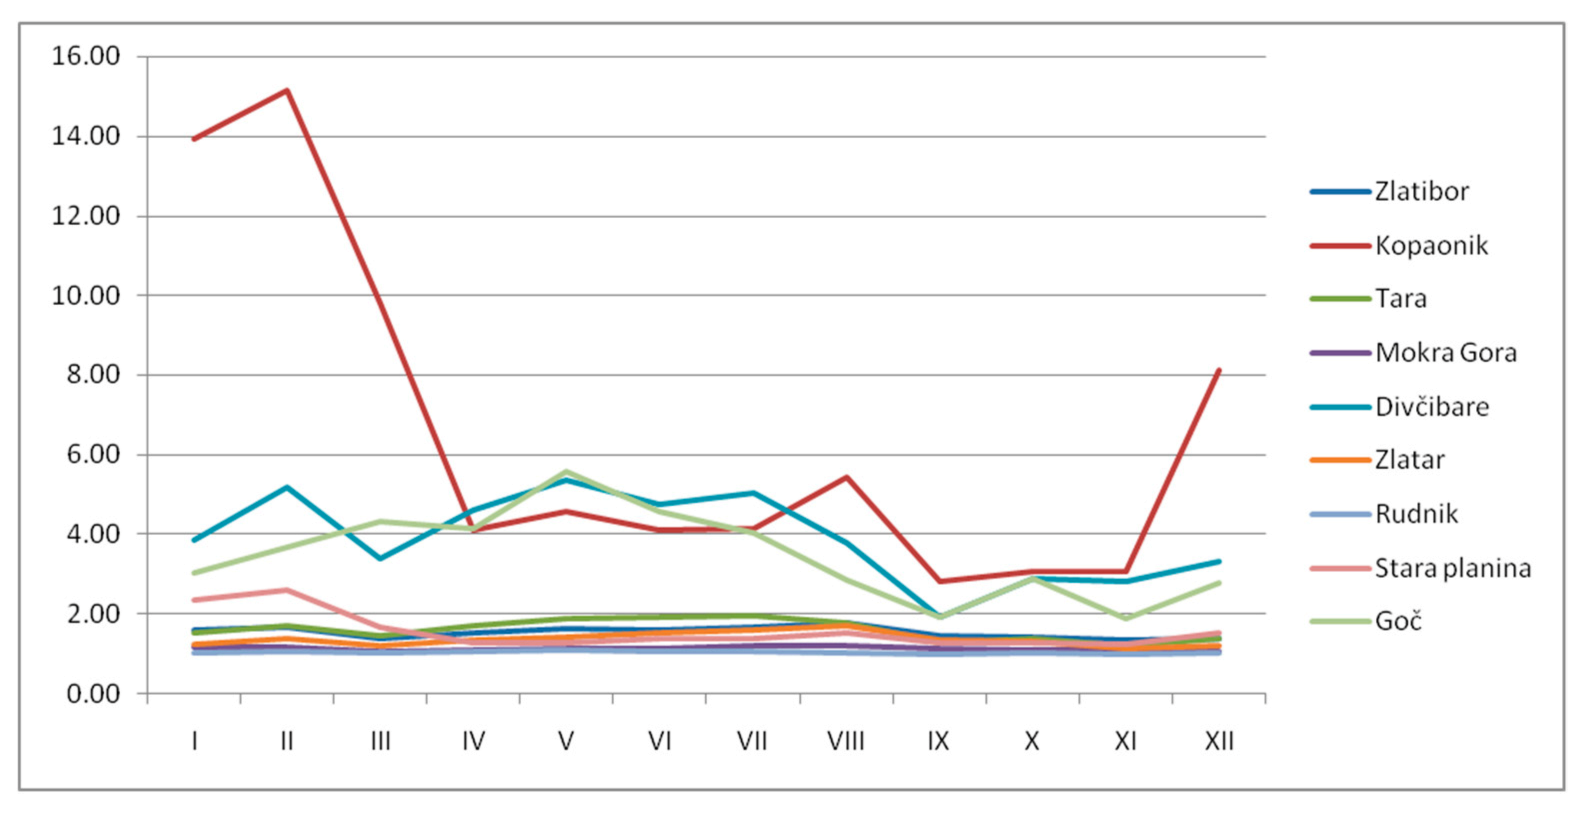
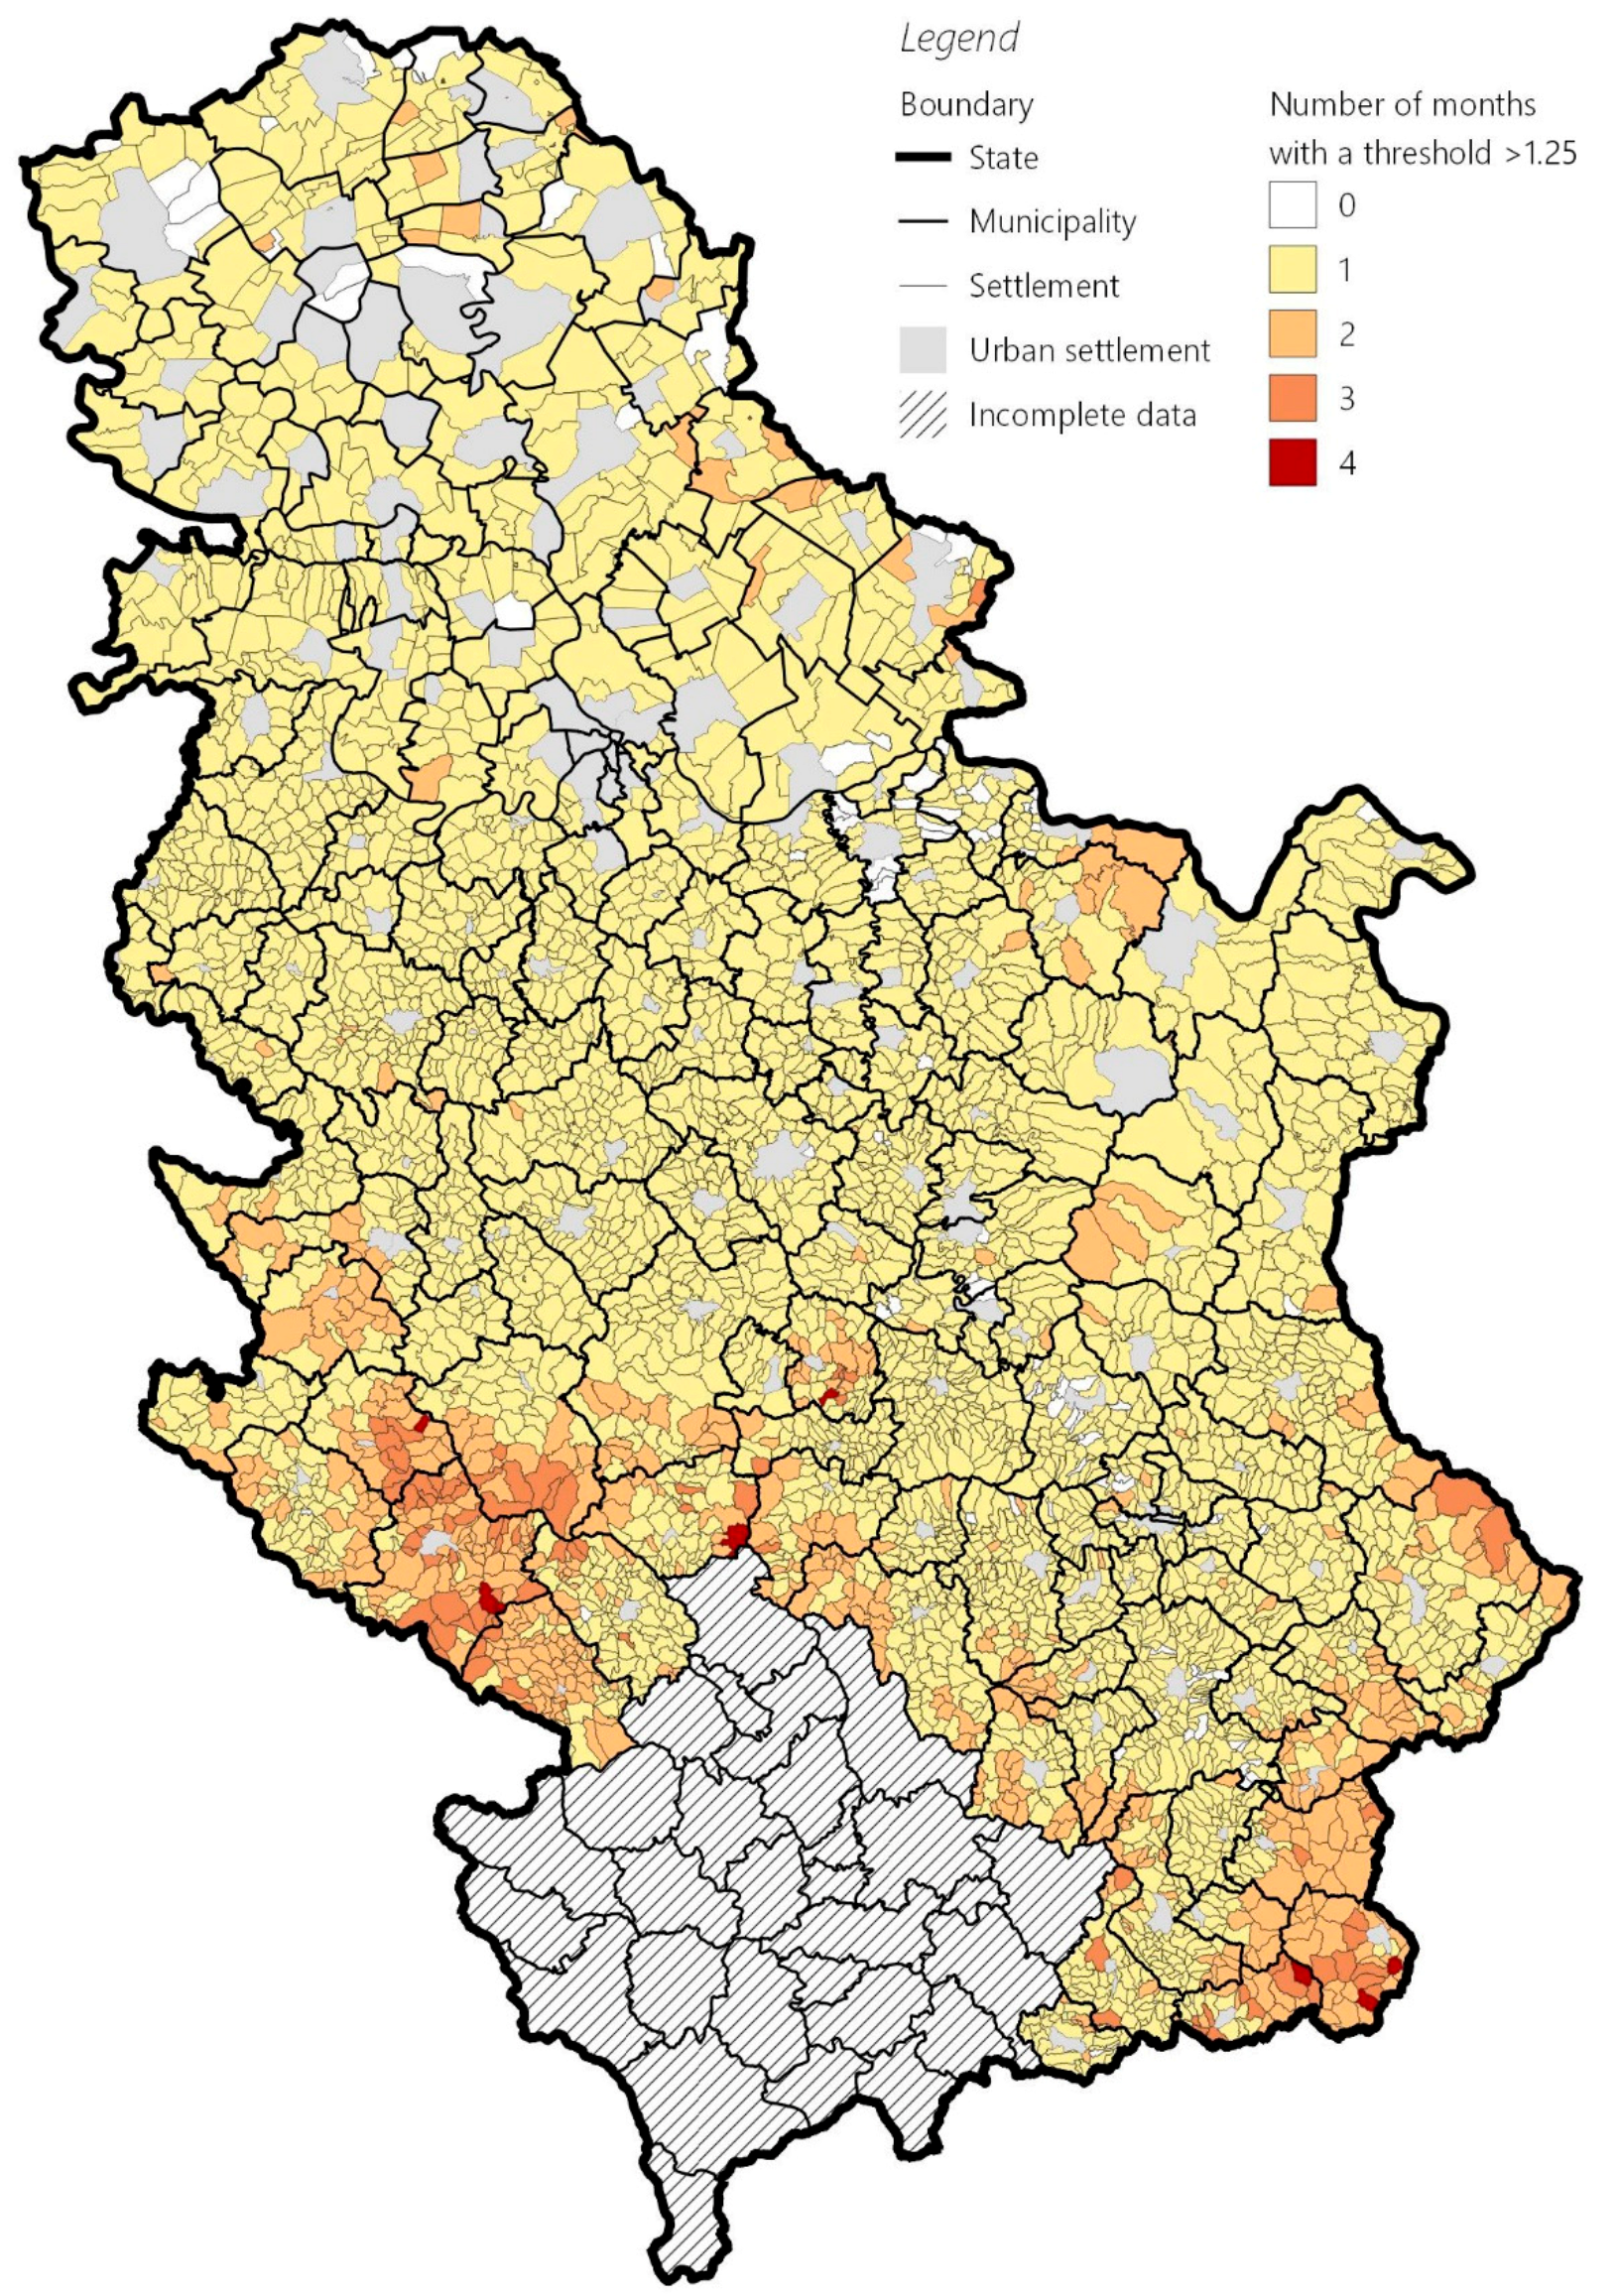
  • Creation of a seasonality coefficient (Scos) as an indicator of area activation based on Sum of Lights (SOL). The SOL represents the sum of radiance for studied spatial units, i.e., settlements as well-selected tourist places. The seasonality coefficient for each month of the year (Scosm) was calculated as a ratio of SOL for that month (SOLm) and monthly average in the studied period (SOLaverage·m1-m12). The obtained values higher than one mean more emitted lights, i.e., an increase in ambient population compared to average conditions within a year. Exploring obtained Scosm values, the threshold of 1.25 was set up to single out settlements with the highest intra-annual variability, i.e., the largest number of months during the year when the emitted NTL are higher by 25% compared to average conditions. To show spatial patterns in seasonally activated rural areas, the obtained results are mapped;
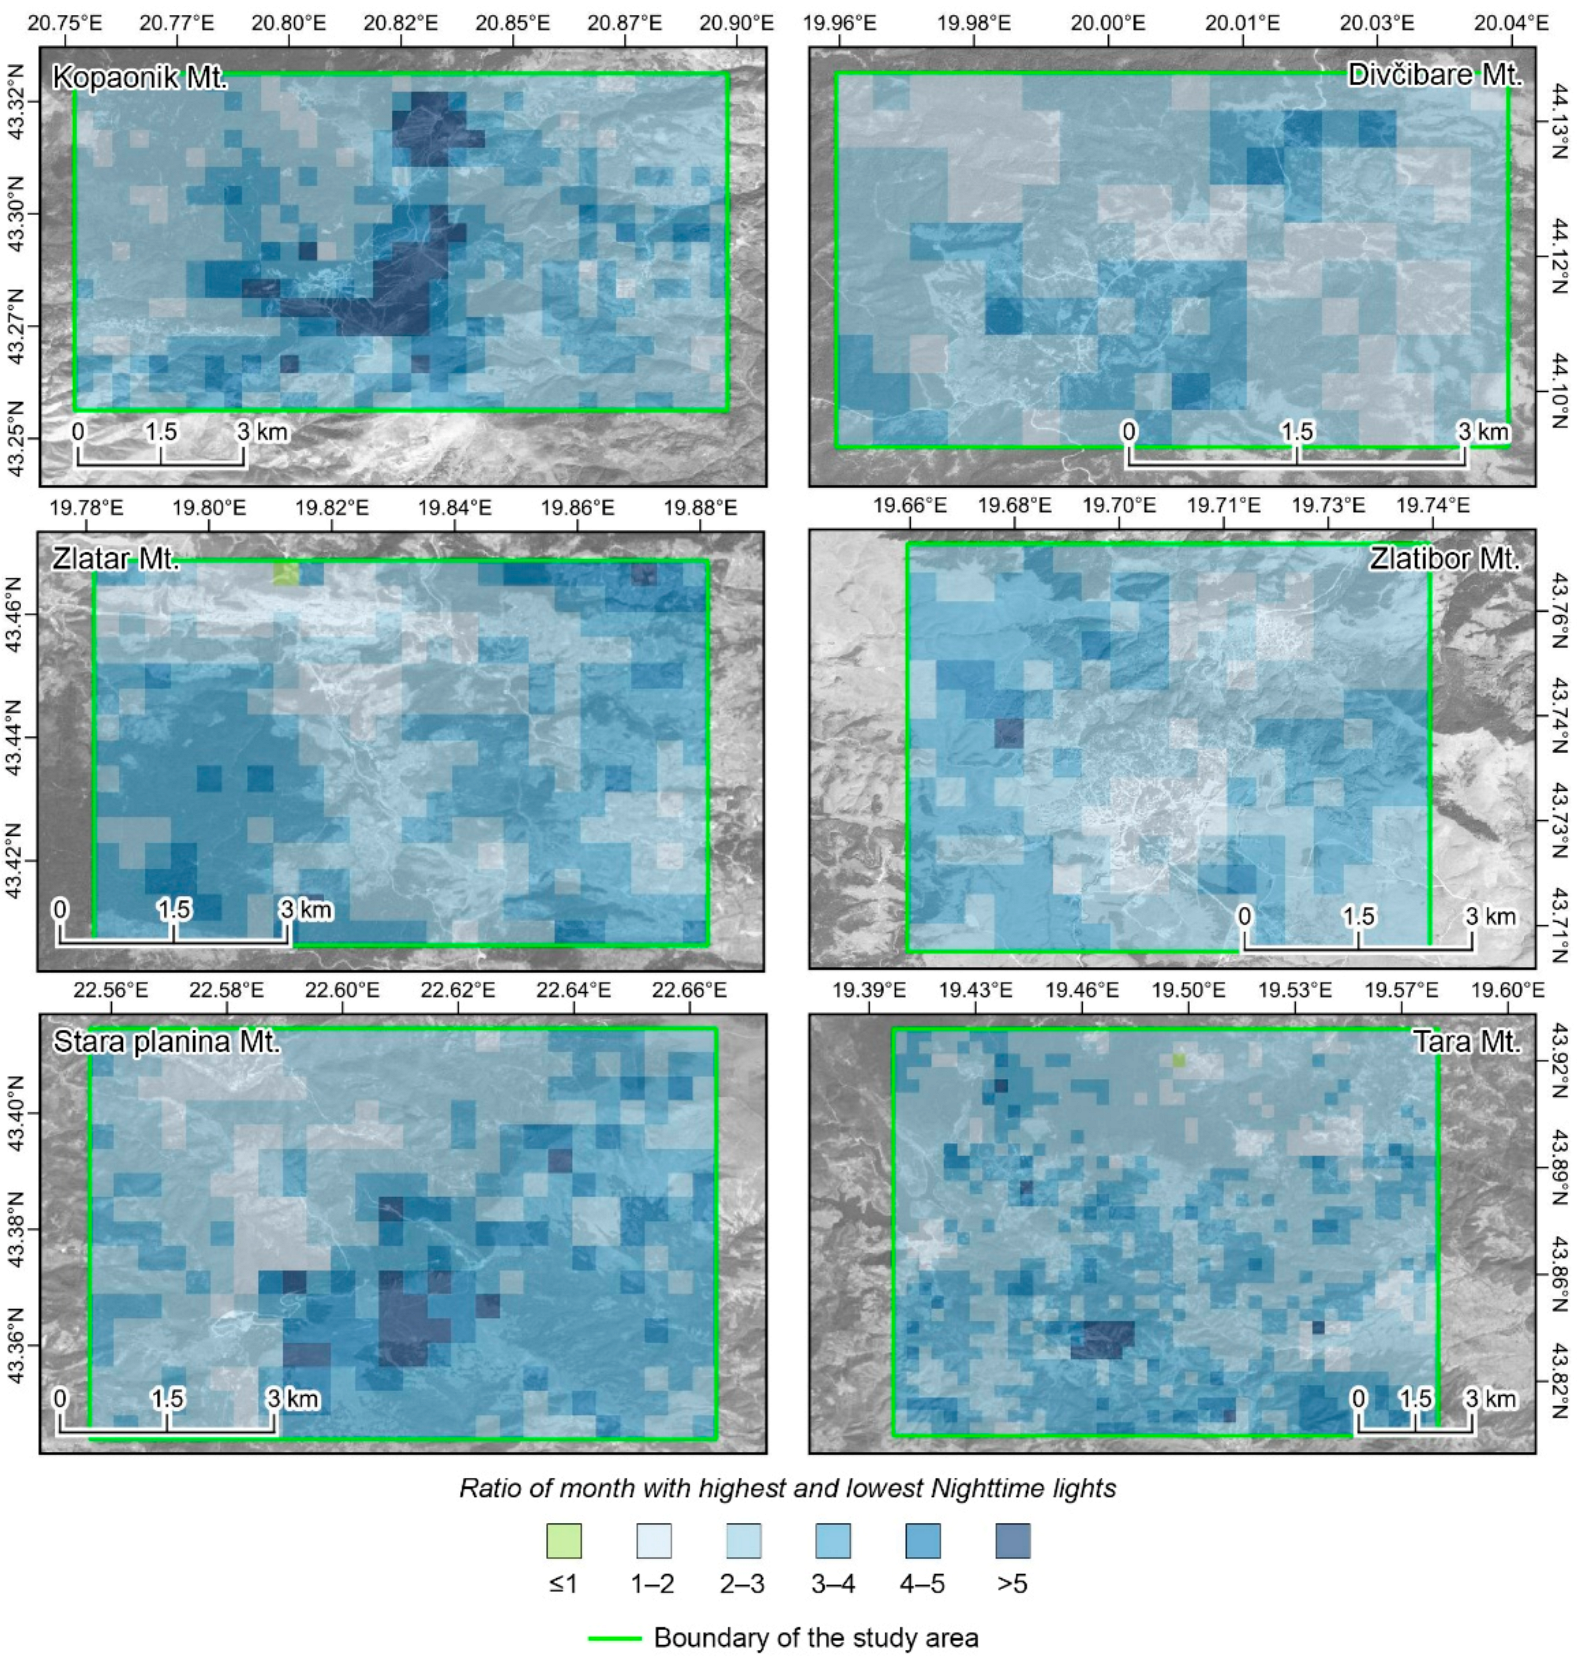
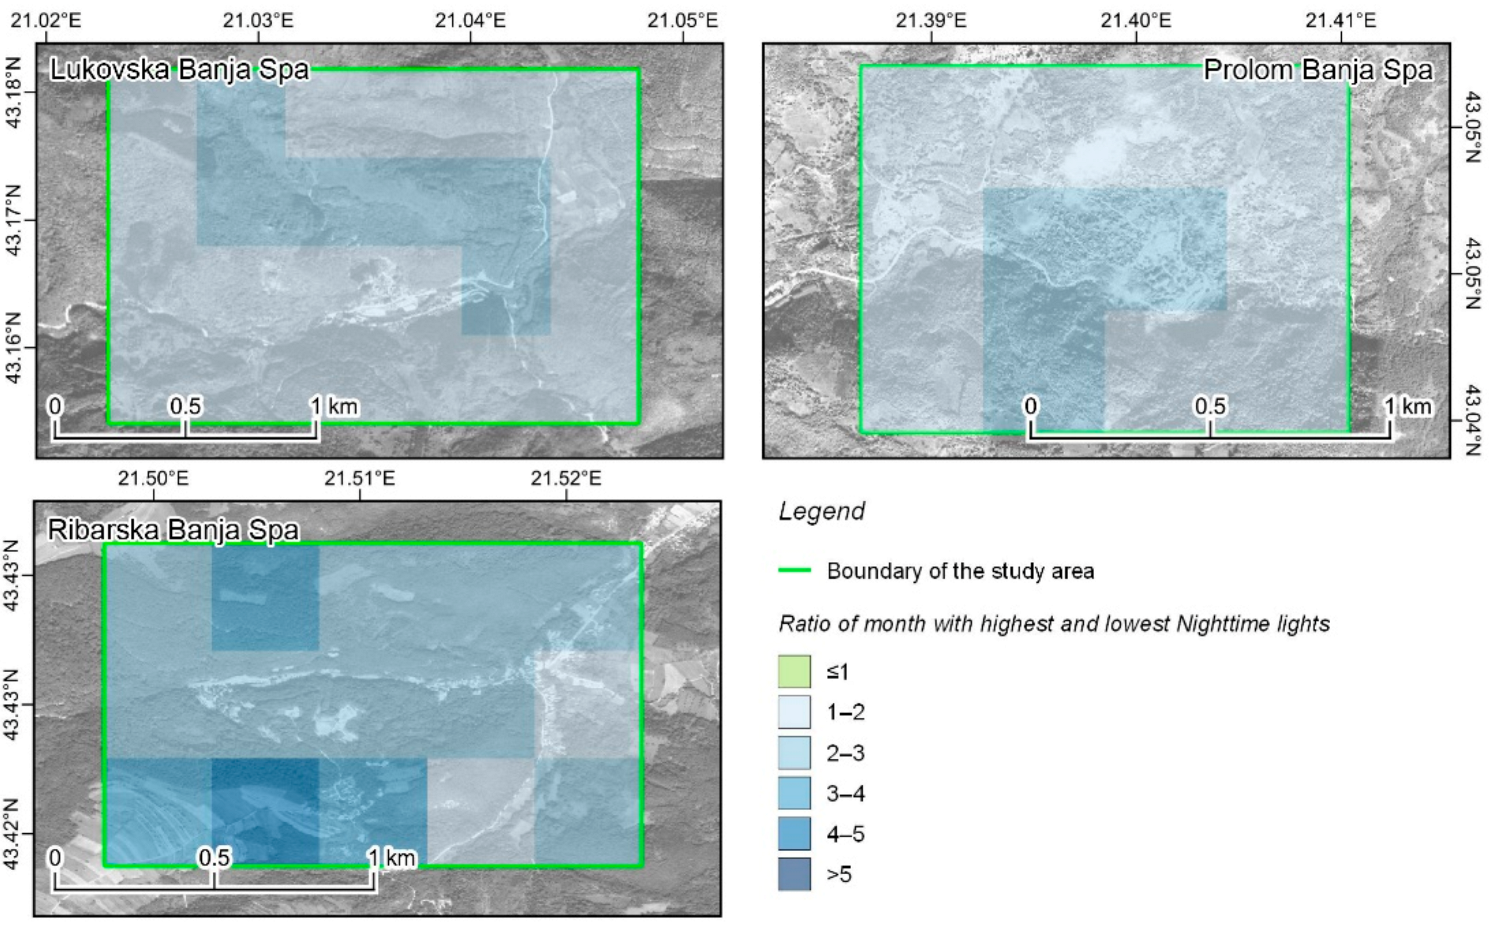
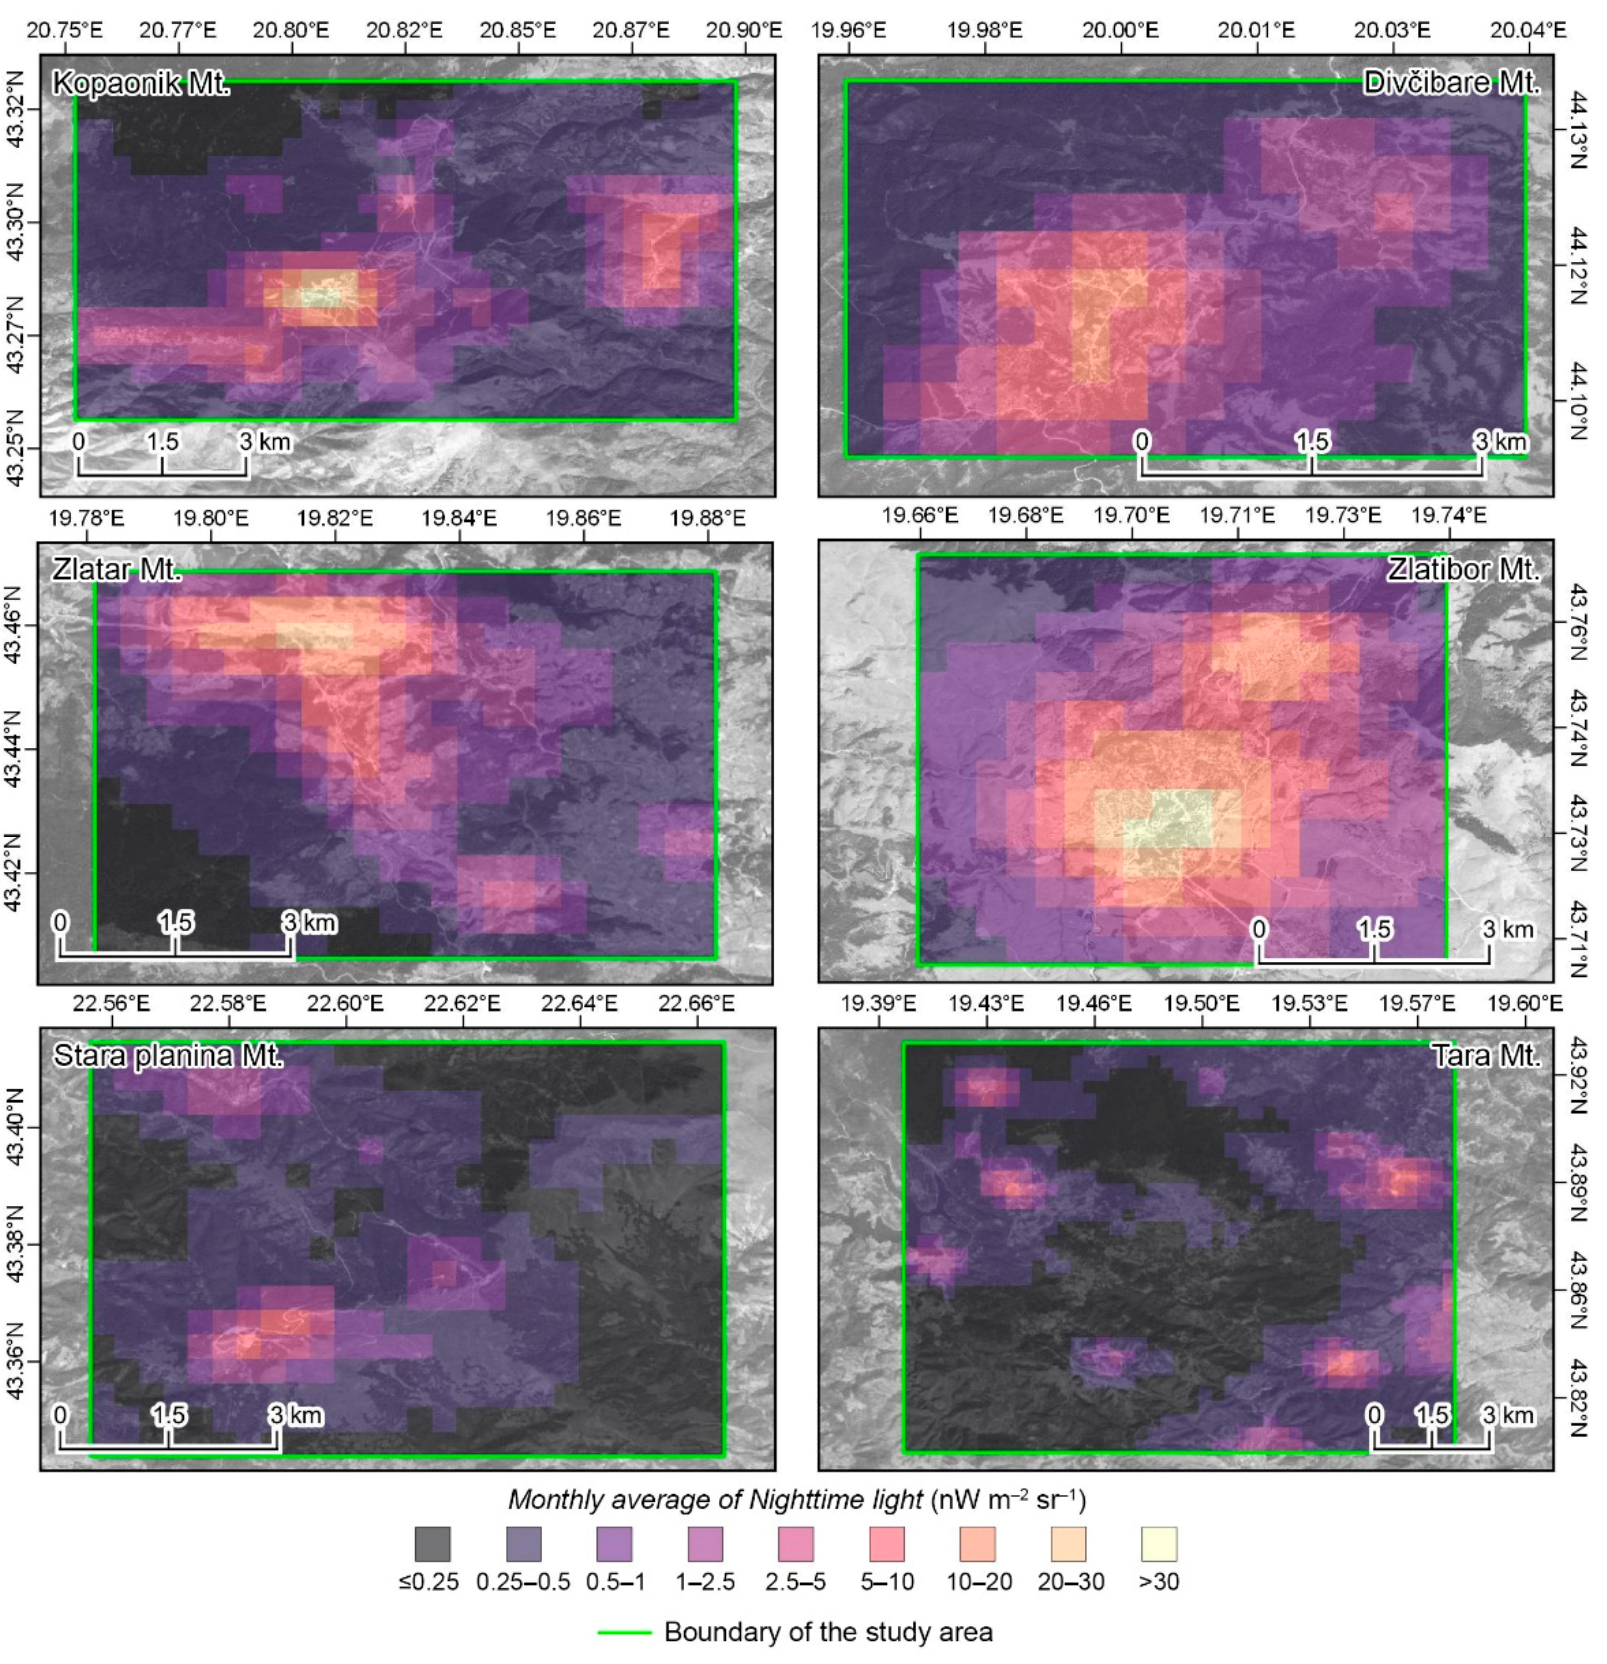
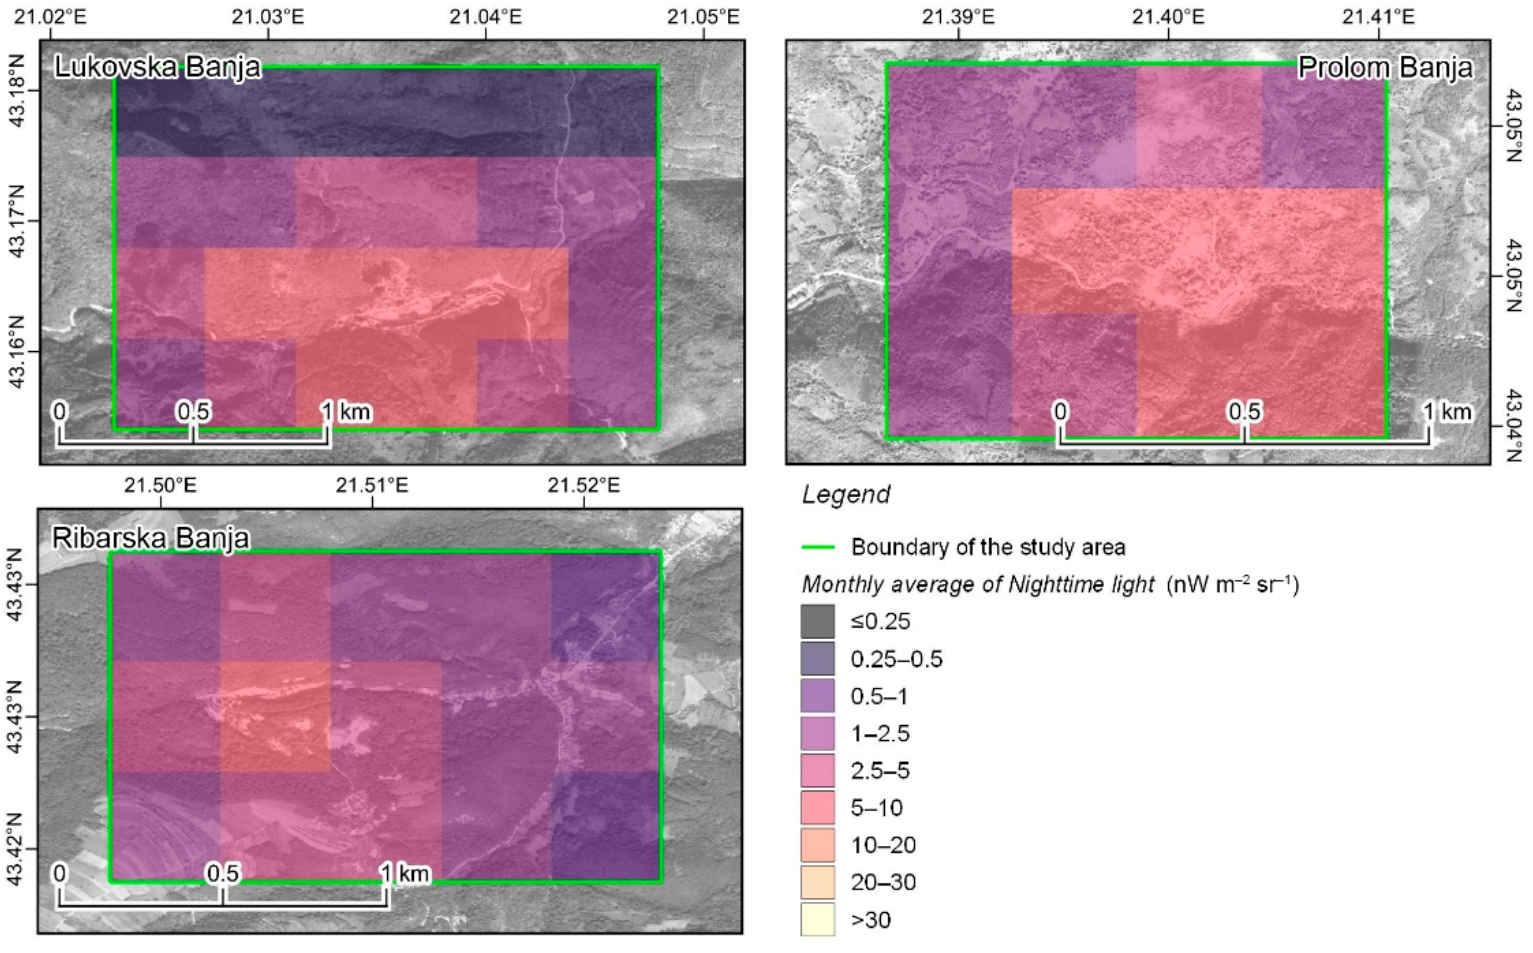
  • Case studies for selected tourist places. This kind of analysis was performed on the pixel level to get more detailed insight in spatial-temporal variability in activation for selected destinations. Additional indicator was created as the radiance ratio between the month with highest (SOLmmax) and lowest SOL (SOLmmin) within a year. This allows detection of areas within studied touristic destinations with the highest seasonal activation.

3.3. Seasonality Coefficient Based on Official Statistical Data (Scot)

The overall seasonal activation of rural areas was determined based on the obtained Scos values. Furthermore, the areas with a pronounced seasonality were selected and additional analysis was performed to calculate the seasonality coefficient based on official statistics. The most intensive changes are identified in tourist and weekend settlements, where the population is occasionally increased, as well as in rural areas with intensive agricultural production. Available data from official statistics represent the total number of registered tourist arrivals, which could not provide data regarding second-home residents, agricultural seasonal workers, visitors, etc. Following the pattern of spatial changes during different seasons (months), tourist destinations for which official statistics registered tourist traffic, on monthly bases, were taken as control points as the most representative seasonally activated localities in rural areas. On the other hand, data for labour movements in agriculture are possible to observe only through census data (Census of Agriculture 2012); however, these data do not have adequate temporal dimension to “catch” seasonal changes during the year. To calculate the seasonal coefficient based on official data, the monthly movement of the number of tourists, the total residential population, and number of domestic and foreign arrivals and overnight stays for selected tourist sites [88] were used. Tourist localities with urban character were excluded from the analysis while the mountain touristic places represented by the unique rural entity were encompassed by several settlements. Although spa centers are considered to be predominantly urbanized areas due to the accompanying infrastructure, in order to adhere to the same criteria of rurality, this paper excludes those spa settlements that are classified in the group of urban settlements according to the applied methodology which is in line with the statistical office methodology for urban-rural division. Other spa centers are considered as a part of the Serbian rural area.
As attractive destinations in rural areas, which expressed seasonal activation, 21 spa and mountain tourist destinations were observed. The seasonality coefficient based on official statistics was calculated under the assumption that tourists who visit selected settlements represent the so-called seasonal population that use the services and facilities of the area in some period of time. To calculate the seasonal population, the formula was followed:
P s = T ¯ m * d Dm ,
T ¯ m = 1 n i = 1 n T mi ,
where components are: Ps—seasonal population; Tm—number of tourists per month; d—average length of stay per month; Dm—number of days in the month; n—number of years in the observed period (2015–2019).
Seasonal population Ps is represented by the total number of tourists with a minimum of one overnight [89]. Average tourist per month Tm was derived as the monthly average for the observed period for every month separately. Average length of stay d was calculated as the relation of the number of overnights and number of tourists for each month [89].
Afterwards, the seasonal coefficient was calculated based on the ambient population as users of the observed area at a certain moment of time. The ambient population was set in relation with the total resident population. Monthly seasonality coefficients were generated as [30]:
S cot = Ps + Pr Pr
where components are: Scot—seasonality coefficient of touristic areas, Ps—seasonal population, and Pr—resident population, where the total population of the studied areas (settlements) were analyzed.
The seasonality coefficient based on tourists’ number indicates deviations from the average monthly values, for a five-year period (Table 1). Observing the Scot values, two peaks have been noticed, winter and spring–summer peak, depending on the touristic places’ characters.

3.4. Intertwining of the Seasonality Coefficients

After the seasonality coefficient calculation, based on different data sets, the derived values were compared and Pearson’s coefficient correlation was carried out in order to determine the relation between these two seasonality coefficients—Scos and Scot. Diagrams of their relations were performed.

4. Results

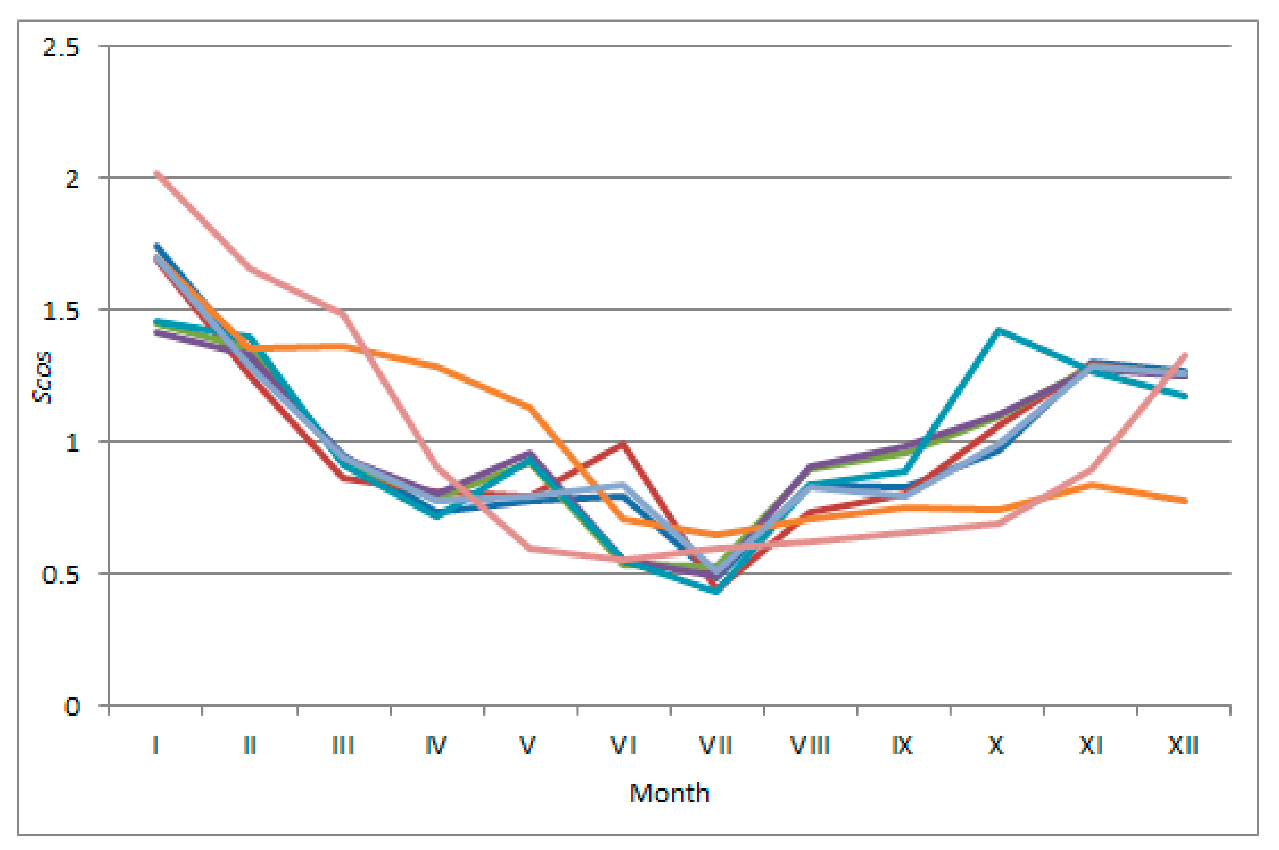
4.1. Seasonality Coefficient Based on Nighttime Lights (Scos)

The first step in detecting seasonality was performed by calculating the seasonality coefficient based on the monthly values of NTL data. Based on this parameter, 687 settlements (15.1% of total settlements in Serbia) were selected, which show a certain degree of seasonality, i.e., in which the obtained Scos value is higher than the established threshold—1.25 (Figure 1).
In this group, 587 settlements recorded a low seasonality distributed in two months during one year, which represents 85.4% within seasonally active settlements. This group of settlements is highly heterogeneous, in which it is impossible to identify certain spatial patterns of seasonality as well as the causes of their occurrence. As such, this group does not indicate representative seasonality of the rural areas, which led to their exclusion from deeper analysis; however, this group indicates the spatial spreading of the phenomenon seasonality on particular areas in Serbia (e.g., Zlatibor Mt., Stara planina Mt., Kopaonik Mt., Zlatar Mt., etc.) (Figure 1).
Significant variations in brightness during the year were recorded in 92 settlements (13.4%) within three months of seasonal activation, and eight settlements (1.2%) with four months of seasonal fluctuation. Considering that this is a more significant period of the pronounced seasonality, this group of 100 settlements in rural Serbia is segregated for further analysis.
The most intensive seasonality character was registered in the eight settlements located in the southern mountainous part of the country (Figure 1). Highest values of the coefficient are in the winter months (peak is in January and February), while the lowest values are related to the summer season (Figure 2). The largest seasonal fluctuations were registered in mountain tourist areas—Kopaonik Mt., Zlatar Mt., Goč Mt., Dukat Mt., then in nature reserves and transit border areas, as well, presented on the Figure 2 with orange, purple, red and blue line.
Significant seasonality in the use of rural areas is observed in settlements where higher values of the coefficient are registered for three months during the year, as well. This group of settlements is numerous and has a heterogeneous structure compared to the previous one, however, showing a certain rule of seasonal activation. The Figure 3 shows the trend of seasonality in this group of settlements (93), presented with different line colors. The seasonality peak is characteristic for winter months (January, February, December), while the decrease of seasonality is related to the summer season (Figure 3). The identified spatial patterns of seasonality that the previous group has shown fully correspond to this group as well, however, with wider territory coverage. So, the seasonality was influenced by tourist activity in the mountainous area—Kopaonik Mt., Zlatar Mt., Zlatibor Mt., Stara planina Mt., Goč Mt., Golija Mt., Vršačke planine Mt. and Dukat Mt., seasonal agricultural activities (Pešter Plateau), transit areas, nature reserves—Uvac, Pčinja, Jerma, etc., lakes—Zlatarsko jezero Lake, Vlasinsko jezero Lake, etc., and spa centers, as well (Figure 1). Some locations recorded the peaks during the spring months, which are related to excursion tourism in the lower mountain and accessible areas (Goč Mt., Vršačke planine Mt.), while the summer peak is noticed in places located near frequent infrastructure corridors, which is associated with transit tourism.

4.2. Seasonality Coefficient Based on Official Statistics (Scot)

The official statistical data recording the seasonal trends on the territory of Serbia are limited, since they relate to the most attractive and valorised tourist places. This refers to monthly fluctuations in the number of tourists within the mountain tourist areas and spa resorts. Based on that, the derived seasonality coefficient indicates deviations from the average monthly values, and highlights a problem which should be further studied.
Generally speaking, the seasonal coefficient values, related to a narrow data set on tourist trends, showed minor oscillations. However, they can be observed for certain limited areas. The seasonality coefficient values vary as a direct result of the number of tourist arrivals’ oscillations. Observing the spa tourist places in the rural area of Serbia, it can be noticed that the seasonal character is related to the summer season, when the highest coefficient values are recorded (Figure 4). For some spa centers, there are very high seasonality coefficients (Prolom Spa, Lukovska Spa, Ribarska Banja Spa, Gornja Trepča Spa) (Figure 4), while in others, the seasonality is fairly equal. Some of the spa centers have a weak tourist offer and a small number of visitors (Gamzigrad Spa, Rusanda Spa, Mataruška banja Spa), so no oscillations are detected. On the other hand, others, some spa centers have continuity in the number of visitors during the year (Palić Spa, Bukovička Banja Spa, Banja Koviljača Spa, Vrdnik Spa and Kanjiža Spa), where seasonal oscillations are negligible.
Tourist mountain areas have a more pronounced seasonality, which is especially emphasized for Kopaonik Mt., as the most important winter tourist center in Serbia. The seasonal peak is related to the winter months. Goč Mt., Stara planina Mt., and Divčibare Mt., which are smaller and less developed and equipped tourist centers, also showed significant seasonality. Some of them, like Goč Mt., Divčibare Mt., and Tara Mt., express continual higher values of the seasonal coefficient during the spring and summer months, as well, which indicates various visitors’ preferences and diversified tourist activities. The second peak has been clearly noticed for Kopaonik Mt. but is more pronounced compared to the other mountainous areas (Figure 5). Other mountain places record seasonality, as well, predominantly during the winter season, but with lower coefficient values (Figure 5). Likewise, some mountain places recorded uniform coefficients during the whole year due to the fact that they have continuity in tourist traffic, such as Zlatibor Mt., which is conditioned with a reputation as a mountainous summer–winter resort and is one of the most developed tourist areas [90], and tourist turnover has become more massive during the time.

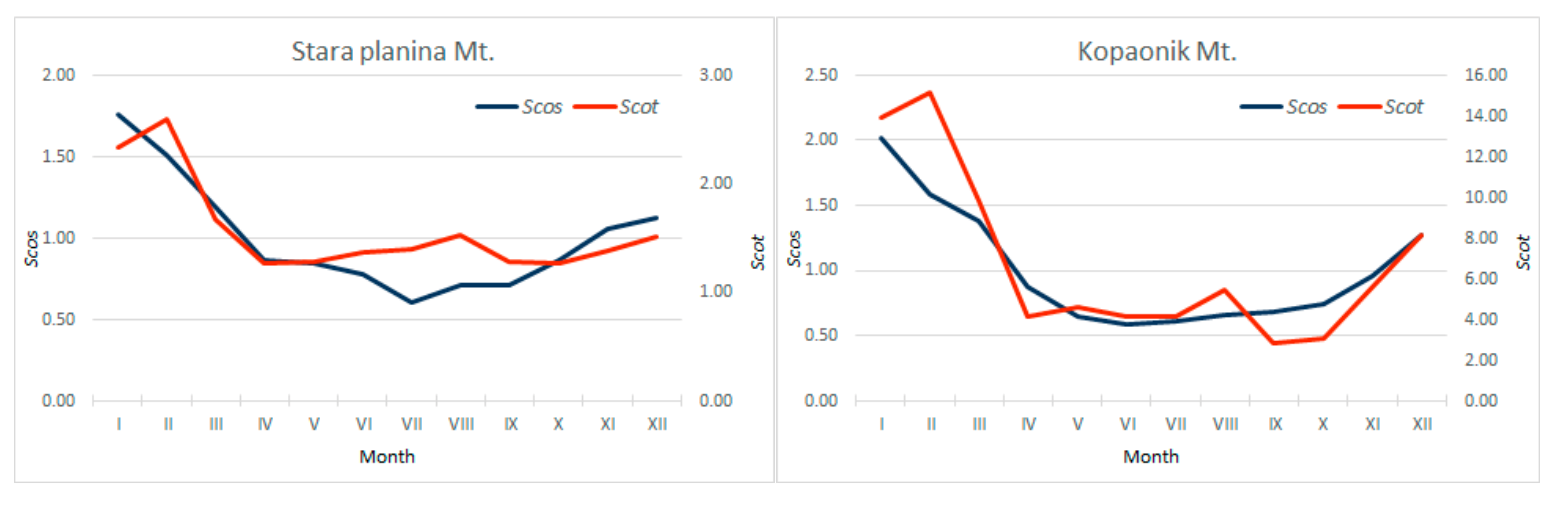
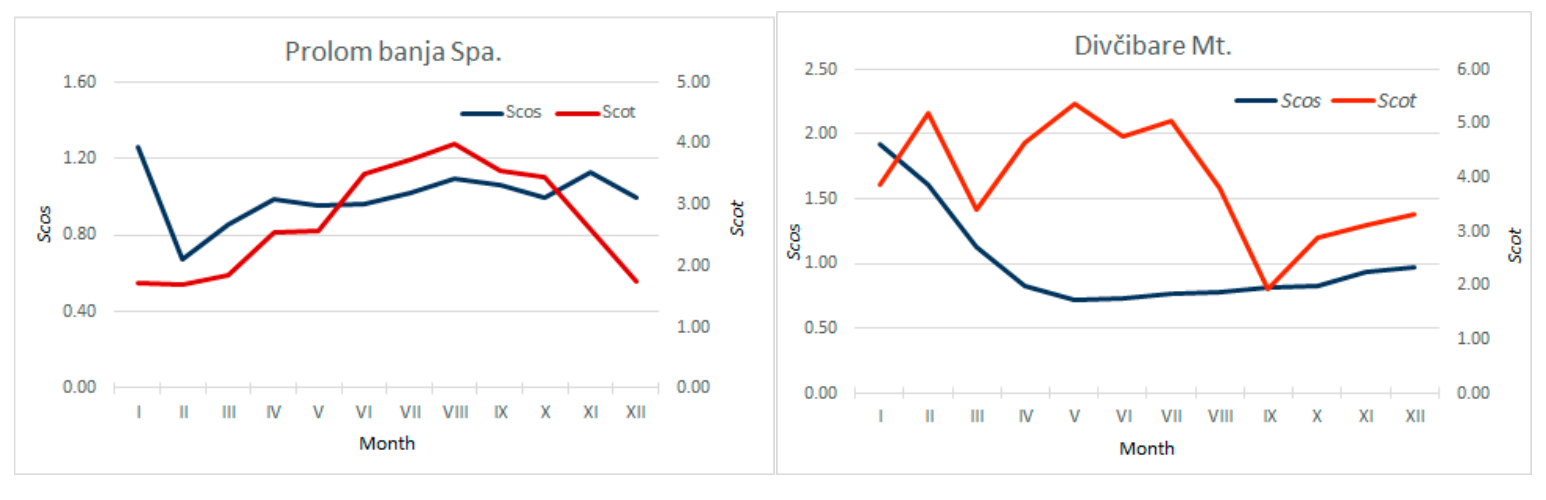
4.3. Intertwining of the Seasonality Coefficients

In order to determine the degree of correlation between the calculated seasonality coefficients—Scos and Scot—the seasonality coefficients for selected rural areas are intertwined (Figure 6). After performing the Pearson correlation, it was found that there is a statistically significant relation in places with more massive and specialized tourism and spatially limited occurrence of seasonality (R2 has values of 0.93, 0.86, and 0.26 for Kopaonik Mt., Stara planina Mt, and Prolom banja Spa, respectively), while in other places, the statistical significance decreases. The positive and significant correlation between two applied methods justified the use of NTL as a proxy for investigation of the seasonality phenomenon.

4.4. Case Study of the Rural Areas Seasonal Activation Based on the Tourist Activity

Six representative mountain areas and three spa centers are singled out, in order to better understand annual seasonality distribution on a monthly basis (Table 2). The observed mountain places are the most visited destinations. However, based on the Scos seasonality coefficient, it can be noticed that the increased activation in these places varies during the year. The winter season is the most intense in both types of observed places, especially the month of January. On the contrary, for observed mountain places, during the summer period, a decrease of values is detected. However, in mountain areas with less developed and narrowed tourist offers, a slightly higher intensity of NTL is registered (e.g., Divčibare Mt., Zlatar Mt., Tara Mt.), which indicates the possibility of activation in those months, as well (Table 2).
Seasonality expressed by the variation of NTL is especially pronounced in the area of Kopaonik Mt., where the highest values of the coefficient are recorded. Likewise, pronounced seasonality is present in the central part of the Kopaonik Mt. where the activity is highest and which influenced the development of secondary tourist sites (Figure 6). The NTL’s intensity gradually decreases, distancing from the central part. On the other hand, Zlatibor Mt. has developed a wider mountain area with high-intensity activity, as a result of the strong and diverse tourist offerings which led to the expansion of the tourist season, or vice versa. It is noticed that enhanced activity is provided along the access roads and in the area of weekend settlements, which indicates the influx of population in the observed period. A similar phenomenon is observed in Stara planina Mt., Zlatar Mt., and Divčibare Mt., where the spread of the phenomenon is registered, but with lower intensity of NTL. The weakest seasonality and activation of rural areas is recorded in Tara Mt., where there is a polycentric and dispersed spatial pattern of rural settlements identified, but insufficient for the integration of the surrounding area (Figure 7).
However, the findings that illustrate the part of the rural area that is actually most activated during the five-year period are interesting. These results were obtained based on the ratio of the month in which the highest value of NTL intensity was recorded (January) and the month with the weakest radiance for selected cases. When it comes to mountain tourist areas, the same pattern of spatial changes has been identified. The central part of the mountain areas is exposed to the weakest changes in intensity in all cases. This is especially noticeable in Kopaonik Mt., Zlatibor Mt., Zlatar Mt., and Divčibare Mt. (Figure 8). This could be explained with the fact that the central parts of the observed areas are most densely built and with a highest concentration of tourist facilities, population, activities, and complementary functions, which have a constant radiance throughout the year. The high correlation between the intensity of NTL and infrastructure and urban fabric has been indicated by previous research [61,89,90,91,92]. On the other hand, the area outside the central core is exposed during the year to the largest seasonal fluctuations in terms of radiance intensity, which is related to the presence of the seasonal population in that area. Activation of these areas indicates the spread of primary tourist activity that has a seasonal character [90].
The seasonal character of spa centers is less pronounced. The peak also occurs in January, but slightly higher values of the seasonal coefficient are registered during the summer, which is related to the spa season in Serbia (Table 2). The most intense seasonality character expresses the Ribarska Banja spa resort. Generally speaking, in such places, the intensity of NTL is less intense (Figure 9). A somewhat more significant manifestation of the phenomenon in the spatial sense can be related to Prolom Banja spa, while the other two are more of a local character.
On the other hand, observing the relation between the months with the highest and lowest radians in the observed period, it is clear that Ribarska Banja spa has the most pronounced seasonal character, as shown by the values of the Scos seasonality coefficient. In the other two spa centers, seasonal activity is observed along the access roads, which indicates an increase in activity and the influx of seasonal population, given that private accommodation facilities are located in these accessible zones (Figure 10).

5. Discussion

In this research, an innovative approach based on satellite images of NTL was used, as an additional proxy for detecting seasonally activated rural areas. The obtained results showed that the cause of the most intensive seasonal movement of the population, i.e., seasonal activation of rural areas, is predominantly the tourist activity. Considering that mountainous rural areas with peripheral geographical position were identified as attractive for seasonal use (Figure 1), the role of tourism proved to be important in awakening the corpus of non-agricultural rural activities to maintain the vitality of these areas. This is in accordance with the postmodern tendencies that the development of rural areas should not be based only on agriculture, but also on other non-agricultural activities, primarily on tourism and recreation, as well as information and technology skills and services [93]. It implies the whole range of activities that integrated development of the area through common actions with other factors, such as good village infrastructure amenities, sustainable organization of public facilities and services, diversified rural economy, etc.
The concept of “new rural economy”, expressed through the model of multifunctionality, is based on providing new services by rural communities, primarily in the field of tourism and recreation [94]. This has both positive and negative implications, especially in the context of tourism seasonality. Tourism contributes to employment growth, but mainly it is seasonal or part-time work [22,95,96], which means a disproportion in employment demand [38]. During the peak season, employment is growing, absorbing the seasonal labour not just from the local community, but elsewhere, which could be a major problem, while in the off-peak season, it is the opposite situation [38]. Economic implications are related to low income during the off-peak periods and survival opportunities, which BarOn [97] called “seasonal loss”. Environmental implications are most pronounced during the peak season as a consequence of tourist concentration and the potential utilization and endangerment of fragile environments [38,41].
Current rural development in Serbia is defined as one of the main economic priorities [98], where rural tourism has an important role. Likewise, in tourism legislation, it is recognized as the most important for overall tourism development, as well as the most comprehensive solution for most tourist destinations in Serbia [99]. However, inherited conditions from previous decades contributed to low competitiveness of rural tourism in the international travel market [98]. Modern development of rural areas strives toward rural economy diversification and new context of rural areas [10,28,99].
In Serbia, most pronounced seasonal variations in activating the studied rural areas are related to winter tourism, excursion, and transit tourism. Likewise, the authors’ assumption is that second-home tourism in the form of private accommodation services occurs in seasonally activated areas, but with fewer pronounced changes. This is not visible due to the lack of official data and surveys, which is similar to the situation occurring in other countries as well, where data collected from hotels and other official registered facilities are considered as being most reliable and comparable due to the required register of each guest [40].
Obtained results indicated different seasonality types of the rural areas in Serbia, which is directly related to the scope of the tourist offer and duration of the tourist season. The general conclusion is that registered seasonality fluctuation, in the territory of Serbia, is low to moderate, pronounced only in several tourist areas that attract massive tourist movements. This conclusion is confirmed with results obtained in other seasonality research of tourism seasonality in Serbia, regardless of different applied methods [48,52].
On the other hand, a wider picture that implies comparison with the results from the neighboring countries showed a similar seasonality pattern—low overall seasonality (e.g., Macedonia [51]; however, with high seasonal activation concentrated in particular areas, such as coastal area in Croatia [39], spa centers in urban areas in Hungary [49], and spa centers with an extended tourist season in Romania [100].
In Serbia, the longest seasonal activation was detected in mountainous areas, characterized by mass tourist visits, such as with Kopaonik Mt., the largest mountain and ski destination. The most intensive seasonality in mountainous areas is registered during the winter season. In this group, there are areas with limited and less pronounced touristic offerings, but with obvious growing tendency in certain months (Stara planina Mt., Goč Mt., Golija Mt., Zlatar Mt., Tara Mt., Dukat Mt., Divčibare Mt., etc.). Areas with a less pronounced or shorter active period during the year are heterogeneous, but in the function of tourist activity, as well. Apart from winter peaks in the wider mountain area, which is associated with highly active mountain ski centers, seasonality occurs in some areas during the spring, and in the summer months, as well, however, less pronounced. Such winter tourist centers developed dual peak seasons; besides the winter snow season, an additional spring–summer season has emerged due to the promotion of mountain nature and sport activity holidays [39,48]. This season provides more diverse tourism opportunities and could represent a higher potential compared to the winter season [101].
Areas with lower seasonality, in terms of activating rural areas during the year, were registered, as well. It is expressed in less attractive tourist places, which refer mainly to spa centers with specialized tourist offerings and traffic accessibility, or smaller mountain areas (Rudnik Mt., Mokra Gora) and lakes (Zlatar Lake, Vlasina Lake, Bela Crkva Lake, etc.), natural reserves (Uvac River, Jerma River), and some transit and agricultural areas. This group has the characteristic low spring–summer seasonality, which caused their mainly local character. This is associated with a highly pronounced tourism summer trend that is oriented toward seaside destinations (Greece, Montenegro, Croatia, Turkey, etc.). The analysis of the selected spa centers confirmed the assumptions that specialised offers attract a mostly targeted group of tourists in a specific time of the season (health tourism, spa, and wellness) and remain with local character. Other studies highlight the conclusion that spa centers in Serbia still do not have a high degree of seasonal concentration of tourists [52], however, with a noticed prolonged spring–summer season between May and November [100].
As an addition to the examples of areas with high and low seasonality, the Zlatibor Mt. is distinguished with completely different results, which indicates a balanced annual tourist fluctuation. Zlatibor Mt. has diverse tourist offerings that attract massive tourist movements during the whole year, which enable the transformation of this mountain into a leading tourist center in Serbia. The summer season has a wide offering and accordingly great visit rate [100], as well as its reputation as a business and conference center [102,103]. During the winter season, Zlatibor has characteristics of a smaller ski center, which depends on climatic conditions, but it also has a wide range of other opportunities and tourist activities.
The spread of the seasonality phenomenon from the seasonal “epicenter” could be observed not only in a spatial aspect, towards awakening the surrounding settlements, but also from the aspect of diversified offerings, which affect the causes and character of seasonality during the year. The first aspect is especially pronounced in the mountainous areas such as Kopaonik Mt. and Zlatibor Mt., as well as the Stara planina Mt. Their tourism development has caused the expansion of accommodation capacities, and creation of a more diverse offer and services, fostering construction and use of infrastructure. Based on results of aforementioned case studies, spatial extension of rural area activation has been noticed during the year. Two models have been identified: (1) gradual extension of activity during the peak season in a wider mountain area toward the access roads and in the area of weekend settlements, which presents seasonally secondary tourist sites; (2) polycentric spatial development of tourist sites during the season peak, but with lower intensity. These models of seasonal activation are related to the housing pattern and accommodation units. High activity of central parts is related to the hotel complexes and good infrastructural equipment that are remarkable for valorised mountain areas (Kopaonik Mt., Stara planina Mt., and Zlatibor Mt.). On the other hand, polycentricity and diverse seasonal activation of smaller mountain areas are related to the traditional construction of second-homes that are occasionally used by non-residents. The second aspect is related to the tendency to extend the tourist season through activity diversification in order to answer the demands and preferences of a wider group of tourists [2]. Mountains with lower altitudes (Divčibare Mt., Goč Mt., Zlatar Mt.) show a more pronounced spring and summer peak, due to various factors: climate conditions (less share of snow), better infrastructure accessibility, vicinity of larger urban centers, traditional second-home tourism, etc. On the other hand, areas such as Kopaonik Mt. and Stara planina Mt. are characterized by peripheral geographical position, traffic isolation, extreme rurality, and better climate conditions, which induce monofunctional orientation toward winter tourism (ski resorts) with new tendencies of widening touristic offerings (hiking, camping, mountain biking, trekking, excursions, conferences, gastronomy, etc.) [48,104].
As well as the above-mentioned characteristics and spatial and temporal patterns in Serbia, it is obvious that seasonality driving factors are not natural conditions (climatic and environmental factors), tourist offerings and development of tourist centers, nor accommodations and infrastructure. As Ferrante et al. [40] highlighted, the main driving factors of seasonality are institutional (school and work timetable) and socio-cultural factors. However, in tourist centers that are narrowly specialised for certain activities or attract certain population groups, e.g., middle-aged people and elderly, the driving factors could be changed.
The possible expansion of seasonality research provides a variety of opportunities with different research objectives. It could be an in-depth study of hidden elements and structures within seasonality in tourism that cannot be detected by the methods used, traditional or alternative, to determine daily population movements and their activities or tourists in private accommodation, as well as seasonal labor, or other subjects of rural areas activation, as well as determination of their importance. On the other hand, as environmental pressure is already specified as an important stressor in rural areas during seasonality peak, it would be of great importance to identify and measure it, especially for tourist mountainous areas in Serbia, where seasonality is recognized as a large problem. One of the limitations of the used model is related to its application in rural areas. The applied method has limited capability to identify and monitor movement variety, such as daily circulation. For that reason, some authors suggest additional methods to complement results obtained by remote sensing, such as social sensing [46], people-centric sensing [105], urban sensing, or VGI for geographical data [61,106]. Comprehensive analysis based on intertwined results of different methods could provide deeper insight into the phenomenon of seasonality in order to better understand it and mitigate it.
Seasonal activation of rural areas is a phenomenon that tackles a wide area of legislative and strategic framework. It should be observed through the various spheres of social, economic, and spatial development, as well as at different government levels [99]. The rural issue, in the Serbian legal and planning framework, is conceptualised with the National Strategy for Rural Development and Agriculture and the Spatial Plan of the Republic of Serbia in order to support competitiveness and encourage integral and balanced spatial development. The phenomenon of seasonality in aforementioned documents is observed through the seasonality in agricultural production, on one hand; and the seasonal settling pattern reflected by the occasional use of residential and economic facilities in rural areas, on the other. The economic aspect of the seasonality is more pronounced in the segment of tourism development (Master Plan for Sustainable Development of Rural Tourism, Strategy for Tourism Development), labour market, and sustainable development (National Sustainable Development Strategy). It is focused on balancing income during the year, occupancy rate of the accommodation, employment and seasonal labor market, performance of hospitality firms, balancing of infrastructure utilization, prolongation of the stay, encouraging activation of the off-season, diversity of tourist offerings, destination choice, etc. [41,52]. The seasonality predictability allows policy-makers, businesses, lenders, and investors to anticipate and minimize its impacts [39].
In this regard, the seasonality policy implications could be treated dually—positive and negative ones. Positive implications could be observed within general spatial development of rural areas, mitigation of the depopulation process, encouraging vulnerable group participation (women, elderly, etc.), achieving economic vitality, and social inclusion [48,107]. However, the negative impact of seasonality is emphasised. It is reflected through economic factors (employment, capacity utilisation, entrepreneurship success, etc.) related mostly to the off-peak season, [38,97]; environmental and social impacts (increased pressure, wildlife disturbance, pollution) during the peak season [38]. In that sense, although seasonality and its effects can be both positive and negative, it must be approached comprehensively through different levels of the legislative and planning framework. Strategy implementation and the spreading of tourism, activating the off-season period, and developing a more effective counter-season depends on involvement of the public and private sector, DMOs, policy-makers and their partnerships, as well as it should be treated in strategic documents [40].

6. Conclusions

Conducted research contributes to better understanding of seasonal changes in fluctuations of people and activities within rural areas in Serbia in the period of 2015–2019. These changes showed a pronounced temporal sensitivity indicating the appearance of seasonality, a phenomenon which contributes to seasonal activations or rural areas. The main identified driving factor is tourist activity. The applied methodology made it possible to study the seasonality, extent, and intensity of the influence that tourist activity has in rural areas.
Extensive experience of the scholarly community has already confirmed successful use of NTL in various research fields, which has contributed to methodological simplification for verification of NTL as a useful and accurate tool in our research and has enabled full capacity utilization that this approach provides, as well. Accordingly, the opportunity to detect and monitor seasonal variations within various temporal and spatial frames is applied, which enables a good connection and upgrade of the applied method based on traditional statistical data. NTL data are complementary to traditional statistical data, but are, however, more temporally and spatially sensitive.
The obtained results of the conducted research, as well as their perception in the broader context of the rural areas and tourism activity as their main user, indicate:
  • The proposed method is novel and it encourages the identification of the seasonal activation of rural areas with different purposes. We proposed a framework devised to detect and map seasonally activated rural areas.
  • Despite limitations and shortcomings, NTL imagery is still one of the most widely used tools in quantitatively evaluating socioeconomic systems; also, from the correlation analysis, it can be assumed that the model works better for the specialized tourist areas. This relationship is stronger in mountain tourist areas during the winter, where there is a peak in touristic activity. It seems that the association between touristic activities and NTL, although evident, is not homogeneous in both spatial and temporal terms;
  • According to the obtained results, the most seasonally activated rural areas in Serbia have been detected. They are represented by mountain, highly valorized touristic areas, such as Kopaonik Mt., Divčibare Mt., Stara planina Mt., as well as areas with high tourist potentials, like Zlatar Mt., Goč Mt., Golija Mt., etc.; spa centers; nature reserves—Uvac, Jerma, Pčinja; lakes—Zlatarsko jezero Lake and Vlasinsko jezero Lake; as well as some transit areas and areas with significant agricultural resources.
  • The seasonality peak is registered during the winter season (for January and February), with a tendency of growing seasonal activation in the spring and summer periods (transit areas, Goč Mt., Tara Mt., Divčibare Mt., etc., lakes and spa centers).
  • Only one destination, Zlatibor Mt., has developed diverse tourist offerings, which has enabled a balanced tourist fluctuation on an annual basis and thus without pronounced seasonal peaks.
  • The results of this research confirmed the assumption that NTL could be used as an accurate and significant proxy for investigation of socio-economic processes and related phenomena.

Author Contributions

Conceptualization, M.D., M.P. and G.S.; formal analysis, M.D., M.P., G.S. and D.D.; investigation, M.D. and M.P.; methodology, M.D. and M.P.; resources, M.D., M.P. and V.K.K.; software, G.S.; validation, G.S.; visualization, G.S. and D.D.; writing—original draft, M.D. and M.P.; writing—review and editing, M.D. and M.P. All authors have read and agreed to the published version of the manuscript.

Funding

This research received no external funding.

Institutional Review Board Statement

Institutional Review Board Statement is not required for this paper in Serbia.

Informed Consent Statement

Informed consent was obtained from all subjects involved in the study.

Data Availability Statement

Data available on request due to restrictions.

Acknowledgments

This paper relies on the research project “Remote detection of (de)population processes in Serbia”, implemented with the financial support of the United Nations Development Programme (UNDP) in Serbia, United Nations Population Fund (UNFPA), and Deutsche Gesellschaft für Internationale Zusammenarbeit (GIZ). See web site www.depopulacija.rs (accessed on 30 December 2021).

Conflicts of Interest

The authors declare no conflict of interest.

References

  1. Schroeder, R.V.; Zimmerman, F.M.; Formiga, N. Growing Complexity in Rural Areas. Networking through Tourism and Recreation. Am. J. Rural Dev. 2016, 4, 15–23. [Google Scholar] [CrossRef]
  2. Woods, M. Rural Geography: Processes, Responses and Experiences in Rural Restructuring; SAGE Publications: Thousand Oaks, CA, USA, 2011. [Google Scholar] [CrossRef]
  3. Mardsen, T.; Lowe, P.; Whatmore, S. Introduction: Questions of rurality. In Rural Restructuring, Global Processes and Their Responses; Mardsen, T., Lowe, P., Whatmore, S., Eds.; David Fulton Publishers: London, UK, 1990; pp. 1–21. [Google Scholar]
  4. Hoggart, K.; Paniagua, A. What rural restructuring? J. Rural Stud. 2001, 17, 41–62. [Google Scholar] [CrossRef]
  5. Van Der Ploeg, J.D.; Renting, H.; Brunori, G.; Knickel, K.; Mannion, J.; Marsden, T.; Roest, K.D.; Sevilla-Guzmán, E.; Ventura, F. Rural development: From practices and policies towards theory. Sociol. Rural. 2000, 40, 391–408. [Google Scholar] [CrossRef]
  6. Hoy, F. Entrepreneurship: A strategy for rural development. In Rural Development Research: A Foundation for Policy; Rowley, T.D., Sears, D.W., Nelson, G.L., Reid, J.N., Yetley, M.J., Eds.; Greenwood Press: Westport, CT, USA, 1996; pp. 29–46. [Google Scholar]
  7. Cloke, P.J. Conceptualizing rurality. In Handbook of Rural Studies; Cloke, P., Marsden, T., Mooney, P.H., Eds.; Sage Publications: London, UK, 2006; pp. 18–28. [Google Scholar]
  8. Grčić, D.M.; Sluka, A.N. Global Cities; Belgrade University Faculty of Geography: Belgrade, Serbia; Faculty of Geography MGU “M.V. Lomonosov”: Moscow, Russia, 2006. [Google Scholar]
  9. Küpper, P. Abgrenzung und Typisierung Ländlicher Räume; Thünen Working Paper 68; Johan Heinrich von Thünen-Institut: Braunschweig, Germany, 2016. [Google Scholar] [CrossRef]
  10. Drobnjaković, M. Development Role of the Rural Settlements in Central Serbia; Geographical Institute “Jovan Cvijić” SASA: Belgrade, Serbia, 2019. [Google Scholar]
  11. Holmes, J. Impulses towards a multifunctional transition in rural Australia: Gaps in the research agenda. J. Rural Stud. 2006, 22, 142–160. [Google Scholar] [CrossRef]
  12. Murdoch, J.; Pratt, C.A. Rural studies: Modernism, postmodernism and ”post-rural“. J. Rural Stud. 1993, 9, 411–427. [Google Scholar] [CrossRef]
  13. Mardsen, T. New Rural Territories: Regulating the Differentiated Rural Spaces. J. Rural Stud. 1998, 14, 107–117. [Google Scholar] [CrossRef]
  14. Halfacree, K. Rural space: Constructing a three-fold architecture. In Handbook of Rural Studies; Cloke, P., Mardsen, T., Mooney, P.H., Eds.; SAGE Publication: London, UK, 2006; pp. 44–63. [Google Scholar]
  15. Radović, G.; Petrović, D.M.; Demirović Bajrami, D.; Radovanović, M.; Vuković, N. Can Proper funding enhance sustainable tourism in rural settings? Evidence from a developing country. Sustainability 2020, 12, 7797. [Google Scholar] [CrossRef]
  16. Kušen, E. Terminology of Rural Tourism; Institut za Turizam: Zagreb, Croatia, 2007; ISBN 978-953-6387-07-6. [Google Scholar]
  17. Sharpley, R. Sustainable rural tourism development: Ideal or idyll? In Rural Tourism and Recreation: Principles to Practice; Roberts, L., Hall, D., Eds.; CABI Publishing: Wallingford, CT, USA, 2001; pp. 57–70. Available online: http://sherekashmir.informaticspublishing.com/446/1/9780851995403.pdf (accessed on 23 November 2021).
  18. Short, B. Idyllic ruralities. In Handbook of Rural Studies; Cloke, P., Mardsen, T., Mooney, P.H., Eds.; SAGE Publication: London, UK, 2006; pp. 133–149. [Google Scholar]
  19. Demirović, D.; Radovanović, M.; Petrović, D.M.; Cimbaljević, M.; Vukašinović, N.; Vuković, D. Environmental and community stability of a mountain destination: An analysis of residents’ perception. Sustainability 2018, 10, 70. [Google Scholar] [CrossRef] [Green Version]
  20. Kayser, B. Culture, an important tool in rural development. Culture and Rural Development. LEADER Mag. 1994, 8, 1–4. [Google Scholar]
  21. McCarthy, J. Rural geography: Globalizing the countryside. Prog. Hum. Geogr. 2008, 32, 129–137. [Google Scholar] [CrossRef] [Green Version]
  22. Lopez-Sanz, J.M.; Panelas-Leguia, A.; Gotierrez-Rodriguez, P.; Cuesta-Vallino, P. Sustainable development and rural tourism in depopulated areas. Land 2021, 10, 985. [Google Scholar] [CrossRef]
  23. Lane, B. Sustainable rural tourism strategies: A tool for development and conservation. J. Sustain. Tour. 1994, 2, 102–111. [Google Scholar] [CrossRef]
  24. Hall, D. Rural tourism management: Sustainable options conference. Int. J. Tour. Res. 2000, 2, 295–299. [Google Scholar] [CrossRef]
  25. Radovanović, M. Methodological issues of the classification of rural settlements with special reference to Serbia. Zb. Rad. Geogr. Inst. Prir. Mat. Fak. 1965, 12, 97–110. [Google Scholar]
  26. Kojić, B. Architectural and urban transformation of villages in Serbia outside the provinces from 1945 to 1975. Bull. Serb. Geogr. Soc. 1977, 57, 15–30. [Google Scholar]
  27. Ćirić, J. Evolution and transformation of the terms village and villager. Bull. Serb. Geogr. Soc. 1991, 71, 73–76. [Google Scholar]
  28. Bogdanov, N. Small Rural Households in Serbia and Rural Non-Agricultural Economy; UNDP: Belgrade, Serbia, 2007; ISBN 978-86-7728-075-8. [Google Scholar]
  29. Stamenković, S.; Bačević, M. Geography of the Settlements; Faculty of Geography, Belgrade University: Belgrade, Serbia, 1992. [Google Scholar]
  30. Stathakis, D.; Baltas, P. Seasonal population estimates based on night-time lights. Comput. Environ. Urban Syst. 2018, 68, 133–141. [Google Scholar] [CrossRef]
  31. Gallent, N.; Juntti, M.; Kidd, S.; Shaw, D. Introduction to Rural Planning; Routledge, Taylor & Francis Group: London, UK, 2008. [Google Scholar]
  32. Krikigianni, E.; Tsiakos, C.; Chalkias, C. Estimating the relationship between touristic activities and night light emissions. Eur. J. Remote Sens. 2019, 52 (Suppl. S1), 233–246. [Google Scholar] [CrossRef] [Green Version]
  33. Baron, R.R.V. Seasonality in tourism—Part II. Int. Tour. Q. 1973, 1, 51–67. [Google Scholar]
  34. Smith, A.; Newing, A.; Quinn, N.; Martin, D.; Cockings, S.; Neal, J. Assessing the Impact of Seasonal Population Fluctuation on Regional Flood Risk Management. ISPRS Int. J. Geo Inf. 2015, 4, 1118–1141. [Google Scholar] [CrossRef] [Green Version]
  35. Graebert, M.B.; Wyckoff, M.; Bretz, L. Northwest Michigan Seasonal Population Analysis; The Land Policy Institute at Michigan State University: East Lansing, MI, USA, 2014; Available online: https://www.networksnorthwest.org/userfiles/filemanager/3292/ (accessed on 12 October 2021).
  36. Sutton, P.C.; Elvidge, E.; Obremski, T. Building and evaluating models to estimate ambient population density. Photogramm. Eng. Remote Sens. 2003, 69, 545–553. [Google Scholar] [CrossRef]
  37. Baron, R.R.V. The measurement of seasonality and its economic impacts. Tour. Econ. 1999, 5, 437–458. [Google Scholar] [CrossRef]
  38. Chung, J.Y. Seasonality in tourism: A review. e-Rev. Tour. Res. 2009, 7, 82–96. [Google Scholar]
  39. Corluka, G. Tourism seasonality—An overview. J. Bus. Paradig. 2019, 4, 21–43. [Google Scholar]
  40. Ferrante, M.; Lo Magno, L.G.; De Cantis, S. Measuring tourism seasonality across European countries. Tour. Manag. 2018, 68, 220–235. [Google Scholar] [CrossRef]
  41. Butler, R. Seasonality in tourism: Issues and problems. In Tourism: The State of Art; Seaton, A.V., Ed.; Wiley: Chichester, UK, 1994; pp. 332–339. [Google Scholar]
  42. Hylleberg, S. Modeling Seasonality. Advanced Texts in Econometrics; Oxford University Press: Oxford, UK, 1992; ISBN-13: 978-0198773184; ISBN-10: 0198773188. [Google Scholar]
  43. Fletcher, J.; Fyall, A.; Gilbert, D.; Wanhill, S. Tourism Principles and Practice, 6th ed.; Pearson: Harlow, UK, 2018; Available online: https://holycrosshigh.co.za/LydiaMaterials/Tourism%20%20principles%20and%20practice%20by%20Fletcher,%20John%20Edward%20Fyall,%20Alan%20Gilbert,%20David%20Wanhill,%20Stephen%20(z-lib.org).pdf (accessed on 27 December 2021).
  44. Thomas, J.; Wallis, K. Seasonal variation in regression analysis. J. R. Stat. Soc. 1971, A134, 57–72. [Google Scholar] [CrossRef]
  45. Bharti, N.; Tatem, A.J. Data descriptor: Fluctuations in anthropogenic nighttime lights from satellite imagery for five cities in Niger and Nigeria. Sci. Data 2018, 5, 180256. [Google Scholar] [CrossRef] [Green Version]
  46. Liu, Y.; Liu, X.; Gao, S.; Gong, L.; Kang, C.; Zhi, Y.; Chi, G.; Shi, L. Social sensing: A new approach to understanding our socioeconomic environments. Ann. Am. Assoc. Geogr. 2015, 105, 512–530. [Google Scholar] [CrossRef]
  47. Zhou, X.; Xu, C.; Kimmons, B. Detecting tourism destinations using scalable geospatial analysis based on cloud computing platform. Comput. Environ. Urban Syst. 2015, 54, 144–153. [Google Scholar] [CrossRef]
  48. Bratić, M.; Lesjak, M.; Đorđević, M.; Đorđević, M.; Radivojević, M. Seasonal movements in mountain tourism of Serbia: A review of methods and literature. Serb. J. Geosci. 2019, 5, 13–20. [Google Scholar]
  49. Marton, G.; Hinek, M.; Kiss, R.; Csapo, J. Measuring seasonality at the major spa towns of Hungary. Hung. Geogr. Bull. 2019, 68, 391–403. [Google Scholar] [CrossRef]
  50. Nadal, J.R.; Font, A.R.; Rossello, A.S. The economic determinants of seasonal patterns. Ann. Tour. Res. 2004, 31, 697–711. [Google Scholar] [CrossRef]
  51. Petrevska, B. Empirical analysis of seasonality patterns in tourism. J. Process Manag. New Technol. 2013, 1, 87–95. [Google Scholar] [CrossRef] [Green Version]
  52. Pavlović, S.; Todorović, N.; Bolović, J.; Vesić, M. Variations in seasonality in spa centres of Serbia. Bull. Serb. Geogr. Soc. 2021, 101, 89–110. [Google Scholar] [CrossRef]
  53. Chen, X.; Nordhaus, W.D. Using luminosity data as a proxy for economic statistics. Proc. Natl. Acad. Sci. USA 2011, 108, 8589–8594. [Google Scholar] [CrossRef] [Green Version]
  54. Levin, N.; Duke, Y. High spatial resolution night-time light images for demographic and socio-economic studies. Remote Sens. Environ. 2012, 119, 1–10. [Google Scholar] [CrossRef]
  55. Bruederle, A.; Hodler, R. Nighttime lights as a proxy for human development at the local level. PLoS ONE 2018, 13, e0202231. [Google Scholar] [CrossRef] [PubMed] [Green Version]
  56. Chen, X. Nighttime lights and population migration: Revisiting Classic demographic perspectives with an analysis of recent European data. Remote Sens. 2020, 12, 169. [Google Scholar] [CrossRef] [Green Version]
  57. Hall, O.; Bustos, M.F.A.; Olen, N.B.; Niedomysl, T. Population centroids of the world administrative units from nighttime lights 1992–2013. Sci. Data 2019, 6, 235. [Google Scholar] [CrossRef] [Green Version]
  58. Elvidge, C.D.; Baugh, K.E.; Kihn, E.A.; Kroehl, H.W.; Davis, E.R.; Davis, C.W. Relation between satellite observed visible near infrared emissions, population, economic activity and electric power consumption. Int. J. Remote Sens. 1997, 18, 1373–1379. [Google Scholar] [CrossRef]
  59. Hall, O. Remote sensing in social science research. Open Remote Sens. J. 2010, 3, 1–16. [Google Scholar] [CrossRef] [Green Version]
  60. Bustos, M. Population, Demography and Nighttime Lights: An Examination of the Effects of Population Decline on Settlement Patterns in Europe; CFE Working Papers Series No. 53; Centre for European Studies at Lund University: Lund, Sweden, 2015; Available online: https://www.cfe.lu.se/sites/cfe.lu.se/files/2020-12/cfewp53.pdf (accessed on 5 September 2021).
  61. Devkota, B.; Miyazaki, H.; Witayangkurn, A.; Kim, S.M. Using volunteered geographic information and nighttime light remote sensing data to identify tourism areas of interest. Sustainability 2019, 11, 4718. [Google Scholar] [CrossRef] [Green Version]
  62. Elvidge, C.D.; Baugh, K.; Zhizhin, M.; Hsu, F.C.; Ghosh, T. VIIRS night-time lights. Int. J. Remote Sens. 2017, 38, 5860–5879. [Google Scholar] [CrossRef]
  63. Sutton, P. Modeling population density with night-time satellite imagery and GIS. Comput. Environ. Urban Syst. 1997, 21, 227–244. [Google Scholar] [CrossRef]
  64. Sutton, P.; Roberts, D.; Elvidge, C.D.; Melj, H. A comparison of nighttime satellite imagery and population density for the continental United States. Photogramm. Eng. Remote Sens. 1997, 63, 1303–1313. [Google Scholar]
  65. Sutton, P.; Roberts, D.; Elvidge, C.D.; Bauch, K. Census from heaven: An estimate of the global human population using night-time light satellite imagery. Int. J. Remote Sens. 2001, 22, 3061–3076. [Google Scholar] [CrossRef]
  66. Tan, M.; Lia, X.; Wanga, X.; Qian, L.; Lia, W.; Xianga, W. Modeling population density based on nighttime light images and land use data in China. Appl. Geogr. 2018, 90, 239–247. [Google Scholar] [CrossRef]
  67. Elvidge, C.D.; Safran, J.; Tuttle, B.; Sutton, P.; Cinzano, P.; Pettit, D.; Arvesen, J.; Small, C. Potential for global mapping of development via a nightsat mission. GeoJournal 2007, 69, 45–53. [Google Scholar] [CrossRef]
  68. Small, C.; Pozzi, F.; Elvidge, C. Spatial analysis of global urban extent from DMSP-OLS night lights. Remote Sens. Environ. 2005, 96, 277–291. [Google Scholar] [CrossRef]
  69. Saksena, S.; Fox, J.; Spencer, J.; Castrence, M.; DiGregorio, M.; Epprecht, M.; Sultana, N.; Finucane, M.; Nguyen, L.; Viên, T. Classifying and mapping the urban transition in Vietnam. Appl. Geogr. 2014, 50, 80–89. [Google Scholar] [CrossRef]
  70. Tan, M. Urban growth and rural transition in China based on DMSP/OLS night-time light data. Sustainability 2015, 7, 8768–8781. [Google Scholar] [CrossRef] [Green Version]
  71. Henderson, J.V.; Storeygard, A.; Weil, D.N. A bright idea for measuring economic growth. Am. Econ. Rev. 2011, 101, 194–199. [Google Scholar] [CrossRef] [Green Version]
  72. Doll, C.N.H.; Pachauri, S. Estimating rural population without access to electricity in developing countries through night-time light satellite imagery. Energy Policy 2010, 38, 561–5670. [Google Scholar] [CrossRef]
  73. Elvidge, C.D.; Sutton, C.P.; Tilottama, G.; Tuttle, T.B.; Baugh, E.K.; Budhendra, B.; Bright, E. A global poverty map derived from satellite data. Comput. Geosci. 2009, 35, 1652–1660. [Google Scholar] [CrossRef]
  74. Jin, S.; Sader, S. MODIS time-series imagery for forest disturbance detection and quantification of patch size effects. Remote Sens. Environ. 2005, 99, 462–470. [Google Scholar] [CrossRef]
  75. Robinson, A.D.; Kukla, G. Maximum surface albedo of seasonally snow-covered lands in the Northern Hemisphere. J. Clim. Appl. Meteorol. 1985, 24, 402–411. [Google Scholar] [CrossRef] [Green Version]
  76. Brest, L.C. Seasonal albedo of an urban/rural landscape from satellite observations. J. Clim. Appl. Meteorol. 1987, 26, 1169–1187. [Google Scholar] [CrossRef]
  77. Lambin, F.C. Change detection at multiple temporal scales: Seasonal and annual variations in landscape variables. Photogramm. Eng. Remote Sens. 1996, 62, 931–938. [Google Scholar]
  78. Karnieli, A.; Qin, Z.; Wu, B.; Panov, N.; Yan, F. Spatio-temporal dynamics of land-use and land-cover in the Mu Us sandy Land, China, using the change vector analysis technique. Remote Sens. 2014, 6, 9316–9339. [Google Scholar] [CrossRef] [Green Version]
  79. Levin, N. The impact of seasonal changes on observed nighttime brightness from 2014 to 2015 monthly VIIRS DNB composites. Remote Sens. Environ. 2017, 193, 150–164. [Google Scholar] [CrossRef]
  80. Letu, H.; Hara, M.; Tana, G.; Bao, Y.; Nishio, F. Generating the nighttime light of the human settlements by identifying periodic components from DMSP/OLS satellite imagery. Environ. Sci. Technol. 2015, 49, 10503–10509. [Google Scholar] [CrossRef] [PubMed]
  81. Roman, M.O.; Stokes, E.C. Holidays in lights: Tracking cultural patterns in demand for energy services. Earth’s Future 2015, 3, 182–205. [Google Scholar] [CrossRef] [PubMed]
  82. QGIS Version 3.16.5. 2020. Available online: https://qgis.org/en/site/forusers/download.html (accessed on 17 April 2021).
  83. Christaller, W. Die Zentralen Orte in Süddeutschland: Eine Ökonomisch-Geographische Untersuchung über die Gesotzmässigkeit der Verbreitung und Entwicklung der Siedlungen mit Städtischen Funktionen; Gustav Fischer: Jena, Germany, 1933. [Google Scholar]
  84. Berry, B.; Garrison, W. The functional basis of the central place hierarchy. Econ. Geogr. 1958, 34, 145–154. [Google Scholar] [CrossRef]
  85. Krugman, P.R. Increasing returns and economic geography. J. Polit. Econ. 1991, 99, 483–499. [Google Scholar] [CrossRef]
  86. Borgatti, S.P.; Everett, M.G. Models of core/periphery structures. Soc. Netw. 1999, 21, 375–395. [Google Scholar] [CrossRef]
  87. Elvidge, C.D.; Baugh, K.E.; Zhizhin, M.; Hsu, F.C. Why VIIRS data are superior to DMSP for mapping nighttime lights. Proc. Asia Pac. Adv. Netw. 2013, 35, 62–69. [Google Scholar] [CrossRef] [Green Version]
  88. SORS. Tourist Turnover per Month for the Period 2015–2019; Unpublished Raw Data, Documentation Tables; Statistical Office of the Republic of Serbia: Belgrade, Serbia, 2019. [Google Scholar]
  89. SORS. Tourist Turnover—September 2021; Statistical Release 2021; Statistical Office of the Republic of Serbia: Belgrade, Serbia, 2021; 287, p. LXXI. Available online: https://publikacije.stat.gov.rs/G2021/Pdf/G20211287.pdf (accessed on 10 November 2021).
  90. Čerović, S.; Knežević, M.; Sekulović, N.; Barjaktarević, B.; Đoković, F. The impact of economic crisis and non-economic factors on the tourism industry in Zlatibor. Eur. J. Appl. Econ. 2015, 12, 1–9. [Google Scholar] [CrossRef] [Green Version]
  91. Sherbinin, A.; Balk, D.; Yager, K.; Jaiteh, M.; Poyyi, F.; Giri, C.; Wannebo, A. Social science applications of remote sensing. In A CIESIN Thematic Guide; Center for International Earth Science Information Network (CIESIN) Columbia University: New York, NY, USA, 2002; Available online: https://sedac.ciesin.columbia.edu/binaries/web/sedac/thematic-guides/tg.pdf (accessed on 11 November 2021).
  92. Checa, J.; Nel, O. Urban intensities. The urbanization of the iberian mediterranean coast in the light of nighttime satellite images of the earth. Urban Sci. 2018, 2, 115. [Google Scholar] [CrossRef] [Green Version]
  93. Bollman, R.D. Agricultural Statistics for Rural Development; Agriculture and Rural Working Paper Series, No.49; Statistics: Ottawa, ON, Canada, 2001. [Google Scholar]
  94. Apedaile, L.P. The new rural economy. In Building for Success: Exploration of Rural Community and Rural Development; Halseth, G., Halseth, R., Eds.; Canadian Rural Revitalization Foundation, Mount Allison University: Sackville, NB, Canada, 2004; pp. 111–134. [Google Scholar]
  95. Bontron, J.C.; Lasnier, N. Tourism: A potential source of rural employment. In Rural Employment: An International Perspective; Bollman, R.D., Bryden, J.M., Eds.; CAB International: New York, NY, USA, 1997; pp. 427–446. [Google Scholar]
  96. Lopez-Sanz, J.M.; Panelas-Leguia, A.; Gotierrez-Rodriguez, P.; Cuesta-Vallino, P. Rural tourism and the sustainable development goals. a study of the variables that most influence the behavior of the tourist. Front. Psychol. 2021, 12, 722973. [Google Scholar] [CrossRef]
  97. Baron, R.R.V. Seasonality in Tourism: A Guide to the Analysis of Seasonality and Trends for Policy Making; Economist Intelligence Unit: London, UK, 1975. [Google Scholar]
  98. Petrović, D.M.; Vujko, A.; Gajić, T.; Darko, B.; Vuković, B.D.; Radovanović, M.; Jovanović, M.J.; Vuković, N. Tourism as an approach to sustainable rural development in post-socialist countries: A comparative study of Serbia and Slovenia. Sustainability 2018, 10, 54. [Google Scholar] [CrossRef] [Green Version]
  99. Radović, G. Underdevelopment of rural tourism in Serbia: Causes, consequences and possible directions of development. Econ. Agric. 2020, 67, 1337–1352. [Google Scholar] [CrossRef]
  100. Stupariu, M.; Morar, C. Tourism seasonality in the spas of Romania. GeoJ. Tour. Geosites 2018, 22, 573–584. [Google Scholar] [CrossRef]
  101. Dimić, M.; Radivojević, A. The complexity of the tourism product as a factor in the competitiveness of mountain destinations in Serbia. In Tourism in Function of Development of the Republic of Serbia; Cvijanović, D., Ružić, P., Andreeski, C., Gnjatović, D., Stanišić, T., Eds.; Faculty of Hotel Management and Tourism, University of Kragujevac: Vrnjačka Banja, Serbia, 2017; pp. 327–342. Available online: http://www.tisc.rs/proceedings/index.php/hitmc/issue/view/4/The%20Second%20International%20Scientific%20Conference%2C%20TOURISM%20IN%20FUNCTION%20OF%20DEVELOPMENT%20OF%20THE%20REPUBLIC%20OF%20SERBIA%20-%20%D0%A2ourism%20product%20as%20a%20factor%20of%20competitiveness%20of%20the%20Serbian%20economy%20and%20experiences%20of%20other%20countries%2C%20Thematic%20Proceedings%20I (accessed on 25 December 2021).
  102. Pavluković, V.; Vuković, S.; Cimbaljević, M. Determining Success factors for business tourism destinations: Evidence from Zlatibor (Serbia). Turizam 2021, 25, 110–120. [Google Scholar] [CrossRef]
  103. Paunovic, I.; Radojevic, M. Towards green economy: Balancing market and seasonality of demand indicators in Serbian mountain tourism product development. In Trends in Tourism and Hospitality Industry; Faculty of Tourism and Hospitality Management in Opatia, University of Rijeka: Rijeka, Croatia, 2014; pp. 601–615. Available online: https://www.academia.edu/12415736/TOWARDS_GREEN_ECONOMY_BALANCING_MARKET_AND_SEASONALITY_OF_DEMAND_INDICATORS_IN_SERBIAN_MOUNTAIN_TOURISM_PRODUCT_DEVELOPMENT (accessed on 26 December 2021).
  104. Mijatov, M.; Ivkov-Džigurski, A.; Pivac, T.; Košić, K. The leisure time aspects in ski centre—Kopaonik mountain case study (Serbia). J. Geogr. Inst. Jovan Cvijić SASA 2016, 66, 291–306. [Google Scholar] [CrossRef]
  105. Campbell, A.T.; Eisenman, S.B.; Lane, N.D.; Miluzzo, E.; Peterson, R.A.; Lu, H.; Zheng, X.; Musolesi, M.; Fodor, K.; Ahn, G.-S. The rise of people centric sensing. IEEE Internet Comput. 2008, 12, 12–21. [Google Scholar] [CrossRef]
  106. Goodchild, M.F. Citizens as sensors: The world of volunteered geography. GeoJournal 2007, 69, 211–221. [Google Scholar] [CrossRef] [Green Version]
  107. Remote Detection of (De)population Processes in Serbia. Available online: https://depopulacija.rs/ (accessed on 30 December 2021).
Figure 1. Seasonally activated settlements in Serbia, 2015–2019.
Sustainability 14 01604 g001
Figure 2. Seasonality coefficient for settlements activated for 4 months per year.
Sustainability 14 01604 g002
Figure 3. Seasonality coefficient for settlements activated for 3 months per year.
Sustainability 14 01604 g003
Figure 4. Seasonality of the spa touristic centers, 2015–2019.
Sustainability 14 01604 g004
Figure 5. Seasonality of the mountain touristic centers, 2015–2019.
Sustainability 14 01604 g005
Figure 6. Intertwined seasonality coefficients for selected case studies.
Sustainability 14 01604 g006aSustainability 14 01604 g006b
Figure 7. Average monthly nighttime lights (NTL) (2015–2019) for the selected mountain tourist areas.
Sustainability 14 01604 g007
Figure 8. Ratio of the months with highest and lowest NTL for selected mountain areas.
Sustainability 14 01604 g008
Figure 9. Average monthly NTL (2015–2019) for the selected spa centers.
Sustainability 14 01604 g009
Figure 10. Ratio of months with highest and lowest NTL for the selected spa centers.
Sustainability 14 01604 g010
Table 1. Seasonality coefficient for the selected touristic areas, 2015–2019.
Touristic Areas (Destination)IIIIIIIVVVIVIIVIIIIXXXIXII
Spa centers
Bukovačka Banja1.0901.1041.0941.1241.1401.1481.1641.1541.0671.0841.0621.059
Mataruška Banja1.0061.0041.0061.0051.0071.0061.0071.0091.0101.0031.0011.002
Banja Koviljača1.0421.0391.0551.0551.1001.0961.1001.1011.0911.0731.0511.042
Prolom banja1.7171.6981.8532.5352.5703.4963.7324.0053.5573.4432.4851.755
Gornja Trepča1.0061.1251.1891.3251.5611.8802.2402.4832.1881.5351.2531.072
Banja Vrdnik1.0611.0691.0651.0731.0841.0901.0971.1131.1041.0951.0901.071
Palić1.0081.0111.0111.0191.0211.0211.0281.0311.0231.0191.0141.013
Lukovska banja1.3891.5721.4261.7281.9062.2042.4522.5112.2692.0651.6571.315
Gamzigradska banja1.0321.0341.0761.0621.0861.0971.1071.1211.1401.0841.0511.056
Ribarska Banja1.2641.3281.4391.6062.0642.3962.5422.7082.4771.9661.5291.301
Sijarinska Banja1.0631.0811.1081.1991.1971.6292.0192.0281.6511.3461.2551.105
Banja Vrujci1.0411.0651.0761.1131.1501.1671.2351.2621.1431.1061.0071.033
Mountain areas
Zlatibor1.5961.6591.4031.5201.6131.5921.6661.7631.4571.4391.3561.391
Kopaonik13.91315.1309.8084.1144.5904.1174.1465.4292.8283.0823.0888.108
Tara1.5511.7301.4461.7101.8931.9161.9641.7721.2861.3951.2081.398
Mokra Gora1.1811.1781.0611.1171.1361.1551.2131.2151.1441.1121.0911.059
Divčibare3.8565.1963.3964.6295.3654.7595.0303.8041.9342.8852.8353.313
Zlatar1.2361.3831.1871.3351.4231.5211.5691.6951.3381.2961.1151.194
Rudnik1.0561.0631.0551.0791.1101.0921.0731.0321.0051.0281.0171.057
Stara planina2.3382.5941.6641.2631.2831.3711.3981.5241.2791.2601.2401.508
Goč3.0583.6704.3304.1545.5744.5784.0412.8541.9442.9111.9032.776
Table 2. The monthly Scos values for the selected tourist areas (the months with the highest and lowest SOL are bolded).
Touristic Areas (Destination)IIIIIIIVVVIVIIVIIIIXXXIXII
Divčibare Mt.1.921.601.120.830.710.730.760.780.810.830.930.97
Stara planina Mt.1.761.511.190.860.850.780.610.710.710.861.051.12
Kopaoonik Mt.2.011.581.380.870.650.590.610.660.690.740.951.28
Zlatar Mt.1.661.341.010.880.810.800.780.850.820.861.021.18
Zlatibor Mt.1.801.341.140.900.790.780.800.810.780.780.931.14
Tara Mt.1.881.320.950.830.900.880.700.780.810.841.051.06
Ribarska banja Spa2.001.070.840.870.820.760.740.830.870.861.151.17
Prolom banja Spa1.260.680.860.980.950.971.021.101.061.01.131.0
Lukovska banja Spa1.421.030.840.820.980.850.990.910.970.961.091.13
Publisher’s Note: MDPI stays neutral with regard to jurisdictional claims in published maps and institutional affiliations.

