Evaluation and Projection of Diurnal Temperature Range in Maize Cultivation Areas in China Based on CMIP6 Models
Abstract
1. Introduction
2. Materials and Methods
2.1. CMIP6 Model Output
2.2. Observation Data
2.3. Methods
2.3.1. Climatology and Interannual Variability
2.3.2. Performance METRICS
3. Model Evaluation
3.1. Climatology
3.2. Interannual Variability
3.3. Comprehensive Evaluation
4. Future Projections
4.1. Climatology
4.2. Interannual Variability
5. Discussion
6. Conclusions
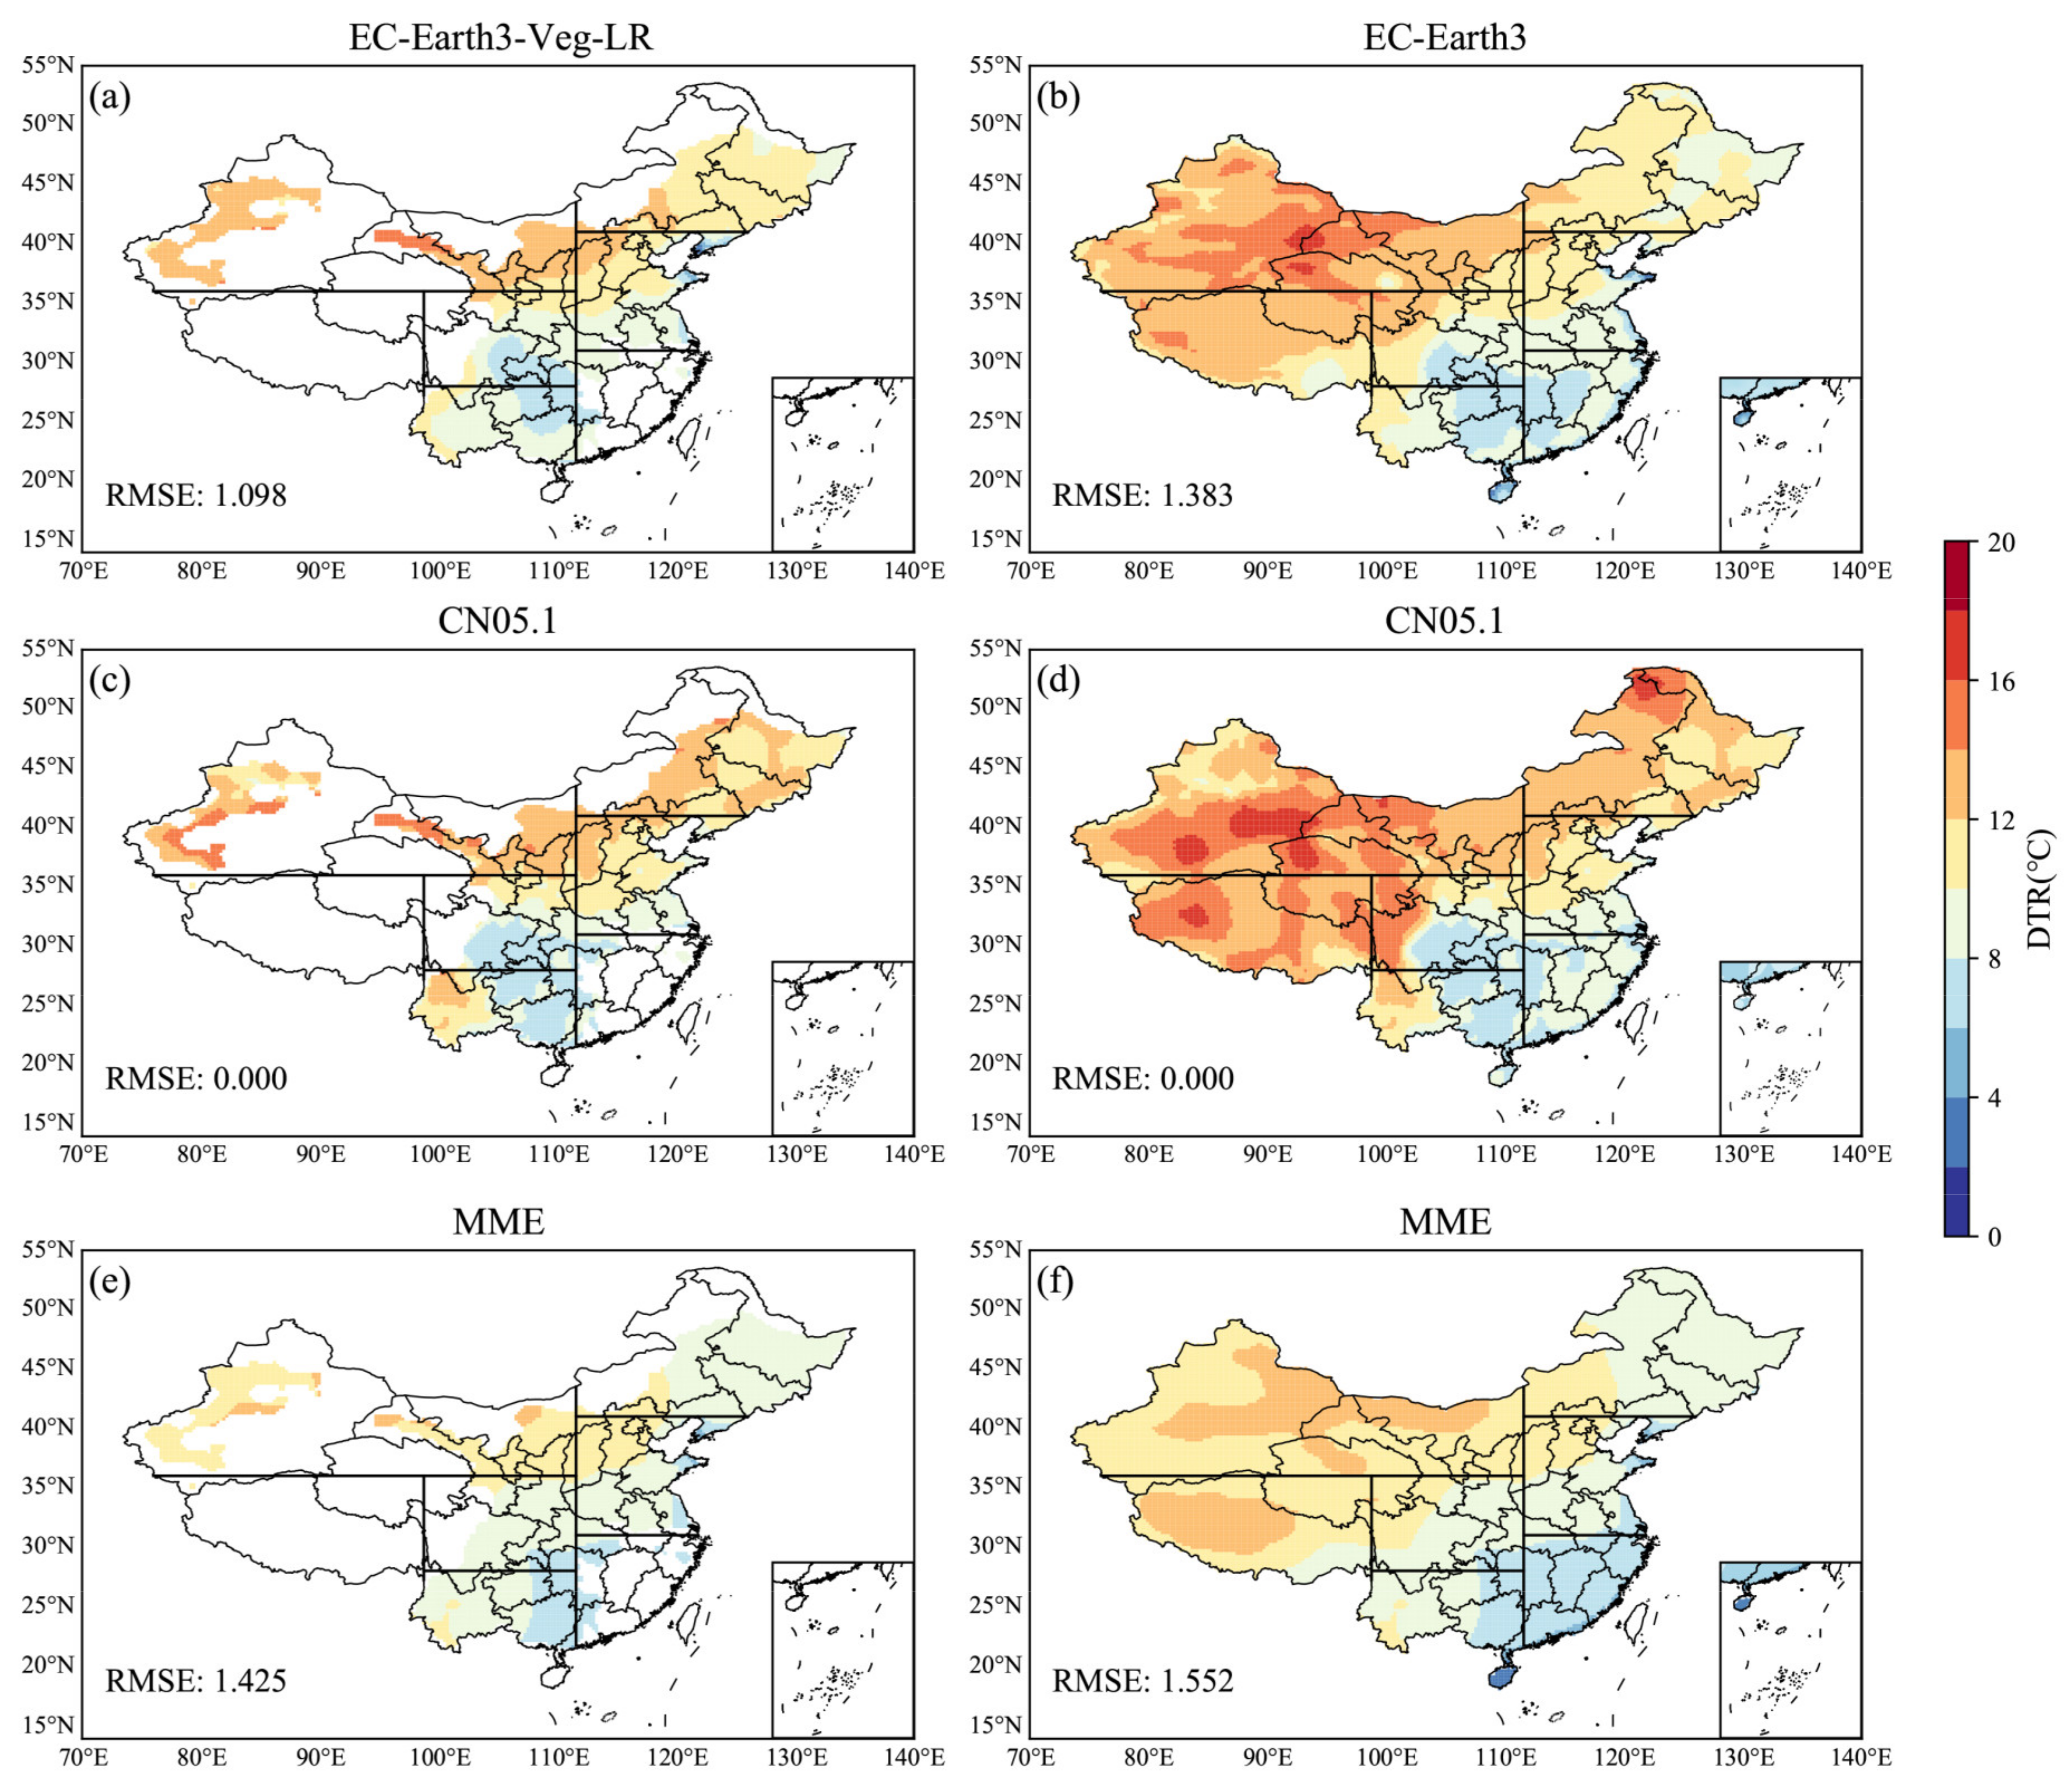
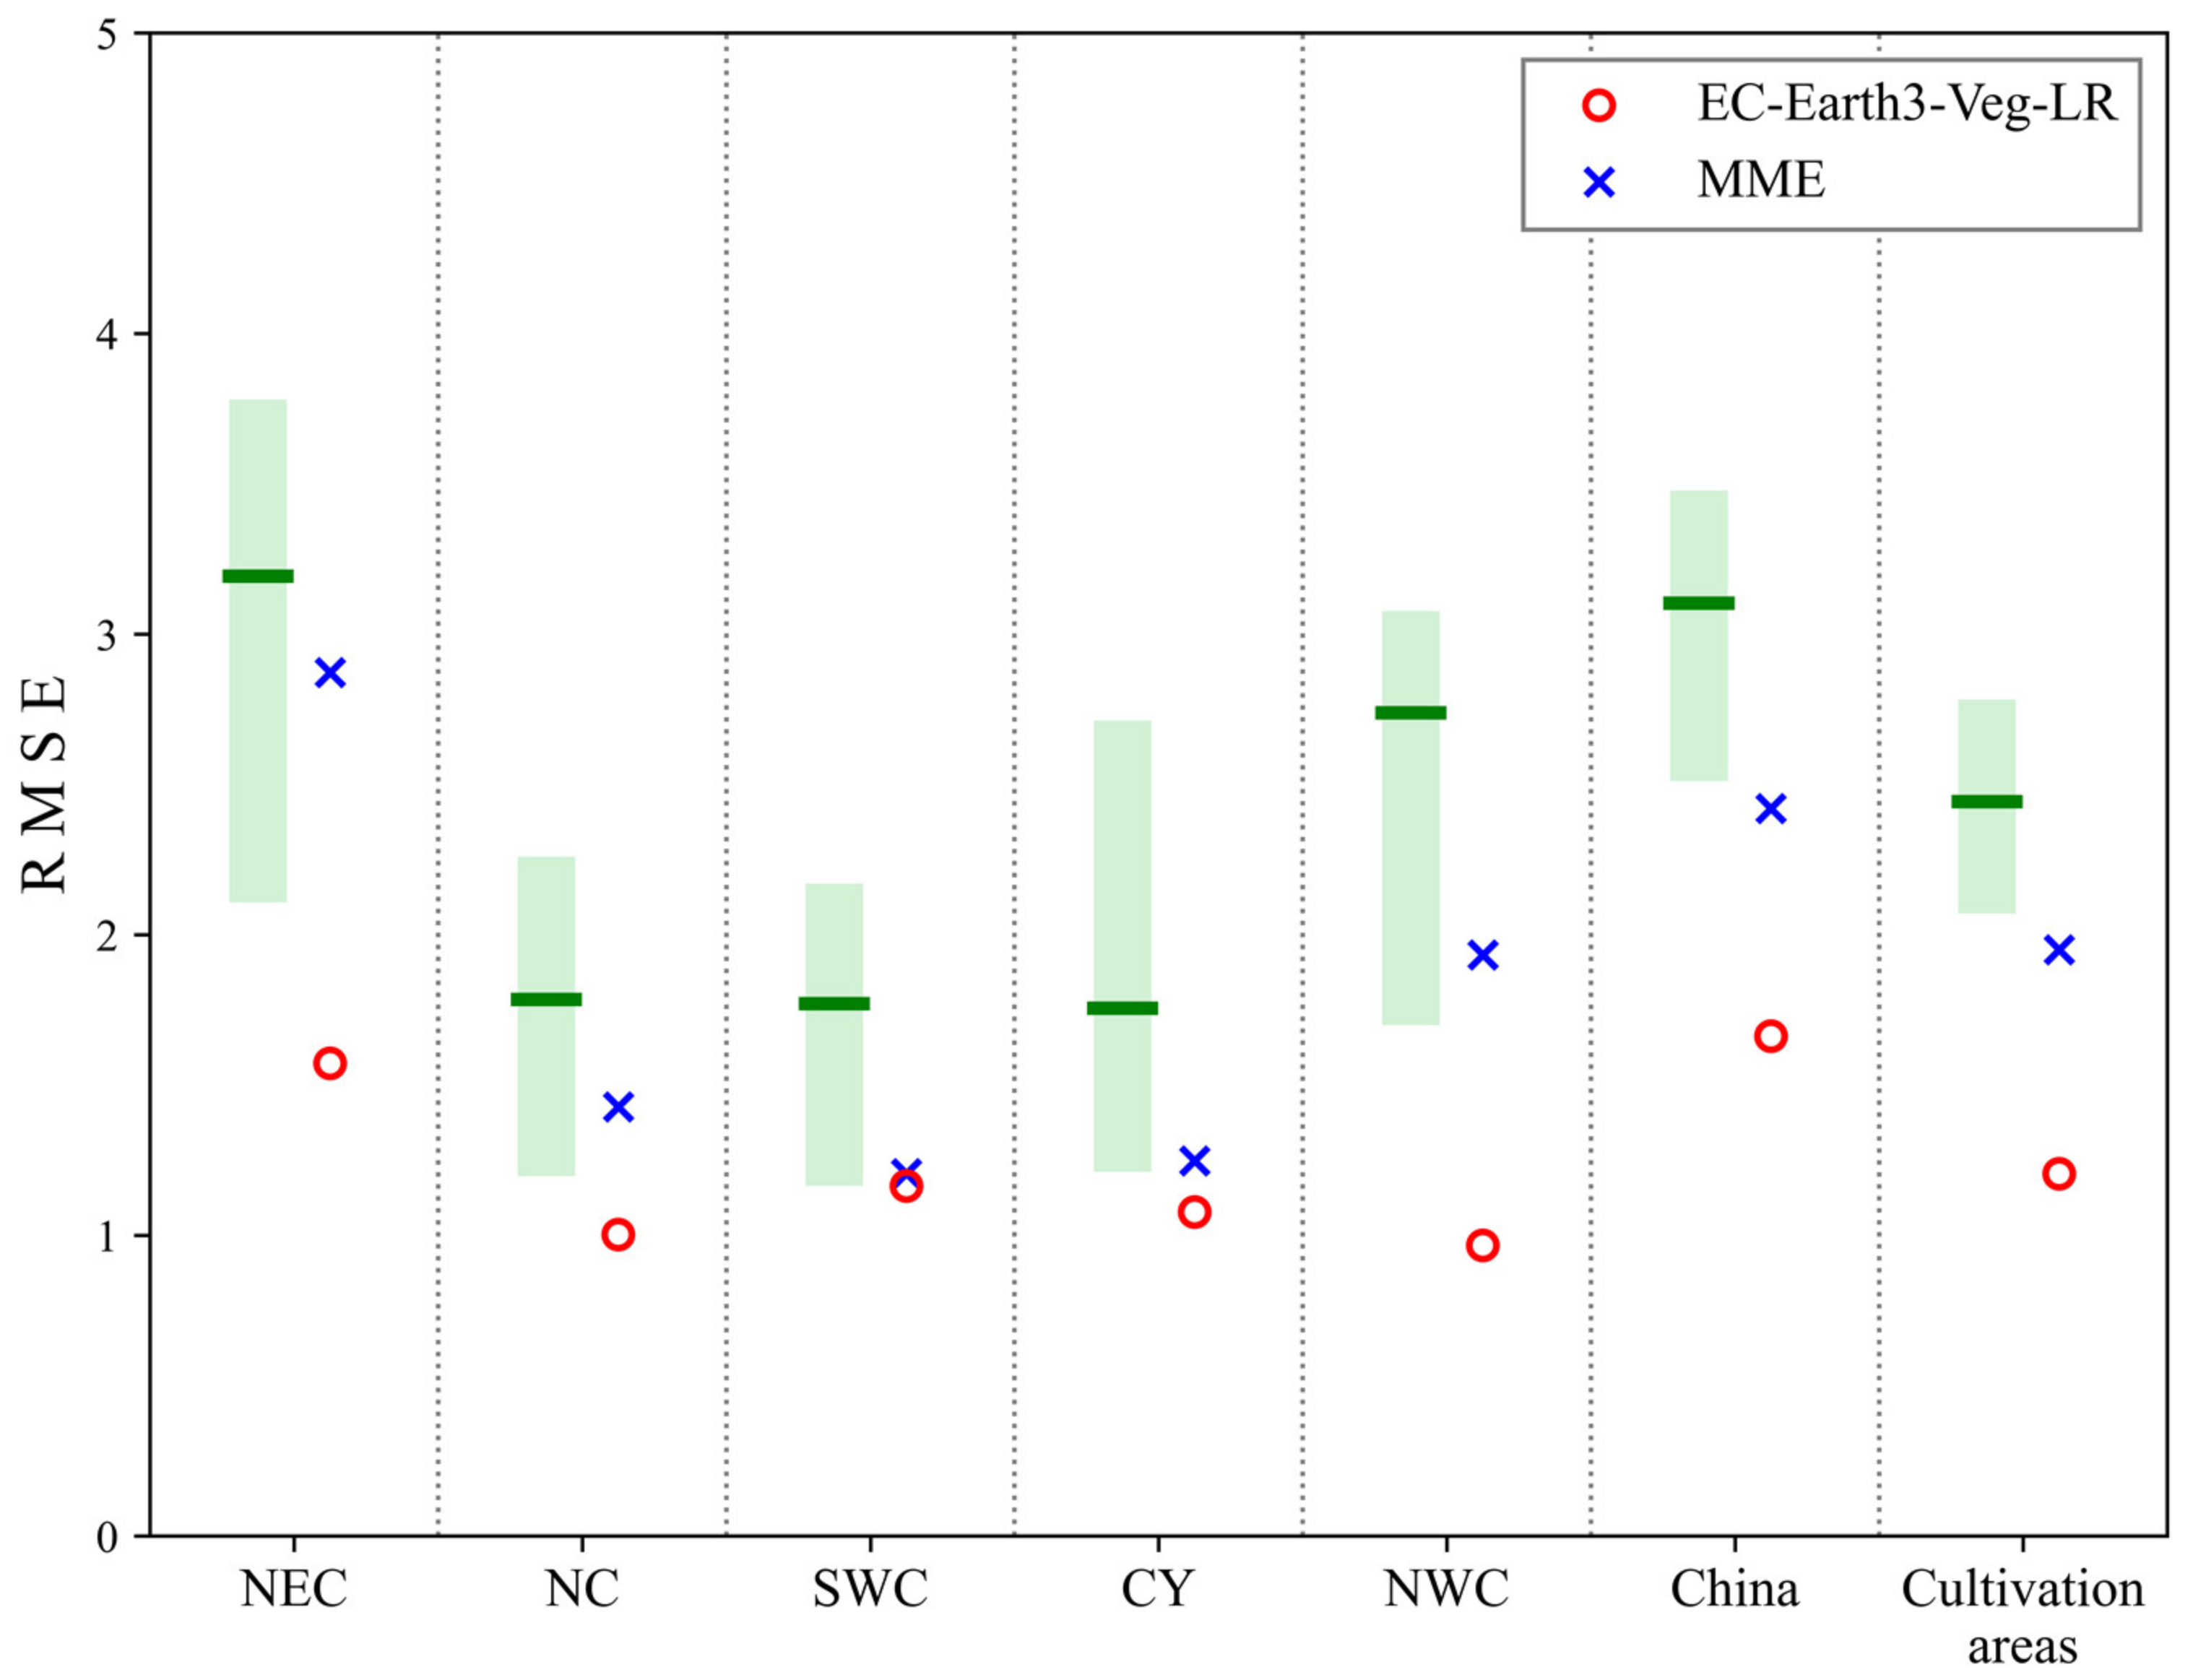
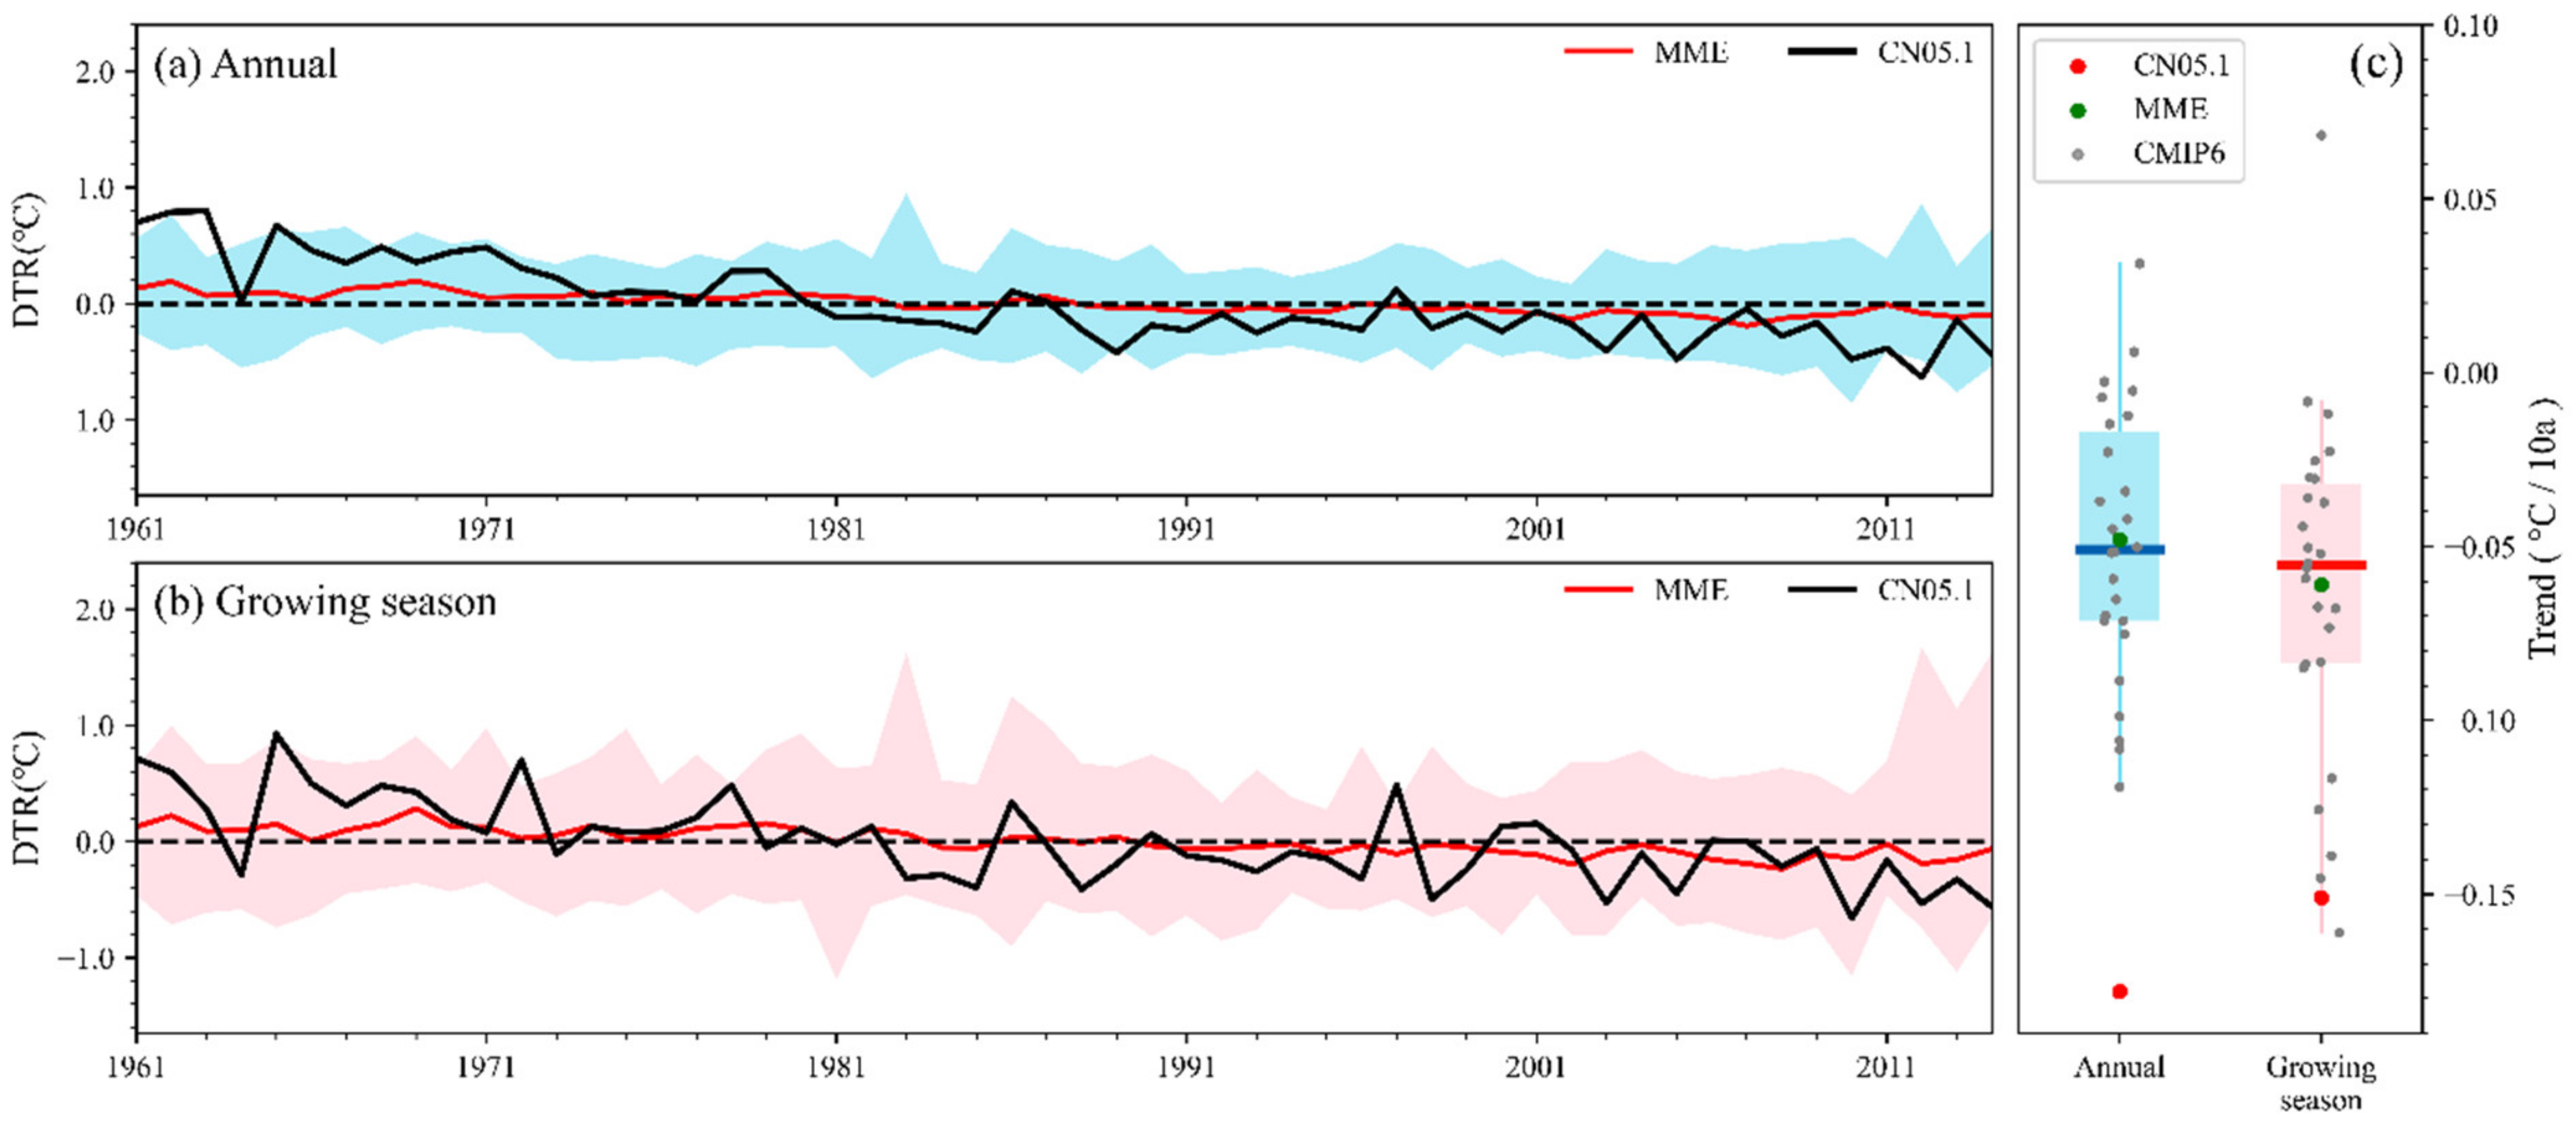
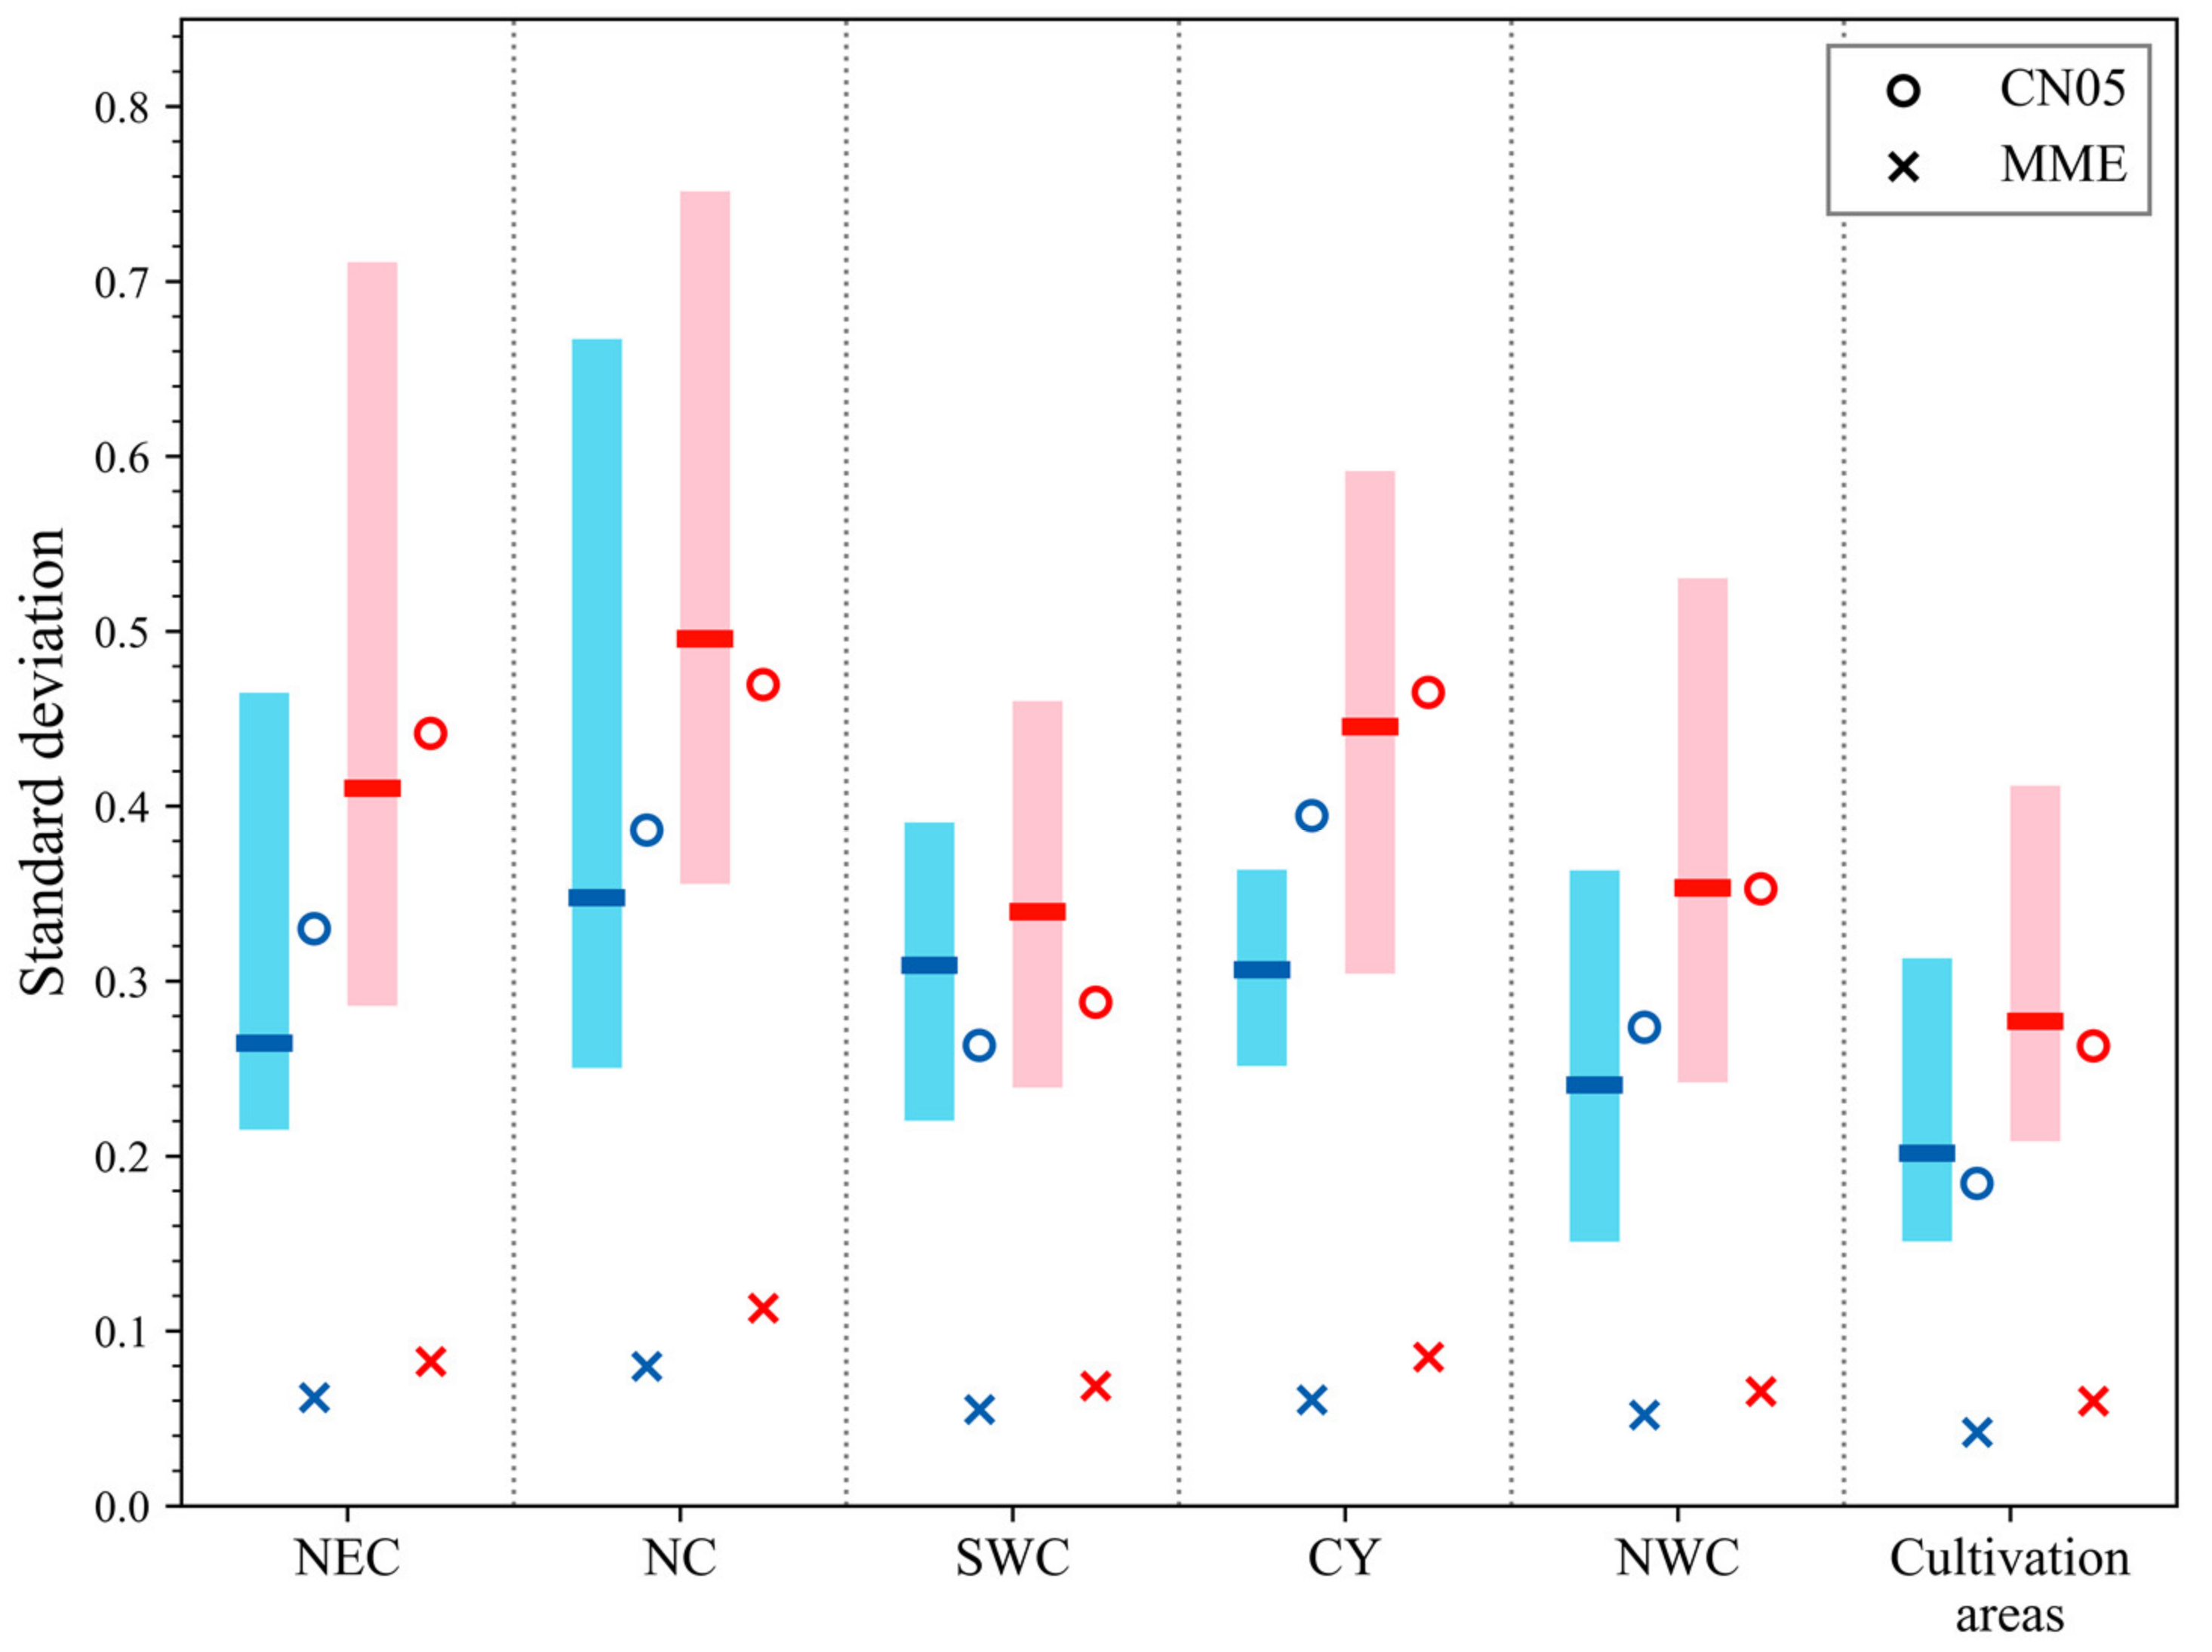
- CMIP6 models can generally reproduce the spatial distribution and interannual variation in the DTR in the main maize cultivation areas. The reproducibility of the DTR averaged over the main maize cultivation areas is better than that of China ( is smaller than ). The DTR varies substantially between the models, and the intermodel spread is particularly large in NWC.
- Based on the comprehensive evaluation, EC-Earth3-Veg-LR is more suitable for the simulation of DTR in the main maize cultivation areas in China. It is essential to pertinently evaluate global climate models. The reproducibility of the maize-growing season DTR averaged over the main maize cultivation areas is lower than that of the annual DTR, but it is still acceptable.
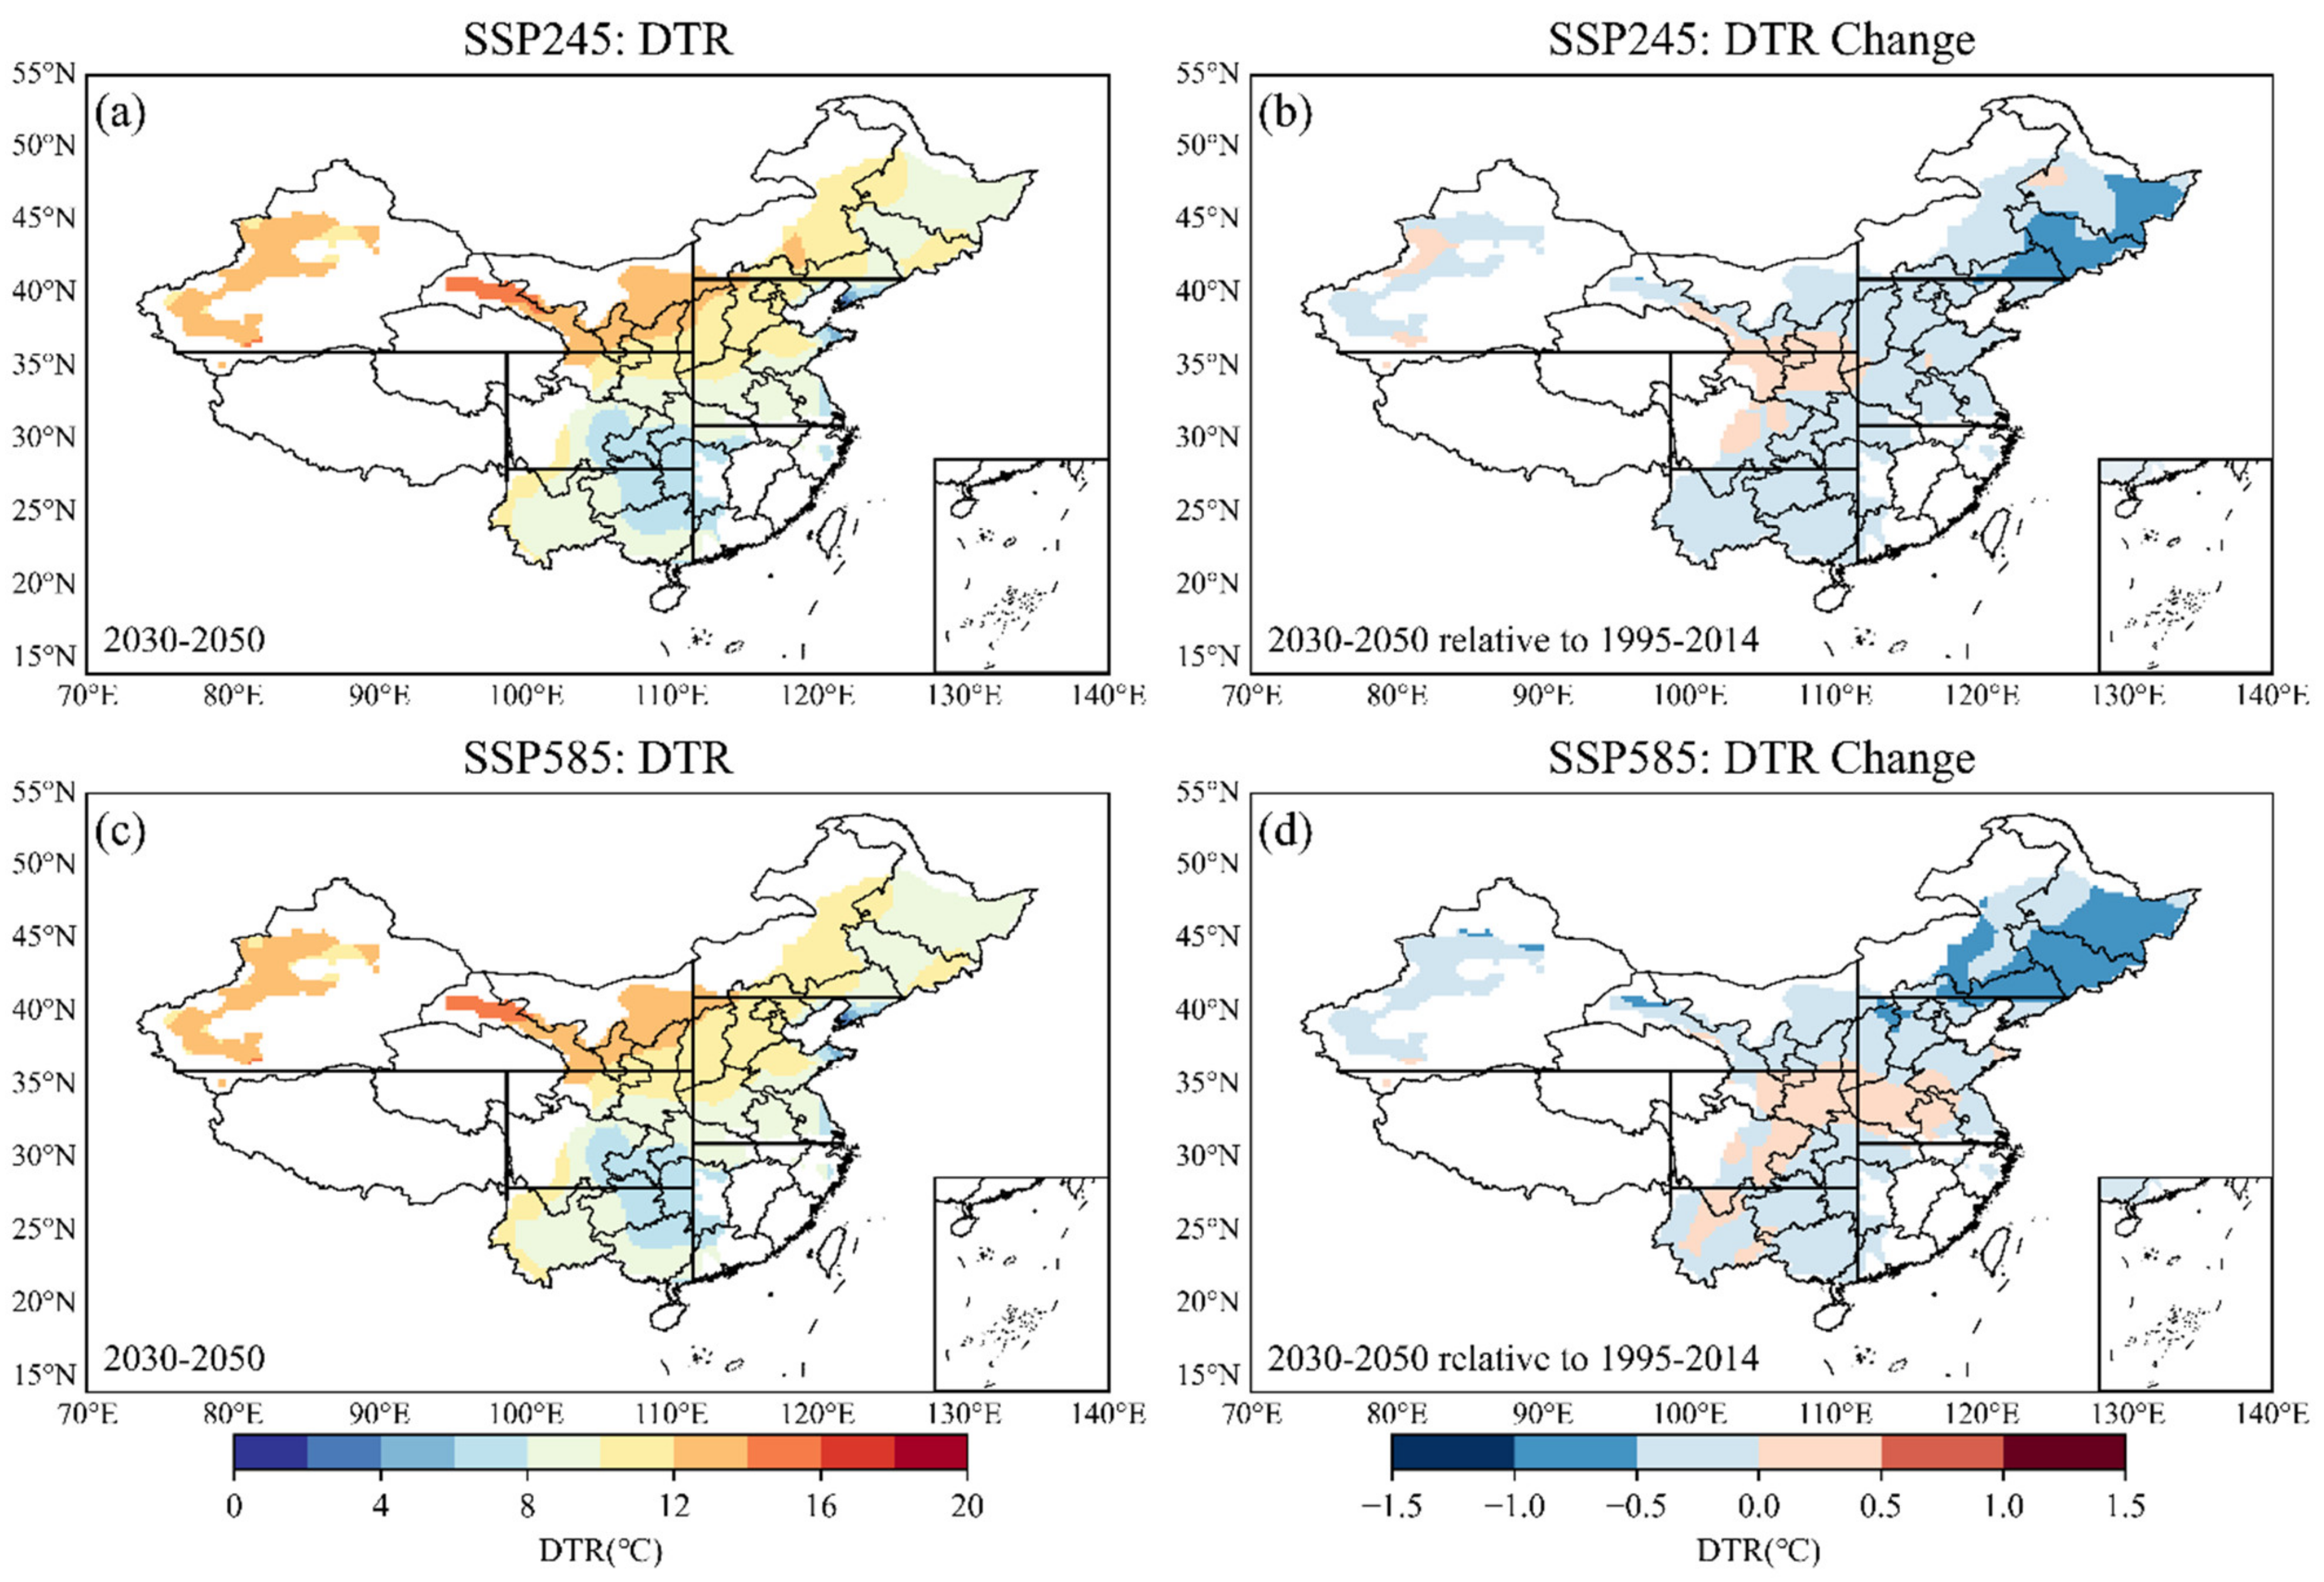
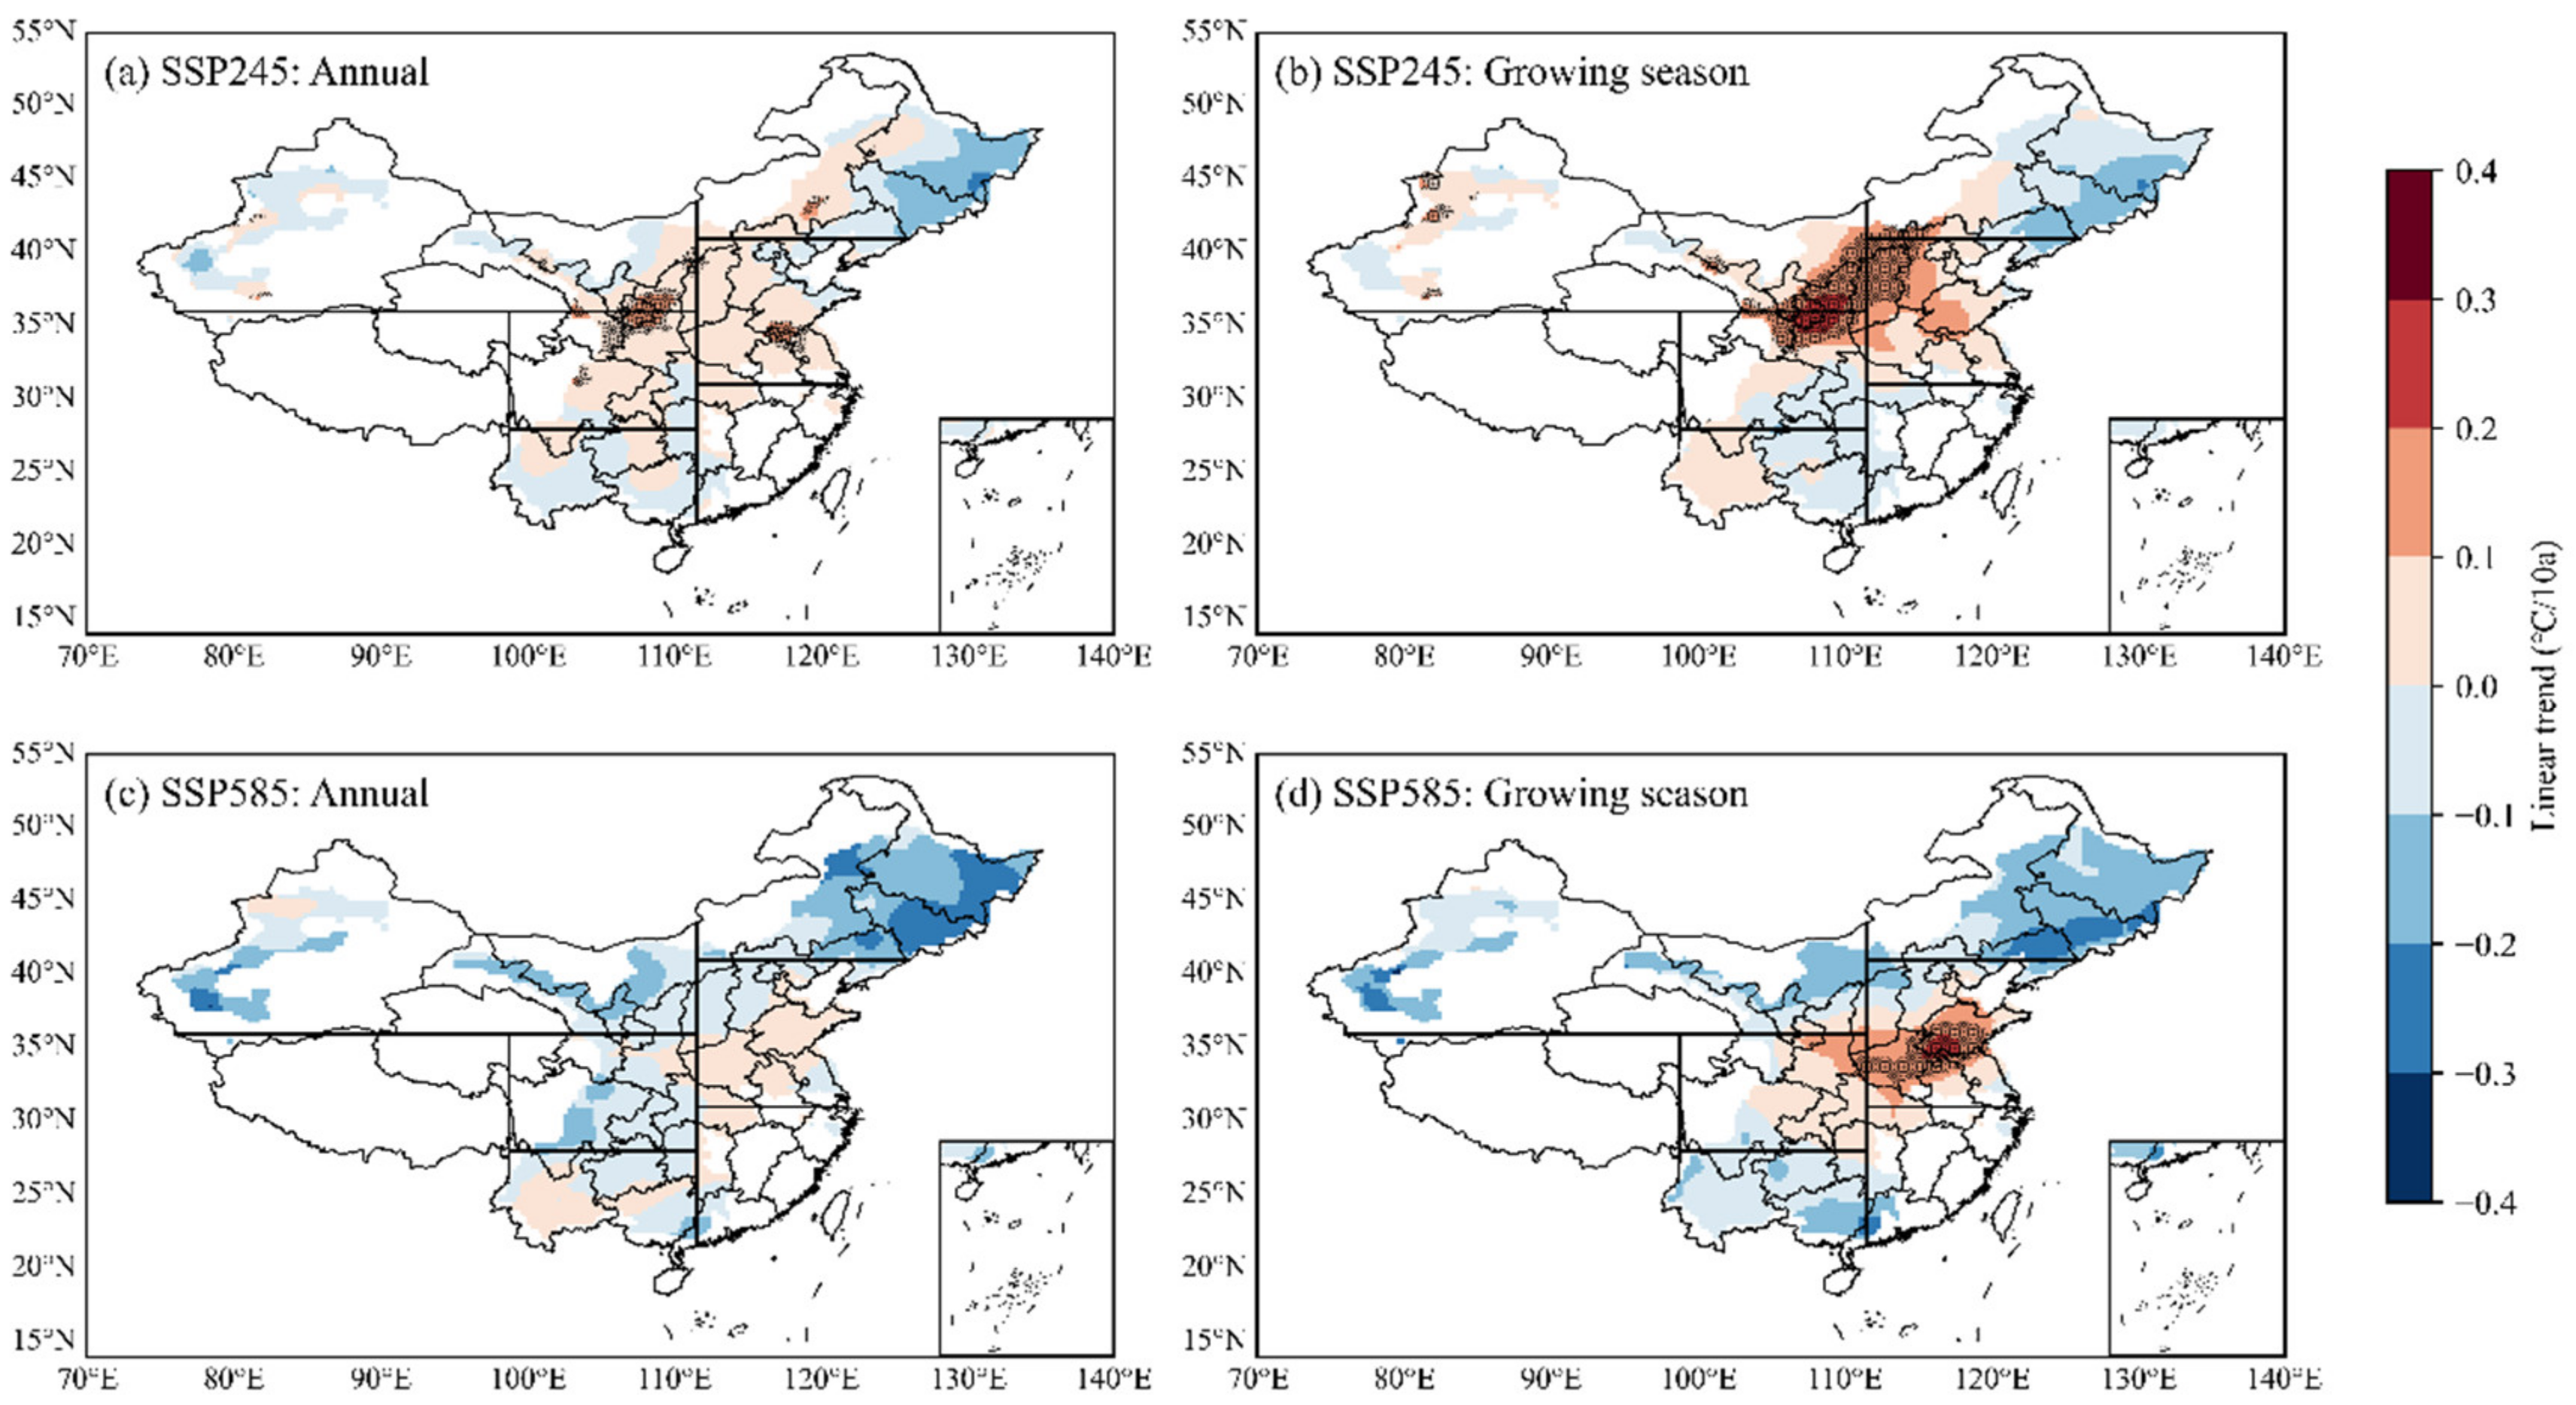
- Compared with historical simulations, reductions are widely detected: the climatological DTR of the main maize cultivation areas decreases by 0.151 °C (SSP245) and 0.207 °C (SSP585). Under the SSP245 scenario, the reduction is mainly distributed in NWC, NC, and CY. All subregions show a reduction under SSP585. The reduction proportion of DTR under SSP245 is slightly smaller than that under SSP585.
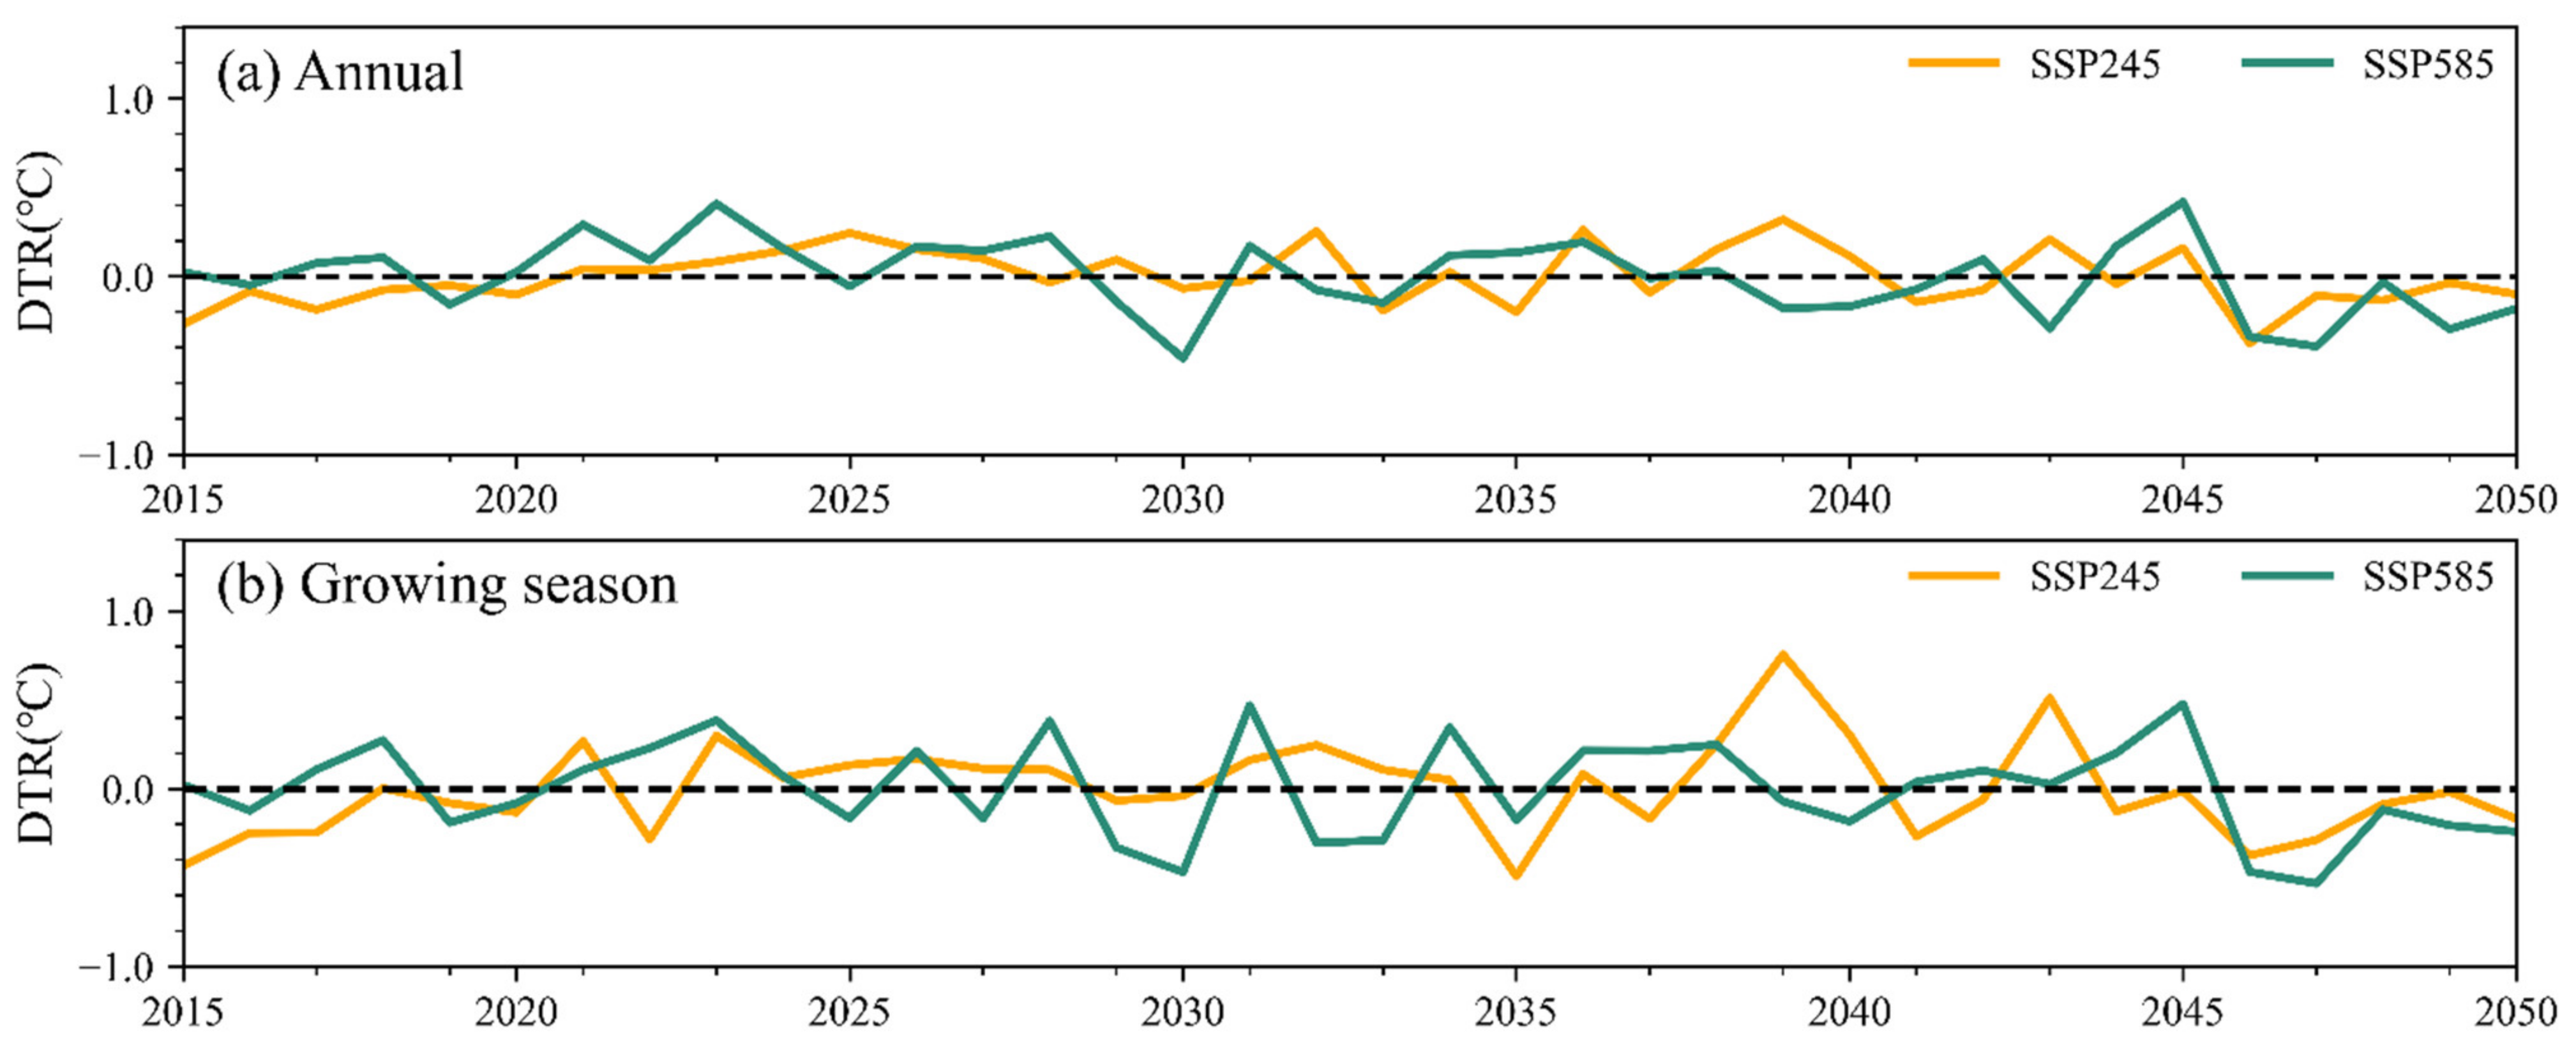
- The DTR in the main maize cultivation areas under SSP245 is expected to remain unchanged (annual) or to increase slightly (growing season). Under SSP585, DTR is expected to decrease both annually and during the growing season. The annual and growing season DTRs are dominated by decreasing trends in NEC, NWC, and SWC under the two scenarios, while in CY and NC, the growing season DTR shows a significant increase.
Author Contributions
Funding
Institutional Review Board Statement
Informed Consent Statement
Data Availability Statement
Acknowledgments
Conflicts of Interest
References
- Arunrat, N.; Sereenonchai, S.; Chaowiwat, W.; Wang, C. Climate change impact on major crop yield and water footprint under CMIP6 climate projections in repeated drought and flood areas in Thailand. Sci. Total Environ. 2022, 807, 150741. [Google Scholar] [CrossRef] [PubMed]
- Arunrat, N.; Sereenonchai, S.; Wang, C. Carbon footprint and predicting the impact of climate change on carbon sequestration ecosystem services of organic rice farming and conventional rice farming: A case study in Phichit province, Thailand. J. Environ. Manag. 2021, 289, 112458. [Google Scholar] [CrossRef]
- Arunrat, N.; Pumijumnong, N.; Sereenonchai, S.; Chareonwong, U.; Wang, C. Assessment of climate change impact on rice yield and water footprint of large-scale and individual farming in Thailand. Sci. Total Environ. 2020, 726, 137864. [Google Scholar] [CrossRef] [PubMed]
- Lobell, D.B.; Field, C.B. Global scale climate–crop yield relationships and the impacts of recent warming. Environ. Res. Lett. 2007, 2, 014002. [Google Scholar] [CrossRef]
- Moriondo, M.; Giannakopoulos, C.; Bindi, M. Climate change impact assessment: The role of climate extremes in crop yield simulation. Clim. Change 2011, 104, 679–701. [Google Scholar] [CrossRef]
- Xiong, W.; Holman, I.; Lin, E.; Conway, D.; Li, Y.; Wu, W. Untangling relative contributions of recent climate and CO2 trends to national cereal production in China. Environ. Res. Lett. 2012, 7, 044014. [Google Scholar] [CrossRef]
- Wang, L.; Xiong, W.; Wen, X.; Feng, L. Effect of climatic factors such as temperature, precipitation on maize production in China. Trans. Chin. Soc. Agric. Eng. 2014, 30, 138–146. [Google Scholar] [CrossRef]
- Wang, Y.; Yang, H.; Liu, R.; Cai, H. Try to discuss the relationships between the seed qualities of wheat and meteorological conditions. Chin. J. Agrometeorol. 1990, 11, 1–7. [Google Scholar]
- Dhakhwa, G.B.; Campbell, C.L. Potential effects of differential day-night warming in global climate change on crop production. Clim. Change 1998, 40, 647–667. [Google Scholar] [CrossRef]
- Tubiello, F.N.; Rosenzweig, C.; Goldberg, R.A.; Jagtap, S.; Jones, J.W. Effects of climate change on US crop production: Simulation results using two different GCM scenarios. Part I: Wheat, potato, maize, and citrus. Clim. Res. 2002, 20, 259–270. [Google Scholar] [CrossRef]
- Smika, D.E.; Greb, B.W. Protein Content of Winter Wheat Grain as Related to Soil and Climatic Factors in the Semiarid Central Great Plains. Agron. J. 1973, 65, 433–436. [Google Scholar] [CrossRef]
- Jiang, L.X.; Lv, J.J.; Wang, L.L.; Yang, X.Q.; Li, S. Variation of Diurnal Temperature Range and its Relationship with Crop Yield in Heilongjiang Province. Chin. J. Agrometeorol. 2013, 2, 179–185. [Google Scholar]
- Fall, S.; Watts, A.; Nielsen-Gammon, J.; Jones, E.; Niyogi, D.; Christy, J.R.; Pielke, R.A., Sr. Analysis of the impacts of station exposure on the US Historical Climatology Network temperatures and temperature trends. J. Geophys. Res. Atmos. 2011, 116, D14. [Google Scholar] [CrossRef]
- Zhou, Y.; Ren, G. Change in extreme temperature event frequency over mainland China, 1961−2008. Clim. Res. 2011, 50, 125–139. [Google Scholar] [CrossRef]
- Lindvall, J.; Svensson, G. The diurnal temperature range in the CMIP5 models. Clim. Dyn. 2015, 44, 405–421. [Google Scholar] [CrossRef]
- Wang, J.; Chen, Y.; Tett, S.F.; Yan, Z.; Zhai, P.; Feng, J.; Xia, J. Anthropogenically-driven increases in the risks of summertime compound hot extremes. Nat. Commun. 2020, 11, 528. [Google Scholar] [CrossRef]
- Wang, B.; Feng, P.; De, L.; Garry, J.O.; Macadam, I.; Waters, C.; Asseng, S.; Cowie, A.; Jiang, T.; Xiao, D.; et al. Sources of uncertainty for wheat yield projections under future climate are site-specific. Nat. Food 2020, 1, 720–728. [Google Scholar] [CrossRef]
- Slafer, G.A.; Rawson, H.M. Rates and cardinal temperatures for processes of development in wheat: Effects of temperature and thermal amplitude. Funct. Plant Biol. 1995, 22, 913–926. [Google Scholar] [CrossRef]
- Larmure, A.; Salon, C.; Munier-Jolain, N.G. How does temperature affect C and N allocation to the seeds during the seed-filling period in pea? Effect on seed nitrogen concentration. Funct. Plant Biol. 2005, 32, 1009–1017. [Google Scholar] [CrossRef]
- Tang, B.; Hu, W.; Duan, A. Future Projection of Extreme Precipitation Indices over the Indochina Peninsula and South China in CMIP6 Models. J. Clim. 2021, 34, 8793–8811. [Google Scholar] [CrossRef]
- Knox, J.; Hess, T.; Daccache, A.; Wheeler, T. Climate change impacts on crop productivity in Africa and South Asia. Environ. Res. Lett. 2012, 7, 034032. [Google Scholar] [CrossRef]
- Lewis, S.C.; Karoly, D.J. Evaluation of historical diurnal temperature range trends in CMIP5 models. J. Clim. 2013, 26, 9077–9089. [Google Scholar] [CrossRef]
- Fan, X.; Duan, Q.; Shen, C.; Wu, Y.; Xing, C. Global surface air temperatures in CMIP6: Historical performance and future changes. Environ. Res. Lett. 2020, 15, 104056. [Google Scholar] [CrossRef]
- Tao, F.; Yokozawa, M.; Liu, J.; Zhang, Z. Climate–crop yield relationships at provincial scales in China and the impacts of recent climate trends. Clim. Res. 2008, 38, 83–94. [Google Scholar] [CrossRef]
- Zhang, T.; Zhu, J.; Wassmann, R. Responses of rice yields to recent climate change in China: An empirical assessment based on long-term observations at different spatial scales (1981–2005). Agric. For. Meteorol. 2010, 150, 1128–1137. [Google Scholar] [CrossRef]
- Zhou, T.; Zou, L.; Chen, X. Commentary on the Coupled Model Intercomparison Project Phase 6 (CMIP6). Clim. Change Res. 2019, 15, 445–456. [Google Scholar] [CrossRef]
- CMIP6 Search Interface. Available online: https://esgf-node.llnl.gov/search/cmip6 (accessed on 29 December 2021).
- Wu, J.; Gao, X.J. A gridded daily observation dataset over China region and comparison with the other datasets. Diqiu Wuli Xuebao 2013, 56, 1102–1111. [Google Scholar] [CrossRef]
- Xu, Y.; Gao, X.J.; Yan, S.Y.; Xu, C.H.; Shi, Y.; Giorgi, F. A daily temperature dataset over China and its application in validating a RCM simulation. Adv. Atmos. Sci. 2009, 26, 763–772. [Google Scholar] [CrossRef]
- New, M.; Lister, D.; Hulme, M.; Makin, I. A high-resolution data set ofsurface climate over global land areas. Clim. Res. 2002, 21, 1–25. [Google Scholar] [CrossRef]
- Li, Q.X.; Huang, J.; Jiang, Z.; Zhou, L.; Chu, P.; Hu, K. Detection of urbanizationsignals in extreme winter minimum temperature changes over northern China. Clim. Change 2014, 122, 595–608. [Google Scholar] [CrossRef]
- Monfreda, C.; Ramankutty, N.; Foley, J.A. Farming the planet: 2. Geographic distribution of crop areas, yields, physiological types, and net primary production in the year 2000. Glob. Biogeochem. Cycles 2008, 22, GB1022. [Google Scholar] [CrossRef]
- Wu, Y.; Miao, C.; Duan, Q.; Shen, C.; Fan, X. Evaluation and projection of daily maximum and minimum temperatures over China using the high-resolution NEX-GDDP dataset. Clim. Dyn. 2020, 55, 2615–2629. [Google Scholar] [CrossRef]
- IPCC. Summary for policymakers. In Climate Change 2021: The Physical Science Basis. Contribution of Working Group I to the Sixth Assessment Report of the Intergovernmental Panel on Climate Change; Cambridge University Press: Cambridge, UK, 2021. [Google Scholar]
- Cao, Y.; Li, W.; Zhao, B. Water requirements of spring maize in Northwest Liaoning Province under climate change. Resour. Sci. 2018, 40, 150–160. [Google Scholar] [CrossRef][Green Version]
- Kobayashi, K.; Salam, M.U. Comparing simulated and measured values using mean squared deviation and its components. Agron. J. 2000, 92, 345–352. [Google Scholar] [CrossRef]
- Zhou, T.; Yu, R. Twentieth-century surface air temperature over China and the globe simulated by coupled climate models. J. Clim. 2006, 19, 5843–5858. [Google Scholar] [CrossRef]
- Gupta, H.V.; Kling, H.; Yilmaz, K.K.; Martinez, G.F. Decomposition of the mean squared error and NSE performance criteria: Implications for improving hydrological modelling. J. Hydrol. 2009, 377, 80–91. [Google Scholar] [CrossRef]
- Kling, H.; Fuchs, M.; Paulin, M. Runoff conditions in the upper Danube basin under an ensemble of climate change scenarios. J. Hydrol. 2012, 424, 264–277. [Google Scholar] [CrossRef]
- Hamed, M.M.; Nashwan, M.S.; Shahid, S.; bin Ismail, T.; Wang, X.J.; Dewan, A.; Asaduzzaman, M. Inconsistency in historical simulations and future projections of temperature and rainfall: A comparison of CMIP5 and CMIP6 models over Southeast Asia. Atmos. Res. 2022, 265, 105927. [Google Scholar] [CrossRef]
- Jiang, Z.; Li, W.; Xu, J.; Li, L. Extreme precipitation indices over China in CMIP5 models. Part I: Model evaluation. J. Clim. 2015, 28, 8603–8619. [Google Scholar] [CrossRef]
- Jiang, D.; Wang, H.; Lang, X. Evaluation of East Asian climatology as simulated by seven coupled models. Adv. Atmos. Sci. 2005, 22, 479–495. [Google Scholar] [CrossRef]
- Wei, F.Y. Modern Climate Statistical Diagnosis and Prediction Technology; Meteorological Press: Beijing, China, 1999; p. 269. [Google Scholar]
- Guo, Y.; Dong, W.; Ren, F.; Zha, Z.; Huang, J. Surface air temperature simulations over China with CMIP5 and CMIP3. Adv. Clim. Change Res. 2013, 4, 145–152. [Google Scholar] [CrossRef]
- Xu, Y.; Xu, C. Preliminary assessment of simulations of climate changes over China by CMIP5 multi-models. Atmos. Ocean. Sci. Lett. 2012, 5, 489–494. [Google Scholar] [CrossRef]
- Hu, Q.; Jiang, D.; Fan, G. Evaluation of CMIP5 models over the Qinghai-Tibetan Plateau. Chin. J. Atmos. Sci. 2014, 38, 924–938. [Google Scholar] [CrossRef]
- Easterling, D.R.; Horton, B.; Jones, P.D.; Peterson, T.C.; Karl, T.R.; Parker, D.E.; Salinger, M.J.; Razuvayev, V.; Plummer, N.; Folland, C.K. Maximum and minimum temperature trends for the globe. Science 1997, 277, 364–367. [Google Scholar] [CrossRef]
- Wang, K.; Clow, G.D. The Diurnal Temperature Range in CMIP6 Models: Climatology, Variability, and Evolution. J. Clim. 2020, 33, 8261–8279. [Google Scholar] [CrossRef]
- Xia, J.; Yan, Z.; Jia, G.; Zeng, H.; Jones, P.D.; Zhou, W.; Zhang, A. Projections of the advance in the start of the growing season during the 21st century based on CMIP5 simulations. Adv. Atmos. Sci. 2015, 32, 831–838. [Google Scholar] [CrossRef]
- Kamworapan, S.; Surussavadee, C. Evaluation of CMIP5 global climate models for simulating climatological temperature and precipitation for Southeast Asia. Adv. Meteorol. 2019, 2019, 1067365. [Google Scholar] [CrossRef]
- Hamal, K.; Sharma, S.; Talchabhadel, R.; Ali, M.; Dhital, Y.P.; Xu, T.; Dawadi, B. Trends in the Diurnal Temperature Range over the Southern Slope of Central Himalaya: Retrospective and Prospective Evaluation. Atmosphere 2021, 12, 1683. [Google Scholar] [CrossRef]
- You, Q.; Wang, D.; Jiang, Z.; Kang, S. Diurnal temperature range in CMIP5 models and observations on the Tibetan Plateau. Q. J. R. Meteorol. Soc. 2017, 143, 1978–1989. [Google Scholar] [CrossRef]
- Sun, X.; Ren, G.; You, Q.; Ren, Y.; Xu, W.; Xue, X.; Zhang, P. Global diurnal temperature range (DTR) changes since 1901. Clim. Dyn. 2019, 52, 3343–3356. [Google Scholar] [CrossRef]
| No. | Model Name | Institution (Country) | Resolution (Lat × Lon) | Realization |
|---|---|---|---|---|
| 1 | ACCESS-CM2 | CSIRO-ARCCSS (Australia) | 1.875° × 1.25° | r1i1p1f1 |
| 2 | ACCESS-ESM1-5 | CSIRO (Australia) | 1.875° × 1.24° | r1i1p1f1 |
| 3 | AWI-CM-1-1-MR | AWI (Germany) | 0.9375° × 0.9375° | r1i1p1f1 |
| 4 | AWI-ESM-1-1-LR | AWI (Germany) | 1.875° × 1.875° | r1i1p1f1 |
| 5 | BCC-CSM2-MR | BCC (China) | 1.125° × 1.125° | r1i1p1f1 |
| 6 | BCC-ESM1 | BCC (China) | 2.8125 × 2.8125 | r1i1p1f1 |
| 7 | CanESM5 | CCCma (Canada) | 2.8125° × 2.8125° | r1i1p1f1 |
| 8 | EC-Earth3 | EC (European Community) | 0.703° × 0.703° | r1i1p1f1 |
| 9 | EC-Earth3-Veg | EC (European Community) | 0.703° × 0.703° | r1i1p1f1 |
| 10 | EC-Earth3-Veg-LR | EC (European Community) | 1.125° × 1.125° | r1i1p1f1 |
| 11 | FGOALS-f3-L | CAS (China) | 1.25° × 1.25° | r1i1p1f1 |
| 12 | FGOALS-g3 | CAS (China) | 2.0° × 2.0° | r1i1p1f1 |
| 13 | GFDL-CM4 | NOAA-GFDL (America) | 1.25° × 1.25° | r1i1p1f1 |
| 14 | GFDL-ESM4 | NOAA-GFDL (America) | 1.25° × 1.0° | r1i1p1f1 |
| 15 | GISS-E2-1-G | NASA-GISS (America) | 2.5° × 2.0° | r1i1p1f1 |
| 16 | INM-CM4-8 | INM (Russia) | 2.0° × 1.5° | r1i1p1f1 |
| 17 | INM-CM5-0 | INM (Russia) | 2.0° × 1.6° | r1i1p1f1 |
| 18 | IPSL-CM6A-LR | IPSL (France) | 2.5° × 1.25° | r1i1p1f1 |
| 19 | KIOST-ESM | KIOST (Korea) | 1.875° × 1.875° | r1i1p1f1 |
| 20 | MIROC6 | MIROC (Japan) | 1.40625° × 1.40625° | r1i1p1f1 |
| 21 | MPI-ESM-1-2-HAM | MPI-M (Germany) | 1.975° × 1.975° | r1i1p1f1 |
| 22 | MPI-ESM1-2-HR | MPI-M (Germany) | 0.9375° × 0.9376° | r1i1p1f1 |
| 23 | MPI-ESM1-2-LR | MPI-M (Germany) | 1.875° × 1.875° | r1i1p1f1 |
| 24 | MRI-ESM2-0 | MRI (Japan) | 1.125° × 1.126° | r1i1p1f1 |
| 25 | NESM3 | NUIST (China) | 1.875° × 1.875° | r1i1p1f1 |
| 26 | NorESM2-MM | NCC (Norway) | 1.25° × 0.9375° | r1i1p1f1 |
| Index | EC-Earth3-Veg-LR | EC-Earth3 | GFDL-CM4 | |
|---|---|---|---|---|
| Climatology | RMSE | 1.098 | 1.116 | 0.865 |
| KGE | 0.818 | 0.821 | 0.455 | |
| Interannual variability | SD | 0.248 | 0.278 | 0.260 |
| KGE | 0.358 | 0.404 | 0.262 | |
| Overall | CRI | 0.865 | 0.808 | 0.808 |
| Scenario | NEC | NC | SWC | CY | NWC | Cultivation Areas |
|---|---|---|---|---|---|---|
| SSP245 | 0.382 | −0.149 | −0.223 | −0.043 | −0.094 | −0.151 |
| SSP585 | −0.556 | −0.097 | −0.092 | 0.005 | −0.212 | −0.207 |
| Region | NEC | NC | SWC | CY | NWC | Cultivation Areas | |
|---|---|---|---|---|---|---|---|
| SSP245 | Annual | 63.78% | 16.48% | 60.38% | 20.43% | 57.13% | 45.90% |
| Sig. proportion | 1.15% | 6.99% | 0.32% | 15.10% | 9.81% | 6.07% | |
| Growing season | 80.02% | 7.28% | 61.97% | 46.50% | 24.28% | 45.36% | |
| Sig. proportion | 3.44% | 16.70% | 0.00% | 19.55% | 27.30% | 12.92% | |
| SSP585 | Annual | 100.00% | 40.62% | 53.01% | 87.36% | 93.62% | 76.28% |
| Sig. proportion | 0.00% | 0.00% | 0.00% | 0.00% | 0.00% | 0.00% | |
| Growing season | 100.00% | 25.02% | 88.27% | 25.27% | 91.77% | 70.09% | |
| Sig. proportion | 0.00% | 23.99% | 0.00% | 1.28% | 0.00% | 4.96% |
Publisher’s Note: MDPI stays neutral with regard to jurisdictional claims in published maps and institutional affiliations. |
© 2022 by the authors. Licensee MDPI, Basel, Switzerland. This article is an open access article distributed under the terms and conditions of the Creative Commons Attribution (CC BY) license (https://creativecommons.org/licenses/by/4.0/).
Share and Cite
Xie, W.; Wang, S.; Yan, X. Evaluation and Projection of Diurnal Temperature Range in Maize Cultivation Areas in China Based on CMIP6 Models. Sustainability 2022, 14, 1660. https://doi.org/10.3390/su14031660
Xie W, Wang S, Yan X. Evaluation and Projection of Diurnal Temperature Range in Maize Cultivation Areas in China Based on CMIP6 Models. Sustainability. 2022; 14(3):1660. https://doi.org/10.3390/su14031660
Chicago/Turabian StyleXie, Wenqiang, Shuangshuang Wang, and Xiaodong Yan. 2022. "Evaluation and Projection of Diurnal Temperature Range in Maize Cultivation Areas in China Based on CMIP6 Models" Sustainability 14, no. 3: 1660. https://doi.org/10.3390/su14031660
APA StyleXie, W., Wang, S., & Yan, X. (2022). Evaluation and Projection of Diurnal Temperature Range in Maize Cultivation Areas in China Based on CMIP6 Models. Sustainability, 14(3), 1660. https://doi.org/10.3390/su14031660


