Abstract
Thermal comfort can impact the general behavior of the occupants, and considering that humans currently perform 90% of their daily work indoors, it is necessary to improve the accuracy of thermal comfort assessments, and a correct selection of variables could make this possible. However, no review integrates all the variables that could influence thermal comfort evaluation, which relates them to their respective capture devices. For this reason, this research identifies all the variables that influence the thermal comfort of a building, together with the measurement tools for these variables, evaluating the relevance of each one in the research carried out to date. For this purpose, a systematic literature review was carried out by analyzing a set of articles selected under certain defined inclusion/exclusion criteria. In this way, it became evident that the most used variables to measure thermal comfort are the same as those used by the predicted mean vote (PMV) model; however, research focused on the behavior of the occupants has focused on new variables that seek to respond to individual differences in human thermal perception.
1. Introduction
The quality of the environment has a relevant influence on people’s physical and mental health. Therefore, and considering that 90% of human beings perform 90% of their daily work in indoor environments, it is important to control indoor air quality and comfort for the occupants [1]. Thus, it has been sought to achieve greater comfort and satisfaction with the indoor environment to provide an environment that does not affect the performance of the activities performed by occupants, considering alternatives that have a lower energy cost [2]. Thermal comfort is defined according to the American Society of Heating, Refrigerating, and Air-Conditioning Engineers (ASHRAE) as “the mental condition that expresses satisfaction with the thermal environment and is evaluated subjectively” [3]. This can impact occupants’ behavior, for example, in a classroom, where dissatisfaction with thermal comfort can cause a reduction in concentration and productivity, essential elements to improve the performance of students and teachers [4,5].
There are two main models used to study and analyze thermal comfort: the stationary and adaptive models. The stationary model, based on Fanger’s theoretical basis, is based on the thermal balance that the human body undergoes with the environment, under the same air conditioning conditions throughout the study, where thermal comfort is evaluated as the combination of environmental factors and individual factors employing an equation called predicted mean vote (PMV). This is an index that predicts and represents the mean vote of thermal sensation on a standard scale for many people under certain combinations of variables given by the indoor thermal environment [3,6]. On the other hand, in the adaptive model, the user is an active actor who interacts with their environment, adapting it according to their preferences and comfort, considering that environmental conditions can vary and do not remain static, giving way to naturally ventilated spaces. In this way, human thermal comfort combines the subjective sensation of a group of people and the objective interaction with the surrounding environment [2,7].
Now, in terms of using each model, different approaches to indoor climate research are adopted depending on the researcher’s specialty. First, engineers are inclined toward deterministic research results with a stationary approach since it fits their view of the role of a stable climate in an indoor environment, where occupants are not expected to attenuate it or interact significantly with their environment. On the other hand, architects are inclined to consider occupants interacting with their environment, adapting it better to their needs and expectations, through strategies such as opening windows or building orientation rather than considering static and unchanging environments [8,9].
However, both the adaptive and stationary models do not consider the individuality of occupants in thermal comfort, as both approaches have been developed based on the responses of large groups of people. These two models do not use several static and dynamic factors that influence occupants’ satisfaction with their thermal environment [10]. Static factors, e.g., gender, are independent of time, whereas dynamic factors, e.g., acclimatization or age, contribute to the change in thermal comfort over time [11].
Thus, more and more research has focused on studying these new variables, where the understanding of the causes of individual differences in human thermal perception has gained popularity in recent studies on comfort [12]. For example, in Wang L. et al. [13], a model is developed based on the neutral clothing variable, looking at the influence of contextual factors. On the other hand, Wang X. et al. [14] address individual occupant differences in thermal comfort, the variables that produce it, and possible solutions to address these problems.
Thus, understanding the importance and effectiveness of variables will facilitate the development of solutions to minimize negative impacts. A correct selection of variables could improve the accuracy of predictions when using the results of traditional analytical models. Added to this, the acquisition of data from the environment is the first step on the way to obtain information from the environment—i.e., through different capture devices for the variables encountered, it is possible to obtain information with useful and relevant meaning, an implication or input for decisions or actions [15].
Currently, the ASHRAE Global Thermal Comfort Database II [16] is an online database covering many variables that influence thermal comfort, containing objective climatic observations from field studies in indoor environments with the corresponding subjective evaluations measured at the time of building occupants [17]. However, no review integrates and reviews all the variables that influence thermal comfort, both the stationary model and the adaptive and dynamic ones.
In this context, this research aimed to identify all the variables that influence the thermal comfort of a building through a literature review that can represent the relevance of each factor in various investigations of thermal comfort. In addition, it sought to identify the devices and tools for capturing these variables, to discuss the conditions that should be considered at the time of making the measurements. In this way, this article aims to contribute to future research that seeks to include new variables in studies. By analyzing the most relevant variables in the literature, both the traditional ones used in existing models and the variables attributable to occupants, we seek to contribute to improving the accuracy of thermal comfort measurements.
2. Materials and Methods
To meet the aim of this research, a bibliometric study was carried out and, subsequently, a systematic literature review. Through a qualitative and quantitative analysis, a set of selected articles were analyzed under certain parameters that are in accordance with the objectives of this study research. Complementarily, through the review carried out, the metrics of the associated publications were analyzed, in addition to an analysis and discussion through a manual review of the variables that affect thermal comfort.
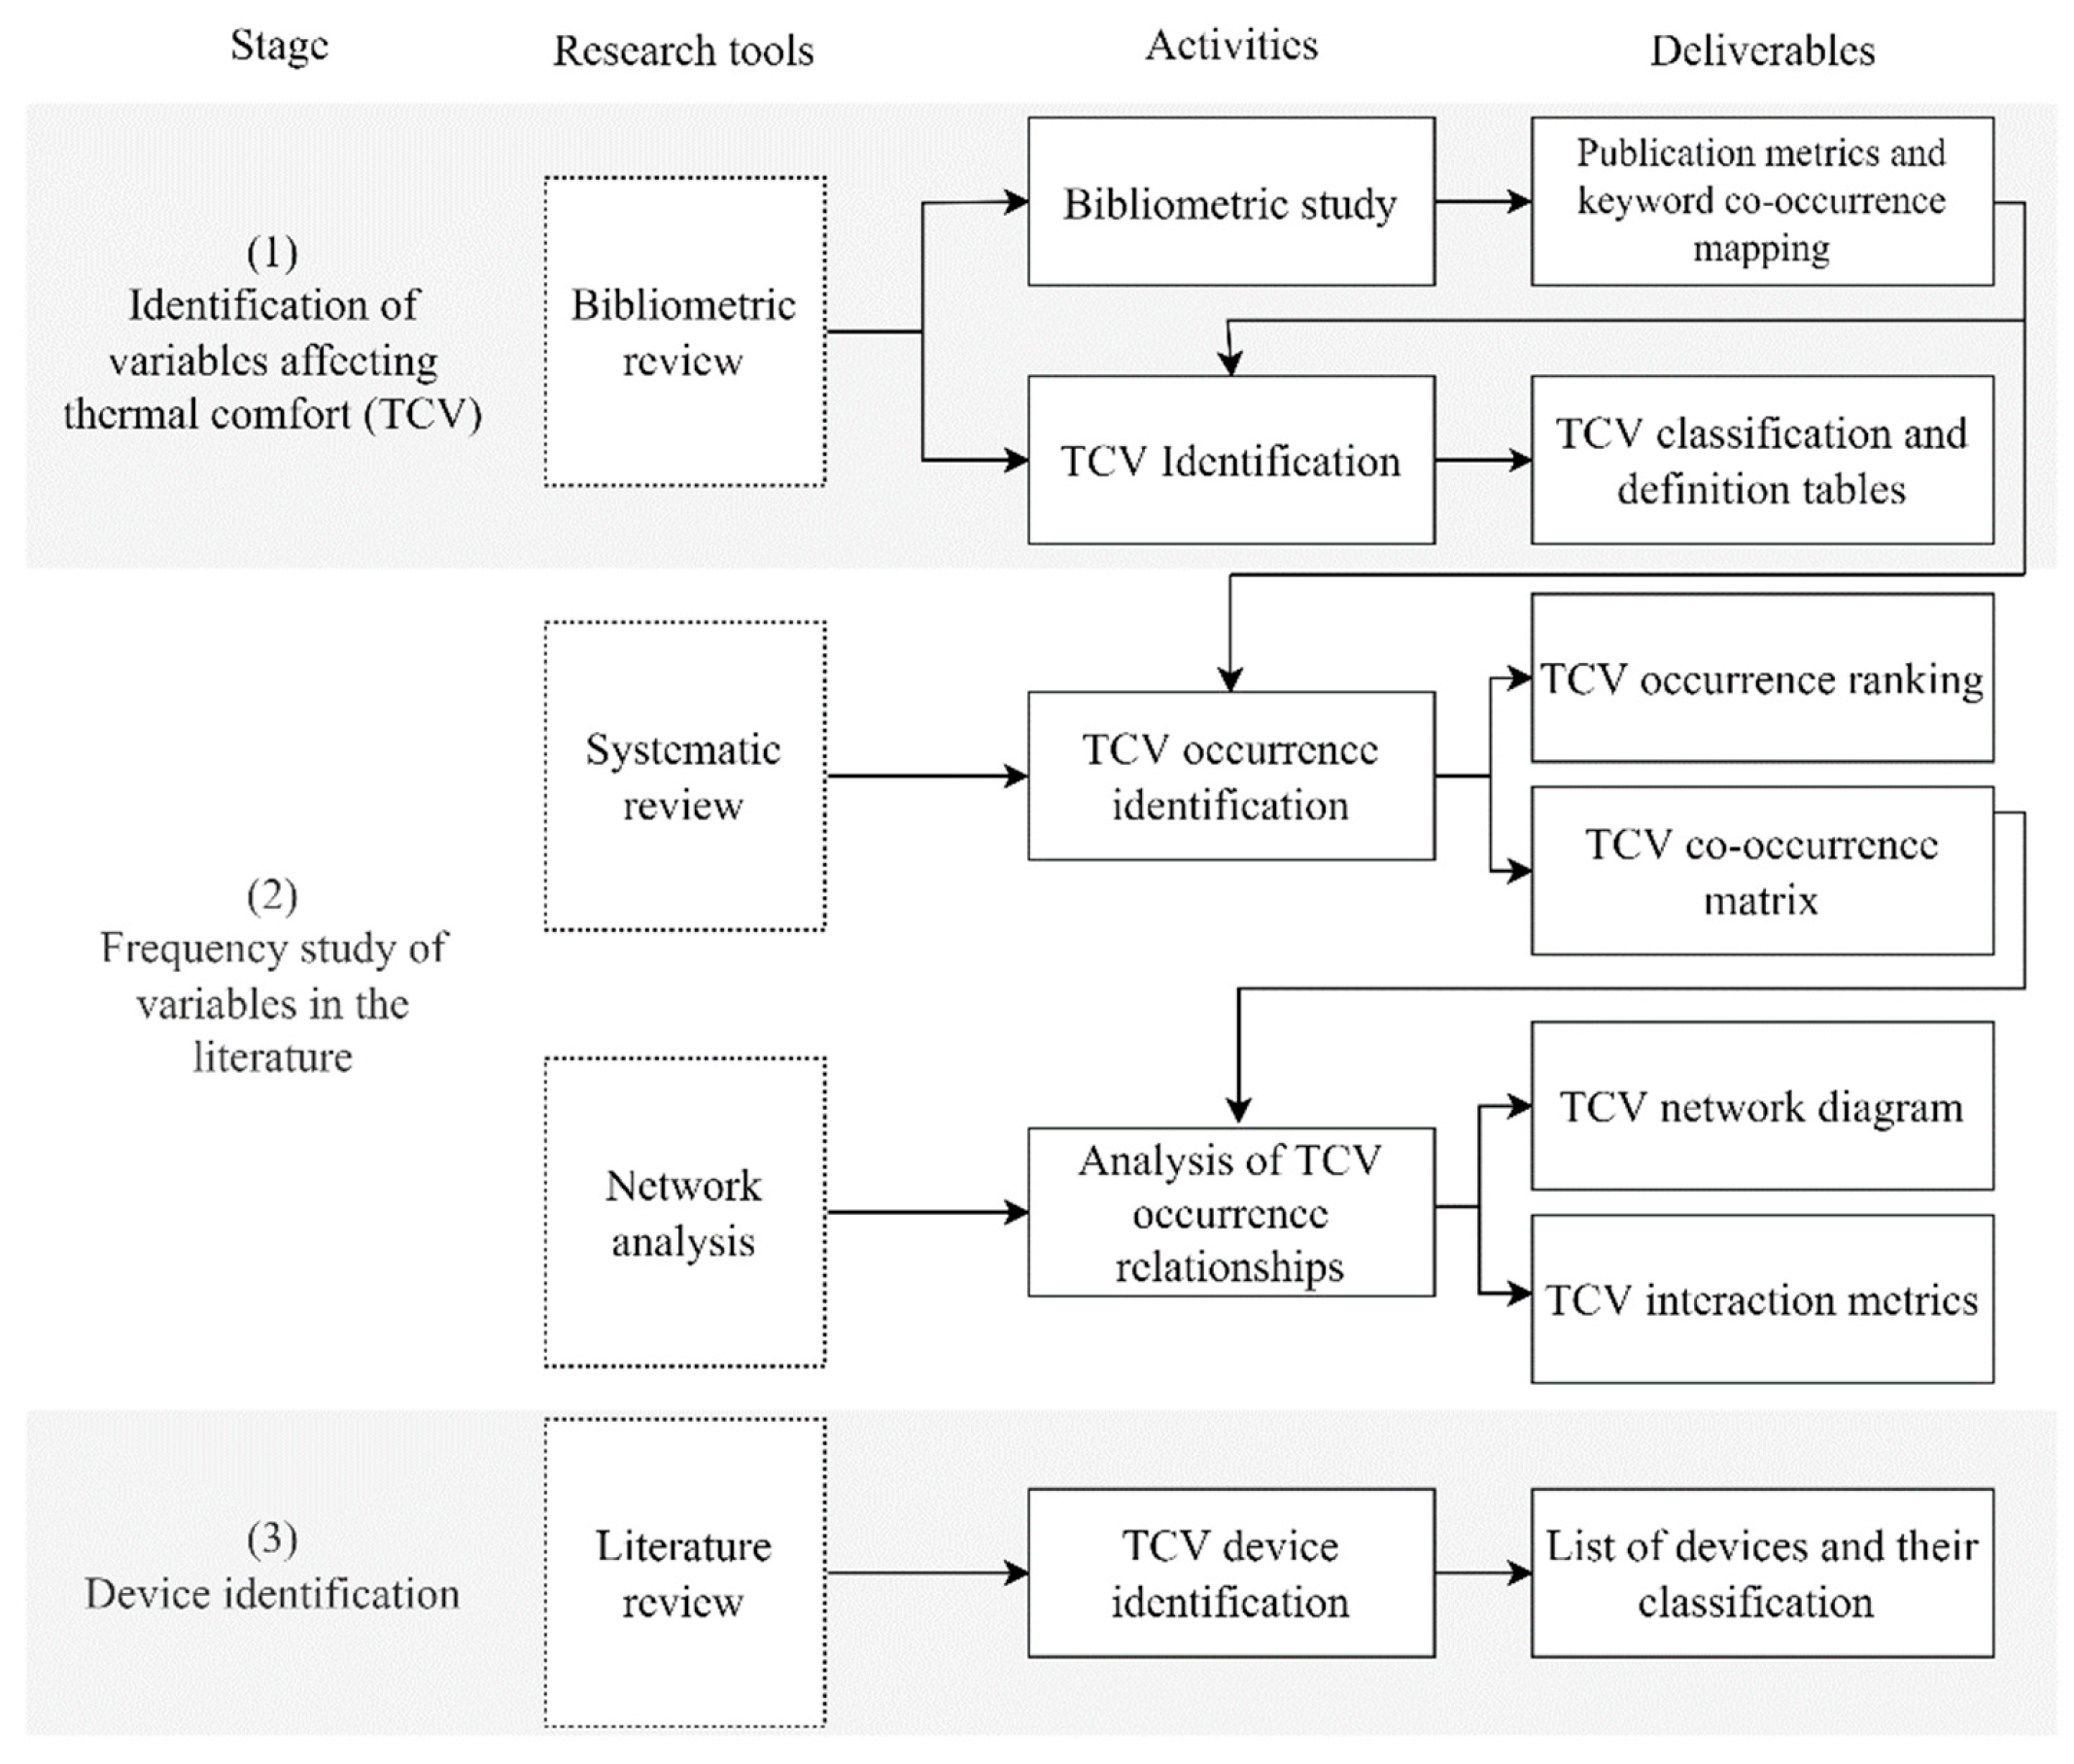
The work is divided into three main stages: (1) identification of variables affecting thermal comfort, (2) frequency study of variables in the literature, and (3) identification of devices to capture the variables. Figure 1 shows the tools, activities, and deliverables for each of the stages this research addresses, where the acronym TCV refers to “thermal comfort variables”.
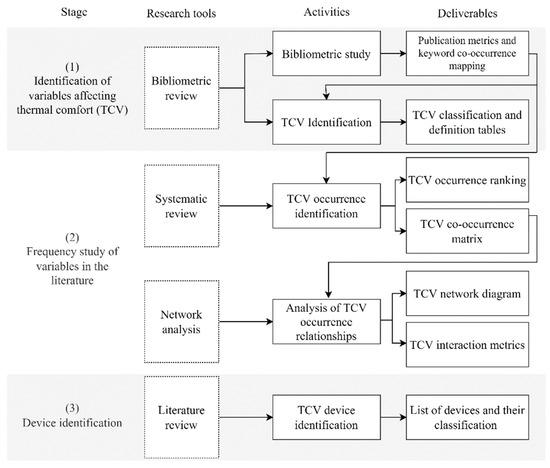
Figure 1.
Research methodology.
2.1. Identification of Variables Affecting Thermal Comfort
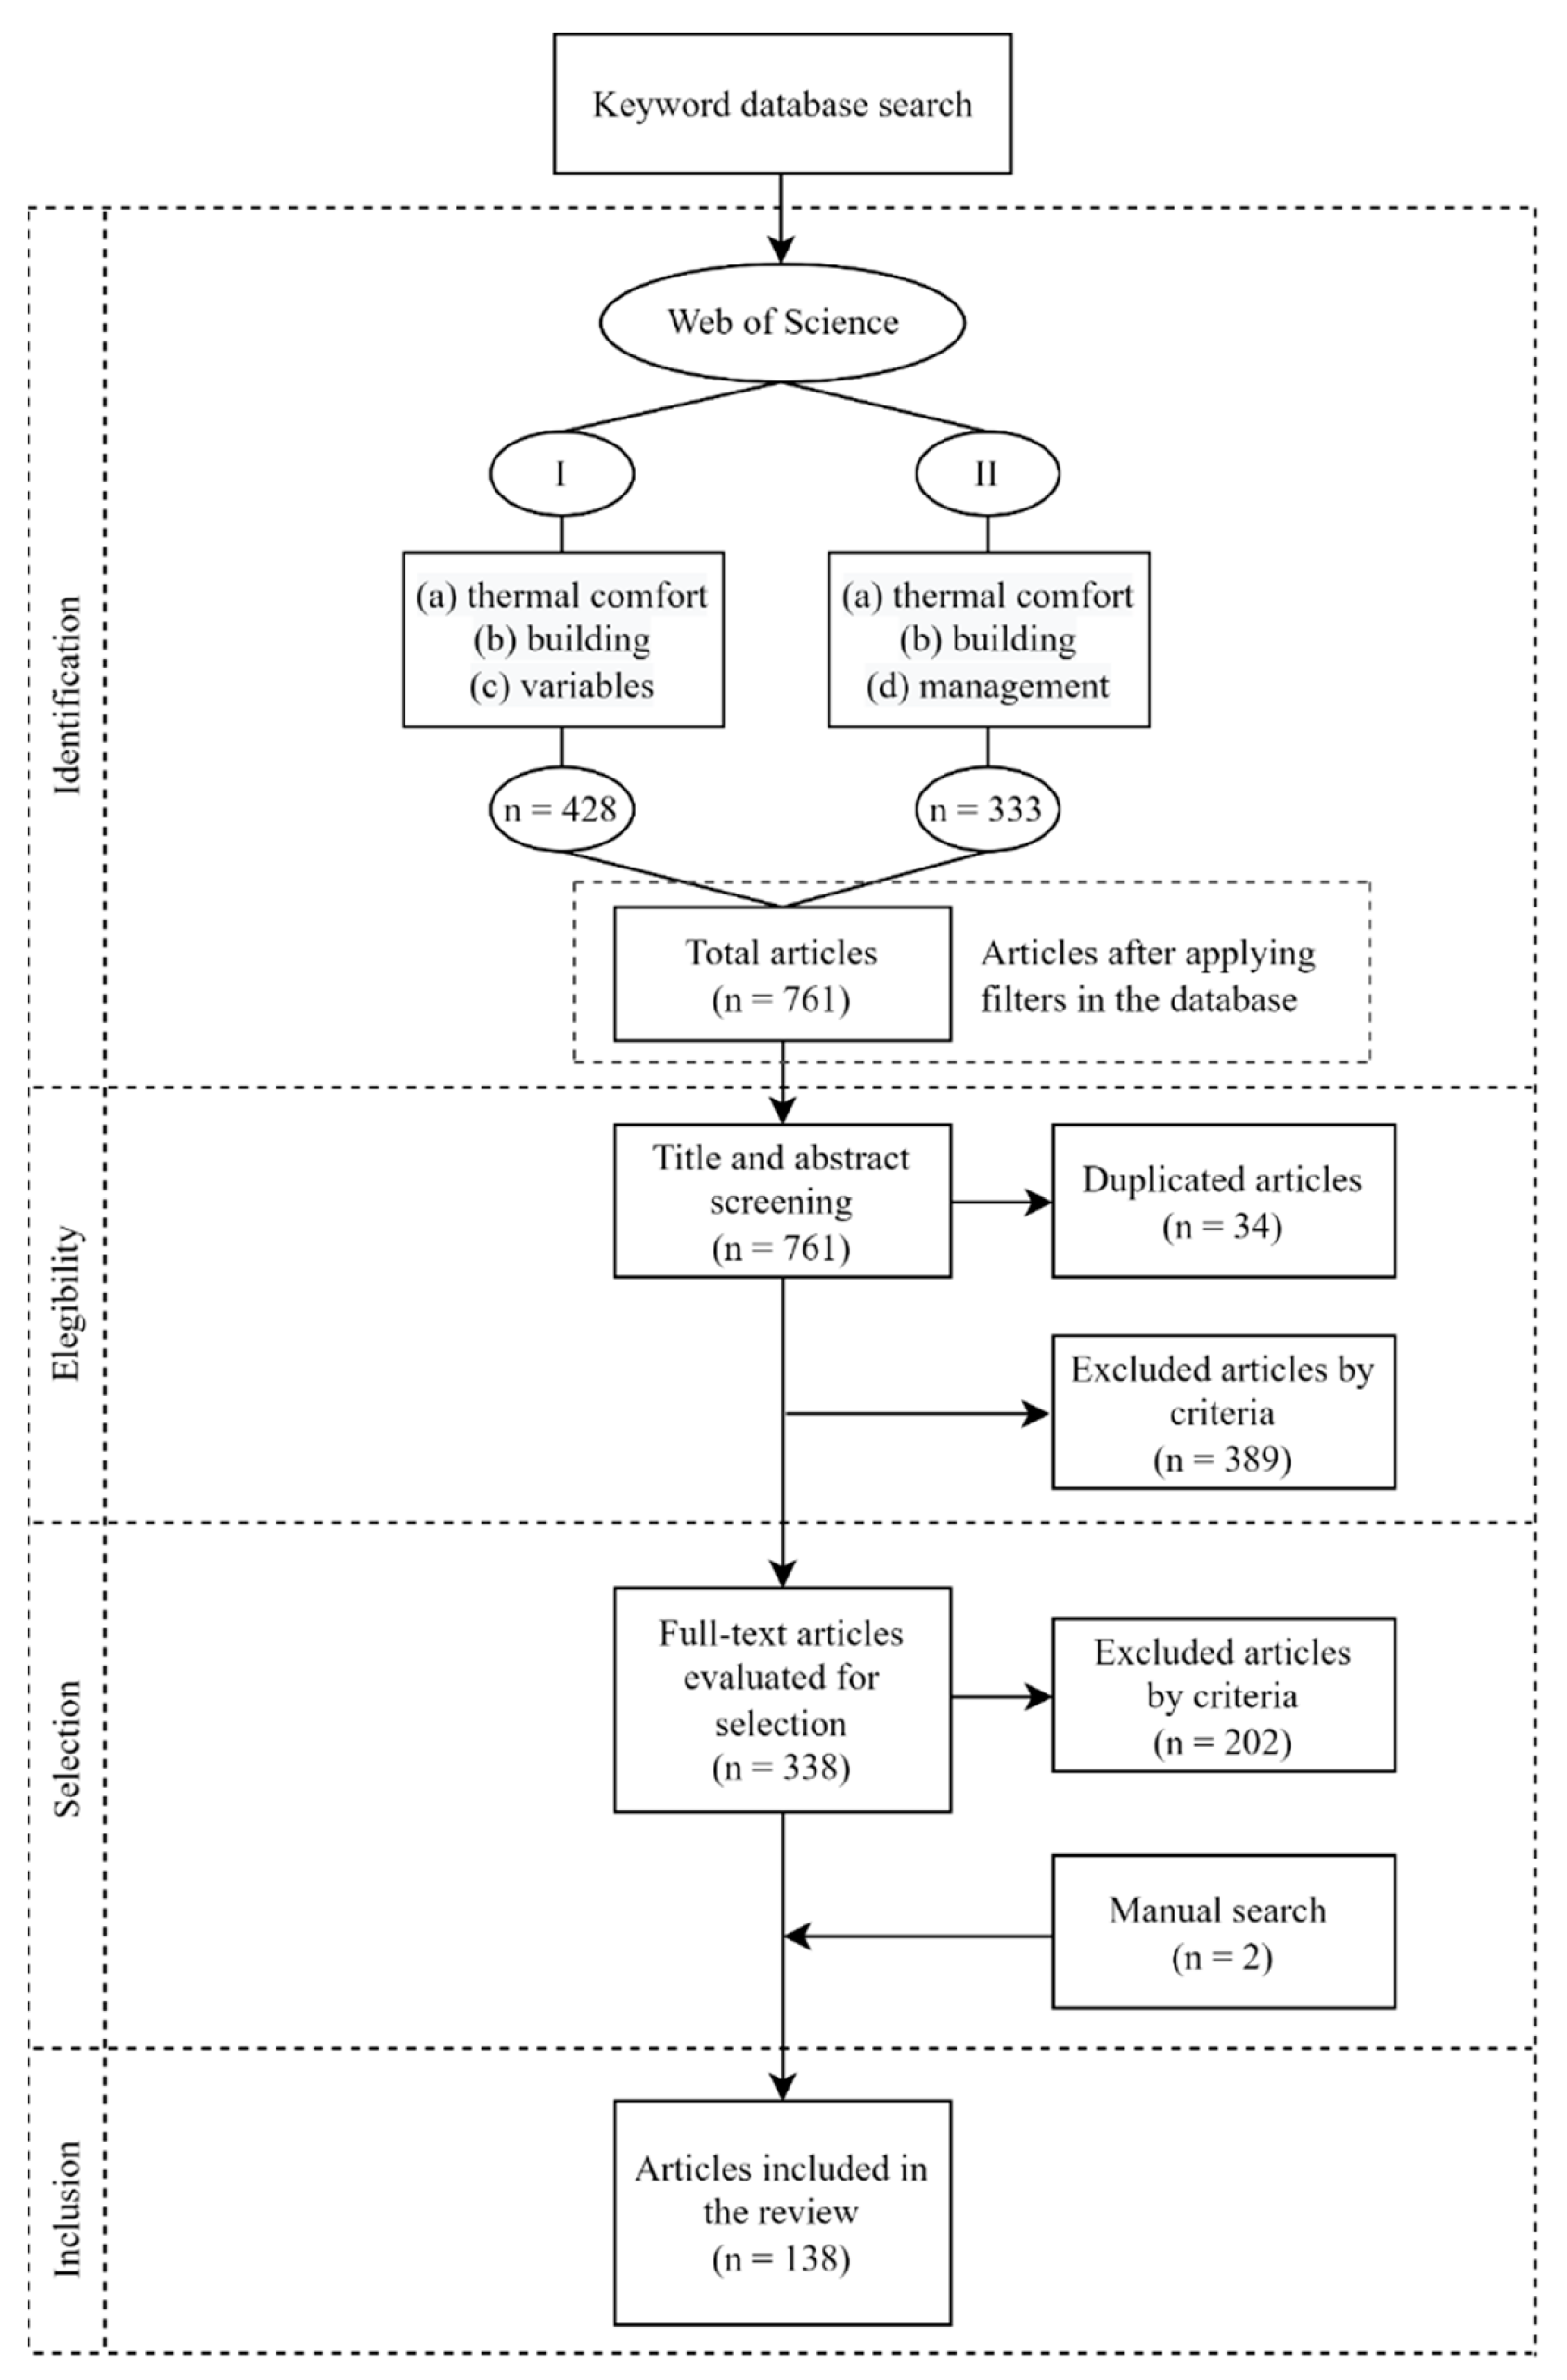
First, a systematic review was carried out to identify, select, and include the articles to be evaluated in this study, following the guidelines of the Preferred Reporting Items for Systematic Reviews and Meta-Analyses (PRISMA) methodology. Figure 2 shows the phases followed to obtain the publications analyzed in this study.
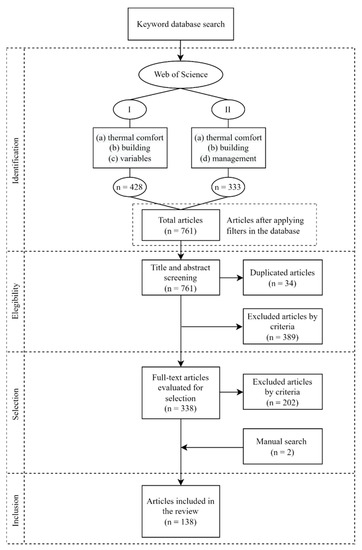
Figure 2.
PRISMA flow diagram for the systematic review.
For the first phase, the keywords and the database for the search were chosen. The Web of Science database was used to obtain the articles in this study since it offers a wide variety of disciplines related to the topic to be addressed in this work. The keywords selected were (a) thermal comfort, (b) building, (c) variables, and d) management. Thus, combinations I (“thermal comfort” AND “building” AND “variable”) and II (“thermal comfort” AND “building” AND “management”) were used to search for articles. Then, a series of filters was applied in the database to work with the study areas of interest to evaluate articles in this work, corresponding to (1) construction building technologies and green sustainable science technology and (2) civil and environmental engineering. Additionally, a filter was applied with the time of publications from 2001 to the present, giving 761 articles.
For the next eligibility phase, 34 duplicate publications were eliminated from reviewing titles after applying combinations I and II. Then, the articles considered relevant for evaluation in this study were filtered, where a series of inclusion and exclusion criteria were defined. Inclusion criteria included (1) articles that could study variables that affect thermal comfort, (2) case studies of buildings where thermal comfort is evaluated, (3) methodologies to evaluate thermal comfort, (4) studies that address capture technologies for thermal comfort variables, and (5) publications in journals, conferences, and reviews. On the other hand, the exclusion criteria were (1) studies in structures other than offices, residences, and educational buildings; (2) studies that address the evaluation for phases other than the operative phase of the structure; (3) studies in languages other than English or Spanish; and 4) studies without full text available.
In all, 389 articles were excluded through a review of title and abstract, leaving a total of 338 articles, which were filtered again through a full-text reading, thus excluding 202 articles that did not meet the inclusion/exclusion criteria to be considered in this study. In addition to this, a manual search was included within the same references of the selected studies since there were articles that could contribute to the evaluation of variables that affect thermal comfort. Thus, 2 articles were added in the inclusion phase of the publications, leaving a total of 138, which were considered for this research.
Once the set of articles was selected, a bibliometric study of the associated publications was carried out, reviewing the sources, countries with the highest incidence in research, and annual distribution of the publication. In addition, using the VOSviewer visualization tool, a map of co-occurrence of keywords of the authors was represented to analyze and rectify the central theme covered in this research and deepen the area of study. For the elaboration of the map, first, 82 terms were reduced to 55 by replacing those terms that alluded to the same concept. For example, adaptive model, adaptive thermal comfort, and adaptive comfort were unified into a single term called adaptive model, or those that alluded to the same term in plural or singular, such as educational buildings, which was unified to educational building.
Then, a systematic literature review of the articles was carried out. In this way, based on certain studies, the TCVs were defined and classified, analyzing possible repetitions or variables with the same name, to have a defined list and subsequently perform a manual search of the TCVs in the literature.
2.2. Frequency Study of LCTs in the Literature
After identifying the TCVs, a systematic literature review was carried out by searching for each variable in the articles. An Excel spreadsheet was used to create a matrix of occurrence of TCVs in the literature, where the TCVs were arranged in a row and then the articles in a column, considering the relationship between each one in case the variable was used for research purposes and not only mentioned. This allowed a count to be carried out of the TCVs in the total number of articles, with the help of which, finally, in order to obtain the ranking, the frequency of the TCVs was plotted and ordered in a histogram.
On the other hand, with the matrix of occurrence of variables in the literature, a co-occurrence matrix of TCVs was developed, corresponding to a triangular matrix where the variables are ordered in the first row. A column was used to count how many times the variable appears together in the same document, considering the matrix as an upper triangular and diagonal 0, avoiding analyzing a variable with itself. Through this quantitative work, the researchers sought to identify those variables that have a greater weight in the literature. In this way, the authors were able to analyze the impact that different approaches to thermal comfort analysis have had.
To conclude this stage, the network diagram of the TCVs was represented using Gephi software, together with the network metrics generated, so that it was possible to carry out a qualitative study by obtaining the most central variables and thus analyze those that were most influential within the network.
2.3. Identification of TCV Capture Devices
At this stage, the devices that capture each TCV were identified. A table was drawn up with the variables that could be measured and their corresponding measuring instruments, which was obtained from the classification table of variables previously used in the variable identification stage, in addition to the literature review carried out in the TCV frequency study stage, where the capture devices for TCVs were found based on certain articles.
This section discusses the main problems encountered, the need for standardization, and the guidelines required for thermal comfort evaluations to be carried out as homogeneously as possible.
3. Results and Discussion
This section presents the main results obtained from the bibliometric study and the literature review. Characterization of the articles considered in this work and a map of co-occurrence of keywords are presented. Then, the TCVs, their frequency in the literature, and network analysis are presented to determine the most influential ones. Further, the TCVs capture devices or tools and an analysis of the conditions that should be considered when making the measurements.
3.1. Characterization of Articles
This section seeks to validate the articles selected for this research. To that end, a characterization of the selected articles is presented, including an annual distribution by year of article publication, distribution of articles by country of publication, and the most influential journals of publication.
3.1.1. Associated Publications Metrics
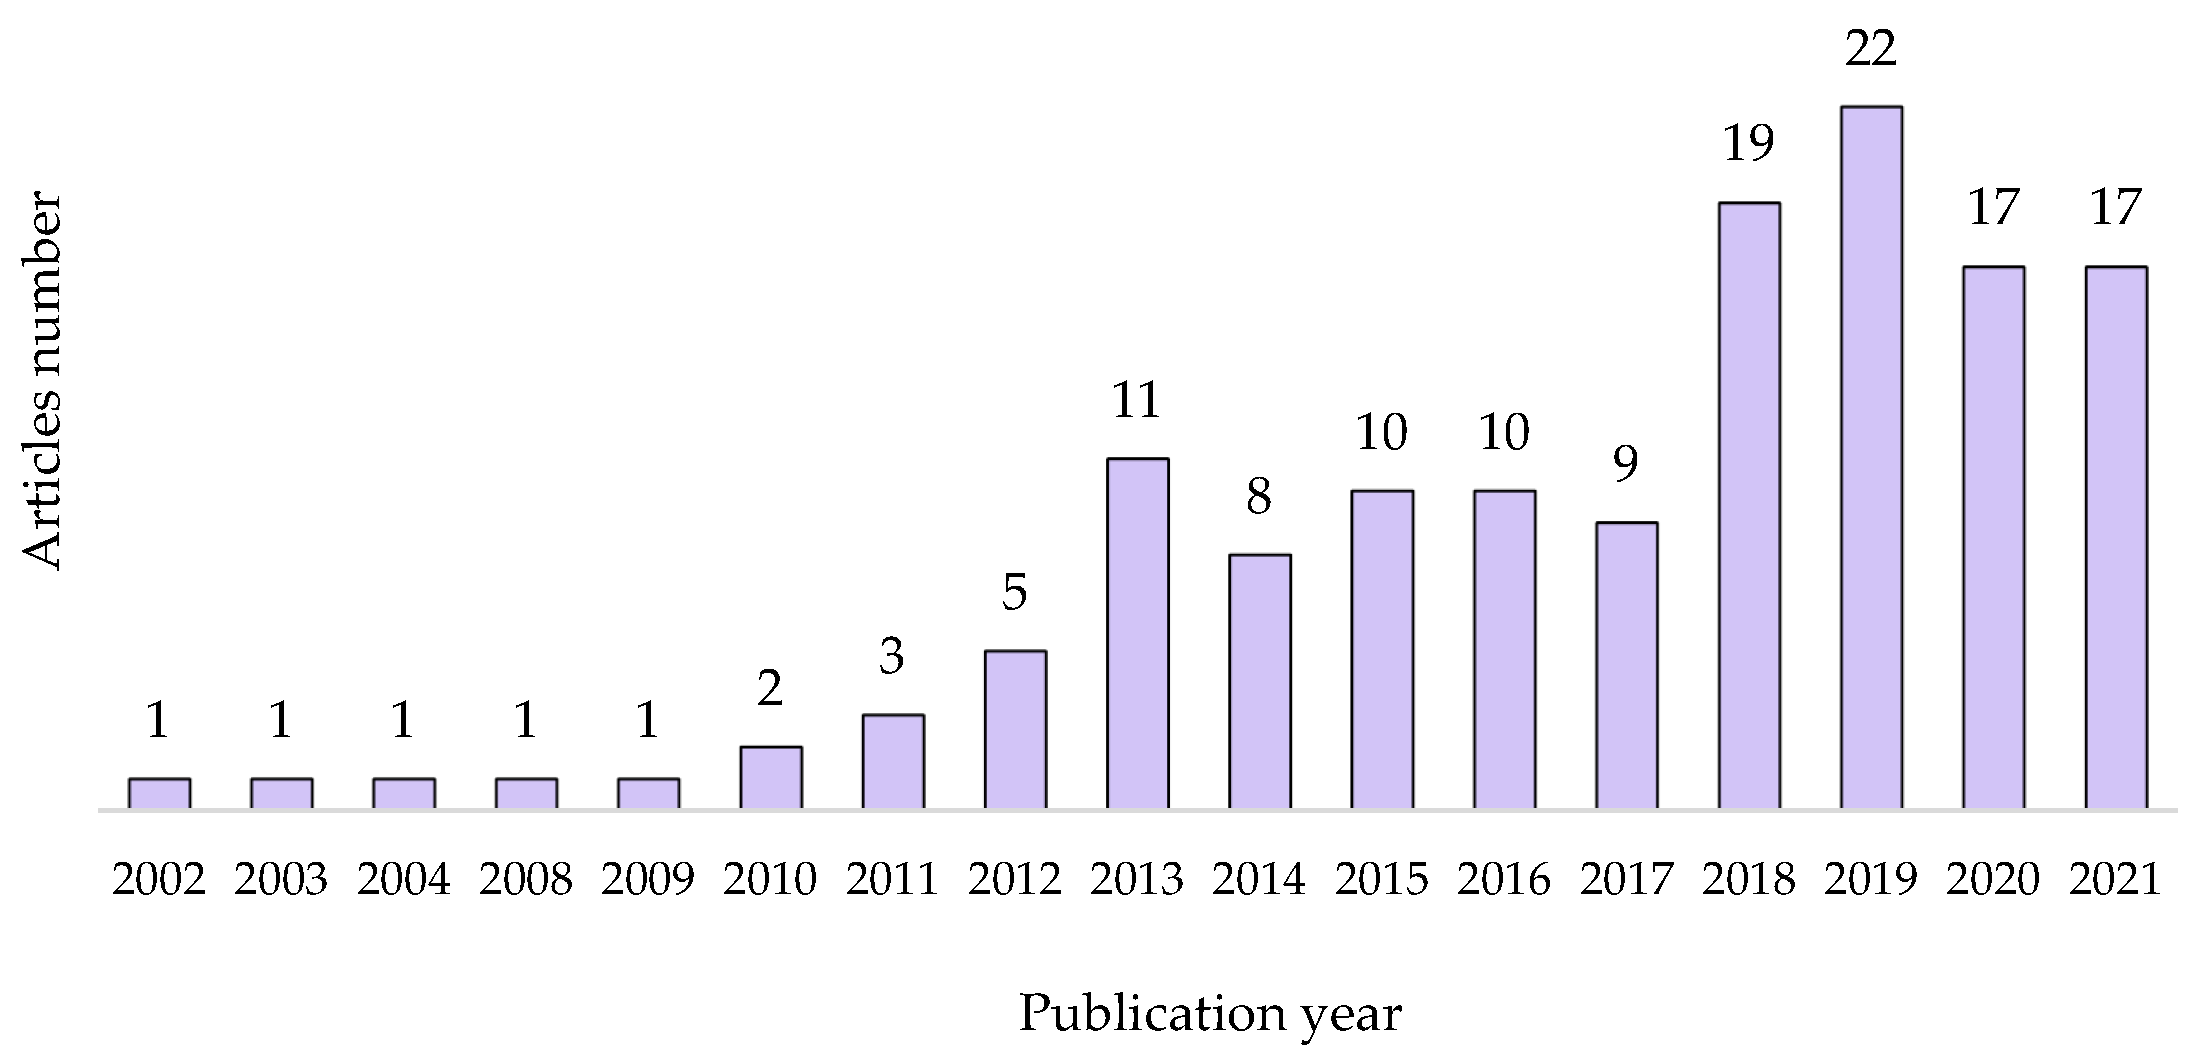
Figure 3 shows the annual distribution of publications of the selected articles. The 138 articles are distributed according to their year of publication, ranging from 2002 to 2021. Thus, it is possible to observe a trend in the increase in article publications from 2013 onwards. Then, it is visualized that the number of publications does not vary greatly, ranging between 8 and 10 annually; however, they have increased considerably since 2018.

Figure 3.
Articles’ annual distribution.
Even though for 2021, there is an incomplete number of publications due to the date of recovery of the database, there has been a growing increase in research in recent years. Based on what was observed during the review, possible causes may be the need for research on the impact of thermal comfort on people’s health and new technologies. The first is given by the climatic conditions that afflict certain areas of extreme climates, and the second by the development of automatic learning models that can optimize energy resources without transgressing the thermal comfort of occupants. It should be noted that one of the keywords used for this research was management, to focus on the operative phase of infrastructure so that within the research are monitoring systems that focus on creating ventilation and heating systems with new technologies that develop continuous learning models which deliver tools that optimize energy resources, which opens a new area of research. On the other hand, the increase in sustainable structures and energy efficiency is a topic that has gathered moment through the years, hence the increase in this research [18].
Concerning the impact of the selected articles in the literature, according to the Web of Science databases, 81% have at least one citation. Of the total, 43% have 20 or more citations.
Figure 4 shows the countries that have researched and published on thermal comfort. A light shade is observed for those countries in which fewer articles have been published, starting from a single publication, and a darker shade for those in which more research has been carried out, reaching a maximum of 22 publications. Thus, the countries with the highest scientific production on this subject are the United States, China, and the United Kingdom, with 22, 20, and 17 publications, respectively.
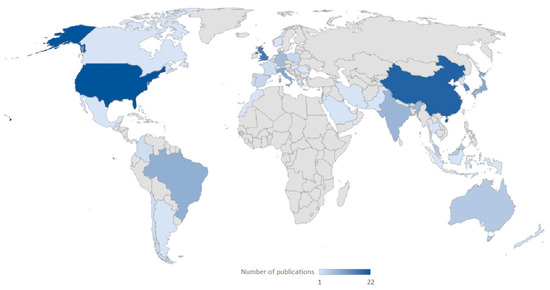
Figure 4.
Distribution of published articles by country.
It is possible to observe which countries have thermal comfort as a research front with this. Although countries appear as leaders in publications, such as the United States or the United Kingdom, some countries researching thermal comfort in health and sustainability gave their geographical location with complex climatic conditions. Examples of this are China, South Korea, Japan, India, and Brazil; as such, although China presents publications to a greater extent than the other countries, during the review, it was observed that the other countries present a large number of evaluations and field studies to visualize the conditions of occupants in the infrastructures. This was due to the extreme climatic conditions prevailing in each area, which was one of the causes for research on several occasions, as was the case with Brazil and India. One possible cause may be the prevailing climatic conditions of each area. Field studies reflected a greater variability in thermal comfort perceived by subjects based on different climates in naturally ventilated environments. Therefore, to conduct an in-depth investigation to quantify these adaptations, the collection of sufficient data from field measurements becomes a useful avenue of research.
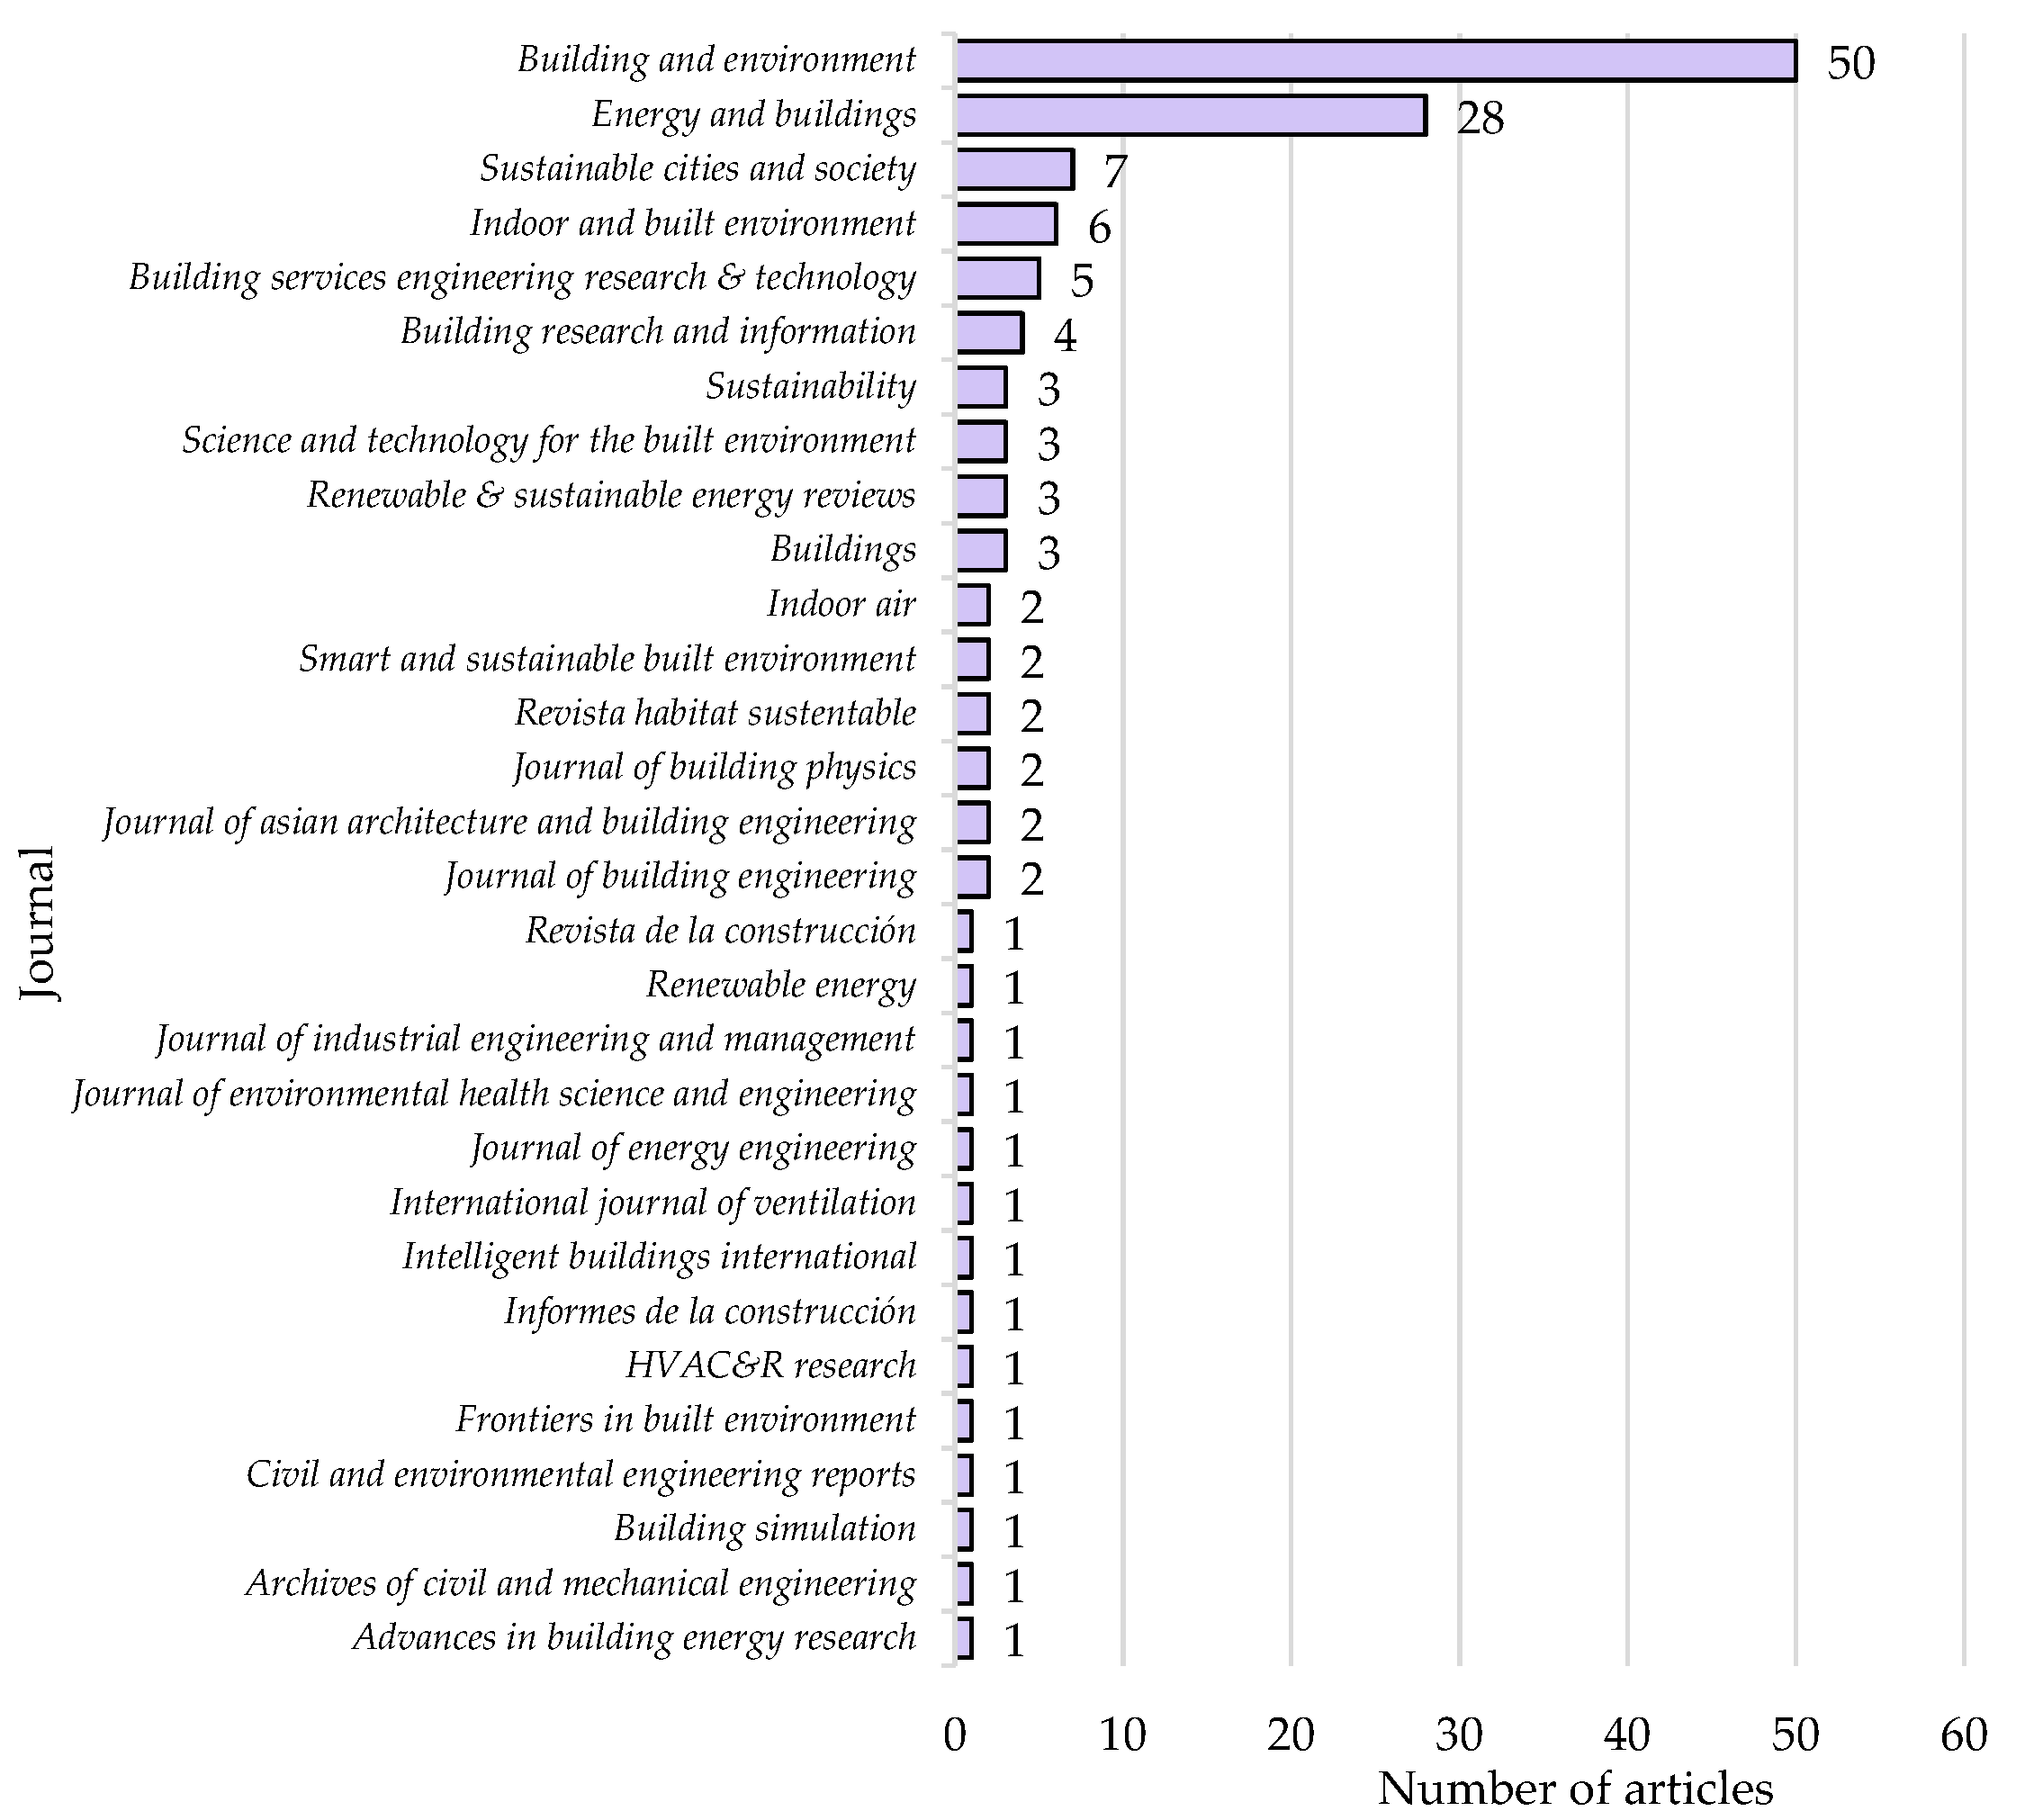
Figure 5 shows the number of articles published by the journals identified in this study. In this way, it is possible to evaluate the impact generated by thermal comfort research in the different disciplines. Of the 138 articles selected, a total of 30 journals were identified, covering research areas focused on engineering and architecture, sustainability, and energy, among other research areas. However, within these categories, it is also possible, to a lesser extent, to find journals that focus on evaluating the impacts of thermal comfort on occupants’ health. This shows that the research focuses analyzed in the articles considered in this work cover a broad spectrum of disciplines, leading to a comprehensive review of TCVs. The literature review provides many studies from which conclusions could be generalized, and certain recommendations for future work could be made.
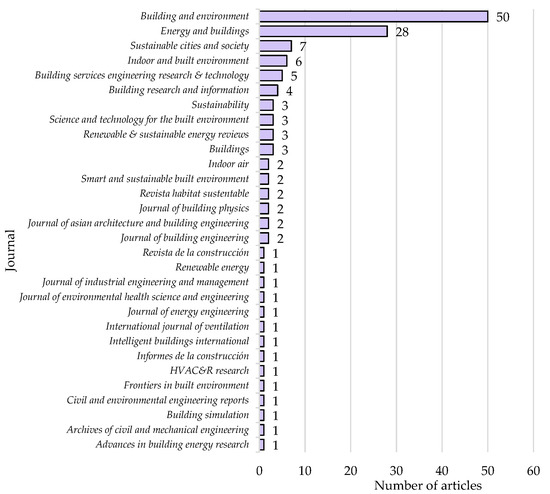
Figure 5.
Number of articles published by journal.
3.1.2. Keyword Co-Occurrence Analysis
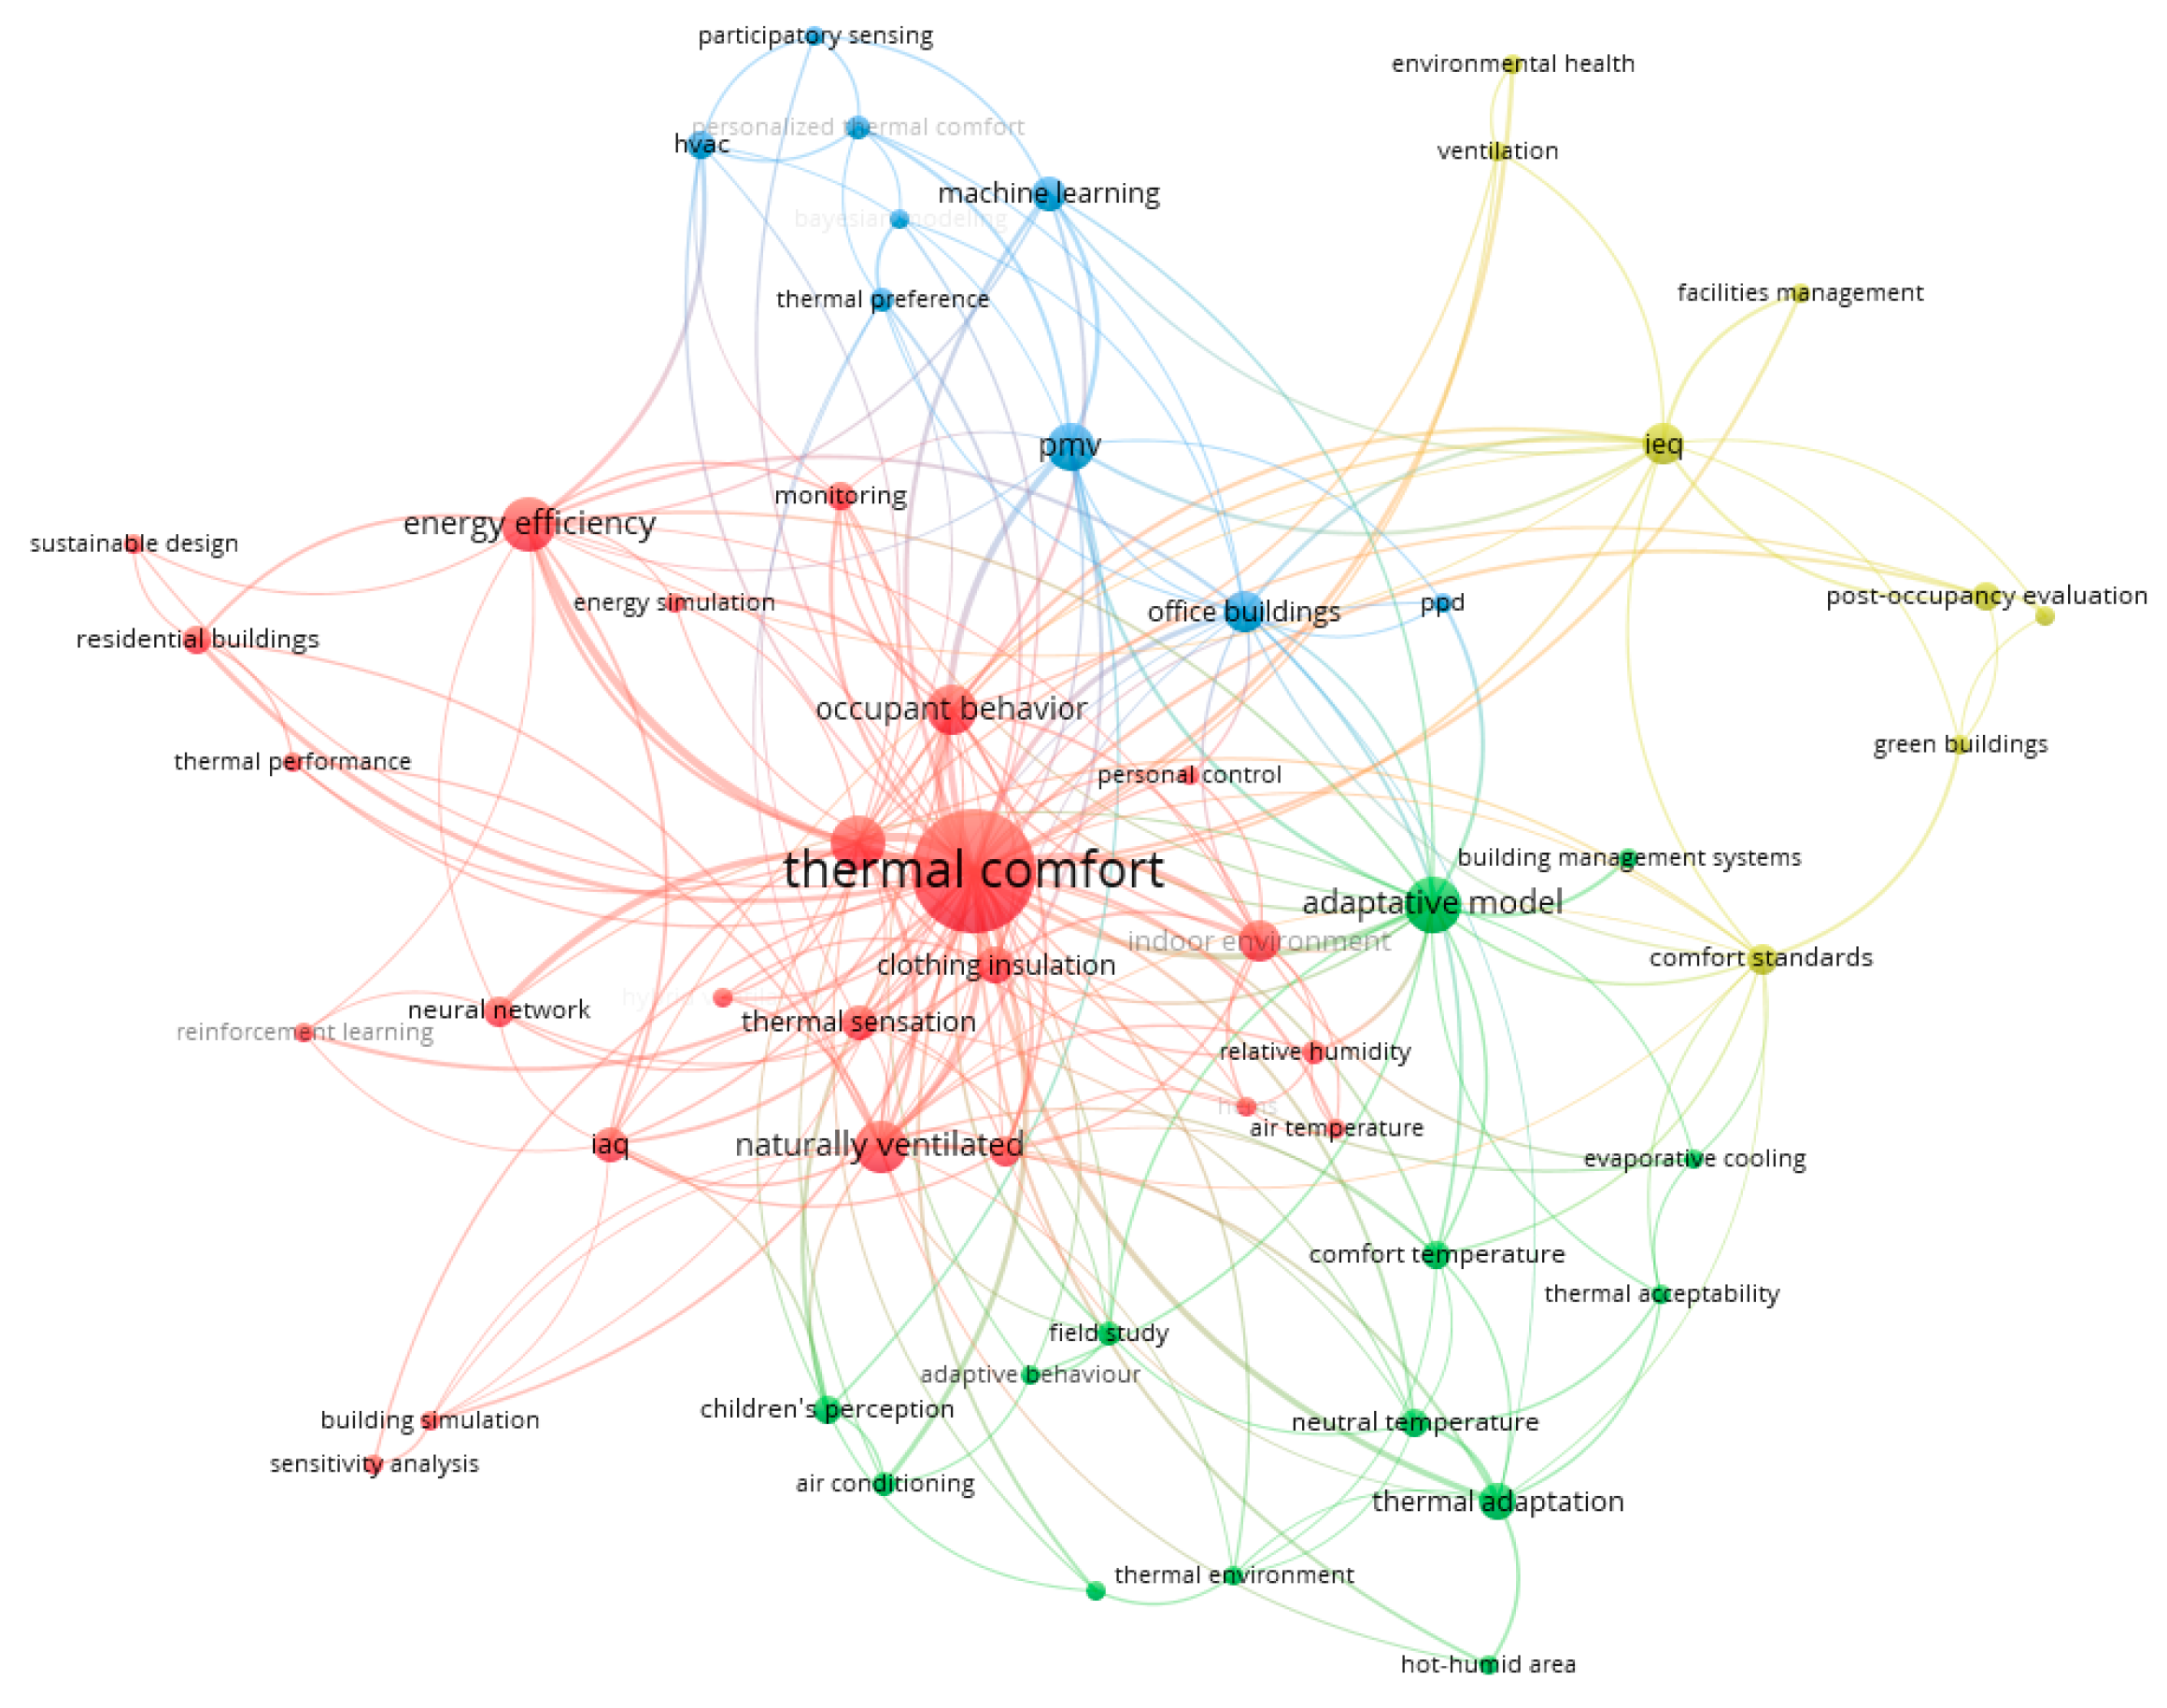
Figure 6 shows the map of co-occurrence of keywords, where each node with its respective label represents a keyword, and its size reflects the number of occurrences it had in total; the larger it is, the higher its frequency. The centrality reflects the most influential nodes within the network since they are the ones that present a greater amount of co-occurrence with another term within the network [19]. Thus, the central domain of the research is found in the thermal comfort term, being the node with the largest size and centrality within the network. With this, it is concluded that the main research area that unifies the whole network is thermal comfort and the research branches taken for its evaluation. On the other hand, the color of each node represents the grouping that VOSviewer delivers, which is called a cluster [19]. Figure 6 shows a total of four clusters represented by four different colors: the red and blue clusters correlate with energy efficiency that interrelates thermal comfort and energy optimization strategies using machine learning; and the yellow and green clusters focus on operational strategies and behavior perception.
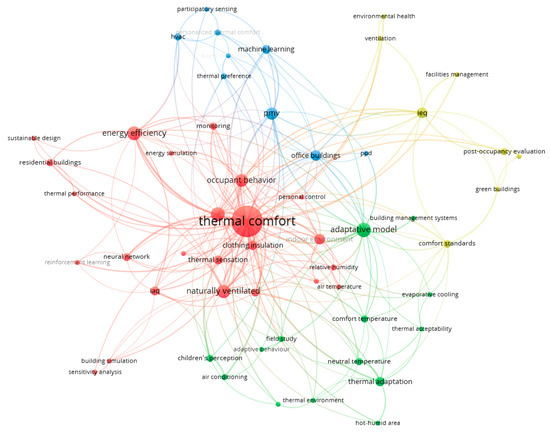
Figure 6.
Co-occurrence of authors’ keywords.
- The red cluster displays the terms thermal comfort, energy efficiency, naturally ventilated, and occupant behavior as those with the highest number of occurrences given their size. In addition, the energy efficiency term acts as an intermediary between the red and blue clusters. This cluster contains great variability of terms, including keywords of authors attributable to TCVs, such as relative humidity or air temperature, which represents that the articles in this cluster study thermal comfort from different research fronts, with a focus on one TCV or several variables.On the one hand, the personal attitudes of users represent a key factor to consider when predicting the overall thermal–energetic performance of buildings [20]. It has often been observed that the operational energy used is higher than that predicted in the design, and adaptive behavior driven by occupant comfort is a potential source of this discrepancy [21]. For example, in the field study by Liu J. et al. [22], it can be seen that, although there are central heating systems (radiators), occupants use heating equipment (heaters) to satisfy their thermal preferences.Thus, occupants’ comfort requirements regarding thermal conditions and indoor air quality in buildings represent a high energy expenditure. Therefore, in the challenge of reducing the environmental impact, it is important to understand occupants’ interactions with the indoor environment to provide comfort conditions in the most efficient way [20,22].In contrast, in naturally ventilated spaces, this ventilation condition could effectively decrease energy consumption. For example, Park B. and Lee S. [23] found that improving natural ventilation strategies reduced energy consumption by 30% compared to a mechanical ventilation strategy.
- In the blue group are those terms linked to machine learning models. Here, larger nodes are distinguished as the predicted mean vote (PMV) model, office buildings, machine learning and heating, ventilation, and air conditioning (HVAC) systems.Both PMV and adaptive models have limitations when used to predict occupant comfort in buildings under real conditions. Both models show poor predictive accuracy when applied to a small group of people or individuals because they are designed to predict the average comfort of a large group of people [24].On the other hand, machine learning is a subfield of artificial intelligence (AI) mainly concerned with programming computers to interpret complex data and evolve in performance with experience [11]. Thus, integrating machine learning algorithms with thermal comfort data analysis could be a very promising direction [25]. Predictions about the thermal preference of individuals can help HVAC systems to provide preventive or corrective control strategies to improve the comfort satisfaction of building occupants [26].This is evidenced by the growing number of such studies and model development using these techniques. For example, Kim J. et al. [26] developed a predictive model on the thermal preference of individuals based on six machine learning algorithms.Now, regarding the input parameters, different studies may vary for the development of these algorithms. However, most of them used common comfort attributes such as the same environmental and personal factors incorporated in the PMV model [25].
- The yellow color shows the cluster associated with those terms associated with the evaluations and field studies in the operational stage, evaluating based on standardized guidelines. Thus, the terms with the highest occurrence correspond to indoor environment quality (IEQ), comfort standards, and post-occupancy evaluation.IEQ refers to the quality of indoor spaces concerning the health and wellbeing of users. It is a concept that considers several components of overall indoor comfort: thermal, lighting, air quality, and acoustic [27]. Improving workplace comfort levels positively affects several domains, affecting wellbeing, productivity, energy efficiency, and related economic benefits. However, these areas may conflict each other, so managing a building during the operation phase must take all these into account to balance the weight of each aspect [28].At present, there are different standards to follow regarding the quality of the environment. There are standards for its evaluation and measurements regarding thermal comforts, such as ASHRAE and ISO7730. On the other hand, if we talk about air quality, CO2 concentration as the main variable can increase in indoor environments due to the combination of human respiration and insufficient ventilation. This is linked to thermal comfort due to the action of doors and windows. Thus, the WELL Building Standard certification recommends a certain threshold of parts per million of CO2 concentration to avoid falling into the “sick building syndrome” [29,30].
- In green color, it is possible to observe the terms adaptive model, thermal adaptation, comfortable temperature, and children’s perception. Thus, it is possible to observe that the research front of these studies is to evaluate the behavior and perception caused by thermal comfort levels in occupants.According to the adaptive approach, if a user is in a state of discomfort, they will restore their state of wellbeing [31]. Psychological adaptation has been considered the most important factor in explaining discrepancies in observed and predicted thermal sensations and acceptability [22]. People’s responses are highly dependent on their thermal experiences [32].
3.2. Variables Affecting Thermal Comfort
This section presents the variables selected for the systematic review. They are classified, and a definition is provided to contextualize each one of them. A search is conducted to determine the presence of each in the literature, and then a discussion is carried out based on the results obtained.
3.2.1. TCV Classification
Based on the article Development of the ASHRAE Global Thermal Comfort Database II [14], the categories are defined, and variables that affect thermal comfort are described in accordance with analysis in field studies. In addition, variables that were not found in the database but were relevant during the review are added, complementing the initial set of variables. It should be noted that these were classified based on what was visualized within the 138 articles analyzed, giving them the classification that resembled each of them. Thus, Table 1 classifies the TCVs. The classification column is the category to which each variable is assigned, the variable column, and finally, an identifier corresponding to an abbreviation.

Table 1.
TCV Classification.
Table 1 shows the five groups into which the TCVs are classified. Within the category of basic identifiers, some variables are attributable to contextual factors specific to each building. Given geographic location, variables such as the predominant season and climate of the area are in this category. Also within this category, we have the TCV type of structure and refrigeration, which are contextual variables to know the building and ventilation conditions. Then, this group provides in a general way the conditions for the evaluation of thermal comfort in a building.
In the category of building characteristics, two variables are given by the cooling strategy (artificial air conditioning and natural ventilation), although there is also a combination called mixed mode. However, for this study, only the first two ones mentioned are considered. There are also variables attributable to the materials of the structure, although it is important to note that this variable is not considered in greater depth in this study since the scope of the study includes a literature review at the operative stage. Therefore, the authors do not delve into construction issues by not focusing on the materials in the design stages; these are only considered in comparisons in operational structures and evaluations, among others. Finally, the structure’s orientation is taken as a particular characteristic of the infrastructure since in the same building, different rooms can have different orientations, and different conclusions can be drawn from this variable in the same structure.
For the category of personal information of the users, the TCVs contained are attributable to the occupants who are participants in an evaluation carried out on the premises of the structure to be analyzed or users in the development of a thermal comfort measurement model. Therefore, variables such as gender and age are descriptive and are variables from which conclusions can be drawn.
On the other hand, the category of user characteristics includes those TCVs that are used within the comfort measurement process, either directly, such as metabolic rate and clothing insulation, or physiological variables of the user that are part of the PMV model, or user behavioral variables, such as interaction with the environment through the opening of doors and windows or the temperature of the skin.
Finally, environmental conditions classify the physical TCVs specific to the environment, where variables that can be measured utilizing measuring devices or tools are distinguished. In addition, it should be borne in mind that differences between indoor and outdoor environment must be distinguished due to the model used, either considering static conditions for the PMV model or variations in the environment. For this reason, variables such as temperature, relative humidity, and air velocity are analyzed with an indoor/outdoor denomination.
Table 2 presents the definition of each variable found in the literature review carried out for the classified variables. However, to create Table 2, it was necessary to create an analogy between the variables found since TCVs were related to each other. For example, some variables could be obtained from another, or some variables could be found under different names but alluding to the same concept. In this way, it was possible to find relationships between the variables described throughout this study.
Table 2.
Definition of variables.
In research focused on thermal comfort, Vellei M. et al. [40] previously carried out a review of variables. It is visualized that, in certain studies, variables such as indoor temperature have usually been measured as dry bulb temperature and globe or operative temperature. However, this is identified by previous studies that have managed to find correlations or minimal variations between some temperatures, so depending on the instruments and the circumstances in which they must perform the measurements, they will opt for one variable or another [41].
One of the relationships is given by a standardization, where mean radiant temperature (MRT) is calculated from the air temperature, velocity, and globe temperature in accordance with the International Organization for Standardization (ISO 7726) [33,34]. On the other hand, for outside temperature, a concept called “running mean temperature”, calculated as a ratio based on outside temperature, was used in some thermal comfort evaluation studies. This is supported by the fact that an average of outdoor temperatures weighted in accordance with their distance in the past reflects the thermal experience better than instantaneous monthly average temperature [32,42].
In another aspect, based on the conditions of the field studies, several conditions produce the use of different concepts to refer to indoor environment temperature. For example, Dai J. and Jiang S. [43] express, according to the ANSI/ASHRAE 55 and BS EN15251 standards, the operating temperature based on indoor air temperature, air-velocity-dependent factor, and mean radiant temperature, which in turn are expressed by a relationship with globe temperature. Further, in the study by Kim A. et al. [44], due to an incomplete recording of the globe temperature, they defined the estimated operative temperature through indoor air temperature, ensuring minimal data loss via linear regression.
3.2.2. Frequency of Variables in the Literature
Based on the description TCVs in Table 2, a manual review was performed on the selected article base. As previously mentioned, the type of structure for this research corresponds to offices, residences, and educational buildings.
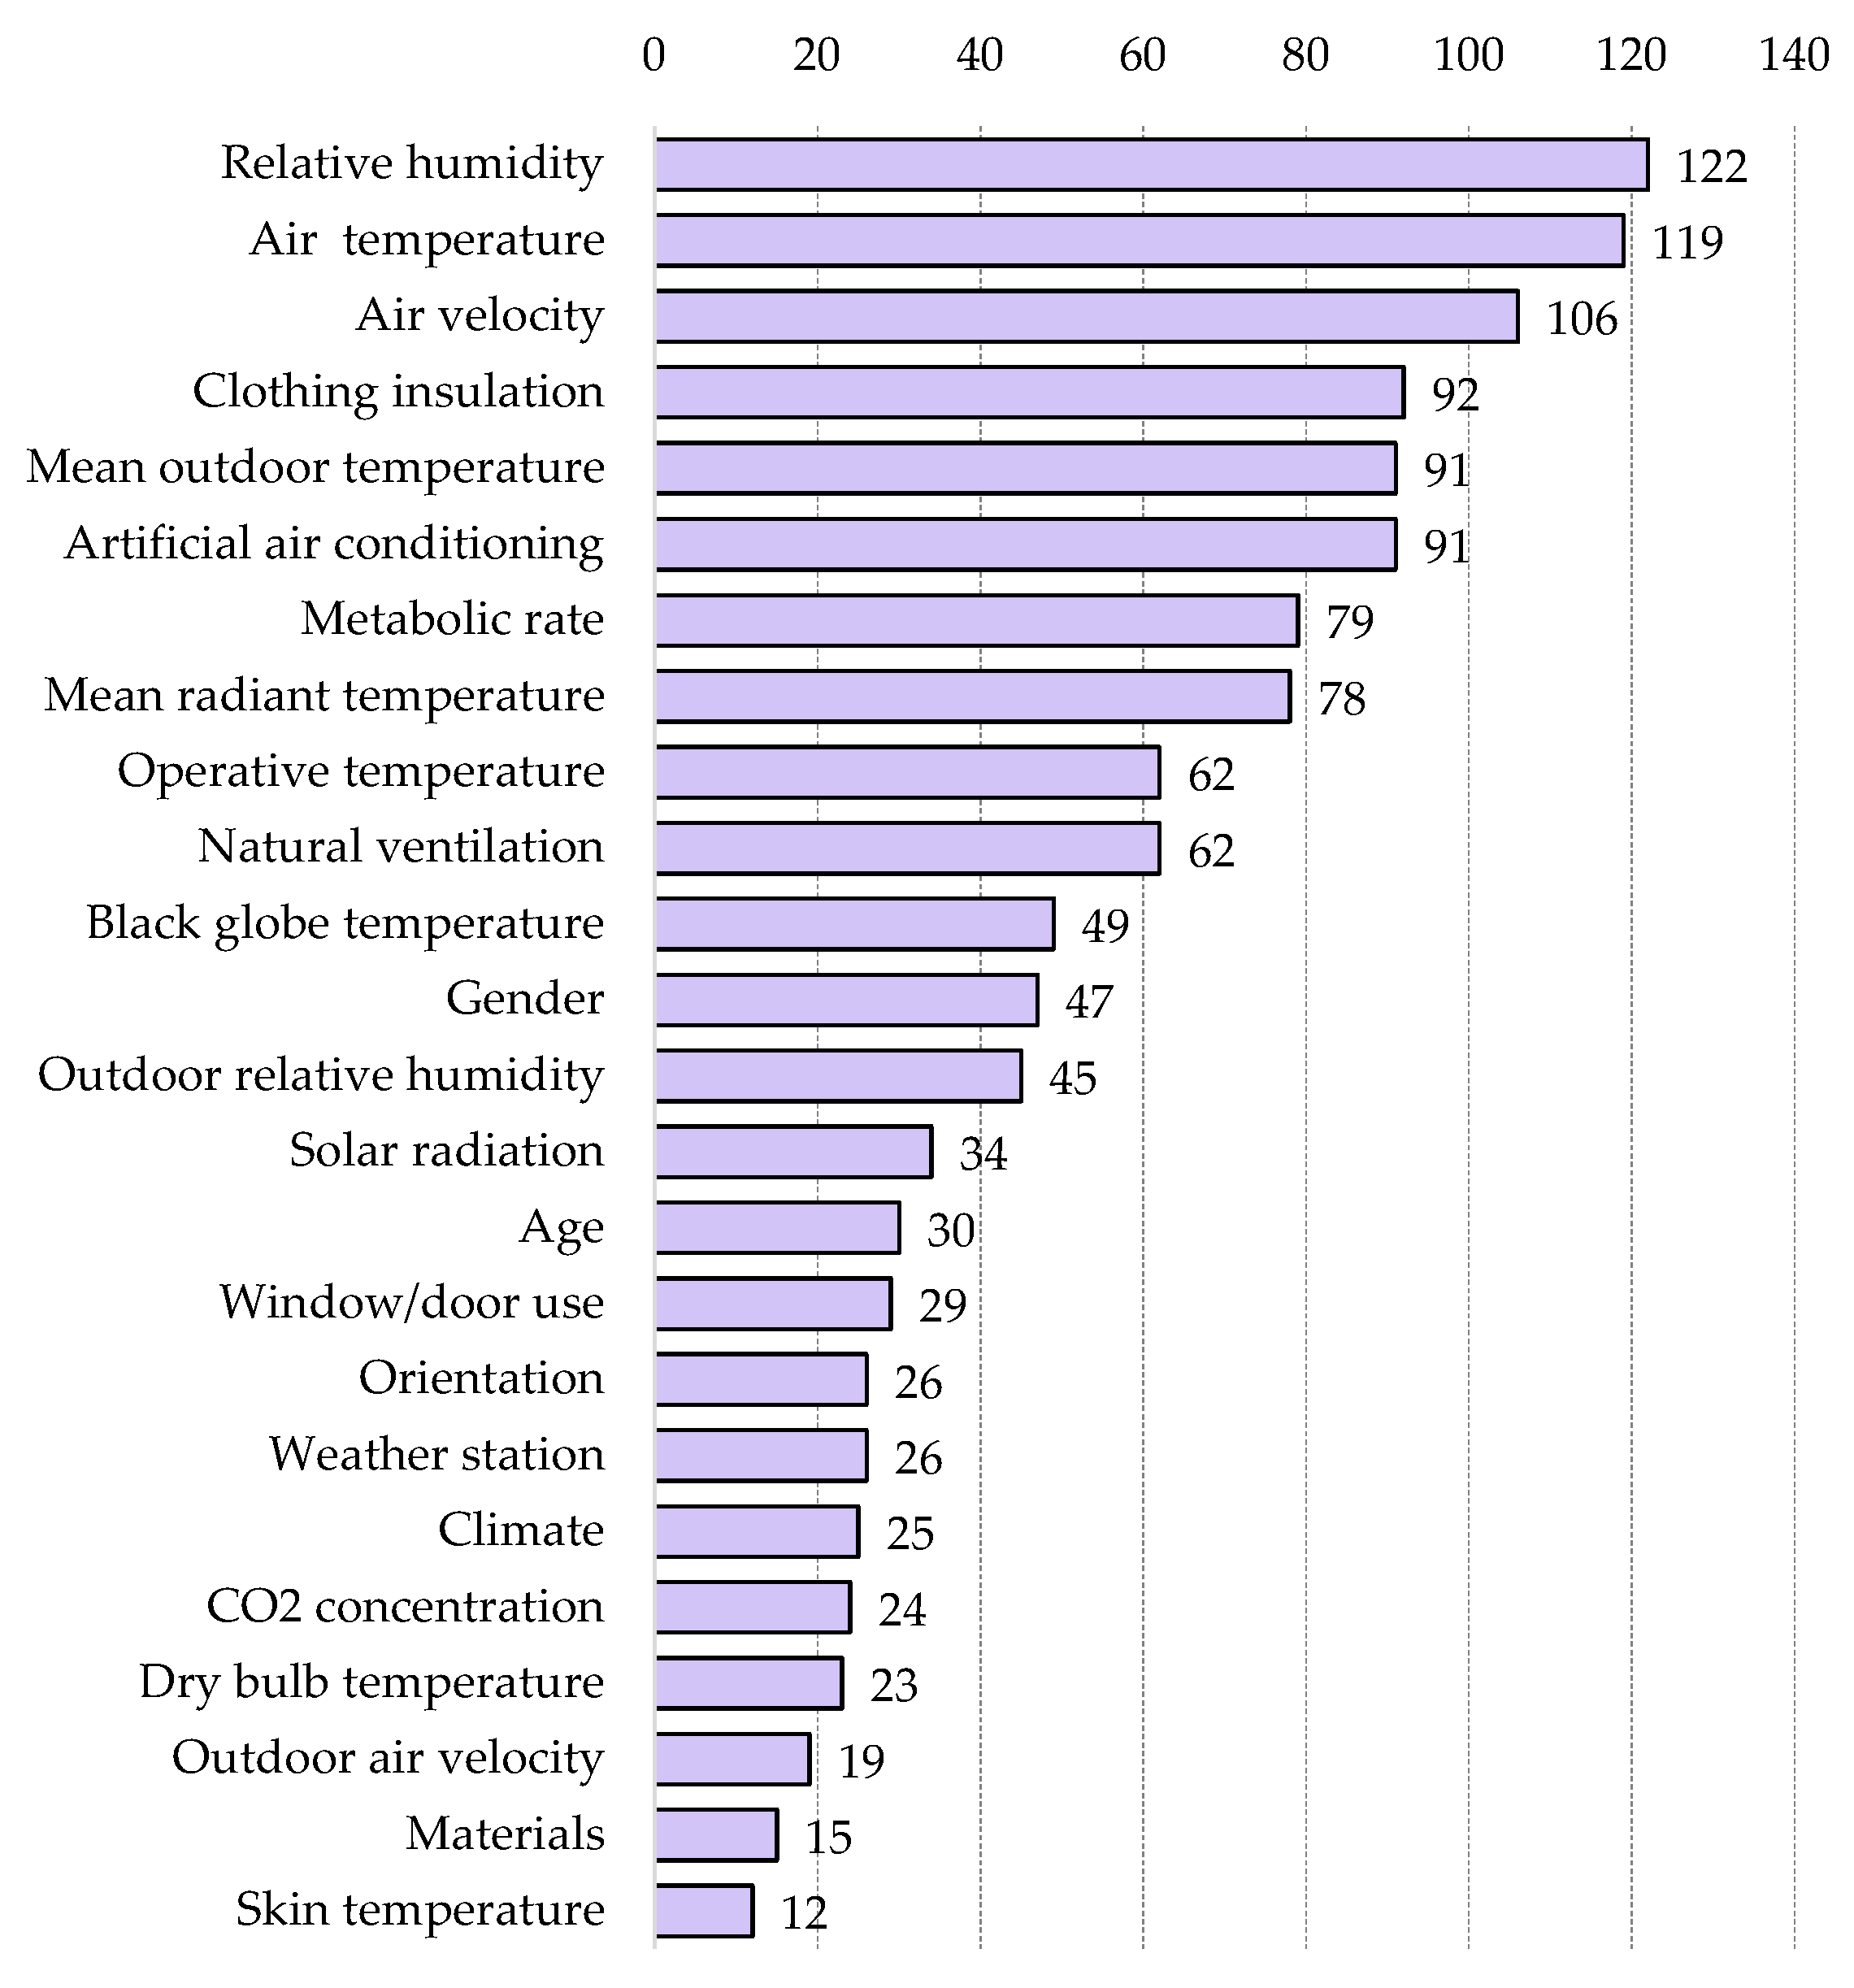
In Figure 7, the TCVs were ordered based on their frequency in the items in descending order. Thus, indoor relative humidity, air temperature, and air velocity are visualized as the TCVs with the highest occurrence within the set of articles. On the other hand, skin temperature and materials are the least frequently occurring TCVs. However, since most of the analyzed documents correspond to field studies, it is observed that many of the variables present in the literature correspond to environmental ones, where they can be presented with another denomination, as discussed in the previous section. Variables such as dry bulb temperature, globe temperature, or operative temperature were not unified and were searched under their denomination. However, it is important to note that they represent the same concept of “operative temperature” as required in the ASHRAE55 standard for measuring thermal comfort [36].
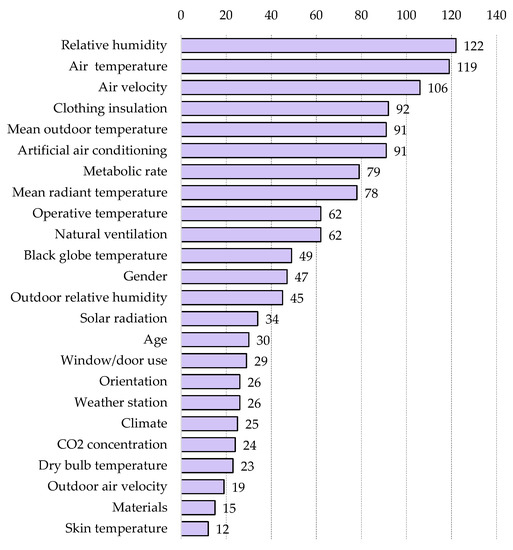
Figure 7.
Frequency of appearance of variables in reviewed articles.
In this context, the field studies follow a standardization under the guidelines of the ISO7730 and ASHRAE55, among other norms or standards using the input variables of the PMV model, which correspond to four environmental variables: air temperature, mean radiant temperature, relative humidity, and air velocity; and two physiological variables: clothing insulation and metabolic rate. On the other hand, most machine learning models also use the PMV model parameters as input variables within their algorithm, which would replicate these TCVs. This would mean that the PMV variables are present in many of the documents analyzed. For this reason, the artificial air conditioning variable also appears, understanding that the environment would be under stable conditions, where there would be no significant variability in the indoor environment.
Likewise, the average outdoor temperature variable appears, representing a variability of the environment and not a static state as in the PMV model. Thus, this variable appears in the scenario of naturally ventilated spaces under the adaptive approach.
On the other hand, it is possible to observe contextual variables such as climate or season, which appear to see their relationship with the thermal comfort perceived by the users. It should be noted that a considerable number of field studies were carried out in extreme climates where the actual requirements of the users were far from the values provided by the standards, which could also be seen in Figure 4, where countries such as Brazil and South Korea presented the highest research productions under these conditions. In addition, taking the climate variable as a measure of perception can significantly affect the thermal sensation. Given the same indoor thermal environment, occupants in warmer climates tend to feel significantly colder than their counterparts in colder climates, suggesting a long-term acclimatization effect [12]. In an office setting, outdoor temperature appears to be the most influential factor in opening windows upon arrival, where users modify their environment through this action, suggesting that users are still influenced by the perception of outdoor conditions [33].
Further, personal information variables such as gender and age appear more frequently, used as contextual variables of the study or to obtain conjectures when concluding about thermal perception [45]. For example, Zhang F. and de Dear R. [17] concluded that gender shows significant main and interaction effects on thermal sensation. Women perceived the same thermal environment to be significantly colder than their male counterparts, and thermal sensitivity was also systematically higher in women. For age, Teli D. et al. [46] detected that children are more sensitive to higher temperatures than adults, with comfortable temperatures about 4 °C lower than PMV predictions. Therefore, they concluded that children have a different thermal perception than adults and that it is necessary to adjust the models to reflect their thermal sensation adequately.
Another variable, i.e., window/door use, represents occupants’ interaction with their environment. Indoor conditions such as temperature, humidity, and CO2 can explain the driving forces of window opening behavior [47]. In turn, window operation is related to ventilation, indoor air quality, and energy consumption [21]. In studies such as Jeong B. et al. [48], it was evidenced that thermal stimuli explained window opening and closing behaviors. In the opening case, the outside temperature exceeded 12.7 °C, presumably to achieve a cooling effect. On the other hand, for closing, 90.6% of the openings were closed before the inside temperature reached 4 °C.
Finally, variables such as materials and skin temperature appear to a lesser extent. the former is related to the fact that articles that included the design stage of an infrastructure were not analyzed due to the selection of articles in the operative stage. Therefore, aspects such as thermal envelopes or materials insulation were not analyzed. As for skin temperature, this variable was covered in more specific studies. For example, Faridah F. et al. [49] detected thermal sensations from facial skin temperature using a thermal camera.
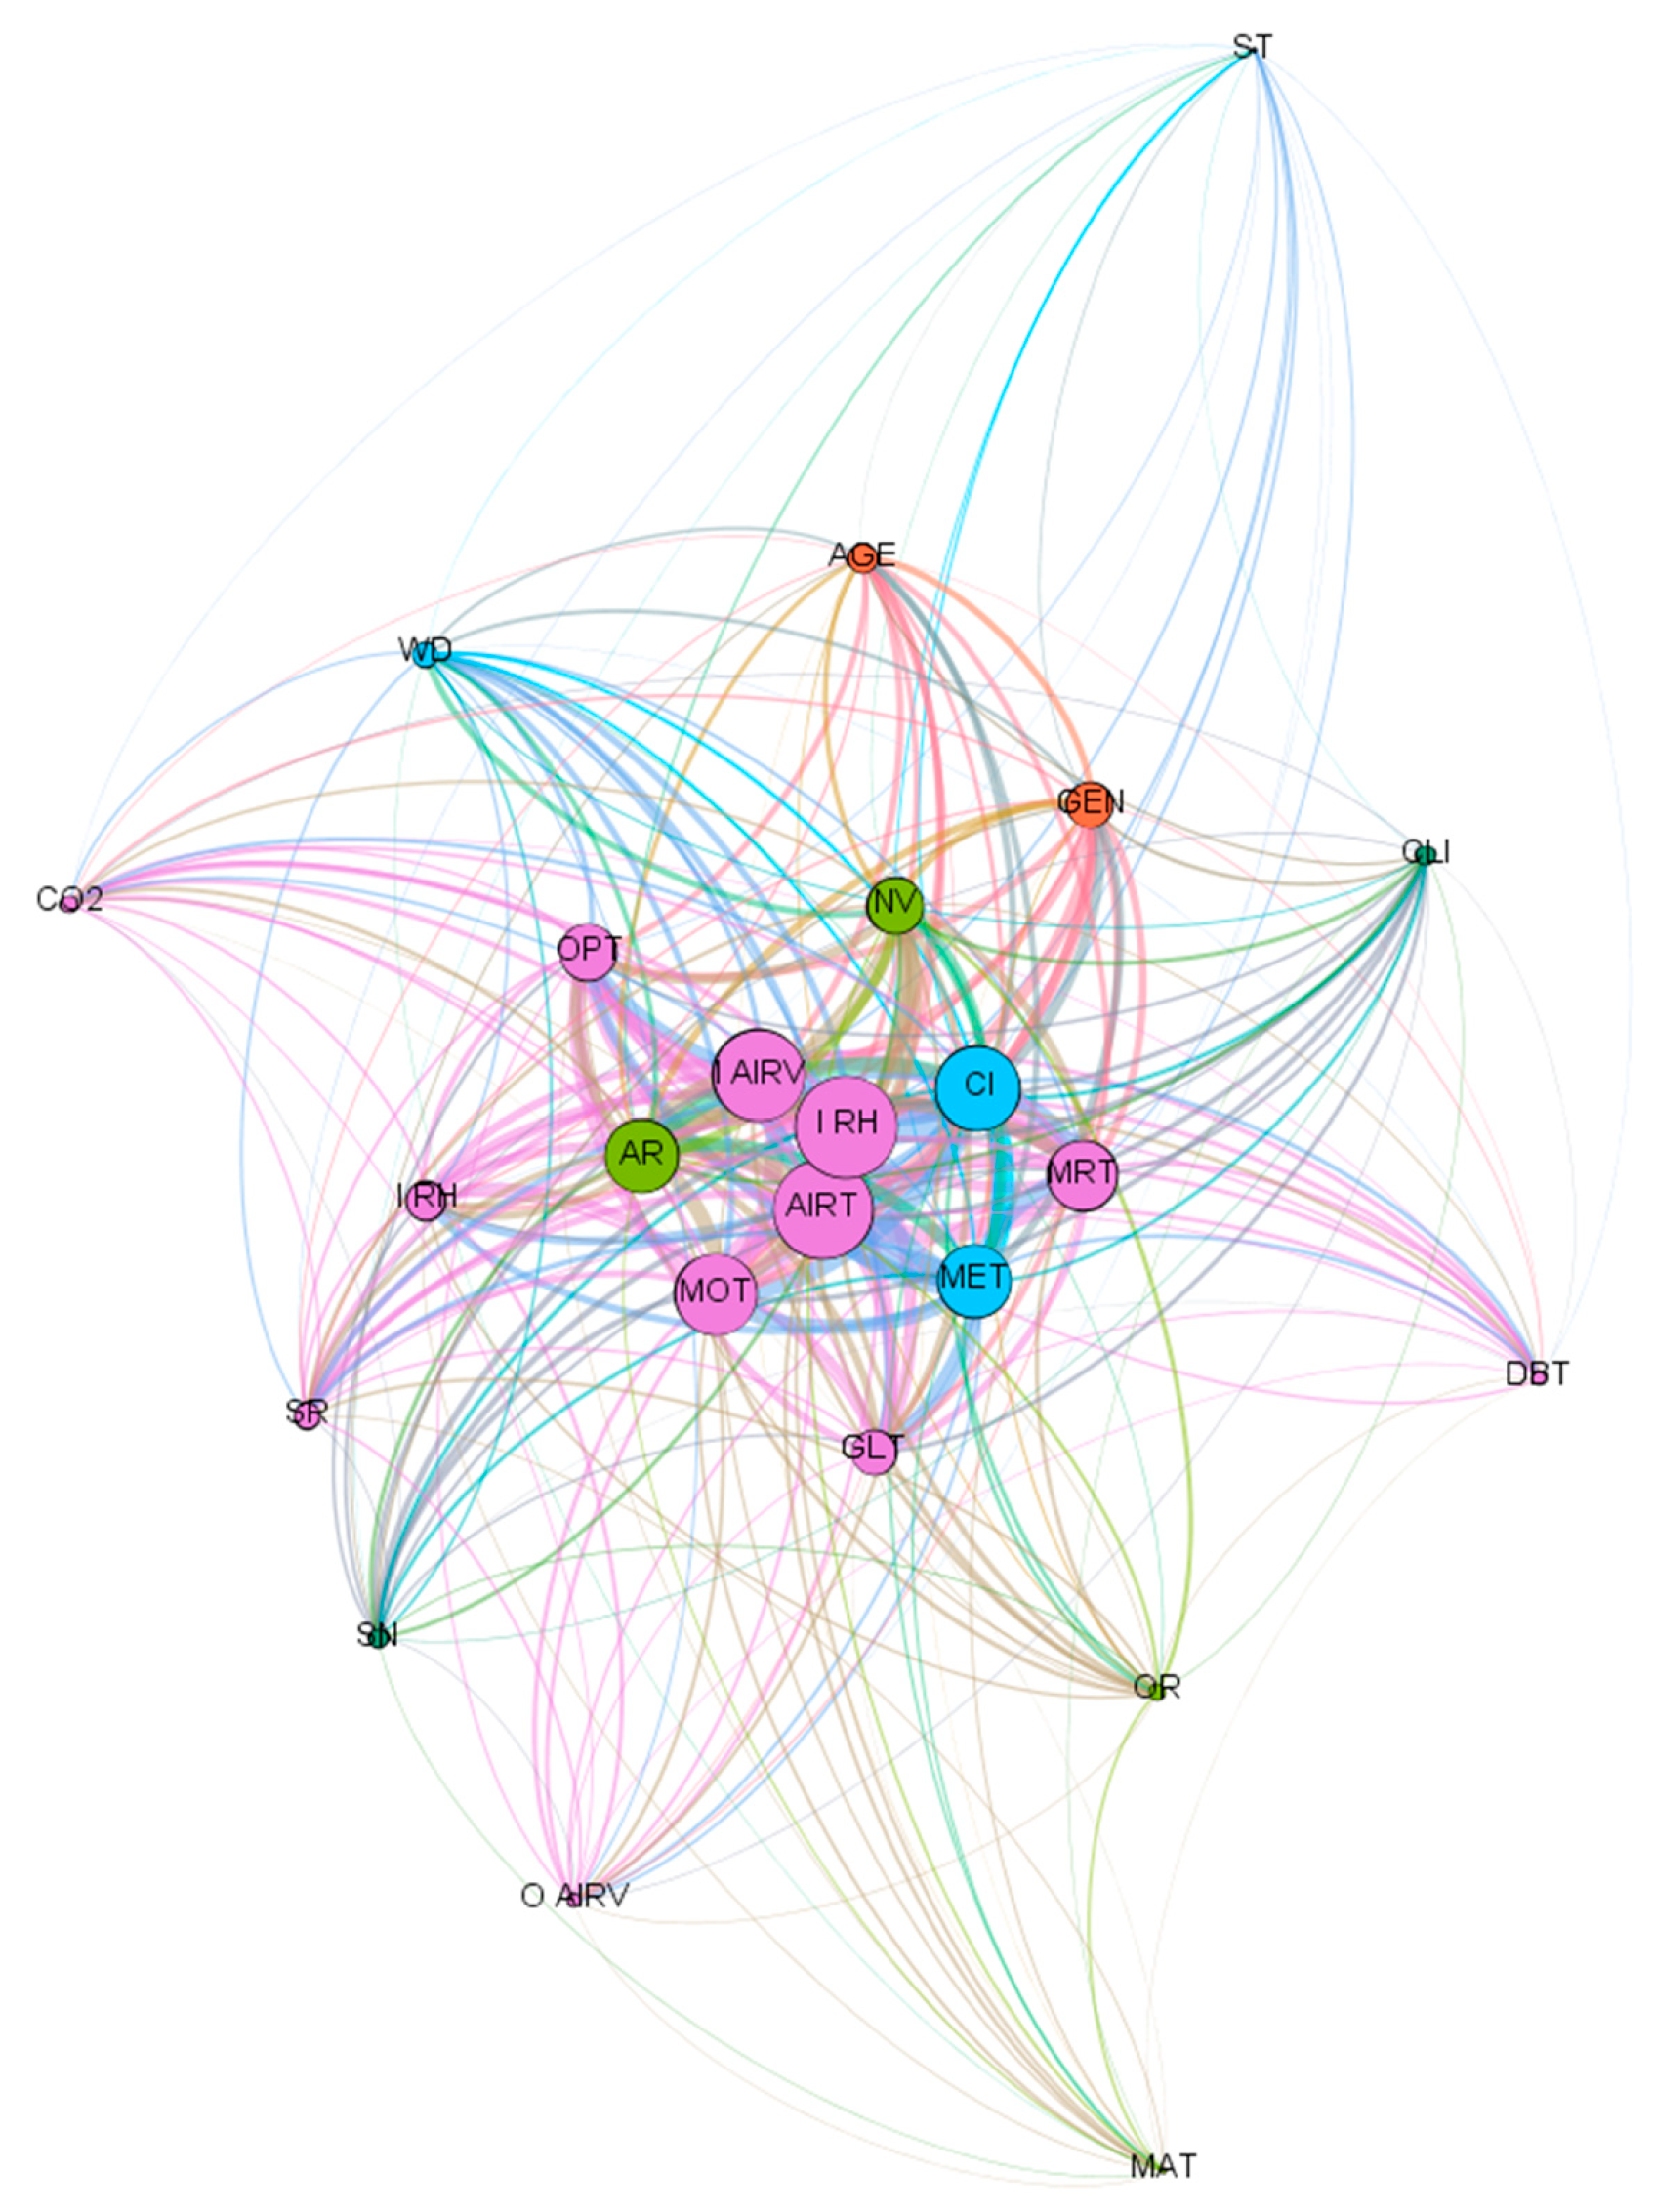
Figure 8 shows the network diagram created in Gephi, based on the co-occurrence of two variables in the same text. The nodes are shown with each TCV according to its identifier, and the colors are organized in accordance with the classification in Table 1. Thus, environmental TCVs are colored lilac, occupants’ personal information is colored orange, occupants’ characteristics are colored light blue, basic identifiers are colored dark green, and building characteristics are colored light green.
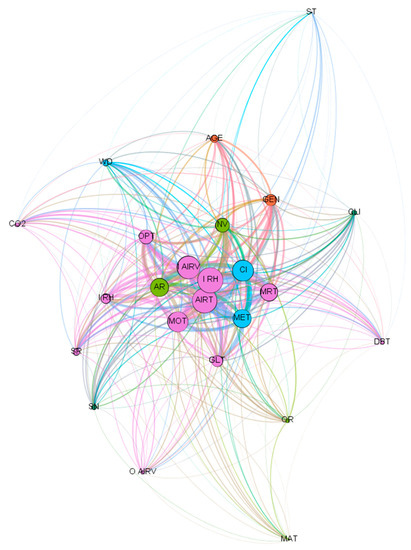
Figure 8.
TCV network diagram.
The diagram was designed with a ranking in the size of the nodes by degrees with weights. When analyzing by pairs of variables, it was enough that they appeared together in a single article for them to be related. Hence, it was more interesting to see the degree to which they were connected.
On the other hand, the variables that appear at the ends of the network correspond to variables on which research fronts have been set. In this way, we find articles that seek to make new models focused on occupant behavior. Some of these variables are clothing insulation, gender, age of users, use of doors and windows, building orientation, and acclimatization. The above are determined under the premise that the PMV model provided by ISO 7730 and similar standards, although very accurate in neutral and controlled environments, does not always accurately describe occupant perception in a real environment [50].
In the central part of the network, the most influential nodes or TCVs are displayed, where the six variables in the stationary Fanger model are observed. Environmental variables such as mean radiant and air temperature, airspeed, and relative humidity are included, together with the personal variables corresponding to clothing insulation and metabolic rate.
In addition to the Fanger variables, the cooling strategy of the buildings is visualized, where it is possible to see two variables: artificial air conditioning and natural ventilation. To adopt a research line, it is necessary to know the predominant type of ventilation in the building; thus, it will be possible to define the conditions that exist and evaluate thermal comfort from an adaptive or stationary model. This would explain the appearance of the mean outside temperature variable using the first model mentioned.
3.3. Capture Devices
Standardizations such as ASHARAE55 [33] provide norms to capture the variables more accurately. Most of the studies carried out in indoor environments are performed according to ISO 7726 [46]. In this literature review, most of the articles analyzed corresponded to field studies and evaluations of thermal comfort in real environments, governed by standards. However, as scenarios and conditions may vary depending on the type of structure, it is necessary to see what factors should be considered when collecting measurements to have greater accuracy.
Within the measurement tools, it is possible to find a great variety of sensors that measure TCV; however, given that there are different types of contextual or user-dependent variables, not all can be measured. Table 3 presents the generalized measurement devices found in the literature, without going into further detail, such as the accuracy of each one. Two large groups are generated here, one focused on sensors that capture environmental variables and the other on measures occupant-related variables. Additionally, environmental variables can be obtained based on data from weather stations, which will depend on the type of study being carried out [51].
Table 3.
TCV measurement tool.
Instrument accuracy, measurement range, and response time should be indicated in thermal comfort investigations. ISO 7726 and the ASHRAE55 standard [33] require minimum accuracy for measuring certain environmental variables: air velocity, indoor air temperature, globe temperature, and relative humidity. Moreover, measurements must be taken close to the interviewed subjects if the objective is to analyze how people perceive thermal conditions [47].
The instruments must meet the accuracy and range requirements of the standards for monitoring thermal comfort conditions [52]. The deployment strategy of the instruments would be a function of proximity to the people occupying the space, proximity to thermal machines, area of coverage, and height position of the devices [46]. During the review, it was observed that researchers were able to acquire instruments that met the precision requirements of the standards for measuring equipment. According to ISO 7726, the temperature acceptability ranges are from 10 to 40 °C, with instruments with an accuracy of +−5 °C. For air velocity, there is a range of 0.05 to 1 m/s with an instrument accuracy of +−(0.05 + 0.05 Va). For humidity, mentioned as vapor pressure, a measurement range of 0.5 to 3.0 KPa is established with an instrument accuracy of +−0.15 KPa [53]. Now, the capture of these variables is complemented with questionnaires that deliver the thermal preference that users answer, contrasting the real perception they obtain with what is provided in the standard. However, much of the literature shows this realization at a specific time. The vast majority focused on conducting physical surveys that studied the applicability of perceptions in real time. In this way, steps are taken to improve this process of obtaining people’s perceptions. Acquiring these data in real time can complement behavioral models and thus help the management of thermal comfort in indoor environments.
They are now countering the perceptions in physical surveys and new technologies that address this digitally. For the former, the applicability to many people and distribution of the devices for measuring environmental variables become difficult. In addition, repeated surveys could lead to attrition in participation. On the other hand, digital channels allow people to give feedback through a daily use channel such as a cell phone and can be applied to thermal comfort management systems [54].
A better understanding of occupants’ perception of indoor environment quality helps occupants to be more productive and healthier. At the same time, analyzing occupant behavior patterns through occupancy sensors helps to improve energy savings in the built environment [55]. Thus, it was possible to identify sensors associated with user adaptability behaviors during the review, evidence that these variables are a point of research interest.
4. Discussion
4.1. Practical Considerations
To achieve a range of acceptance of thermal comfort for a group of people, as many people as possible must be satisfied. Environmental variables such as temperature or humidity are the most visible when discussing thermal comfort. In this context, the three variables found with the greatest presence in the literature were relative humidity, air temperature, and air velocity. These represent the basis for establishing relationships, as seen in Section 3.2.1, wherein the case of not obtaining a variable directly could be obtained from these three.
These variables correspond to the main ones analyzed in the different thermal comfort studies since they represent the basis of the human body’s process with the physical environment to perceive a thermal environment. Through a convection process, air temperature determines how much heat the body loses to the air. On the other hand, the relative humidity present in the air regulates the conditions for evaporating sweat, which is one of the mechanisms for cooling the body; the higher the humidity, the more difficult it is for the air to absorb. As for air velocity, the loss of body heat by convection and evaporation processes is influenced by air movement, with those that cool the body the most being called air currents. By establishing ranges for each variable based on certain conditions given in each study, such as climate or season, thermal comfort can be analyzed through different research areas.
The benefits delivered by a better prediction of thermal comfort are:
- Contextual variables and those associated with occupant behavior can contribute to early design stages. For example, recognizing preferences for air-conditioned or naturally ventilated environments based on the climatic context and determining the habit of closing windows, it is possible to improve the architectural design to meet these preferences [28]. Thus, stakeholders such as real estate companies should consider these aspects to improve thermal comfort in operational stages;
- In terms of energy and health, the adaptive actions taken by users in their thermal environments affect energy consumption through the use of heating/cooling systems and generated CO2 levels, respectively. In this way, the search is developed to establish a synergy between the factors of a design that meets people’s expectations while complying with a sustainable approach.
Under this context, indoor air quality (IAQ), one of the factors of indoor environment quality (IEQ), impacts ventilation systems associated with controlling the CO2 levels of indoor environments, bringing with it impacts on energy resources. Thus, it becomes necessary to maintain general comfort levels with decreased energy requirements [56]. Considering current pandemic scenarios (COVID-19), controlling indoor air quality takes on great relevance. Reducing viral load through ventilation systems increases energy costs, so it is necessary to consider new ways to provide adequate ventilation, for example, customized ventilation, ensuring synergy between IEQ perception, health, and energy efficiency [57].
One way to integrate these points corresponds to a management system that incorporates a thermal comfort prediction base delivering optimal ranges, complementing this with real-time perceptions that avoid overestimating the thermal comfort acceptance ranges and integrating this into the air conditioning systems to operate only at times when it is required. In this way, a large saving in electrical resources is achieved, which translates into energy efficiency.
4.2. Limitations
While the results and conclusions of this research are based on a systematic literature review and aligned with the conclusions of previous research, some limitations of the work need to be indicated:
- Although the impact that each of the variables obtained referring to user behavior can have on thermal comfort is analyzed, there is no emphasis on which causes the greatest impact or which are essential, so the question of which could have the greatest influence at times of gaps in the values of thermal comfort evaluations is not presented;
- Since this review is attributable to three types of infrastructures, i.e., residences, educational establishments, and offices, it is not attributable to other infrastructures such as hospitals, subways, etc. However, many evaluations are focused on these interior spaces since they represent daily scenarios where people spend most of their time. Hence, the conclusions generated from this review manage to cover a large part of potential users;
- This review was carried out for an operational stage, so other variables focused on design, such as material insulation, were not considered. However, the spectrum of variables seen helps to understand users’ perceptions and can provide important considerations to be included in the design stages of a building.
5. Conclusions
From the literature review, the most influential variables when measuring thermal comfort were obtained. First, through characterization and analysis of the authors’ keywords, it was possible to identify the research areas to which the studies were related. Among these, we found mainly indoor environment quality standards, variables focused on human behavior, and machine learning models for a more accurate thermal comfort prediction. Moreover, it was possible to classify these variables and then relate them to the capture devices. Within the four categories, the environmental variables can be measured by devices, which are standardized to obtain greater accuracy in the measurements. It was seen that the important factors to consider are height, data collection intervals, position close to the user, and proximity to other thermal devices.
Regarding a co-occurrence analysis, it was found that the most influential variables are given by the six variables proposed in Fanger’s stationary model: air temperature, mean radiant temperature, airspeed, and relative humidity. Further, the physiological variables are given by metabolic rate and clothing insulation. This could be seen both in the frequency graph of the variables and in the TCV network diagram in Figure 8, which is explained by the fact that the input variables for both the standards and the algorithms of the machine learning models were the same as those for the PMV model. Moreover, a high frequency could be seen in the mean outdoor temperature variable linked to the adaptive model. Additionally, the research sector that has focused on the behavior and adaptability of the occupants has given way to new variables that also influence thermal comfort. Those reviewed in this study correspond to gender, age, acclimatization, window/door use, and clothing insulation.
The main contribution of this is giving a wide overview of the most considered variables—in the literature—that influence thermal comfort and, in this way, making pertinent considerations in their management stages. The importance of considering all the variables when evaluating thermal comfort in a building lies in improving its accuracy. While there are standards which provide guidelines and temperature values for which a group of people in the same indoor environment would be satisfied, understanding the individual behaviors and thermal perceptions of each occupant will help to close the gap of differences between the value provided by a standard and actual thermal perception. An individualized approach is necessary to achieve thermal satisfaction in an indoor environment, rather than simply meeting universal design criteria for thermal comfort.
In terms of sustainability and the economy, having the spectrum of variables that influence occupants’ behavior to adapt the environment to their thermal preferences contributes to generating a positive impact on the energy savings of buildings. The above, considering the energy used during the operational stage, is greater than the designed stage. Therefore, emphasizing behavioral models will allow a better understanding of occupant comfort, which in early stages could even lead to a better design of the structure, contributing to energy efficiency. Under this same context, new models have been developed for predicting thermal comfort in centralized control systems where thermal comfort ranges are established for the public through algorithms that can optimize thermal comfort with lower energy consumption, making the use of the correct variables to avoid biases in the predictions indispensable.
Variables such as gender and age show differences in thermal perceptions. Therefore, in the context of an educational establishment, where children and adults share the same space, it is necessary to link these variables to the models used to find a neutral temperature that fully satisfies the users. On the other hand, opening doors and windows also indicates users’ thermal perceptions. In the early stages, it can contribute to a better design or, in operational stages, help to employ strategies to restore structures.
As for the limitations of this study, given that the scope of the literature review was proposed only for structures such as residences, offices, and educational buildings, the conclusions obtained from the results are not attributable to industries or facilities such as hospitals or a subway. In addition, because the operative stage of a structure was covered, other variables focused on design, such as material insulation, were not considered. However, the spectrum of variables seen helps to understand users’ perceptions and can provide important considerations to be included in the design stages of a building.
Finally, a future line of research is opened for a discussion that adapts the current standardization norms of thermal comfort evaluation (ISO7730, ASHARAE55) to new models based on dynamic and behavioral variables in occupants according to a preference scale. For this purpose, it would be interesting to carry out a statistical study based on those variables that generate a greater gap in the thermal comfort evaluations to generate an order of impact.
Author Contributions
Conceptualization, R.F.H. and T.M.; methodology, R.F.H. and T.M.; software, T.M.; validation, F.M.-L.R. and E.A.; formal analysis, T.M. writing—original draft preparation, T.M. writing—review and editing, R.F.H., E.A. and F.M.-L.R.; visualization, T.M. and F.M.-L.R.; supervision, R.F.H. and F.M.-L.R. All authors have read and agreed to the published version of the manuscript.
Funding
This research was funded (APC) by Pontificia Universidad Católica de Valparaíso. This research was funded by CONICYT grant number CONICYT-PCHA/InternationalDoctorate/2019-72200306 for funding the graduate research of Muñoz-La Rivera.
Institutional Review Board Statement
Not applicable.
Informed Consent Statement
Not applicable.
Data Availability Statement
Not applicable.
Acknowledgments
The authors wish to thank the TIMS space (Technology, Innovation, Management, and Innovation) of the School of Civil Engineering of the Pontificia Universidad Católica de Valparaíso (Chile), where part of the research was carried out.
Conflicts of Interest
The authors declare no conflict of interest.
References
- Lan, X.; Cao, J.; Lv, G.; Zhou, L. Simulation method for indoor airflow based on the Industry Foundation Classes model. J. Build. Eng. 2021, 39, 102251. [Google Scholar] [CrossRef]
- Molina, C.; Veas, L. Evaluación del confort térmico en recintos de 10 edificios públicos de Chile en invierno. Rev. Constr. 2012, 11, 27–38. [Google Scholar] [CrossRef]
- Arballo, B.; Kuchen, E.; Alamino, Y.; Frank, A.A. Evaluación de Modelos de Confort Térmico Para Interiores. 2016. Available online: https://www.researchgate.net/publication/309477141 (accessed on 13 September 2021).
- Vischer, J.C. The effects of the physical environment on job performance: Towards a theoretical model of workspace stress. Stress Health 2007, 23, 175–184. [Google Scholar] [CrossRef]
- Alzahrani, H.; Arif, M.; Kaushik, A.; Goulding, J.; Heesom, D. Evaluating the effects of thermal comfort on teacher performance using Artificial Neural Network. Int. J. Build. Pathol. Adapt. 2018, 39, 20–32. [Google Scholar] [CrossRef]
- Ekici, C. A Review of Thermal Comfort and Method of Using Fanger’s PMV Equation. 2013. Available online: https://www.researchgate.net/publication/289201295 (accessed on 15 September 2021).
- Volkov, A.A.; Sedov, A.V.; Chelyshkov, P.D. Modelling the thermal comfort of internal building spaces in social buildings. Procedia Eng. 2014, 91, 362–367. [Google Scholar] [CrossRef] [Green Version]
- Zhou, Y.; Su, Y.; Xu, Z.; Wang, X.; Wu, J.; Guan, X. A hybrid physics-based/data-driven model for personalized dynamic thermal comfort in ordinary office environment. Energy Build. 2021, 238, 110790. [Google Scholar] [CrossRef]
- de Dear, R. Thermal comfort in practice. Indoor Air 2004, 14, 32–39. [Google Scholar] [CrossRef]
- Rodríguez, C.M.; Coronado, M.C.; Medina, J.M. Thermal comfort in educational buildings: The Classroom-Comfort-Data method applied to schools in Bogotá, Colombia. Build. Environ. 2021, 194, 107682. [Google Scholar] [CrossRef]
- Ghahramani, A.; Galicia, P.; Lehrer, D.; Varghese, Z.; Wang, Z.; Pandit, Y. Artificial Intelligence for Efficient Thermal Comfort Systems: Requirements, Current Applications and Future Directions. Front. Built Environ. 2020, 6, 49. [Google Scholar] [CrossRef]
- Yu, J.; Cao, G.; Cui, W.; Ouyang, Q.; Zhu, Y. People who live in a cold climate: Thermal adaptation differences based on availability of heating. Indoor Air 2013, 23, 303–310. [Google Scholar] [CrossRef]
- Wang, L.; Kim, J.; Xiong, J.; Yin, H. Optimal clothing insulation in naturally ventilated buildings. Build. Environ. 2019, 154, 200–210. [Google Scholar] [CrossRef]
- Wang, Z.; de Dear, R.; Luo, M.; Lin, B.; He, Y.; Ghahramani, A.; Zhu, Y. Individual difference in thermal comfort: A literature review. Build. Environ. 2018, 138, 181–193. [Google Scholar] [CrossRef]
- Dong, B.; Prakash, V.; Feng, F.; O’Neill, Z. A review of smart building sensing system for better indoor environment control. Energy Build. 2019, 199, 29–46. [Google Scholar] [CrossRef]
- Ličina, V.F.; Cheung, T.; Zhang, H.; De Dear, R.; Parkinson, T.; Arens, E.; Chun, C.; Schiavon, S.; Luo, M.; Brager, G.; et al. Development of the ASHRAE Global Thermal Comfort Database II. Build. Environ. 2018, 142, 502–512. [Google Scholar] [CrossRef] [Green Version]
- Zhang, F.; de Dear, R. Impacts of demographic, contextual and interaction effects on thermal sensation—Evidence from a global database. Build. Environ. 2019, 162, 106286. [Google Scholar] [CrossRef]
- Yoon, Y.R.; Moon, H.J. Performance based thermal comfort control (PTCC) using deep reinforcement learning for space cooling. Energy Build. 2019, 203, 109420. [Google Scholar] [CrossRef]
- van Eck, N.J.; Waltman, L. Software survey: VOSviewer, a computer program for bibliometric mapping. Scientometrics 2010, 84, 523–538. [Google Scholar] [CrossRef] [Green Version]
- Pisello, A.L.; Castaldo, V.L.; Piselli, C.; Fabiani, C.; Cotana, F. How peers’ personal attitudes affect indoor microclimate and energy need in an institutional building: Results from a continuous monitoring campaign in summer and winter conditions. Energy Build. 2016, 126, 485–497. [Google Scholar] [CrossRef]
- Rijal, H.B.; Tuohy, P.; Humphreys, M.A.; Nicol, J.F.; Samuel, A.; Clarke, J. Using results from field surveys to predict the effect of open windows on thermal comfort and energy use in buildings. Energy Build. 2007, 39, 823–836. [Google Scholar] [CrossRef] [Green Version]
- Liu, J.; Yao, R.; McCloy, R. An investigation of thermal comfort adaptation behaviour in office buildings in the UK. Indoor Built Environ. 2014, 23, 675–691. [Google Scholar] [CrossRef]
- Park, B.; Lee, S. Investigation of the energy saving efficiency of a natural ventilation strategy in a multistory school building. Energies 2020, 13, 1746. [Google Scholar] [CrossRef] [Green Version]
- Auffenberg, F.; Stein, S.; Rogers, A. A Personalised Thermal Comfort Model using a Bayesian Network. 2015. Available online: https://www.ijcai.org/Proceedings/15/Papers/361.pdf (accessed on 20 September 2021).
- Zhou, X.; Xu, L.; Zhang, J.; Niu, B.; Luo, M.; Zhou, G.; Zhang, X. Data-driven thermal comfort model via support vector machine algorithms: Insights from ASHRAE RP-884 database. Energy Build. 2020, 211, 109795. [Google Scholar] [CrossRef]
- Kim, J.; Zhou, Y.; Schiavon, S.; Raftery, P.; Brager, G. Personal comfort models: Predicting individuals’ thermal preference using occupant heating and cooling behavior and machine learning. Build. Environ. 2018, 129, 96–106. [Google Scholar] [CrossRef] [Green Version]
- Liang, H.H.; Chen, C.P.; Hwang, R.L.; Shih, W.M.; Lo, S.C.; Liao, H.Y. Satisfaction of occupants toward indoor environment quality of certified green office buildings in Taiwan. Build. Environ. 2014, 72, 232–242. [Google Scholar] [CrossRef]
- Devitofrancesco, A.; Belussi, L.; Meroni, I.; Scamoni, F. Development of an Indoor Environmental Quality assessment tool for the rating of offices in real working conditions. Sustainability 2019, 11, 1645. [Google Scholar] [CrossRef] [Green Version]
- Roskams, M.J.; Haynes, B.P. Testing the relationship between objective indoor environment quality and subjective experiences of comfort. Build. Res. Inf. 2021, 49, 387–398. [Google Scholar] [CrossRef]
- Kim, J.; Hong, T.; Lee, M.; Jeong, K. Analyzing the real-time indoor environmental quality factors considering the influence of the building occupants’ behaviors and the ventilation. Build. Environ. 2019, 156, 99–109. [Google Scholar] [CrossRef]
- Fabi, V.; Andersen, R.V.; Corgnati, S.; Olesen, B.W. Occupants’ window opening behaviour: A literature review of factors influencing occupant behaviour and models. Build. Environ. 2012, 58, 188–198. [Google Scholar] [CrossRef]
- Indraganti, M.; Ooka, R.; Rijal, H.B. Thermal comfort in offices in summer: Findings from a field study under the ‘setsuden’ conditions in Tokyo, Japan. Build. Environ. 2013, 61, 114–132. [Google Scholar] [CrossRef]
- ANSI/ASHRAE Standard 55. Thermal Environmental Conditions for Human Occupancy. 2004. Available online: https://www.ashrae.org/technical-resources/bookstore/standard-55-thermal-environmental-conditions-for-human-occupancy (accessed on 16 October 2021).
- Hachem, W.E.L.; Khoury, J.; Harik, R. Combining several thermal indices to generate a unique heat comfort assessment methodology. J. Ind. Eng. Manag. 2015, 8, 1491–1511. [Google Scholar] [CrossRef] [Green Version]
- Gamero-Salinas, J.; Kishnani, N.; Monge-Barrio, A.; López-Fidalgo, J.; Sánchez-Ostiz, A. The influence of building form variables on the environmental performance of semi-outdoor spaces. A study in mid-rise and high-rise buildings of Singapore. Enegy Build. 2021, 230, 110544. [Google Scholar] [CrossRef]
- Cámara Chilena de Refrigeración y Climatización A. G.; División Técnica de Aire Acondicionado y Refrigeración. Reglamento de Instalaciones Térmicas en los Edificios en Chile (RITCH); C.Ch.R.: Santiago, Chile, 2007. Available online: http://cchryc.cl/reglamento-de-instalaciones-termicas-en-los-edificios-en-chile-ritch/ (accessed on 30 December 2021).
- Natephra, W.; Motamedi, A.; Yabuki, N.; Fukuda, T. Enriching Building Information Modeling (BIM) with Sensor Data and Thermal Images for Thermal Comfort Analysis. 2017. Available online: https://www.researchgate.net/publication/319122536 (accessed on 20 October 2021).
- Castilla, M.; Álvarez, J.D.; Ortega, M.G.; Arahal, M.R. Neural network and polynomial approximated thermal comfort models for HVAC systems. Build. Environ. 2013, 59, 107–115. [Google Scholar] [CrossRef]
- Cordero, R.; Caballero, M.; Quiroz, F.; Damiani, A.; Jorquera, J.; Sepúlveda, E.; Rayas, J.; Feron, S. Radiación Solar en Chile; CONICYT: Santiago, Chile, 2016.
- Vellei, M.; Herrera, M.; Fosas, D.; Natarajan, S. The influence of relative humidity on adaptive thermal comfort. Build. Environ. 2017, 124, 171–185. [Google Scholar] [CrossRef]
- Sikram, T.; Ichinose, M.; Sasaki, R. Assessment of Thermal Comfort and Building-Related Symptoms in Air-Conditioned Offices in Tropical Regions: A Case Study in Singapore and Thailand. Front. Built Environ. 2020, 6, 187. [Google Scholar] [CrossRef]
- Zhang, Y.; Chen, H.; Meng, Q. Thermal comfort in buildings with split air-conditioners in hot-humid area of China. Build. Environ. 2013, 64, 213–224. [Google Scholar] [CrossRef]
- Dai, J.; Jiang, S. Passive space design, building environment and thermal comfort: A university building under severe cold climate, China. Indoor Built Environ. 2020, 30, 1323–1343. [Google Scholar] [CrossRef]
- Kim, A.; Wang, S.; Kim, J.E.; Reed, D. Indoor/outdoor environmental parameters and window-opening behavior: A structural equation modeling analysis. Buildings 2019, 9, 94. [Google Scholar] [CrossRef] [Green Version]
- Naspi, F.; Arnesano, M.; Zampetti, L.; Stazi, F.; Revel, G.M.; D’Orazio, M. Experimental study on occupants’ interaction with windows and lights in Mediterranean offices during the non-heating season. Build. Environ. 2018, 127, 221–238. [Google Scholar] [CrossRef]
- Teli, D.; Jentsch, M.F.; James, P.A.B. Naturally ventilated classrooms: An assessment of existing comfort models for predicting the thermal sensation and preference of primary school children. Energy Build. 2012, 53, 166–182. [Google Scholar] [CrossRef]
- Park, J.; Choi, C.S. Modeling occupant behavior of the manual control of windows in residential buildings. Indoor Air 2019, 29, 242–251. [Google Scholar] [CrossRef]
- Jeong, B.; Jeong, J.W.; Park, J.S. Occupant behavior regarding the manual control of windows in residential buildings. Energy Build. 2016, 127, 206–216. [Google Scholar] [CrossRef]
- Faridah, F.; Waruwu, M.M.; Wijayanto, T.; Budiarto, R.; Pratama, R.C.; Prayogi, S.E.; Nadiya, N.M.; Yanti, R.J. Feasibility study to detect occupant thermal sensation using a low-cost thermal camera for indoor environments in Indonesia. Build. Serv. Eng. Res. Technol. 2021, 42, 389–404. [Google Scholar] [CrossRef]
- Kosmopoulos, P.; Galanos, D.; Anastaselos, D.; Papadopoulos, A.M. An assessment of the overall comfort sensation in workplaces. Int. J. Vent. 2012, 10, 311–322. [Google Scholar] [CrossRef]
- Kuru, M.; Calis, G. Data acquisition technologies for assessing thermal comfort in the built environment. Pol. J. Environ. Stud. 2021, 30, 1017–1027. [Google Scholar] [CrossRef]
- Johansson, E.; Thorsson, S.; Emmanuel, R.; Krüger, E. Instruments and methods in outdoor thermal comfort studies-The need for standardization. Urban Clim. 2014, 10, 346–366. [Google Scholar] [CrossRef] [Green Version]
- International Standard ISO-7726; Ergonomics of the Thermal Environment-Instruments for Measuring Physical Quantities ISO-7726. 1998. Available online: https://www.sis.se/std-615884 (accessed on 3 November 2021).
- Konis, K.; Blessenohl, S.; Kedia, N.; Rahane, V. TrojanSense, a participatory sensing framework for occupant-aware management of thermal comfort in campus buildings. Build. Environ. 2020, 169, 106588. [Google Scholar] [CrossRef]
- Kong, M.; Dong, B.; Zhang, R.; O’Neill, Z. HVAC energy savings, thermal comfort and air quality for occupant-centric control through a side-by-side experimental study. Applied Energy 2022, 306. [Google Scholar] [CrossRef]
- Alfano, F.R.D.; Olesen, B.W.; Palella, B.I.; Riccio, G. Thermal comfort: Design and assessment for energy saving. Energy Build. 2014, 81, 326–336. [Google Scholar] [CrossRef]
- Anand, P.; Cheong, D.; Sekhar, C. A review of occupancy-based building energy and IEQ controls and its future post-COVID. Sci. Total Environ. 2022, 804, 150249. [Google Scholar] [CrossRef]

Publisher’s Note: MDPI stays neutral with regard to jurisdictional claims in published maps and institutional affiliations. |
© 2022 by the authors. Licensee MDPI, Basel, Switzerland. This article is an open access article distributed under the terms and conditions of the Creative Commons Attribution (CC BY) license (https://creativecommons.org/licenses/by/4.0/).