Abstract
The production, processing, and transportation of food, in particular animal-based products, imposes great environmental burden on the planet. The current food supply system often constitutes a considerable part of the total carbon emissions of urban communities in industrialised cities. Urban food production (UFP) is a method that can potentially diminish food emissions. In parallel, a shift towards a predominantly plant-based diet that meets the nutritional protein intake is an effective method to curtail carbon emissions from food. Considering the high land use associated with the production of animal-based products, such a shift will prompt a community food demand that is more inclined to be satisfied with local production. Therefore, during the design process of a future low-carbon city, the combined application of both methods is worth exploring. This work introduces, describes, and demonstrates the diet shift component of the FEWprint platform, a user friendly UFP assessment platform for designers that is constructed around the broader three-pronged strategy of evaluation, shift, and design. For three neighborhoods, in Amsterdam, Belfast, and Detroit, the contextual consumption and country-specific environmental footprint data are applied to simulate a theoretical community-wide diet shift from a conventional to a vegan diet, whilst maintaining protein intake equilibrium. The results show that in total terms, the largest carbon mitigation potential awaits in Detroit (−916 kg CO2eq/cap/year), followed by Belfast (−866 kg) and Amsterdam (−509 kg). In relative terms, the carbon reduction potential is largest in Belfast (−25%), followed by Amsterdam (−15%) and Detroit (−7%). The FEWprint can be used to generate preliminary figures on the carbon implications of dietary adaptations and can be employed to give a first indication of the potential of UFP in urban communities.
1. Introduction
Throughout the various agricultural revolutions, crop yields kept pace with the increasing food demand of populations [1,2]. Maintaining sufficient food yields for a growing demand imposes a great environmental burden on the planet, for example, freshwater depletion, eutrophication, acidification, pollution, biodiversity reduction, and the emissions of greenhouse gasses. Research estimates that in 2015, the agriculture sector was responsible for about a third (range 24–42%) of the global greenhouse gas (GHG) emissions (Estimations are different between research institutes due to different analysis methods, taxonomy, and/or scopes. In addition, the estimation can vary between years, partly due to developments in the other sectors (e.g., transportation or energy) [3]. During the course of the 20th and early 21st century, subsidence agriculture is shifting towards highly optimised and resource-intensive bio-industry, thus driving the emissions of greenhouse gasses [2,4]. In addition, populations increasingly rely on international food trade, a trend that is expected to continue in especially developing nations [5]. This increases the distance between the food producers and consumers and is in the carbon accounting discourse often described as food miles [6]. At overseas farms, but mainly in tropical areas [7], cropland is increased at the expense of forest land [8]. This is commonly referred to as land-use/land-use change and is a common method to boost food yields, leading to the large-scale atmospheric deposition of carbon dioxide emissions and the loss of soil organic carbon stocks. As the global demand for animal-sourced protein is rising [9], a large portion of the global GHG emissions can be assigned to the livestock sector.
The meat, dairy, and fishery industries are responsible for more than half of the food sector’s global environmental impact [10]. In addition to playing a considerable role in global land-use change [9], the livestock sector also contributes to the global greenhouse gas problem by emissions through enteric fermentation and manure management. Enteric fermentation mainly applies to ruminant livestock, i.e., the beef, dairy, and mutton sector, and is the result of microbes breaking down feed and releasing the strong GHG methane (CH4) in the process [11]. Anaerobic breakdown of organic matter during manure storage mainly leads to methane emissions, and manure application to farmland leads to the release of various greenhouse gasses (mainly N2O, nitrous oxide).
Greenhouse gas emissions, also referred to as carbon dioxide equivalent (CO2eq) emissions throughout this work, caused by the consumption of food, can constitute a significant part of the total emissions of an urban dweller. In a preceding study, that introduced a carbon assessment approach for neighbourhoods, the carbon emission profiles for various urban communities around the world were produced [12]. These carbon profiles have been coined FEWprints, or Food Energy & Water carbon emission footprints, named after the platform specifically developed for this carbon assessment. The profile incorporates emissions associated with the management of throughput resources commonly used at the household level, which are thermal energy demand, electricity demand, fuel demand for personal mobility, water provision, water treatment, rainwater management, the processing of domestic waste, and food consumption (see Figure 1). This work only focuses on food-related emissions.
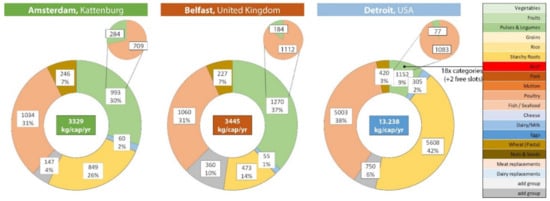
Figure 1.
Based on the results in Caat et al. (2022). The FEWprint of the Kattenburg community (Amsterdam, AMS), the Inner-East community (Belfast, BEL) and the Oakland Avenue Farming Community (Detroit, DET). Values are expressed in kg CO2eq/capita/year. The secondary graph shows the animal (pink) and plant based (green) emissions.
FEWprint assessment of an urban community in the neighbourhood of Kattenburg (Amsterdam), Inner-East (Belfast), and Oakland Avenue (Detroit) has revealed that food-related emissions are responsible for respectively 30%, 37%, and 9%, or 993, 1270, and 1152 kg/capita/year. The assessments are based on contextual resource demand and country-specific (or at a more granular level when available) carbon footprint indicators. The food sector emissions are estimated based on national food consumption survey data combined with country specific emission factors. Only non-processed food items/groups—subdivided into 18 food categories—were added to the food assessment scope. The relative impact of food [% of total emissions] is often dictated by the impact of the other sectors recorded in the carbon profile, hence leading to a considerable range (9–37%).
In essence, food sector emissions can be brought down by making improvements to the supply chain or by altering the demand on the consumer’s side. One alternative strategy to the conventional food supply chain is urban food production (UFP): the production, processing, and marketing of food products in urban centres or in the urban periphery. This can potentially offer various ecological benefits [13], environmental benefits when managed sustainably [14,15], and deal with various other challenges in the urban setting [16]. A collective dietary change at the consumer level can bring about environmental benefits on a scale that is difficult to achieve by the producers of the food [10].
The greenhouse gas emissions related to food consumption have been studied extensively in the past decades, and so has been the impact of a diet change to mitigate food sector emissions [17,18,19,20]. In general, it can be stated that the scientific community is in consensus on the lower environmental impact of adopting a diet that predominantly consists of plant-based food categories [21], and the World Resource Institute has included this as one of the key steps to achieved sustainable food security in the future [22]. Also, when calculated at the community level, changing food consumption patterns is expected to bring about carbon emissions benefits. However, due to the variation in sectoral emissions between communities, it is likely that a dietary shift from animal-based to plant-based protein would impact the FEWprints to a different extent in each community, which is tested in this work.
Urban food production is increasing in popularity among the general public, architects, urban designers, and policymakers in urban centres [15], quite often driven by the claim that local is inherently better for the environment [23]. However, the carbon emissions-reducing impact of UFP strategies is difficult to holistically quantify as food production is a complex and multi-faceted system and a comparison between a local and an imported product is not easily drawn. Local food production, especially in a dense inner-city location, often operates at a smaller capacity. This leads to a decreased energy efficiency per unit of food output and an increased footprint, a concept coined the ecology of scale [24]. Considering the inverse relationship between farm-scale and impact per unit of food, UFP should not be approached as merely the relocation of farming to an urban context, which effectively only shortens food miles and reduces food waste, but rather as the integration of a food system within the urban resource infrastructure. This could disclose an array of opportunities for symbiotic resource management between the two systems, a potential that is discussed more often in literature [16,25,26,27].
In the contours of urban design practice that is in pursuit of self-sufficiency, resiliency, and the decarbonisation of a neighbourhood or city, food demand, and UFP design are at interplay with each other, particularly during the conceptual stage of the design process. Community-wide food consumption patterns determine the food demand. A combination of UFP and conventional food imports are responsible to meet this demand. In view of the high land use associated with animal-based protein [10,28], diets that are inclined towards plant-based food offer more potential in space-limited urban centres or peripheries. As such, a dietary intake shift could play a determinative role in the ratio between locally produced protein and imported protein. With our research, we intend to provide a strategy and framework for non-agriculturist (e.g., urban planners and designers) and support the UFP design process with instant preliminary figures on food yield, resource demand, and environmental impact after design moves. To achieve this, the FEWprint operates as an integrated UFP assessment platform and has been constructed around the three-pronged strategy of (1) evaluation, (2) diet shift, and (3) design.
This work introduces and describes the diet shift component of the FEWprint platform. The component is demonstrated by employing it to determine the theoretical impact on the carbon equivalent emissions of the three aforementioned case study communities when animal-based protein is gradually replaced by plant-based protein. Protein intake is used as the functional unit, and Section 2.1 further elaborates on securing a protein intake equilibrium during diet transition. The first objective of this study is to see the extent to which the community’s food sector emissions are diminished throughout a series of drastic diet scenarios. The second objective is to see how the daily food intake pattern changes as a consequence of maintaining a protein intake balance throughout these diet scenarios. The preceding FEWprint evaluation component has been discussed in Caat et al. [12] and the successive UFP design component will be discussed in future disseminations. An empty FEWprint platform template and example assessments can be found in the Supplementary Materials Documents S1–S4 of this article.
2. Materials and Methods
2.1. Dietary Quality Indicator: Protein
Protein is a macro-nutrient that is composed of long chains of various types of amino acids. Dietary protein supplies the human body with the full range of essential or indispensable amino acids, i.e., the types of the body cannot synthesize on its own. By breaking down the dietary protein during digestion, the body is able to self-compose various other amino acids important to sustain bodily functions, also referred to as the non-essential amino acids [29]. Briefly: amino acids are vital components for growth, metabolic interactions, and maintenance of the body. Parts of the amino acids are further broken down to produce energy for the body. The recommended daily protein intake is different among individuals and depends on age, gender, physical condition, or sports activity. For the general population, the world health organisation recommends a minimum safe level of daily protein intake for adults (male + female) of 0.83 g/kg of body weight [30]. Long-term deficient intake of protein can affect vital organs and the immune system, making protein content and protein quality of food products and/or diets an important criterion of adequate nutrition [29]. This study applies the daily protein intake [gramprot/day] as the currency of nutritional quality of the alternative diet, a method that has been used more frequently in the past [31,32].
Both animal-based and plant-based food contain protein. It is however animal products that are considered as the typical source of protein in current diets [33]. Animal-based protein contains, in higher quantities, the full range of essential amino acid combinations required by the body, which can be an essential component to close nutrition gaps in especially developing countries [34]. Plant products contain a lower amount of proteins and plant protein contains fewer amino acids or they are present in non-optimal proportions, making them harder to break down [35]. Even though total protein consumption or protein content of food items is popularly used as an umbrella unit, nutritional quality of a diet should be assessed at the level of the individual amino acid intake [36,37,38]. This is underlined by Bohrer by stating that “plant derived proteins usually have large amounts of some to most essential amino acids, but have little or no amounts of some essential amino acids” ([35], p. 105), meaning shortages of specific amino acids can be bypassed through variety in plant-protein. Various studies have shown that a healthy amount of indispensable amino acid intake can be achieved by consuming only plant-based protein [35,36,39,40].
2.2. Maintaining a Healthy Protein Intake
An inconsiderate transition towards a (partly) plant-based diet could lead to an abatement of total protein intake, even when the amount of food consumed in terms of weight is kept equal by consuming substituting plant-based products. The size of such emerging protein-gap depends on various factors, namely the current reliance on meat and dairy for protein intake, the present consumption of the other food groups, the extent of the assessed diet shift, and the applied protein content indicators for the various food groups. But as argued, a considerate consumption of plant-based amino acids can avoid such a risk of protein deficiency.
On a single source basis, plant products offer reduced protein intake with a lower bioavailability compared to their meat analogues [35]. However, a combination of various plant proteins, extracted from a range of crop types, can be fully adequate to provide the necessary diversity of indispensable amino acids [39]. The EAT-Lancet committee recommends diversity within a largely plant-based diet, with a modest amount of animal sources [41]. When only plant-based food products are consumed, variation remains an essential aspect and will secure an adequate diet [42,43]. Therefore, in this study, a varied selection of plant-based groups that are generally high in protein are added to the diet in order to close the emerged protein gap. These are legumes and pulses, grains (cereals), nuts and seeds, and meat replacers (soy-based). Dairy (includes milk and yoghurt) is substituted with soybean-based dairy replacers.
The FEWprint platform can be used to compose a new and less impactful diet, whilst maintaining protein intake equilibrium with the current diet. In order to produce a meaningful evaluation of nutritional quality with regard to the protein intake of a new diet, it should preferably be evaluated at the amino acid level, where each amino acid combination is quantified separately. However, as each food product contains a different composition and quantity of essential amino acids, it would complicate the mechanics and data requirements of the platform considerably. Since the platform has been developed on the values of inter-component integration and scope comprehensiveness, whilst securing simplicity and functionality [12], it, therefore, simplifies the assessment by only considering the total protein intake [gramprot/cap/day].
A holistic assessment and comparison of conventional diets with alternative low-impact plant-based diets on the dimensions of sustainability and nutritional quality is a complex task as it requires indicators for both aspects and the possibility to link them [44]. The protein content of food [gramprot/100 gramfood] is such a factor when (re)establishing the protein intake equilibrium between two diets. Both extensive, as well as aggregated lists of protein content of numerous retail food products/categories, can be retrieved from online public databases, however, protein content data shows a lot of variabilities [42]. This can also be observed in Table A4, where the protein content of food groups, retrieved from national databases for the Netherlands, the United Kingdom, and the USA, is tabulated in grams of protein per 100 g (retail weight). This study applies the global average FAO values for the assessment [45], which are based on a combination of various items within a group, and only products that are considered a customary staple food for daily consumption are included, see Appendix C for more information.
2.3. Diet Shift: Framework of Diets and Diet Shift Component
The platform applies five commonly followed diet types to frame a community-wide transition towards a plant-based diet: pesce-pollotarianism (PPT), pescetarianism (PT), vegetarianism (VT), ovo-vegetarianism (OV), and veganism (VG). Since formal definitions of these terms may differ depending on the addressed source or context, this study applies elementary definitions that are based on the ADA descriptions [40]. In the pesce-pollotarian diet, red meat is removed from the menu, which is beef, pork, and lamb/mutton. In a pescetarian diet, red meat and poultry are not eaten whilst the consumption of fish and seafood is still allowed. In a vegetarian diet, all red meat, poultry, and fish and seafood groups are removed. People who follow an ovo-vegetarian diet additionally remove dairy and cheese from the menu, but the eggs are still allowed. This is a very uncommon diet in reality but is added to the selection as it can be a relevant in-between step when designing an urban food production strategy. Finally, all animal-based food groups are removed in the vegan diet.
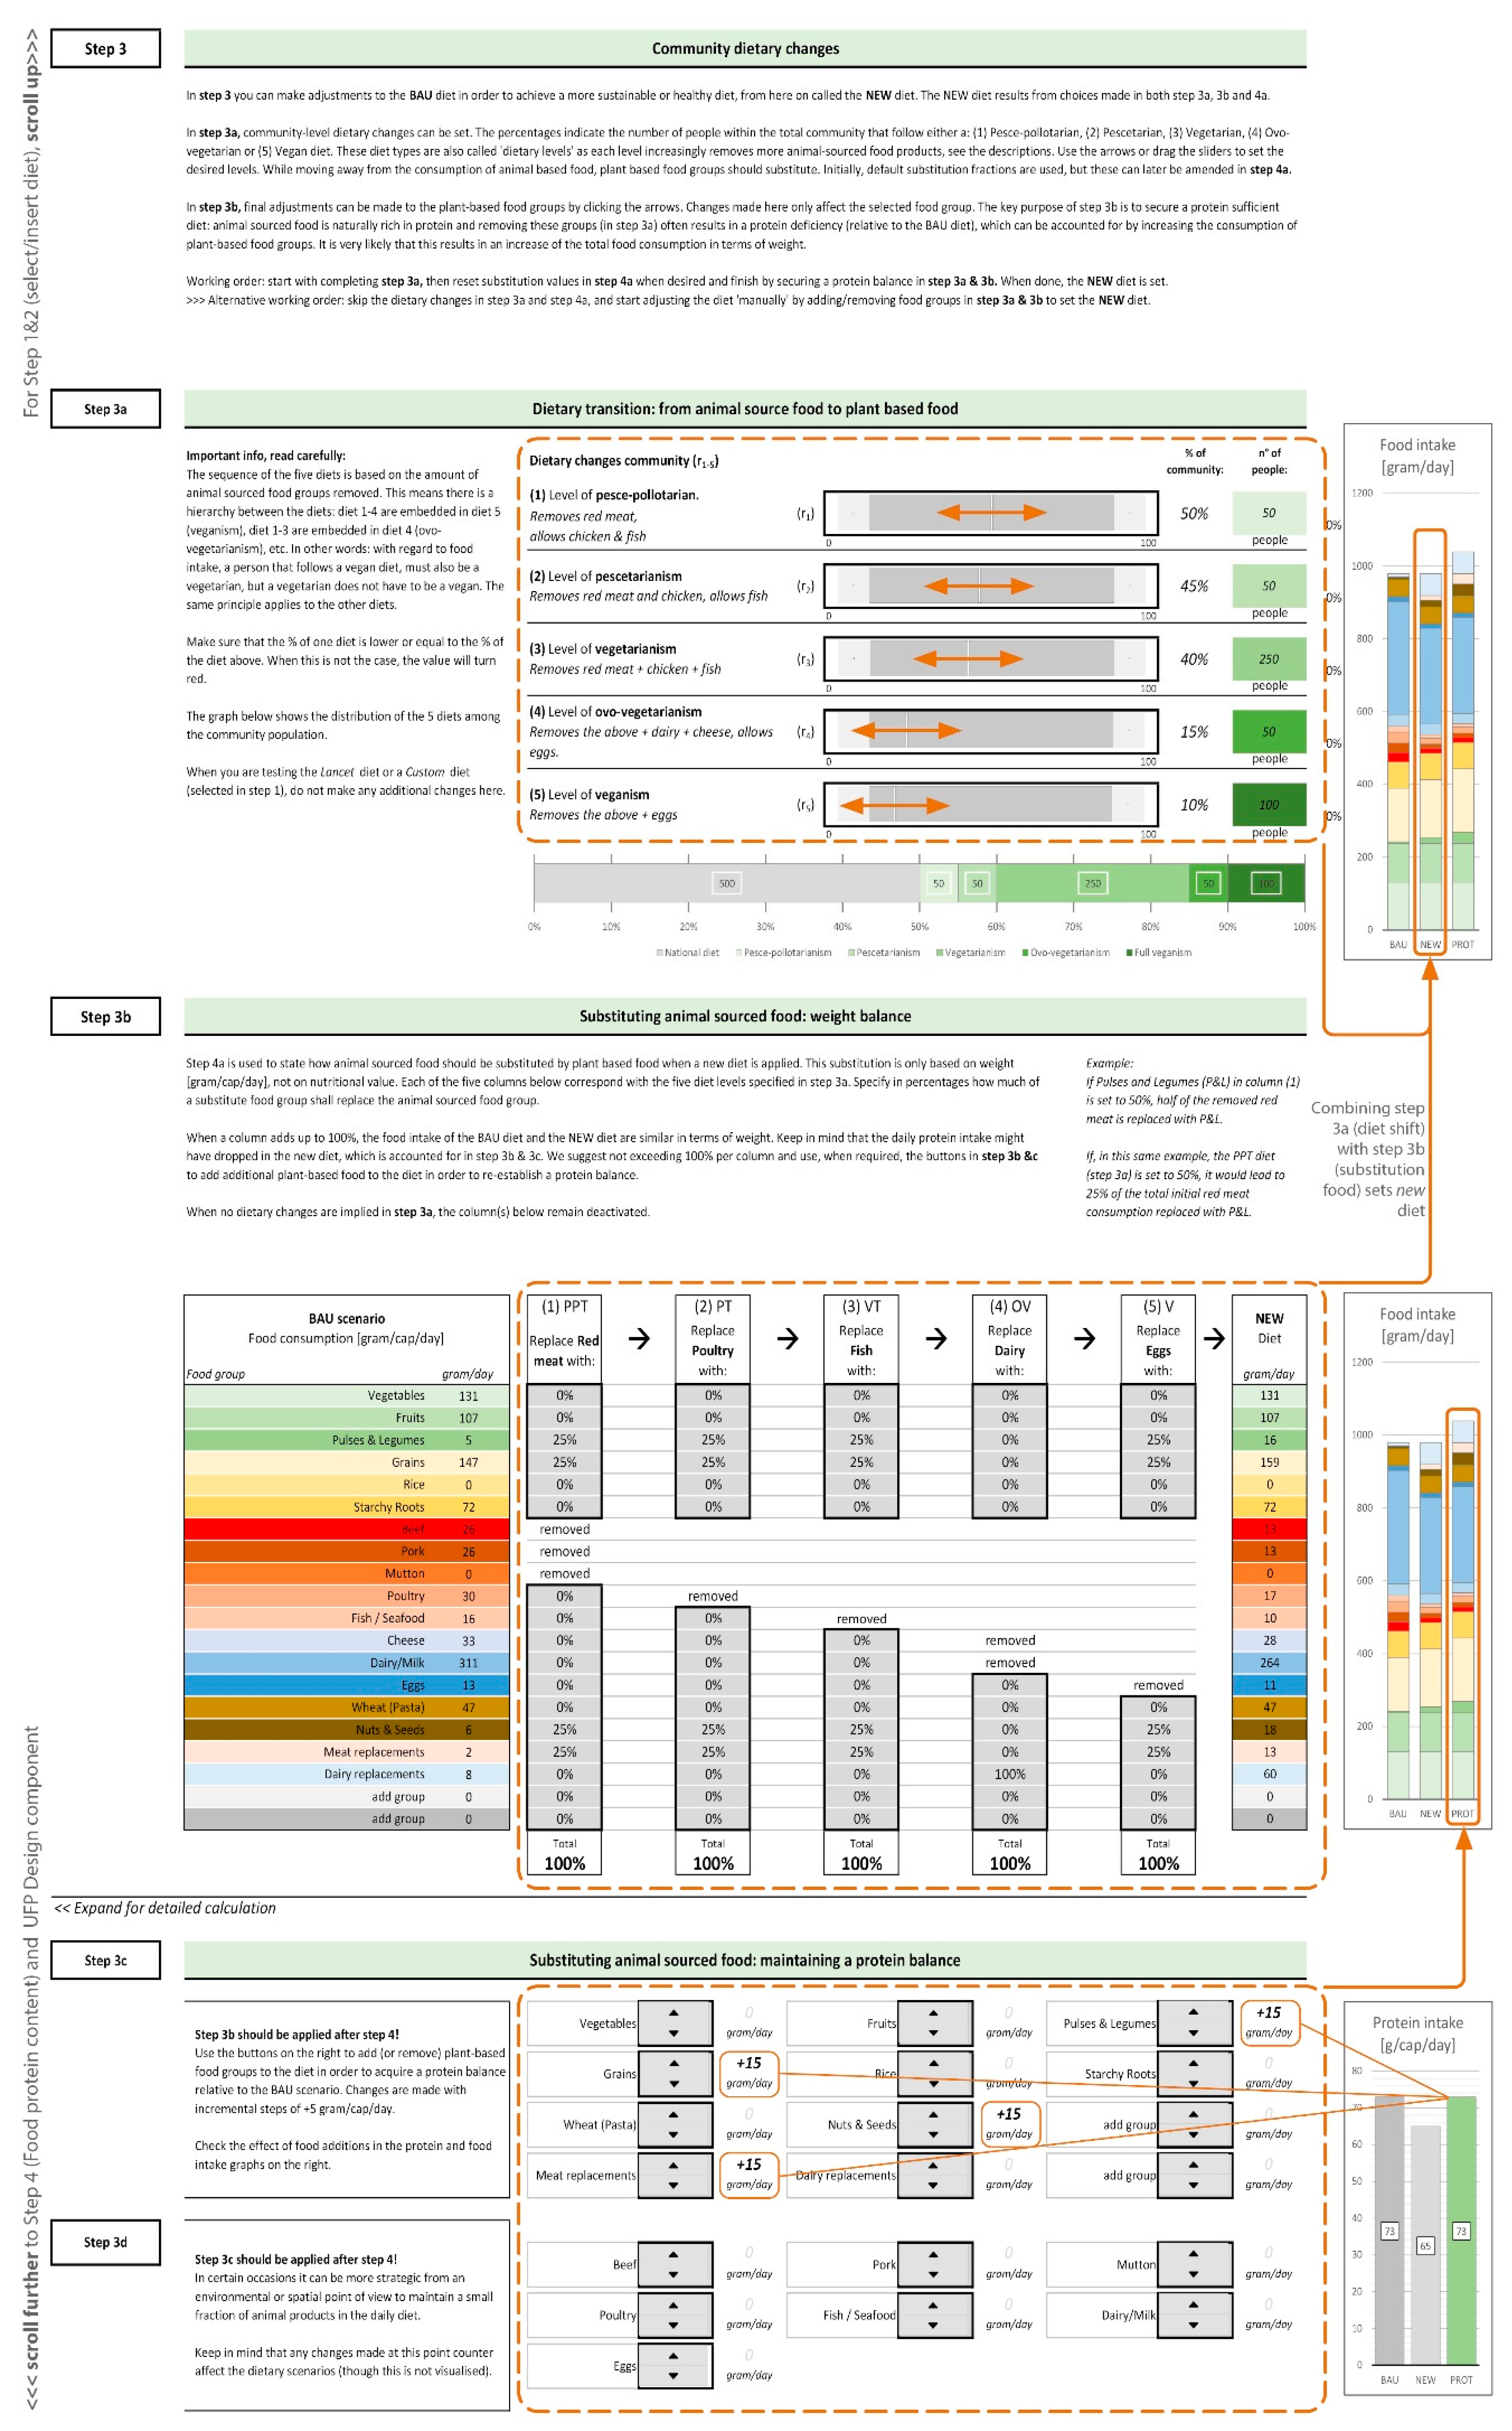
Figure 2 displays a screenshot of the diet shift component of the MS Excel based platform that consists of steps 3a to 3d. The dietary transitions are inserted in step 3a. The percentages, noted by , represent the fraction of the total community that follows a specific diet. The dietary levels follow a hierarchy according to increasing removed food groups, and each broader restriction contains the lenient one (e.g., a vegan must by definition also be a vegetarian, but a vegetarian is not necessarily a vegan). This means that the inserted value of a diet tier can therefore never be higher than the preceding tier. In step 3b, substitution food is selected and quantified to maintain consumption balance based on weight. Step 3c is used to manually reinstate protein intake equilibrium with plant-based products after diet shift. Step 3d can be used to manually adjust the diet according to the users’ preferences.
2.4. Diet Scenarios
For all three assessed communities, four alternative diet scenarios and their impact on the community’s total carbon footprint are calculated and compared with the baseline. The scenarios are in order of removed animal products, illustrating a gradual transition towards a vegan diet. Substitution factors are presented in Table 1. In each scenario, discussed animal food group(s) are completely removed from the diet. The equation framework and parameters used to assed the transition are further discussed in Section 2.5.

Table 1.
Substitution values used for the diet scenarios (scen.) in this study. >< = removed from diet in that tier.
The five scenarios:
- Business as Usual (BAU) represents the current situation without any dietary changes. Food consumption is based on national survey data.
- Pesce-Pollotarian diet—animal substitution (PPTA, ). For all people in the assessed community, the beef, pork and mutton food groups (red meat) are completely removed from the diet and replaced with animal-based substitutions: poultry () and fish, ().
- Pesce-Pollotarian diet—plant substitution (PPTP, ). For all people in the assessed community, beef, pork, and mutton food groups (red meat) are completely removed from the diet and replaced by plant-based alternatives. Substituting food groups and values are listed in Table 1.
- Vegetarian diet (). For all people in the assessed community, the food groups beef, pork, mutton, poultry, and fish are completely removed and replaced with plant-based alternatives according to the values listed in Table 1.
- Vegan diet (). For all people in the assessed community, all animal-sourced food groups are removed and replaced by plant-based food according to the substitution values listed in Table 1.
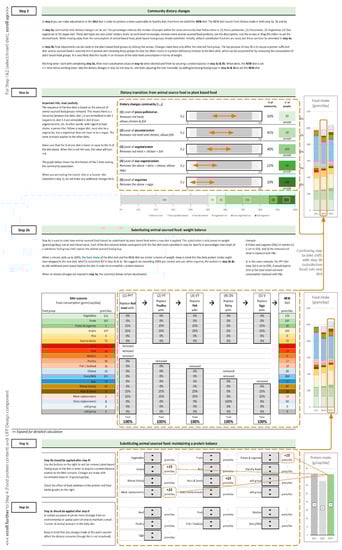
Figure 2.
Screenshot of the FEWprint tool interface. Step 3a: The sliders used to set the values (r1–5) for the various diets. The graph shows the NEW diet (=weight balanced) and PROT diet (=protein balanced) Step 3b: Substitution values should be inserted for each of the five-diets tier, or default values can be used. Step 3c & 3d: Increase or recompose the food intake of plant based or animal-based food groups to account for the protein deficiency. Displayed values are exemplary.
2.5. Equations Framework
A new and community-wide diet scenario is simulated by inserting the fraction of the community that will follow an intended alternative diet. Equations (1)–(6) are used to determine how removed animal-based food categories are substituted throughout the five dietary levels with plant-based food groups in order to maintain an equal food intake in terms of weight. The various values applied in this study are similar to the default values used in the FEWprint (listed in Table 1) and aim towards a lower-emission alternative diet with increased consumption of varied plant-based food groups that are naturally high in protein content.
All calculations start with the (contextualised, ctx) present food intake of a food group, denoted by the Per Capita Consumption, [g/cap/day], where n refers to the food group represented by its listing number 1–18 in Table 2. The new per capita food consumption is noted by [g/cap/day]. A dietary shift towards a PPT, PT, VT, OV, and VG diet are respectively simulated with the factors r1, r2, r3, r4, and r5, where the number refers to the diet tier. The r value sits between 0% (no people in the community will follow that specific diet) to 100% (everybody) and since the lower-tier diets are contained in the higher ones, the constraint applies. The substitution percentages are represented by to , where the sub number corresponds with the diet tier. For example, implies that half of the removed red meat after the BAU to PPT shift is replaced with poultry (group 10). Within one diet tier, the total of all values should add up to 1.0 to secure an equal food weight intake. The aforementioned factors are displayed in Figure 3 for clarity. The combined effect of applied and values in one tier trickle down to all the lower diet tiers, as is visualised in Figure 4. Equations (1)–(6) and the default values are embedded in the diet shift component of the FEWprint platform to streamline the simulation.
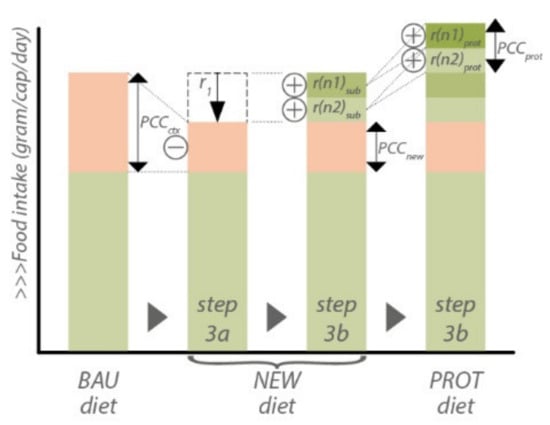
Figure 3.
Various factors used in diet shift simulation.
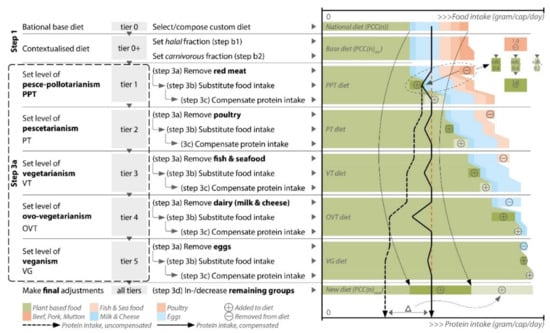
Figure 4.
FEWprint diet and calculation hierarchy. Step 3a to 3c correspond with the FEWprint steps shown in Figure 2 and are used to establish the new diet. The dashed lines indicate the protein intake without supplementary food for protein balance, the straight line represents the balanced intake.
As mentioned in Section 2.2, the animal-based food that is removed by a diet shift, is substituted with four different plant groups: (1) Legumes and Pulses, (2) Grains, (3) Nuts and Seeds, and (4) Meat replacers. These products are used both to maintain equilibrium in terms of weight (step 3b) as well as securing a protein intake equilibrium (step 3c). In order to maintain a protein equilibrium, the above products are repeatedly added in steps of 5 g in the same sequence as listed above, until a similar protein intake as the baseline situation is achieved, which is called the PROT diet. In addition to the ability of starting with a fully customisable diet, all the diet transition levels (rx), substitution ratios (), and plant alternatives used as protein replacers can be specified according to the user’s priority in the platform.
Figure 4 depicts the diet hierarchy applied in the FEWprint platform and shows how changes on one level trickle down to affect the dietary composition on successive levels. Community-wide dietary changes throughout tier 1 to 5 are based on the contextualised diet, i.e., the national diet adjusted to the local context by accounting for halal diets and the meat lover population. Finally, the consumption of plant-based food groups can be adjusted to re-establish protein equilibrium in step 3c. In addition, any other dietary changes the user wishes to simulate, for example, an increase in fruit consumption, can be inserted in steps 3c and 3d.
2.6. Urban Case Studies: Amsterdam, Belfast & Detroit
Three urban communities have been selected for a continued analysis on the role of food and a diet transition with regards to their FEWprint carbon profile. The first case is the residential neighbourhood of Kattenburg in Amsterdam, which holds a population of about 1700 people. The second case is Inner-East in Belfast, where about 32,000 people live. The third case is the smaller Oakland Avenue Farm community in Detroit, where currently 427 people are living. The three cases, their consumption of FEW resources, and the relevant carbon emission indicators are more thoroughly discussed in Caat et al. [12]. Table 2 lists the dietary intake [gram/cap/day], country-specific carbon footprint data [kg CO2e/kg food] and protein contents [g/100 gfood] applied in this study.
Table 2.
Dietary intake of the 18 food groups, PCC(n) [gram/cap/day] + applied contextualization parameters , , and [%]. n.d. = no data available or not mentioned as an individual food group but logged under other group. Consumption values only contain non-processed food items. Protein content of food groups. FAO data is used for further assessment and values represent the average protein content of an extensive list of products. Protein content values apply to retail weight.
3. Results
Five diet scenarios were assessed with the FEWprint platform for an urban community in Amsterdam, Belfast, and Detroit. The first objective is to assess the theoretical carbon emission mitigation potential of a diet shift towards a plant-based diet (Section 3.1). The second objective is to see how the average food intake changes during the diet shift when a protein intake equilibrium is maintained (Section 3.2).
3.1. Carbon Implications
The business as usual (BAU) and the four theoretical diet scenarios have been assessed based on their total [kg/cap/y] and relative impact [%] on the overall carbon equivalent footprint of the community (Figure 5). The substitution factors (, Table 2), diet shifts, and assumed amount of protein contained within a food item/category are similar for each of the cases during the simulations. In addition, the scope of assessed food consumption is aligned between cities as much as possible so that for each community, the same food items are accounted for in this carbon assessment [12].

Figure 5.
Carbon emissions of the food sector (dark color = animal products, light color = plant products. (a) [top left] Food sector emissions (AMS, BEL & DET) for the 5 diets [kg/cap/year]. (b) [top right] Carbon reduction per removed food categories (c) [bottom left] Relative impact of a dietary change on the food sector emissions [%]. The PPTA and PPTP diet has been split in two nodes, where the PTTP (plant alternatives) diet is represented by the dashed line. (d) [bottom right] Relative carbon emission reduction of a diet shift on the total FEWprint of a community.
Figure 5a shows the absolute impact of diet change on food-related emissions. Removing animal-sourced food categories and replacing them with plant-based alternatives predictably leads to a drop in the food-related emissions for all three communities. However, the carbon emissions mitigation potential of such diet transition varies considerably per country. The largest carbon mitigation potential, i.e., the difference between the present situation and the vegan scenario, awaits in Detroit (−916 kg CO2eq), closely followed by Belfast (−866 kg CO2eq) and then Amsterdam (−511 kg CO2eq). The red meat categories dominate a significant part of the emissions in the Belfast and Detroit cases, which is evidently visible in the graph. In Amsterdam, the largest drop in emissions can be seen when cheese and dairy are removed from the diet.
Figure 5c,d shows the relative impact throughout the four alternative diets for respectively the food sector and the total FEWprint of the community. In Amsterdam, Belfast, and Detroit, the food sector initially constitutes respectively 30% (993 kg CO2eq) 37% (1270 kg CO2eq), and 9% (1152 kg CO2eq) of the total emissions. Even though the largest reduction is in absolute numbers theoretically achievable in Detroit (−916 kg/cap/y, Figure 5a), when a vegan diet is maintained, in relative terms, the impact sits just below 7%. In comparison, a vegan diet in Belfast would reduce the total carbon emissions of a community by about 25%—the highest reduction potential of the assessed case studies.
Figure 5c,d show two curves for each case study. For all three cities, the upper node in the PPT column represents the scenario where the red meat category is substituted with animal-sourced alternatives (PPTA). The bottom node represents the scenario in which red meat is substituted with plant-based food (PTTP). Substituting red meat with plant alternatives instead of meat alternatives leads to lower emissions in all three cases, with the Detroit case showing the largest difference (132 kg CO2e/y).
3.2. Food Intake Shift
When transitioning through the diet alternatives, removed animal-based food products are equally substituted in weight equivalents according to the substitution factors listed in Table 2. In addition, as a result of securing a protein intake equilibrium relative to the current situation, surplus plant-based food that is naturally high in protein content should be consumed.
When comparing the present diet with the vegan diet in each case study, most surplus food is required in Amsterdam (+80 g/cap/day), followed by Detroit (+75 g) and Belfast (+65 g), shown in Figure 6. All communities show a steep drop in protein intake when dairy and eggs are removed from the diet, resulting in a considerable increase in surplus consumption to compensate. This can be attributed to the combined effect of relatively high consumption of dairy (AMS: 254, BEL: 262 and DET: 139 g/day) and high protein content of dairy (8.30 g/100 gfood), that is fully substituted with a soy-based alternative with a lower protein content (3.0 g/100 gfood), hence requiring more consumption from the other categories to level the intake.
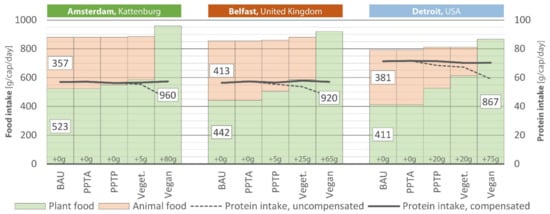
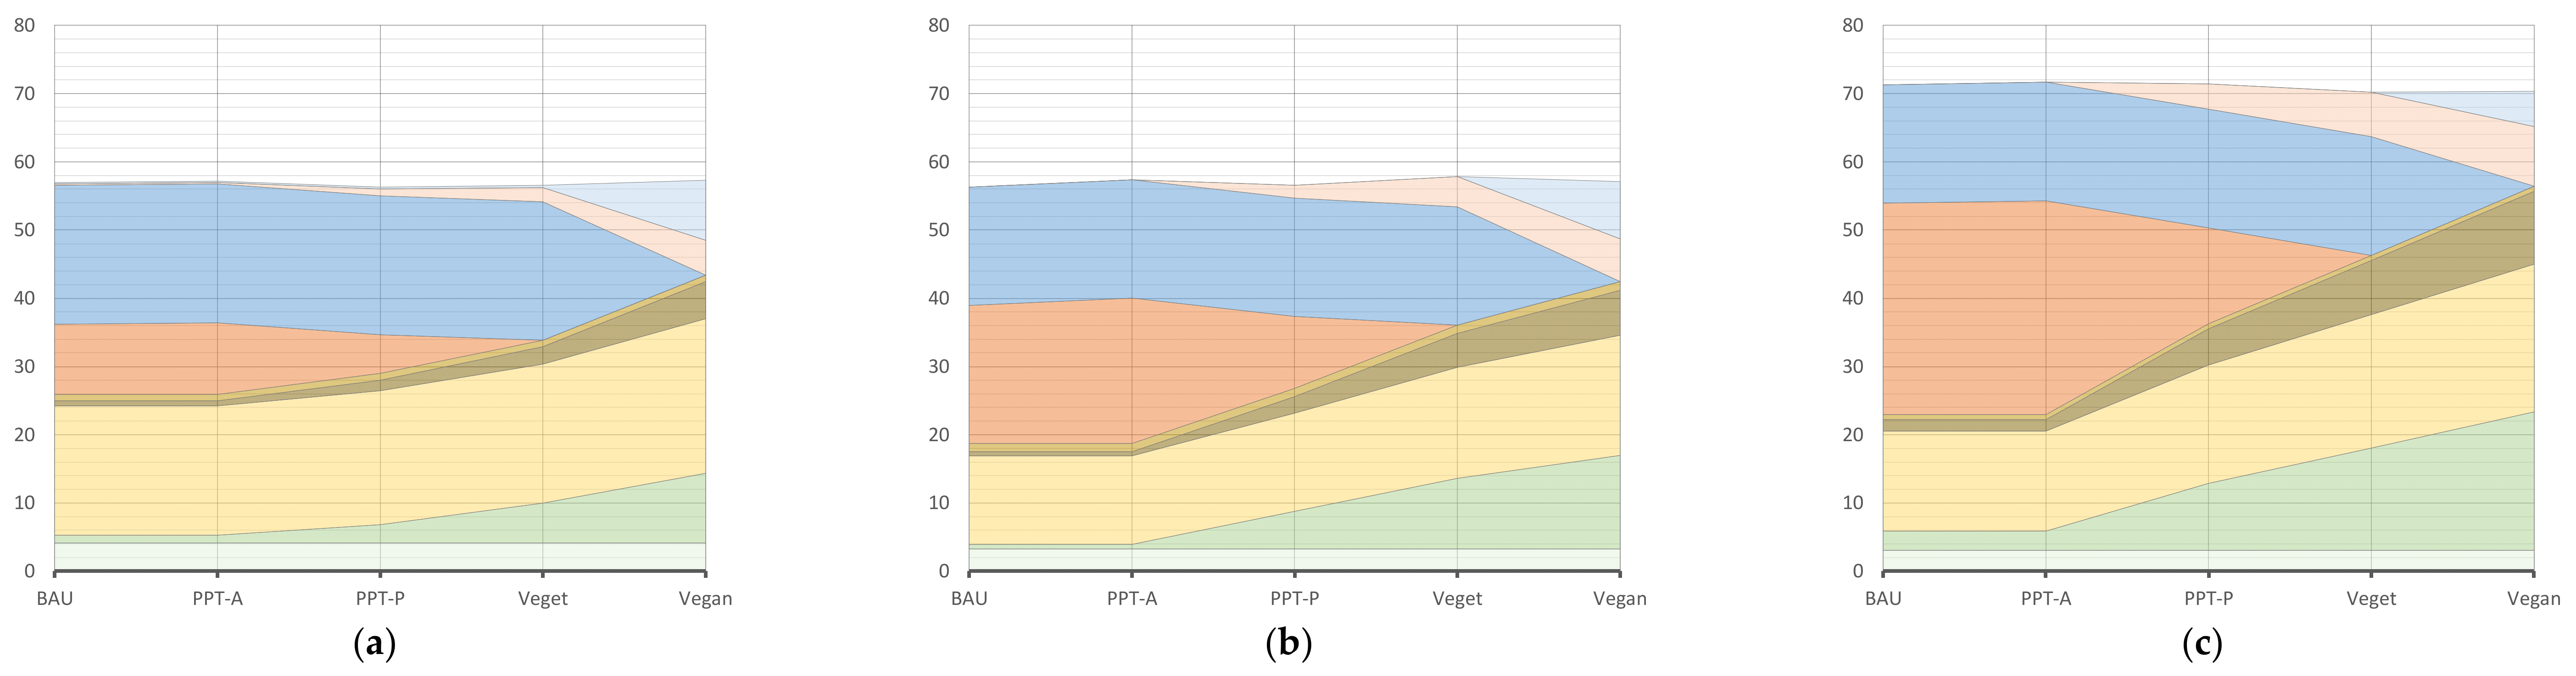
Figure 6.
Change of food intake throughout the five diets, subdivided in animal and plant-based products [left vertical axis, gram/cap/day]. The dashed line shows daily protein intake [right vertical axis, g/cap/day] when protein deficiency would not be compensated with surplus food. The values right above the horizontal axis show the surplus food intake relative to the BAU situation. Due to roundups/decimals, the compensated protein intake line is not fully straight.
3.3. Interpretation
A dietary transition from a conventional diet to a full-vegan diet has a different impact on a community’s FEWprint in each of the three cities. With regards to the food sector emissions only, the differences in outcome between cities can be ascribed to the effect of combining two key variables: the community-specific food intake () and the country-specific (LCA based) global warming potential of food groups (). With regard to the total FEWprint, inter-city differences are also caused by the -sometimes domination- role of the other sectors.
When simulating a pesce-pollotarian diet (removes red meat), a considerable drop in emissions is observed for Belfast and Detroit, whereas in Amsterdam, the drop is less significant during this diet shift. This can be explained by the considerable differences in initial red meat intake of the communities (AMS: 26.2 g, BEL: 57.0 g & DET: 91.9 g) and the higher carbon emission factors applied to red meat in Belfast, see Table 2. A similar observation can be made when a fully vegan diet is simulated and eggs and dairy are removed, resulting in the largest emission drop in Amsterdam. Consuming additional plant-based food to secure protein intake equilibrium has a counteractive effect on the carbon emissions drop caused by the initial diet shift. These surplus emissions are however in a lower order of magnitude than the avoided emissions associated with the diet shift, also see Appendix A.
4. Discussion
4.1. Robustness of Outcomes
In order to obtain accurate output figures, resource consumption data should be collected/measured at the lowest possible data aggregation scale. Data collected at higher scales will increasingly lose its relatedness with the considered community. Protein content should be based on the actual food commodities that are consumed by the community. Finally, environmental footprint indicators should be based on, (a) Life Cycle Inventory assessments and (b) the actual resources/products/services used or consumed in the considered urban context. However, situational consumption data may not always be readily available, and producing this relevant context-based data is resource-intensive. As the platform is intended to support non-experts during urban design concept explorations—for which highly accurate output is not essential—certain simplifications are permitted to grasp the situation. Naturally, this leads to compromises surrounding the robustness of the output.
This study makes use of Life Cycle Inventory based GHG emissions factors for food that have been retrieved from peer-reviewed literature (Belfast and Detroit) or independent consultants (Amsterdam). It is likely that outcomes will be different when different carbon footprint databases are addressed, when different values are assumed for the protein content of food categories or when a more comprehensive food scope is used. In previous research, it was revealed that between developed cities, consumption data is often collected/measured at very different scales [12]. We recommend platform users to search, study and insert contextual data when available, before resorting to data collected at, for example, the national level.
4.2. FEWprint Application Potential
The parametric FEWprint diet shift component demonstrated in this study is part of a three-pronged urban food production assessment strategy. The component can be used to generate an estimation of the role of food consumption to the total FEWprint of a community and how the food sector emissions compare to the other sectors. This insight gives a preliminary idea on which resource sector to emphasise when exploring an urban redesign strategy or any other city decarbonisation effort (Section 3.3). The rigorous and rather optimistic diet transition scenarios applied here remain particularly hypothetical (also see Section 4.3.4). However, the impact assessment of such community-wide behavioural changes could instil inspiration and incentivise a movement to further explore opportunities for urban farming design, which could be of great value in the process of future urban design.
From a technical perspective, a diet shift could increase the potential of urban food production in terms of self-sufficiency. This is especially relevant when a UFP strategy is designed as part of a long-term strategy that takes into account projected or speculative developments surrounding (local) food culture. The agricultural output of an urban food system could be expressed in protein availability per community member and the extent of meeting the lower threshold level for an average person (0.83 g/kg body weight) can be articulated as a self-sufficiency fraction. Considering the high space demand for animal husbandry resulting from grazing and feedstock production, maximising self-sufficiency in space-constrained (peri-) urban contexts could be more feasible if the community demand for plant-based protein is increased at the expense of animal protein. This is however a context-dependent challenge as each urban environment offers a unique canvas for a food production design. Hybrid plant-animal protein solutions are likely more feasible in terms of protein provision and more space-efficient when resource loops are closed, for example by applying high-density livestock with higher food conversion ratios (poultry, fish, eggs) or using neo-food products like insect protein.
The FEWprint platform embeds evaluation, diet shift, and UFP design into an iterative process. The diet shift component is linked with the design component of the platform and it can be granted a determinative or a responsive role. In a determinative role, it can translate the community’s food demand into concrete targets for agricultural output, according to which a system should be composed and designed. In a responsive role, a new diet can be configured around the agricultural capacity of a UFP strategy and translated into a daily food intake, i.e., a per capita daily availability of local production.
4.3. Limitations
Several limitations arose during the research and development of the platform. Most limitations revolve around data availability and food composition data.
4.3.1. Protein Content
The macronutrient content between similar food products can vary significantly because of climate, geography, agricultural practises, crops genetics, or processing influences during the food production and preparation stages [52]. In addition, food consumption patterns lead to country-specific foods, recipe compositions, and food brands. For a representative output, each diet simulation and UFP strategy should be conducted with local data that has been collected and processed according to international standards for comparability [53]. However, research for this study revealed discrepancies between countries when comparing protein content for individual food items and aggregated values used for food groups (Table A2 and Figure A4).
In line with the user-friendly aspect of the platform, this study uses datasets that are publicly available. The Dutch online dataset consists of 2152 food items and nutritional values that are derived from chemical analysis in accredited laboratories. Before values are recorded, a quality check is conducted surrounding the description of the food item, sampling procedure, and method of analysis [54]. The Belfast dataset is provided by the British Nutrition Foundation and consists of pre-aggregated protein indicators for food groups [55]. No further information is provided on the origin of the data nor the sub-products contained within the values. The Detroit values are provided by the US Food and Nutrition Information Centre [56]. Despite providing an elaborate list of well-described food items, values are expressed in household units (e.g., cups, slice, serving) making it difficult to determine reliable protein content values. Only meat items are consistently expressed in ounces (~28.4 g) and are therefore submitted to Table A2. The FAO [45] provides an extensive dataset of as purchased protein values and claims to be suitable for international use, however, no further information is provided about the data’s origins.
The protein content of food categories determines the composition of the new diet. Variation of protein factors between cases would influence the way a new diet is formed during the transition and subsequently affect the emissions associated with that resulting diet. In order not to include a third variable in the equation and decrease the comparability between case studies, this study applies the universal FAO food balance sheets to all three cases, despite the considerable differences with the national values for certain food categories. A graphical and tabulated overview of the protein data is provided in Appendix B.
4.3.2. Food Scope and Aggregating Indicators
The FEWprint uses 18 food categories to frame UFP design and assessment. To secure inter-component integration, the platform’s food scope is limited to unprocessed and minimally processed food products, while drinks, with the exception of milk products, have been excluded [12]. Therefore, the range of food products provided by the datasets has to be transformed and aggregated (or disaggregated) into a single representative indicator per category. This process of data clustering applies to all three key factors (food intake, carbon impact, and protein content) as none of the source’s scopes aligns seamlessly with this study’s food scope. In addition, the three factors are provided by different institutions that do not align on their scopes and/or nomenclature among each other, thus compromising the comparability between the case studies. Combined with the aforementioned uncertainties around the institution’s data collection methods, the accuracy of the output in this study comes with a degree of uncertainty, affecting the comparability.
4.3.3. Animal vs. Plant Products: Mutually Substitutable?
In Section 2.1 it was mentioned that for a meaningful and accurate assessment, the protein quality of a plant-based diet should be considered at the amino acid level (AA). The quality of food-borne protein depends on the digestibility of the protein and the composition and bioavailability of essential amino acids in the food [30]. To account for protein quality at the product or diet level, the Digestable Indispensible Amino Acid Score (DIAAS) factor was developed, a successor to the PDCAAS indicator [37]. This index considers amino acids as individual nutrients and applies a more accurate measuring method. The nutritional quality score of protein, a food product, or a dish is dictated by considering the least digestible amino acid within that item. An extensive catalogue of DIAAS values for various human food products is still unavailable, but first publications show that the DIAAS factors of animal-based products (groups) are superior to their plant-based siblings [38,57]. This insinuates that animal and plant products are not mutually substitutable merely on the basis of protein quantity and suggests that, after compensating for the total protein content at the product level, also the quality difference at the protein level should be accounted for.
Plant proteins are often limited by the lack of one or two key amino acids, leading to a reduced DIAAS index [36]. Cataloguing the digestible indispensable amino acid contents of food groups and/or individual products can inform the combination and ratio of plant-based food mixtures, where one product compensates for the AA deficits of the other on the plate. Herreman demonstrates this for a rice-peas mixed dish, where rice, as a sole-source would have a DIAAS of 47 due to the poorly available amino acid Lysine, and peas have a DIAAS of 70 (limiting AA = methionine and cysteine). A rice-peas mix, however, in which rice constitutes 41% of the protein content, would lead to a DIAAS score of 84 [58]. Achieving a >100 DIAAS score for daily food intake, and subsequently, the community diet, could be achieved by a strategic combination of plant-based protein and minimal amounts of animal protein to close the gap, ideally with lower impact products like chicken and eggs.
Without the strategic combination method as described before, integrating the DIAAS quality correction factor to secure protein intake equilibrium could lead to an unreasonable surplus intake of plant-based food to compensate for the least digestible amino acid. This subsequently puts an unnecessary high demand on the food system, especially in developed countries with an already varied diet. The authors acknowledge the reduced bioavailability of essential amino acids and the added value of working with DIAAS. However, we decided not to adjust for this gap in this research as it would overcomplicate this assessment with regard to its purpose, it would complicate the platform, and it would further increase the uncertainty of outcomes due to the current unavailability of suitable data.
To summarise, this study only adjusts for the lower protein content of crops at the product/group level to keep the platform comprehensible. We assume an adequate and heterogeneous intake of amino acids is achieved by adhering to the general recommendation to focus on variety within the new diet and replace animal protein with four plant-based categories (legumes, grains, nuts and seeds, soy products) in an equal proportion during the various simulations.
4.3.4. Radical Diet Scenarios
A near-future and community-wide abandonment of animal products for the purpose of decarbonisation is a rigorous and unrealistic scenario and therefore remains theoretical. National survey data reveals that the prevalence of the vegetarian-vegan population, in its purest sense, is still very low: for example respectively ±5% and ±0.4% in the Netherlands [59] and 5% and 3% in the USA [60]. Food consumption is deeply rooted in cultural behaviour or identity, people have been omnivorous for many generations and arbitrary impositions of dietary change on a community are unlikely to yield the intended desirable shift as food consumption remains a personal choice [61]. This study discusses the carbon reduction potential of changing a diet and does not consider the complex reality of bringing about such socio-cultural interventions, which goes beyond the technocratic nature of this research alone.
The arbitrary diet scenarios used in this study are culturally independent, non-geographical, and can be projected to any diet that is consumed in a locality. The assessed alternative scenarios are therefore also not based on context-based opportunities or agricultural potential but rather function as qualitative labels that are attachable to any conventional diet. The change to a more plant-based diet, as is simulated in this study, is usually a personal choice driven by intrinsic and external motivations; therefore, the community’s engagement is very important. Consumer behaviour towards food consumption depends on a broad range of factors, and some simulated changes might not be considered reasonable or realistic within a community, possibly neglecting cultural acceptability [44]. Sustainable diet alternatives that are composed according to cultural aspects and local food management opportunities are likely more realistic and therefore more interesting to assess. The platform offers the framework for evaluating such diets, as long as the dietary recommendations can be translated into the 18 food groups used in the platform. In addition, two free slots are provided to insert food categories that are relevant to the considered context but that do not fit the 18 default categories.
4.4. Outlook
4.4.1. Data
In this study, we perform a comparative analysis between three urban communities. Comparative analysis requires harmonisation between sources on data gathering by measuring standardisations, scale level of data aggregation, scope alignment, coherence regarding units, and similarity in taxonomy. Life Cycle Inventory Analysis provides the framework to overcome the aforementioned challenges and is increasingly used to quantify the environmental impact of products and services. However, more work is required to integrate the LCI method in public datasets and –equally important– commutate the underlying calculation methods to the user. At last, we want to emphasise the importance of using independent and scientifically validated sources when assessing food.
4.4.2. Further Research
The parametric platform was developed based on the principles of the FEW nexus and informs the user during the conceptual and exploratory phase of UFP design. The diet shift component is demonstrated in this work and provides rapid feedback on the implications of a diet shift on the sectoral and total emissions of a community and calculates the food intake changes based on user-defined settings. The three components are interlinked with each other and are not completed in a linear fashion but rather facilitate an iterative process of design and evaluation that leads to a numerically supported UFP strategy (Figure 7). The design component of the platform will be discussed in future dissemination.

Figure 7.
The FEWprint platform is composed of 3 components that correspond with the 3 key purposes of the FEWprint platform. The labels indicate the considered case study cities.
5. Conclusions
In industrialised nations, the consumption of food often constitutes a significant part of a community’s total carbon emissions footprint. Animal-sourced food products are usually responsible for the largest share of the food sector emissions. Urban food production (UFP) is a strategy that could mitigate the carbon emissions from the producers’ side; however, adequate design and assessment platforms for urban designers are lacking. A community-wide shift towards a plant-based diet is an effective way to reduce emissions from the consumers’ side. When (re)designing neighbourhoods with the intention of food self-sufficiency and low-carbon impact, the combined application of both strategies is worth exploring. This article introduces and demonstrates the diet shift component of the FEWprint platform to simulate and assess, at the community level, the carbon emissions and food intake implications of a rigorous transition to a fully vegan diet, whilst maintaining protein intake equilibrium. As part of a larger UFP approach strategy, the FEWprint can be deployed to rapidly generate preliminary estimations on the carbon mitigation potential of dietary alterations. Three urban communities in the cities of Amsterdam, Belfast, and Detroit were studied, where consumption of a selection of 18 staple food groups currently emits respectively 993, 1270, and 1152 kg/capita/year, or 30%, 37%, and 9% of the total emissions. A dietary shift to a vegan diet would mitigate the emissions with 25% in Belfast (−866 kg CO2eq), 15% in Amsterdam (−511 kg CO2eq), and 7% in Detroit (−916 kg CO2eq). The protein intake deficit that emerges during transition can be adjusted for with an estimated surplus consumption of +80 (AMS), +65 (BEL), and +90 g (DET) of various high-protein plant-based food categories. Future disseminations will demonstrate the design component of the platform and how UFP can further mitigate the food sector emissions.
Supplementary Materials
The following supporting information can be downloaded at: https://www.mdpi.com/article/10.3390/su14031797/s1. Document S1: FEWprint platform_20-01-22_v9.0-template; Document S2: FEWprint platform_20-01-22_v9.0_Example BAU assessment; Document S3: FEWprint platform_20-01-22_v9.0_Example BAU assessment + Diet shift; Document S4: FEWprint platform_20-01-22_v9.0_Example BAU assessment + Diet shift + UFP Design.
Author Contributions
Conceptualization, N.t.C., A.v.d.D.; methodology, N.t.C., M.T., A.v.d.D.; software, N.t.C.; investigation, N.t.C.; data curation, N.t.C., M.T.; writing—original draft preparation, N.t.C.; writing—review and editing, N.t.C., M.T., A.v.d.D.; visualization, N.t.C.; supervision, M.T., A.v.d.D.; project administration, N.t.C.; funding acquisition, A.v.d.D. All authors have read and agreed to the published version of the manuscript.
Funding
This research was funded by the Belmont Forum and the Joint Programming Initiative (JPI) Urban Europe, grant number 11314551.
Institutional Review Board Statement
Not applicable.
Informed Consent Statement
Not applicable.
Data Availability Statement
See Appendix C.
Acknowledgments
The study is part of the SUGI/M-Nex research (acronym for Moveable Nexus). M-Nex is a joint effort supported by the Sustainable Urbanisation Global Initiative (SUGI) programme. The authors want to express their gratitude to the Dutch Research Council NWO. Finally we want to mention project colleagues Tithi Sanyal and Geoffrey Thün for their knowledgeable support during the FEWprint development. Any opinions, findings, and conclusions or recommendations expressed in this paper are those of the authors and do not necessarily reflect the views of the funding organisations.
Conflicts of Interest
The authors declare no conflict of interest. The funders had no role in the design of the study; in the collection, analyses, or interpretation of data; in the writing of the manuscript, or in the decision to publish the results.
Appendix A. Diet Simulation Results
Table A1.
For each case study, 5 diet scenarios are assessed. Roundup errors may occur throughout this work. Diets are explained below.
Table A1.
For each case study, 5 diet scenarios are assessed. Roundup errors may occur throughout this work. Diets are explained below.
| Scenario | Food Intake [g/cap/day] | Protein Intake [g/cap/day] | Carbon Emissions [kg/cap/y] | FEWprint Impact [%] | ||||||||
|---|---|---|---|---|---|---|---|---|---|---|---|---|
| Community | Diet | Animal Based | Plant Based | Surplus (Plant Based) | Total | Compensated | Uncompensated | Animal Based | Plant Based | Total (Animal + Plant) | Surplus (Plant Based) | |
| AMS Amsterdam Kattenburg | BAU | 357 (41%) | 523 (59%) | 0 | 880 | 57 | 57 | 709 (71%) | 284 (29%) | 995 (100%) | 0 | 100% |
| PPTA | 357 (41%) | 523 (59%) | 0 | 880 | 57 | 57 | 591 (68%) | 284 (32%) | 865 (−12%) | 0 | 96% | |
| PPTP | 331 (38%) | 549 (62%) | 0 | 880 | 57 | 56 | 491 (62%) | 305 (38%) | 796 (−20%) | 0 | 94% | |
| VT | 300 (34%) | 586 (66%) | +5 | 885 | 57 | 55 | 369 (52%) | 335 (48%) | 704 (−29%) | +13 | 91% | |
| VG | 0 (0%) | 960 (100%) | +80 | 960 | 57 | 45 | 0 (0%) | 484 (100%) | 484 (−51%) | +175 | 85% (−15%) | |
| BEL Belfast Inner-East | BAU | 413 (48%) | 442 (52%) | 0 | 855 | 56 | 56 | 1112 (86%) | 184 (14%) | 1270(100%) | 0 | 100% |
| PPTA | 413 (48%) | 442 (52%) | 0 | 855 | 57 | 57 | 472 (72%) | 184 (28%) | 656 (−49%) | 0 | 82% | |
| PPTP | 355 (41%) | 506 (59%) | +5 | 860 | 57 | 55 | 356 (60%) | 235 (40%) | 591 (−54%) | +17 | 80% | |
| VT | 295 (34%) | 585 (66%) | +25 | 880 | 58 | 54 | 238 (45%) | 296 (55%) | 534 (−59%) | +59 | 78% | |
| VG | 0 (0%) | 920 (100%) | +65 | 920 | 57 | 47 | 0 (0%) | 430 (100%) | 430 (−67%) | +143 | 75% (−25%) | |
| DET Detroit Oakland Avenue Farm | BAU | 381 (48%) | 411 (52%) | 0 | 792 | 71 | 71 | 1083 (93%) | 77 (7%) | 1152(100%) | 0 | 100% |
| PPTA | 381 (48%) | 411 (52%) | 0 | 792 | 72 | 72 | 532 (87%) | 77 (13%) | 610 (−47%) | 0 | 96% | |
| PPTP | 287 (36%) | 526 (64%) | +20 | 812 | 71 | 68 | 345 (72%) | 131 (28%) | 476 (−59%) | +26 | 95% | |
| VT | 200 (24%) | 612 (76%) | +20 | 812 | 70 | 67 | 229 (57%) | 173 (43%) | 402 (−65%) | +26 | 94% | |
| VG | 0 (0%) | 867 (100%) | +75 | 867 | 70 | 59 | 0 (0%) | 244 (100%) | 244 (−79%) | +94 | 93% (−7%) | |
Explanation of diets (also see Section 2.4): BAU, business as usual (or current diet), represents average food consumption of community. PPTA, pesce-pollotarianism, animal substitutes, removes red meat (beef, pork & mutton) from the diet and substitutes with poultry (50%) and fish & sea food (50%). PPTP, pesce-pollotarianism, plant substitutes, removes red meat (beef, pork & mutton) from the diet and substitutes with pulses & legumes (50%), nuts & seeds (25%), grains (25%) and soy products (25%). VT, vegetarianism, removes red meat, poultry and fish & seafood from the diet and substitutes as PPTP diet. VG, veganism, removes red meat, poultry, fish & seafood, eggs and dairy & cheese from the diet and substitutes as PPTP diet.
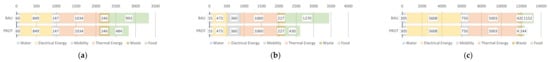
Figure A1.
FEWprint profile of the community, before (top bar graph) and after a diet shift (lower bar graph). Labels show carbon equivalent emissions in kg/person/year. Cases: (a) Kattenburg (Amsterdam), The Netherlands (population = 1721), (b) Inner-East (Belfast), U.K. (population = 32.000), (c) Oakland Avenue Farms (Detroit), USA (population = 427). Carbon impacts of the non-food sectors come from [12].
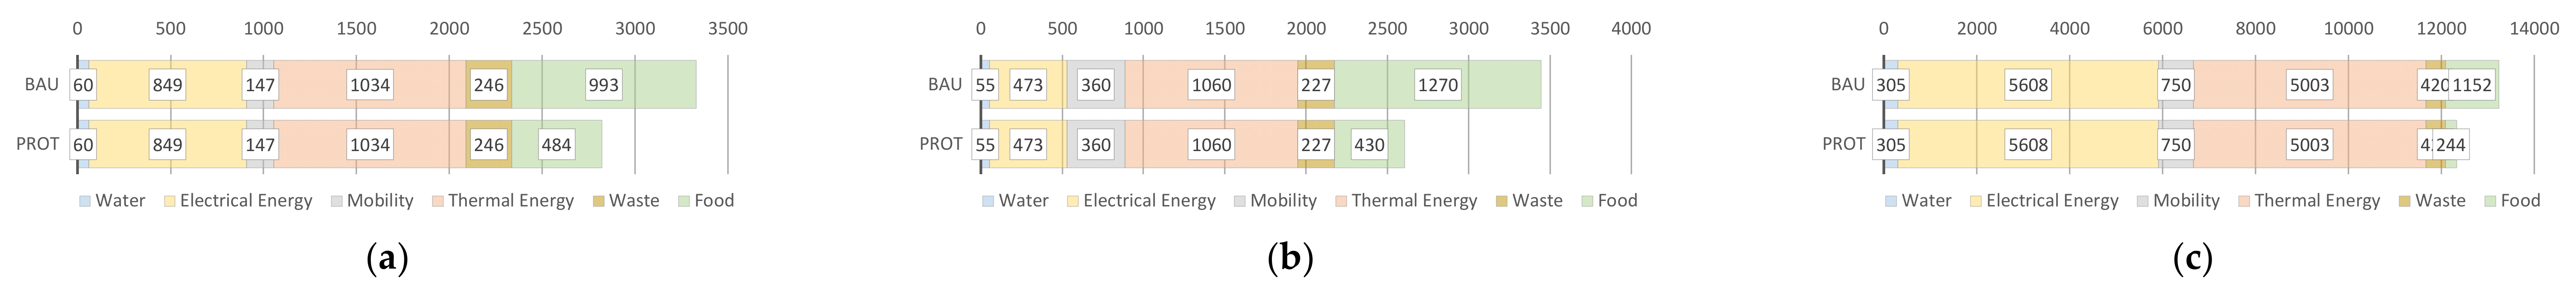

Figure A2.
Food related carbon emissions [kg/cap/year] throughout the five diet scenarios, split up in emissions consequential to animal- and plant based food consumption. Cases: (a) Kattenburg (Amsterdam), (b) Inner-East (Belfast) and (c) Oakland Avenue Farms (Detroit).
Figure A2.
Food related carbon emissions [kg/cap/year] throughout the five diet scenarios, split up in emissions consequential to animal- and plant based food consumption. Cases: (a) Kattenburg (Amsterdam), (b) Inner-East (Belfast) and (c) Oakland Avenue Farms (Detroit).
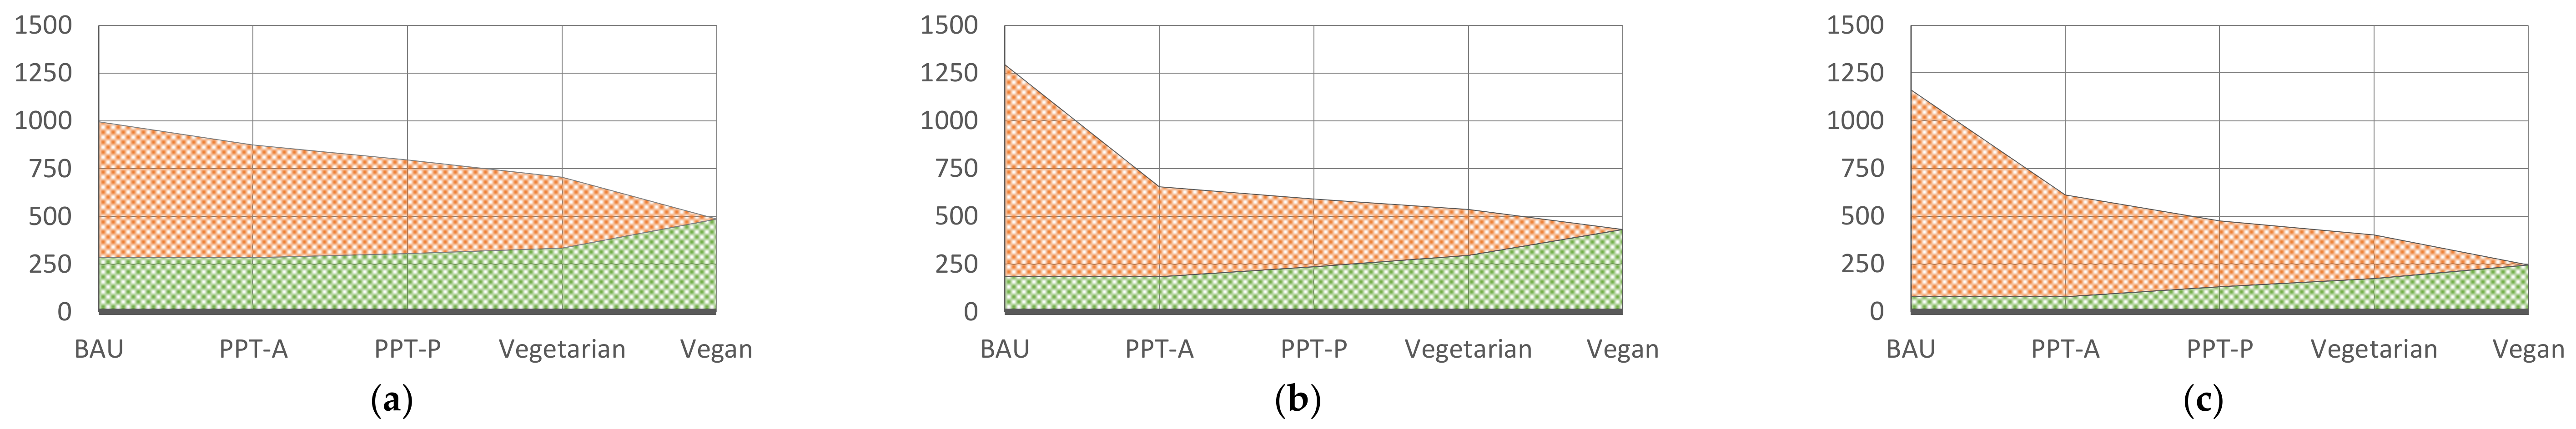

Figure A3.
Daily protein intake [gram/person] throught the five diet scenarios, subdivided into various sub food groups within the diet. Cases:(a) Kattenburg (Amsterdam), (b) Inner-East (Belfast) and (c) Oakland Avenue Farms (Detroit).
Figure A3.
Daily protein intake [gram/person] throught the five diet scenarios, subdivided into various sub food groups within the diet. Cases:(a) Kattenburg (Amsterdam), (b) Inner-East (Belfast) and (c) Oakland Avenue Farms (Detroit).
Appendix B
Table A2.
Knowing the protein content of food is relevant to calculate protein equilibrium after diet shift. For each case study, national datasets of protein content [gramprot/100 gfood] have been collected. Where necessary, individual food products listed by the sources are combined or re-categorised in order to align with the 18 food categories applied in this study. Processed, non-staple food and drinks (except milk) are not included in this overview. As discussed in Section 4.3.2, a considerable deviation in values becomes evident after data cleaning, which is visualised in Figure A4. In order not to add an extra layer of variables and further compromise the comparability between the cities, the non-contextual FAO dataset is used for further assessment of the diet transition. Table A3 shows the processed FAO dataset. Values represent the average protein content of an extensive list of products, where (n) represent the number of aggregated individual items. The Detroit column only shows meat products as only these categories have been expressed in weight units (oz.) in the data source, whereas the (nearly) all other items are expressed in household unit that are difficult to convert (e.g., tablespoons, scoops). Values represent the retail weight of food. n.d. = no data. Food group 17–18 are not retrieved from the dataset but constitute assumed customary replacement products due to an unavailability of data.
| Food Category | Protein Content [gramprot/kgfood] | ||||
|---|---|---|---|---|---|
| Food Group (n) | Amsterdam 3 | Belfast 4 | Detroit 5 | FAO 6 | |
| 1 | Vegetables | 1.9 (207) | n.d. (n.a.) | n.d. | 2.3 (36) |
| 2 | Fruits | 1.1 (111) | n.d. (n.a.) | n.d. | 1.0 (50) |
| 3 | Legumes & pulses | 11.9 (32) | 7.0 (4) | n.d. | 24.3 (11) |
| 4 | Grains & Cereals | 10.3 (223) | 9.9 (4) | n.d. | 9.7 (24) |
| 5 | Rice | 5.6 (9) | 2.6 (1) | n.d. | 6.7 (4) |
| 6 | Starchy roots | 2.6 (45) | n.d. (n.a.) | n.d. | 1.3 (11) |
| 7 | Beef (& veal) | 28.5 (44) | 31.0 (1) | 24.5 (26) | 20.9 (7) |
| 8 | Pork | 26.6 (30) | 31.6 (1) | 23.1 (31) | 13.9 (6) |
| 9 | Sheep & Goat (+lamb) | 26.2 (6) | 29.2 (1) | 22.5 (38) | 14.2 (4) |
| 10 | Poultry & Turkey | 25.1 (6) | 32.0 (1) | 25.3 (21) | 15.7 (11) |
| 11 | Fish & Seafood | 22.8 (73) | 19.8 (7) | 21.2 (26) | 20.9 (37) |
| 12 | Cheese | 21.8 (77) | 23.6 (3) | n.d. | 24.5 (5) |
| 13 | Dairy (Milk & Yoghurt) | 4.2 (138) | 4.1 (5) | n.d. | 4.3 (21) |
| 14 | Eggs | 13.1 (12) | 12.5 (1) | n.d. | 11.1 (4) |
| 15 | Pasta (durum wheat) | 6.9 (17) | 6.6 (1) | n.d. | 11.8 (3) |
| 16 | Nuts & Seeds | 18.5 (36) | 16.6 (3) | n.d. | 12.4 (39) |
| 17 | Meat replacements 1 | 11.1 (33) | 8.1 (1) | n.d. | 13.0 (n.a.) 1 |
| 18 | Dairy replacements 2 | 2.5 (10) | n.d. (n.a.) | n.d. | 3.0 (n.a.) 2 |
1 Retail product assumed: Tofu, uncooked (33% water), 13 g protein/100 g product. 2 Retail product assumed: Soy Drink, natural. 3.0 g/100 mL of product. 3 Data source:[54], 4 Data source: [55], 5 Data source: [56], 6 Data source: [45].
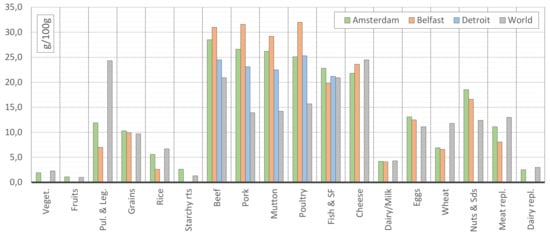
Figure A4.
Visualisation of protein content [gramprot/100 gramfood—4 data sources.
Figure A4.
Visualisation of protein content [gramprot/100 gramfood—4 data sources.
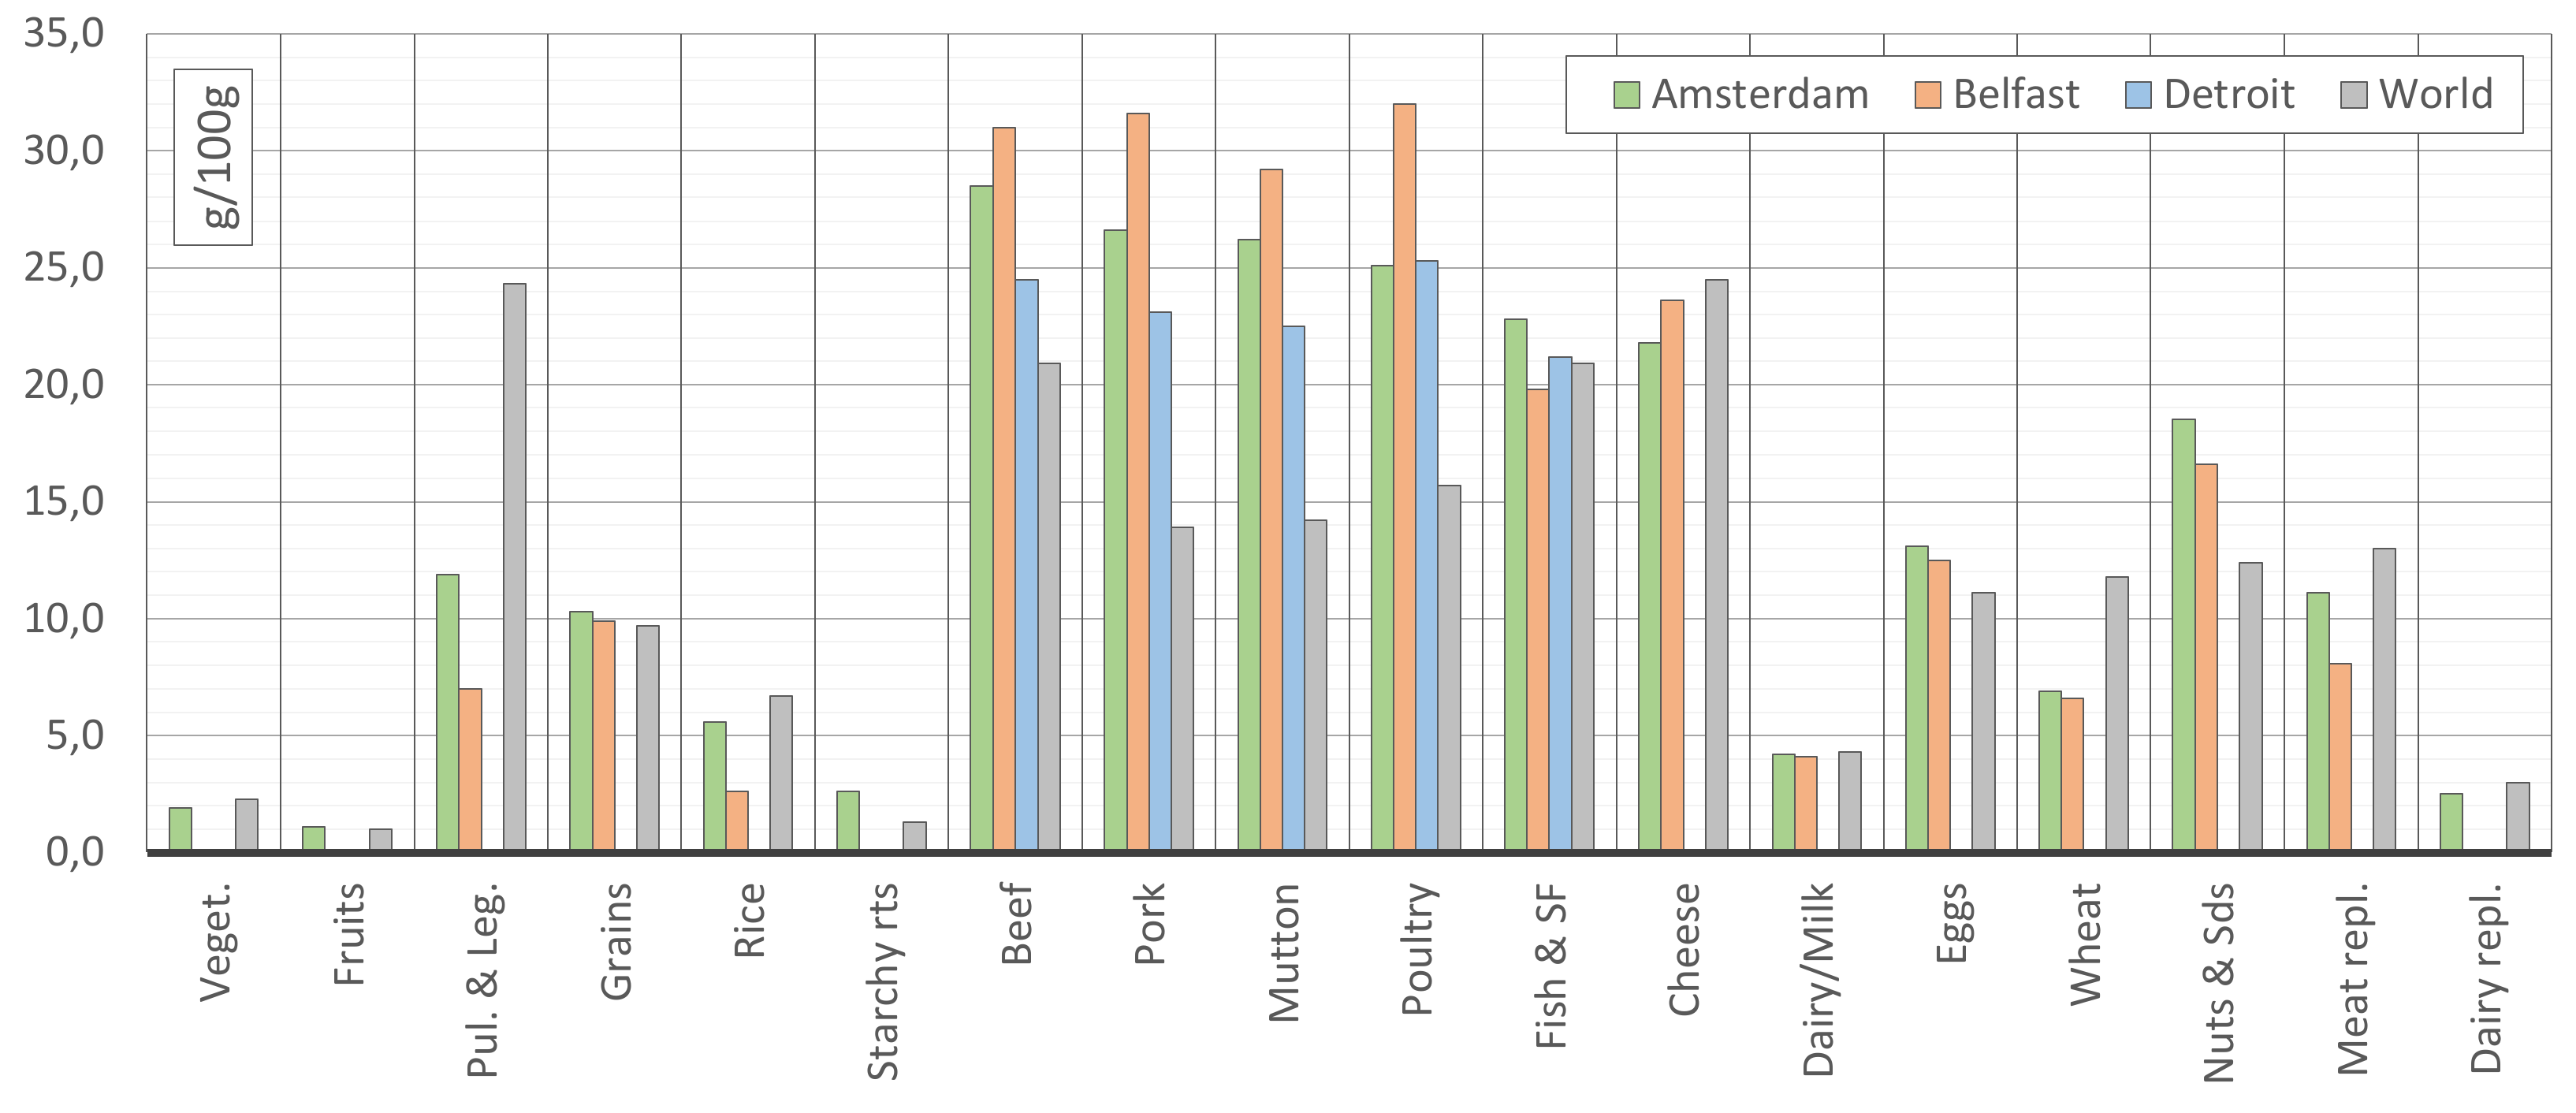
Table A3.
Processing of FAO dataset.
Table A3.
Processing of FAO dataset.
| Cereal and Products | g/100 g | Wheat (Pasta) | g/100 g |
|---|---|---|---|
| Wheat | 12.2 | Macaroni | 11.0 |
| Flour of wheat | Rem. | Quinoa | 12.0 |
| Bran of wheat | Rem. | Bulgur whole meal | 12.3 |
| Germ of wheat | Rem. | Average: | 11.8 |
| Bread | 8.2 | Rice | |
| Pastry | 7.4 | Rice paddy | 6 |
| Wheat starch | Rem. | Rice husked | 7.5 |
| Wheat gluten | Rem. | Rice milled | 6.7 |
| Barley | 11.0 | Rice broken | 6.7 |
| Pot barley | 9.6 | Rice flour | Rem. |
| Barley pearled | 9.0 | Rice gluten | Rem. |
| Barley flour and grits | Rem. | Rice starch | Rem. |
| Malt of barley | Rem. | Bran of rice | Rem. |
| Malt extracts | Rem. | Average: | 6.7 |
| Maize | 9.5 | Roots, tubers and products | |
| Germ of maize | Rem. | Potatoes | 1.6 |
| Flour of maize | Rem. | Flour of potatoes | Rem. |
| Maize gluten | Rem. | Potatoes frozen | 1.2 |
| Starch of maize | Rem. | Potato starch | Rem. |
| Pop corn | 9.5 | Potato tapioca | 0.5 |
| Rye | 11.0 | Sweet potatoes | 0.7 |
| Flour of rye | Rem. | Cassava | 0.9 |
| Oats | 13.0 | Flour of cassava | Rem. |
| Oats rolled | 16.0 | Cassava tapioca | 0.5 |
| Millet | 9.7 | Cassava dried | 2.8 |
| Flour of millet | Rem. | Cassava starch | Rem. |
| Sorghum | 10.1 | Yautia (cocoyam) | 1.7 |
| Flour of sorghm | Rem. | Taro (cocoyam) | 1.5 |
| Buckwheat | 11.0 | Yams | 1.3 |
| Flour of buckwheat | Rem. | Roots, tubers nes | 1.6 |
| Fonio | 8.0 | Flour of roots and tubers | Rem. |
| Flour of fonio | Rem. | Roots, tubers dried | Rem. |
| Triticale | 11.6 | Average: | 1.3 |
| Flour of triticale | Rem. | Pulses | |
| Canary seed | Rem. | Beans, dry | 22 |
| Mixed grain | 8.0 | Broad beans dry | 23 |
| Flour of mixed grain | Rem. | Peas, dry | 23 |
| Cereals nes | 8.0 | Chick-peas | 20 |
| Wafers | 9.2 | Cow peas dry | 23 |
| Flour of cereals | 10.0 | Pigeon peas | 21 |
| Breakfast cereals | 7.4 | Lentils | 24 |
| Cereals prepared nes | 10.0 | Bambara beans | 18 |
| Mixes and doughs | 6.2 | Vetches | 32 |
| Food preparations flour | 7.5 | Lupins | 40 |
| Treenuts | Pulses nes | 22 | |
| Brazil nuts | 6.9 | Flour of pulses | Rem. |
| Cashew nuts | 7.7 | Average: | 24 |
| Chestnuts | 1.8 | Meat replacers > custom product assumed | |
| Almonds | 8.0 | Soybeans | n.a. |
| Walnuts | 6.4 | Cake of soya beans | n.a. |
| Pistachios | 10.3 | Soya sauce | n.a. |
| Kolanuts | 9.0 | Soya paste | n.a. |
| Hazelnuts | 6.0 | Soya curd | n.a. |
| Arecanuts | 4.9 | Average: | n.a. |
| Brazilnut shelled | 14.3 | Vegetables and products | |
| Cashew nuts shelled | 15.3 | Cabbages | 1.0 |
| Almonds shelled | 20.0 | Artichokes | 1.1 |
| Walnuts shelled | 14.3 | Asparagus | 1.6 |
| Hazelnuts shelled | 13.0 | Lettuce | 1.1 |
| Nuts nes | 7.0 | Spinach | 2.1 |
| Prepared nuts | 15.5 | Cassava leaves | 5.8 |
| Groundnuts in shell | 18.7 | Tomatoes | 0.8 |
| Groundnuts shelled | 25.7 | Tomato juice | Rem. |
| Cake of groundnuts | Rem. | Tomato juice concentrated | Rem. |
| Groundnuts prepared | 26.8 | Tomato paste | 3.8 |
| Peanut butter | 24.3 | Tomatoes peeled | 0.9 |
| Coconuts | 1.7 | Cauliflower | 0.8 |
| Coconuts desiccated | 6.9 | Pumpkins, squash, gourds | 0.9 |
| Copra | 6.0 | Cucumbers, gherinks | 0.5 |
| Oil palm fruit | 0.3 | Eggplants | 0.9 |
| Palm kernels | 7.3 | Chillies, peppers, green | 1.1 |
| Olives | 1.3 | Onions, shallots, green | 1.7 |
| Olives, preserved | 1.1 | Onions, dry | 1.1 |
| Karite nuts | 6.8 | Garlic | 5.5 |
| Sunflower seed | 12.3 | Leeks | 0.7 |
| Rapeseed | 19.6 | Beans, green | 3.0 |
| Safflower | 9.7 | Peas, green | 2.1 |
| Sesame seed | 17.7 | Broad beans, green | 2.3 |
| Cake of sesame seed | Rem. | String beans | 1.6 |
| Mustard seed | 24.9 | Carrots | 0.9 |
| Flour of mustard seed | 26.4 | Okra | 1.6 |
| Poppy seed | 18.0 | Green corn | 2.1 |
| Melonseed | 18.2 | Sweet corn frozen | 1.8 |
| Cottonseed | 17.3 | Sweet corn prepared | 2.3 |
| Linseed | 18.0 | Mushrooms | 2.0 |
| Oilseeds nes | 14.7 | Mushrooms canned | 1.9 |
| Flour/meal of oilseeds | Rem. | Mushrooms dried | 9.6 |
| Average: | 12.4 | Vegetables nes fresh | 1.4 |
| Fruits and products | Vegetables nes dried | 11.2 | |
| Bananas | 0.7 | Vegetables nes canned | 1.4 |
| Plantains | 0.8 | Vegetables nes juice | 0.6 |
| Oranges | 0.7 | Vegetables dehydrated | Rem. |
| Orange juice | Rem. | Vegetables prepared by vinegar | Rem. |
| Orange juice concentrated | Rem. | Vegetables prepared nes | Rem. |
| Tangerines, mandarines, clementines | 0.5 | Vegetables frozen | 3.3 |
| Tangerines juice | 0.5 | Vegetables provisionally preserved | Rem. |
| Lemons and limes | 0.6 | Vegetables prepared or pres, frozen | Rem. |
| Lemon juice | Rem. | Homogenized vegetables prepared | 1.2 |
| Lemon juice concentrated | Rem. | Average: | 2.3 |
| Grapefruit and pomelo | 0.3 | Beef | |
| Grapefruit juice | Rem. | Beef boneless | 18.5 |
| Grapefruit juice concentrated | Rem. | Beef dried salted smoked | 34.3 |
| Citrus fruit nes | 0.5 | Meat extracts | Rem. |
| Citrus fruit nes juice | Rem. | Beef sausages | 11.7 |
| Citrus fruit nes juice concentrated | Rem. | Beef preparations | 25.0 |
| Apples | 0.1 | Beef canned | 25.0 |
| Apples juice | Rem. | Homogenized meat prepared | Rem. |
| Apples juice concentrated | Rem. | Liver preparations | 13.6 |
| Pears | 0.4 | Offals of cattle | 18.4 |
| Quinces | 0.2 | Buffalo meat | Rem. |
| Apricots | 1.3 | Offals of buffalo | Rem. |
| Sour cherry | 0.9 | Average: | 20.9 |
| Cherries | 1.1 | Mutton | |
| Peaches and nectarines | 0.5 | Mutton and lamb | 13.5 |
| Plums | 0.7 | Offals of sheep | 14.6 |
| Plum juice | Rem. | Goat meat | 14.0 |
| Plum juice concentrated | Rem. | Offals of goats | 14.6 |
| Stone fruit nes | 0.9 | Average: | 14.2 |
| Pome fruit nes | 0.4 | Pork | |
| Carobs | 1.6 | Pigmeat | 11.0 |
| Strawberries | 0.6 | Pork | 13.4 |
| Raspberries | 0.9 | Bacon—ham of pigs | 13.1 |
| Gooseberries | 0.9 | Pig meat sausages | 11.7 |
| Currants | 1.4 | Pig meat preparations | 16.1 |
| Blueberries | 0.7 | Offals of pigs | 18.3 |
| Cranberries | 0.4 | Average: | 13.9 |
| Berries nes | 1.00 | Poultry | |
| Grapes | 0.5 | Chicken meat | 12.3 |
| Grape juice | 0.6 | Chicken meat canned | 21.8 |
| Watermelons | 0.3 | Offal of chickens | 18.0 |
| Melons | 0.4 | Fat liver preparations | 11.4 |
| Figs | 0.8 | Duck meat | 8.3 |
| Mangoes | 0.4 | Offals liver ducks | 18.7 |
| Mango juice | Rem. | Goose meat | 12.9 |
| Mango pulp | 0.5 | Offals liver geese | 16.4 |
| Avocados | 1.5 | Turkey meat | 16.1 |
| Pineapples | 0.2 | Offals liver turkeys | 20.0 |
| Pineapples canned | 0.4 | Poultry meat | 17.1 |
| Pineapples juice | Rem. | Average: | 16 |
| Pineapples juice concentrated | Rem. | Other meat products > not used | |
| Persimmons | 0.6 | Pigeons other birds | n.a. |
| Cashewapple | 0.8 | Horsemeat | n.a. |
| Kiwi | 0.9 | Offals of horses | n.a. |
| Papayas | 0.4 | Meat of asses | n.a. |
| Fruit tropical nes | 0.5 | Meat of mules | n.a. |
| Fruit nes fresh | 0.5 | Meat of camels | n.a. |
| Fruit nes juice | Rem. | Offals of camels | n.a. |
| Fruit nes prepared | Rem. | Rabbit meat | n.a. |
| Flour of fruit | 3.9 | Meat of other rodents | n.a. |
| Fruit, nuts, fruit peel preserved by sugar | Rem. | Meat of other camelids | n.a. |
| Ruit cooked homogenized | Rem. | Offals of other camelids | n.a. |
| Dried fruits | Game meat | n.a. | |
| Apricots dried | 3.7 | Meat nes | n.a. |
| Plums dried | 2.3 | Meat nes dried | n.a. |
| Raisins | 3.2 | Meat prepared nes | n.a. |
| Figs dried | 3.0 | Offals nes | n.a. |
| Dates | 1.5 | Snails not sea | n.a. |
| Fruit tropical nes dried | 2.8 | Eggs | |
| Fruit nes dried | 2.8 | Hen eggs | 10.7 |
| Average: | 1.0 | Eggs liquid hen | 12.1 |
| Fish and fisheries products | Eggs dry hen | Rem. | |
| Freshwater diadromous fish fresh | 10.9 | Egg albumine | 10.1 |
| Freshwater diadromous fish fillet | 20.3 | Eggs excluding hen eggs | 11.3 |
| Freshwater diadromous fish cured | 31.3 | Average: | 11.1 |
| Freshwater diadromous fish canned | 19.8 | Milk and cheese dairy/milk | |
| Freshwater diadrom, fish prepared nes | 26.9 | Cow milk, whole fresh | 3.3 |
| Demersal fish fresh | 8.3 | Standardized milk | 3.3 |
| Demersal fish fillet | 17.9 | Cream, fresh | 2.7 |
| Demersal fish cured | 37.9 | Whole cow milk evaporated | 6.8 |
| Demersal fish canned | 25.0 | Whole cow milk condensed | 7.9 |
| Demersal fish prepared nes | 25.0 | Whole cow milk dry | Rem. |
| Pelagic fish fresh | 12.6 | Skim milk of cows | 3.4 |
| Pelagic fish fillet | 20.2 | Skim milk evaporated | 7.6 |
| Pelagic fish cured | 26.4 | Skim milk condensed | 10 |
| Pelagic fish canned | 20.8 | Skim milk dry | Rem. |
| Pelagic fish prepared nes | 44.2 | Buttermilk curdled | 3 |
| Marine fish nes fresh | 10.3 | Buttermilk dry | Rem. |
| Marine fish nes fillet | 19.0 | Yoghurt | 3.5 |
| Marine fish nes cured | 32.1 | Yoghurt concentrated | 4.7 |
| Marine fish nes canned | 22.9 | Reconstituted milk | 1.8 |
| Marine fish prepared nes | 17.5 | Whey fresh | 0.8 |
| Crustaceans fresh | 9.3 | Whey condensed | 0.9 |
| Crustaceans frozen | 18.4 | Whey dry | Rem. |
| Crustaceans cured | 25.4 | Casein | Rem. |
| Crustaceans canned | 19.8 | Buffalo milk | 3.8 |
| Crustaceans prepared nes | 19.5 | Skim milk of buffalo | 4.3 |
| Molluscs fresh | 2.3 | Sheep milk | 5.9 |
| Molluscs frozen | 10.5 | Skim milk of sheep | 6.1 |
| Molluscs cured | 49.4 | Goat milk | 3.6 |
| Molluscs canned | 14.9 | Skim milk of goat | 3.4 |
| Cephalopods fresh | 13.5 | Camel milk | 3.8 |
| Cephalopods frozen | 15.1 | Average: | 4.3 |
| Cephalopods cured | 61.6 | Cheese | |
| Cephalopods canned | 20.8 | Cheese goat milk | 16 |
| Cephalopods prepared nes | 20.8 | Cheese whole cow milk | 25 |
| Aquatic mammals meat | Rem. | Cheese skim cow milk | 46 |
| Aquatic mammals prepared nes | Rem. | Whey cheese | 12.4 |
| Aquatic animals nes fresh | 4.0 | Processed cheese | Rem. |
| Aquatic animals nes cured | 5.5 | Cheese buffalo milk | Rem. |
| Aquatic animals prepared nes | 11.5 | Cheese sheep milk | 23.2 |
| Aquatic plants | Rem. | Average: | 25 |
| Aquatic plants dried | Rem. | ||
| Aquatic plants prepared nes | Rem. | ||
| Average: | 20.9 |
This work uses the FAO protein content of food (groups) for diet shift assessment. Listed items are considered to be consumed on a regular basis in developed economies globally. The raw data had to be recomposed to align with the taxonomy of this study and a number of product are left out of the assessment. The breakdown below forms the basis of aggregated indicators listed in Table 2 and Table A3. Excluded items are noted by rem., i.e., removed. Excluded food items/products/groups are:
- Processed items (with exception of the cheese category)
- Concentrates
- Starches/Malts/Flour/Gluten/Germs/Brans/Cakes
- Fruit/vegetable juices (=processed & drink)
- Non-staple foods categories
NES = Not Elsewhere Specified. Note: Retail product assumed for meat replacer: Tofu, uncooked (33% of water), 13 g protein/100 g product. Note: Retail product assumed for dairy replacer: Soy Drink, natural, 3.0 g/100 mL of product.Original dataset is retrieved from [45].
Appendix C
Table A4.
Overview of data sources for Global Warming Potential (GWP) and protein content of food groups. Data sources addressed for this study are accessible to the general public. Please note: this study uses the protein content dataset by the FAO for further assessment. An extensive breakdown and references of case study food consumption can be found in [12].
| GWP | Protein Content | |
|---|---|---|
| unit | kg CO2eq/kgfood | g/100 gfood |
| AMS | [49] | [54] |
| Published by the National Institute for Public Health and the Environment. GWP based on LCI studies, conducted by Blonk Consultants. Full dataset can be downloaded from website. | Online interactive platform called NEVO. Developed by theRIVM, a service department from the Ministry of Health, Welfare and Sports | |
| BEL | [19] | [55] |
| Open-access article published by Springer(Appendix, Table A4 in source article) | Aggregated dataset. Overview can be downloaded from website. Data is based on the work McCance and Widdowson’s—TheComposition of Foods (2015) [this work is not freely accessible] | |
| DET | [51] | [56] |
| Open-access article Published by IOP Publishing Ltd. Data is integrated to ‘ dataFIELD’ (database of Food Impacts on the Environment for Linking to Diets). Download and more information can be found here [62]. | Data provided by the US Department of Agriculture—National Agricultural Library. Dataset can be downloaded online. | |
| World | [10] | [45] |
| Open-access research article published in Science. LCA-based GWP data based on a worldwide study. | Extensive list of food items + nutritional content (protein, calories & fat), provided by the UN Food & Agriculture Organisation. Dataset can be retrieved online. |
References
- Khush, G.S. Green revolution: The way forward. Nat. Rev. Genet. 2001, 2, 815–822. [Google Scholar] [CrossRef] [PubMed]
- de Schutter, O. The political economy of food systems reform. Eur. Rev. Agric. Econ. 2017, 44, 705–731. [Google Scholar] [CrossRef]
- Crippa, M.; Solazzo, E.; Guizzardi, D.; Monforti, F.; Tubiello, F.; Leip, A. Food systems are responsible for a third of global anthropogenic GHG emissions. Nat. Food 2021, 2, 198–209. [Google Scholar] [CrossRef]
- Pimentel, D. Green revolution agriculture and chemical hazards. Sci. Total Environ. 1996, 188, S86–S98. [Google Scholar] [CrossRef]
- Geyik, O.; Hadjikakou, M.; Karapinar, B.; Bryan, B.A. Does global food trade close the dietary nutrient gap for the world’s poorest nations? Glob. Food Secur. 2021, 28, 100490. [Google Scholar] [CrossRef]
- AEA Technology Environment. The Validity of Food Miles as an Indicator of Sustainable Development-Report to DEFRA; AEA Technology Environment: London, UK, 2005. [Google Scholar]
- Gibbs, H.K.; Ruesch, A.S.; Achard, F.; Clayton, M.K.; Holmgren, P.; Ramankutty, N.; Foley, J.A. Tropical forests were the primary sources of new agricultural land in the 1980s and 1990s. Proc. Natl. Acad. Sci. USA 2010, 107, 16732–16737. [Google Scholar] [CrossRef] [PubMed] [Green Version]
- Winkler, K.; Fuchs, R.; Rounsevell, M.; Herold, M. Global land use changes are four times greater than previously estimated. Nat. Commun. 2021, 12, 2501. [Google Scholar] [CrossRef]
- FAO. Livestock’s Long Shadow-Environmental Issues and Options; FAO: Rome, Italy, 2006. [Google Scholar]
- Poore, J.; Nemecek, T. Reducing food’s environmental impacts through producers and consumers. Science 2018, 360, 987–992. [Google Scholar] [CrossRef] [Green Version]
- Crutzen, P.J.; Aselmann, I.; Seiler, W. Methane production by domestic animals, wild ruminants, other herbivorous fauna and humans. Tellus 1986, 38, 271–284. [Google Scholar] [CrossRef]
- ten Caat, N.; Tenpierik, M.J.; Tillie, N.; van de Dobbelsteen, A. Towards fossil free cities-Carbon footprint assessment of urban communities by using the FEWprint platform. Clean. Environ. Syst. 2022. (under review). [Google Scholar]
- Lin, B.B.; Philpott, S.M.; Jha, S. The future of urban agriculture and biodiversity-ecosystem services: Challenges and next steps. Basic Appl. Ecol. 2015, 16, 189–201. [Google Scholar] [CrossRef]
- Goldstein, B.; Hauschild, M.; Fernández, J.; Birkved, M. Testing the environmental performance of urban agriculture as a food supply in northern climates. J. Clean. Prod. J. 2016, 135, 984–994. [Google Scholar] [CrossRef] [Green Version]
- Rothwell, A.; Ridoutt, B.; Page, G.; Bellotti, W. Environmental performance of local food: Trade-offs and implications for climate resilience in a developed city. J. Clean. Prod. 2016, 114, 420–430. [Google Scholar] [CrossRef]
- Goldstein, B.; Hauschild, M.; Fernández, J.; Birkved, M. Urban versus conventional agriculture, taxonomy of resource profiles: A review. Agron. Sustain. Dev. 2016, 31, 9. [Google Scholar] [CrossRef]
- Aleksandrowicz, L.; Green, R.; Joy, E.J.M.; Smith, P.; Haines, A. The Impacts of Dietary Change on Greenhouse Gas Emissions, Land Use, Water Use, and Health: A Systematic Review. PLoS ONE 2016, 11, e0165797. [Google Scholar] [CrossRef] [Green Version]
- Foley, J.A.; Ramankutty, N.; Brauman, K.A.; Cassidy, E.S.; Gerber, J.S.; Johnston, M.; Mueller, N.D.; O’Connell, C.; Ray, D.K.; West, P.C.; et al. Solutions for a cultivated planet. Nature 2011, 478, 337–342. [Google Scholar] [CrossRef] [Green Version]
- Scarborough, P.; Appleby, P.N.; Mizdrak, A.; Briggs, A.D.; Travis, R.C.; Bradbury, K.E.; Key, T.J. Dietary greenhouse gas emissions of meat-eaters, fish-eaters, vegetarians and vegans in the UK. Clim. Chang. 2014, 125, 179–192. [Google Scholar] [CrossRef] [Green Version]
- Springmann, M.; Godfray, H.C.J.; Rayner, M.; Scarborough, P. Analysis and valuation of the health and climate change cobenefits of dietary change. Proc. Natl. Acad. Sci. USA 2016, 113, 4146–4151. [Google Scholar] [CrossRef] [Green Version]
- Mbow, C. Food Security. In Climate Change and Land: An. IPCC Special Report on Climate Change, Desertification, Land Degradation, Sustainable Land Management, Food Security, and Greenhouse Gas Fluxes in Terrestrial Ecosystems; Shukla, J.M.P.R., Skea, J., Buendia, E.C., Masson-Delmotte, V., Pörtner, H.-O., Roberts, D.C., Zhai, P., Slade, R., Connors, S., van Diemen, R., et al., Eds.; IPCC: Geneva, Switzerland, 2019; pp. 437–550. [Google Scholar]
- WRI. Creating a Sustainable Food Future: A Menu of Solutions to Feed Nearly 10 Billion People by 2050-Synthesis Report; WRI: Washington, DC, USA, 2018. [Google Scholar]
- Enthoven, L.; van den Broeck, G. Local food systems: Reviewing two decades of research. Agric. Syst. 2021, 193, 103226. [Google Scholar] [CrossRef]
- Schlich, E.H.; Fleissner, U. The ecology of scale: Assessment of regional energy turnover and comparison with global food. Int. J. Life Cycle Assess. 2005, 10, 219–223. [Google Scholar] [CrossRef]
- ten Caat, N.; Graamans, L.; Tenpierik, M.; van den Dobbelsteen, A. Towards fossil free cities-A supermarket, greenhouse & dwelling integrated energy system as an alternative to district heating: Amsterdam case study. Energies 2021, 14, 347. [Google Scholar]
- McDougall, R.; Kristiansen, P.; Rader, R. Small-scale urban agriculture results in high yields but requires judicious management of inputs to achieve sustainability. Proc. Natl. Acad. Sci. USA 2019, 116, 129–134. [Google Scholar] [CrossRef] [PubMed] [Green Version]
- Shah, A.; Liu, G.; Meng, F.; Yang, Q.; Xue, J.; Dumontet, S.; Passaro, R.; Casazza, M. A Review of Urban Green and Blue Infrastructure from the Perspective of Food-Energy-Water Nexus. Energies 2021, 14, 4583. [Google Scholar] [CrossRef]
- Nijdam, D.; Rood, T.; Westhoek, H. The price of protein: Review of land use and carbon footprints from life cycle assessments of animal food products and their substitutes. Food Policy 2012, 37, 760–770. [Google Scholar] [CrossRef]
- Boye, J.; Wijesinha-Bettoni, R.; Burlingame, B. Protein quality evaluation twenty years after the introduction of the protein digestibility corrected amino acid score method. Br. J. Nutr. 2012, 108, 2. [Google Scholar] [CrossRef] [PubMed] [Green Version]
- WHO. Protein and Amino Acid Requirements in Human Nutrition; WHO: Geneva, Switzerland, 2007. [Google Scholar]
- Berners-lee, M.; Hoolohan, C.; Cammack, H.; Hewitt, C.N. The relative greenhouse gas impacts of realistic dietary choices. Energy Policy 2012, 43, 184–190. [Google Scholar] [CrossRef]
- Saxe, H.; Larsen, T.M.; Mogensen, L. The global warming potential of two healthy Nordic diets compared with the average Danish diet. Clim. Chang. 2013, 116, 249–262. [Google Scholar] [CrossRef]
- Milton, K. A hypothesis to explain the role of meat-eating in human evolution. Evol. Anthropol. Issues News Rev. 1999, 8, 11–21. [Google Scholar] [CrossRef]
- Neumann, C.; Harris, D.M.; Rogers, L.M. Contribution of animal source foods in improving diet quality and function in children in the developing world. Nutr. Res. 2002, 22, 193–220. [Google Scholar] [CrossRef]
- Day, L. Proteins from land plants-Potential resources for human nutrition and food security. Trends Food Sci. Technol. 2013, 32, 25–42. [Google Scholar] [CrossRef]
- Bohrer, B.M. Trends in Food Science & Technology Review: Nutrient density and nutritional value of meat products and non-meat foods high in protein. Trends Food Sci. Technol. 2017, 65, 103–112. [Google Scholar]
- FAO. Dietary Protein Quality Evaluation in Human Nutrition; FAO: Rome, Italy, 2013. [Google Scholar]
- Phillips, S.M. Current Concepts and Unresolved Questions in Dietary Protein Requirements and Supplements in Adults. Front. Nutr. 2017, 4, 13. [Google Scholar] [CrossRef] [Green Version]
- Young, V.R.; Pellett, P.L. Plant proteins in relation to human protein and amino acid nutrition. Am. J. Clin. Nutr. 1994, 59, 1203S–1212S. [Google Scholar] [CrossRef]
- American Dietetic Association. Position of the American Dietetic Association: Vegetarian Diets. J. Am. Diet. Assoc. 2009, 109, 1266–1282. [Google Scholar] [CrossRef]
- Willett, W.; Rockström, J.; Loken, B.; Springmann, M.; Lang, T.; Vermeulen, S.; Garnett, T.; Tilman, D.; DeClerck, F.; Wood, A.; et al. Food in the Anthropocene: The EAT–Lancet Commission on healthy diets from sustainable food systems. Lancet 2019, 393, 447–492. [Google Scholar] [CrossRef]
- Gaillac, R.; Marbach, S. The carbon footprint of meat and dairy proteins: A practical perspective to guide low carbon footprint dietary choices. J. Clean. Prod. 2021, 321, 128766. [Google Scholar] [CrossRef]
- Melina, V.; Craig, W.; Levin, S. Position of the Academy of Nutrition and Dietetics: Vegetarian Diets. J. Acad. Nutr. Diet. 2016, 116, 1970–1980. [Google Scholar] [CrossRef]
- Perignon, M.; Vieux, F.; Soler, L.-G.; Masset, G.; Darmon, N. Improving diet sustainability through evolution of food choices: Review of epidemiological studies on the environmental impact of diets. Nutr. Rev. 2016, 75, 2–17. [Google Scholar] [CrossRef] [Green Version]
- FAO. Food Balance Sheets-A Handbook; FAO: Rome, Italy, 2001. [Google Scholar]
- RIVM. Food Consumption in the Netherlands and Its Determinants-Background Report; RIVM: Bilthoven, The Netherlands, 2017. [Google Scholar]
- DEFRA. Family Food Statistics-Detailed Annual Statistics on Family Food and Drink Purchases. Family Food Statistics. 2020. Available online: https://www.gov.uk/government/statistical-data-sets/family-food-datasets (accessed on 21 October 2020).
- USDA ERS. Food Availability (Per Capita) Data System. U.S. Department of Agriculture: Economic Research Service. 2017. Available online: https://www.ers.usda.gov/data-products/food-availability-per-capita-data-system/ (accessed on 12 November 2020).
- RIVM. Milieubelasting Voedingsmiddelen; Levenscyclus, Productgroep. Rijksinstituut Voor Volksgezondheid en Milieu. 2020. Available online: https://www.rivm.nl/voedsel-en-voeding/duurzaam-voedsel/database-milieubelasting-voedingsmiddelen (accessed on 23 October 2020).
- Audsley, E.; Brander, M.; Chatterton, J.; Murphy-bokern, D.; Webster, C.; Williams, A. How Low Can We Go? An Assessment of Greenhouse Gas Emissions from the UK Food System and the Scope to Reduce Them by 2050; WWF: Woking, UK, 2009; pp. 1–83. [Google Scholar]
- Heller, M.C.; Willits-Smith, A.; Meyer, R.; Keoleian, G.A.; Rose, D. Greenhouse gas emissions and energy use associated with production of individual self-selected US diets. Environ. Res. Lett. 2018, 13, 044004. [Google Scholar] [CrossRef]
- Burlingame, B.; Charrondiere, R.; Mouille, B. Food composition is fundamental to the cross-cutting initiative on biodiversity for food and nutrition. J. Food Compos. Anal. 2009, 22, 361–365. [Google Scholar] [CrossRef]
- INFOODS. International Network of Food Data Systems (INFOODS). 2021. Available online: http://www.fao.org/infoods/infoods/en/ (accessed on 28 September 2021).
- RIVM. NEVO Online Version-2019/6.0. Bilthoven. 2019. Available online: https://www.rivm.nl/en/dutch-food-composition-database/access-nevo-data/nevo-online/search-and-compare (accessed on 29 June 2021).
- British Nutrition Foundation. Protein Content of Some Common Foods Found in the Diet. Nutrients, Food and Ingredients-Protein. 2012. Available online: https://www.nutrition.org.uk/healthy-sustainable-diets/protein/?level=Consumer (accessed on 29 June 2021).
- USDA. National Agricultural Library-Nutrient Lists from Standard Reference Legacy. Food and Nutrition Information Center. 2018. Available online: https://www.nal.usda.gov/fnic/nutrient-lists-standard-reference-legacy-2018 (accessed on 29 June 2021).
- Ertl, P.; Knaus, W.; Zollitsch, W. An approach to including protein quality when assessing the net contribution of livestock to human food supply. Animal 2016, 10, 1883–1889. [Google Scholar] [CrossRef] [Green Version]
- Herreman, L.; Nommensen, P.; Pennings, B.; Laus, M.C. Comprehensive overview of the quality of plant- And animal-sourced proteins based on the digestible indispensable amino acid score. Food Sci. Nutr. 2020, 8, 5379–5391. [Google Scholar] [CrossRef]
- CBS. Klimaatverandering en Energietransitie: Opvattingen en Gedrag van Nederlanders in 2020. 2021. Available online: https://www.cbs.nl/nl-nl/longread/rapportages/2021/klimaatverandering-en-energietransitie-opvattingen-en-gedrag-van-nederlanders-in-2020/6-vleesconsumptie (accessed on 24 September 2021).
- Reinhart, R.J. Snapshot: Few Americans Vegetarian or Vegan. Gallup Poll Social Series. 2018. Available online: https://news.gallup.com/poll/238328/snapshot-few-americans-vegetarian-vegan.aspx?g_source=link_NEWSV9&g_medium=NEWSFEED&g_campaign=item_&g_content=Snapshot%3A%2520Few%2520Americans%2520Vegetarian%2520or%2520Vegan (accessed on 24 September 2021).
- de Boer, J.; Aiking, H. Favoring plant instead of animal protein sources: Legitimation by authority, morality, rationality and story logic. Food Qual. Prefer. 2021, 88, 104098. [Google Scholar] [CrossRef]
- Heller, M.C. dataFIELD 1.0. Linking Health and Environmental Outcomes to Dietary Behaviors in the United States. 2017. Available online: https://css.umich.edu/page/datafield (accessed on 17 November 2021).
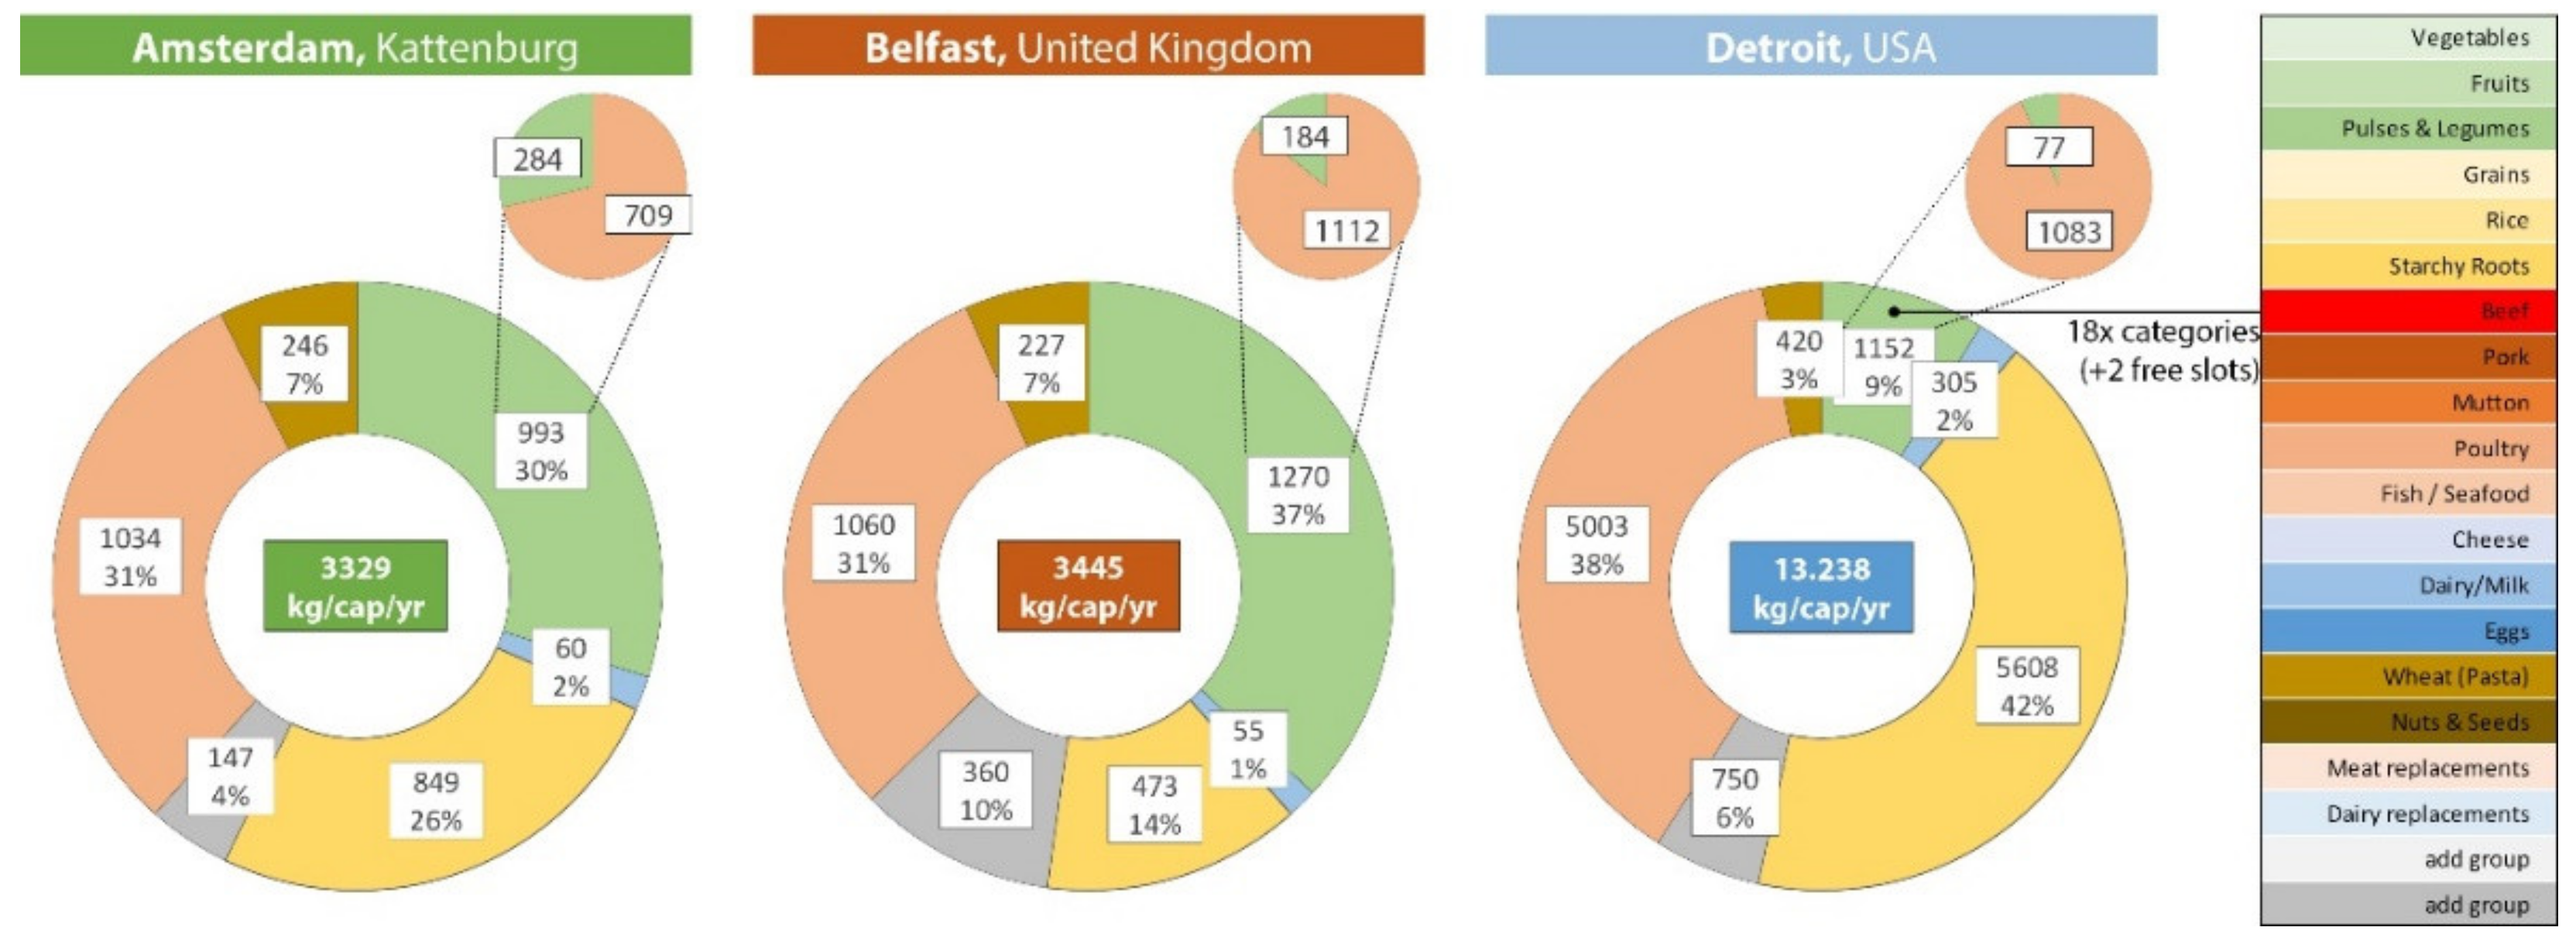
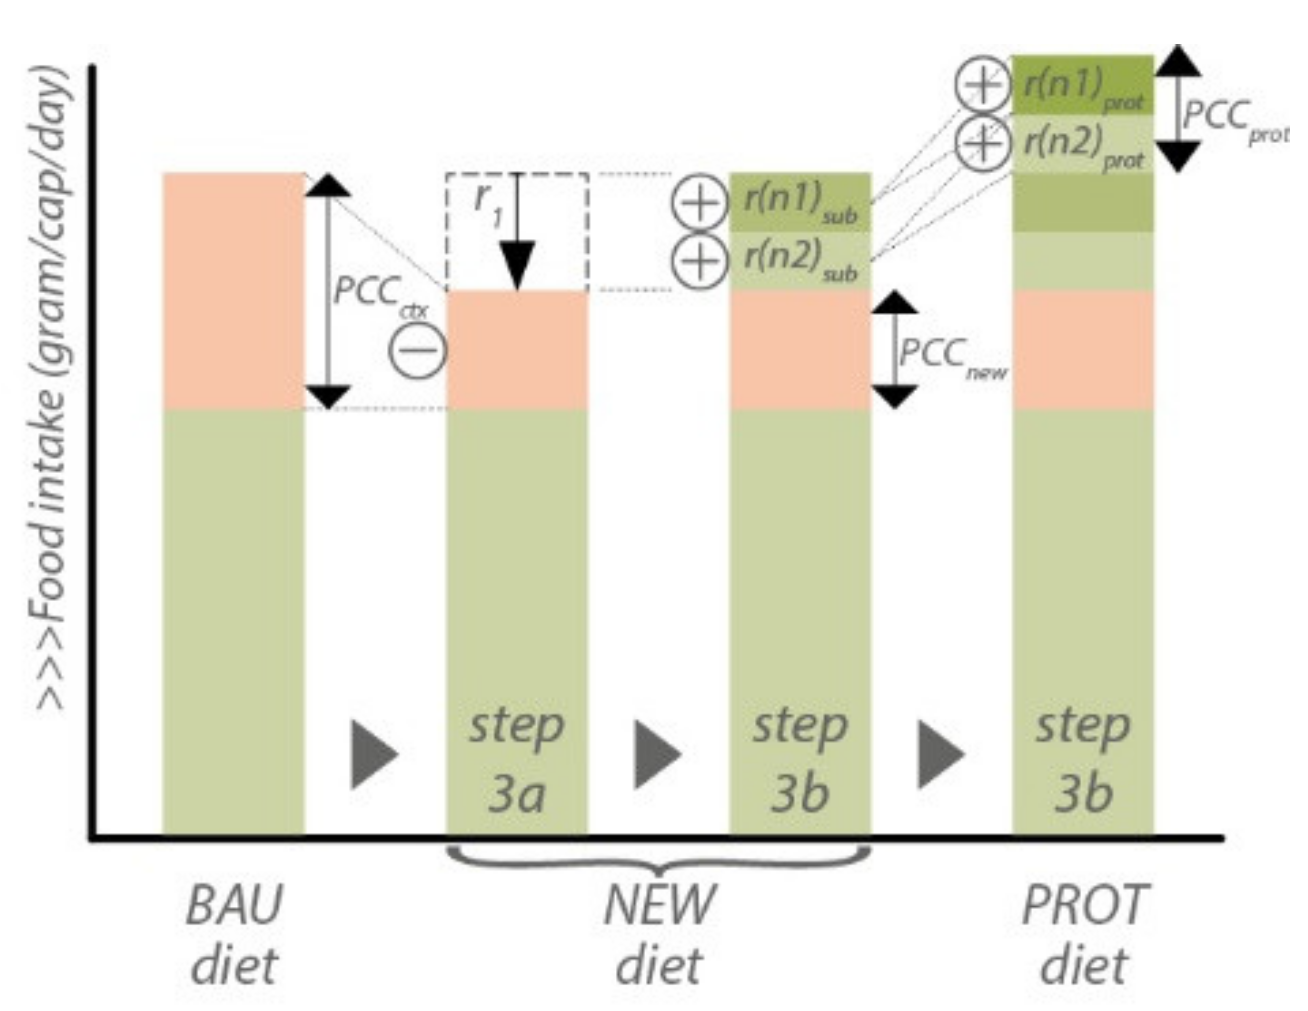
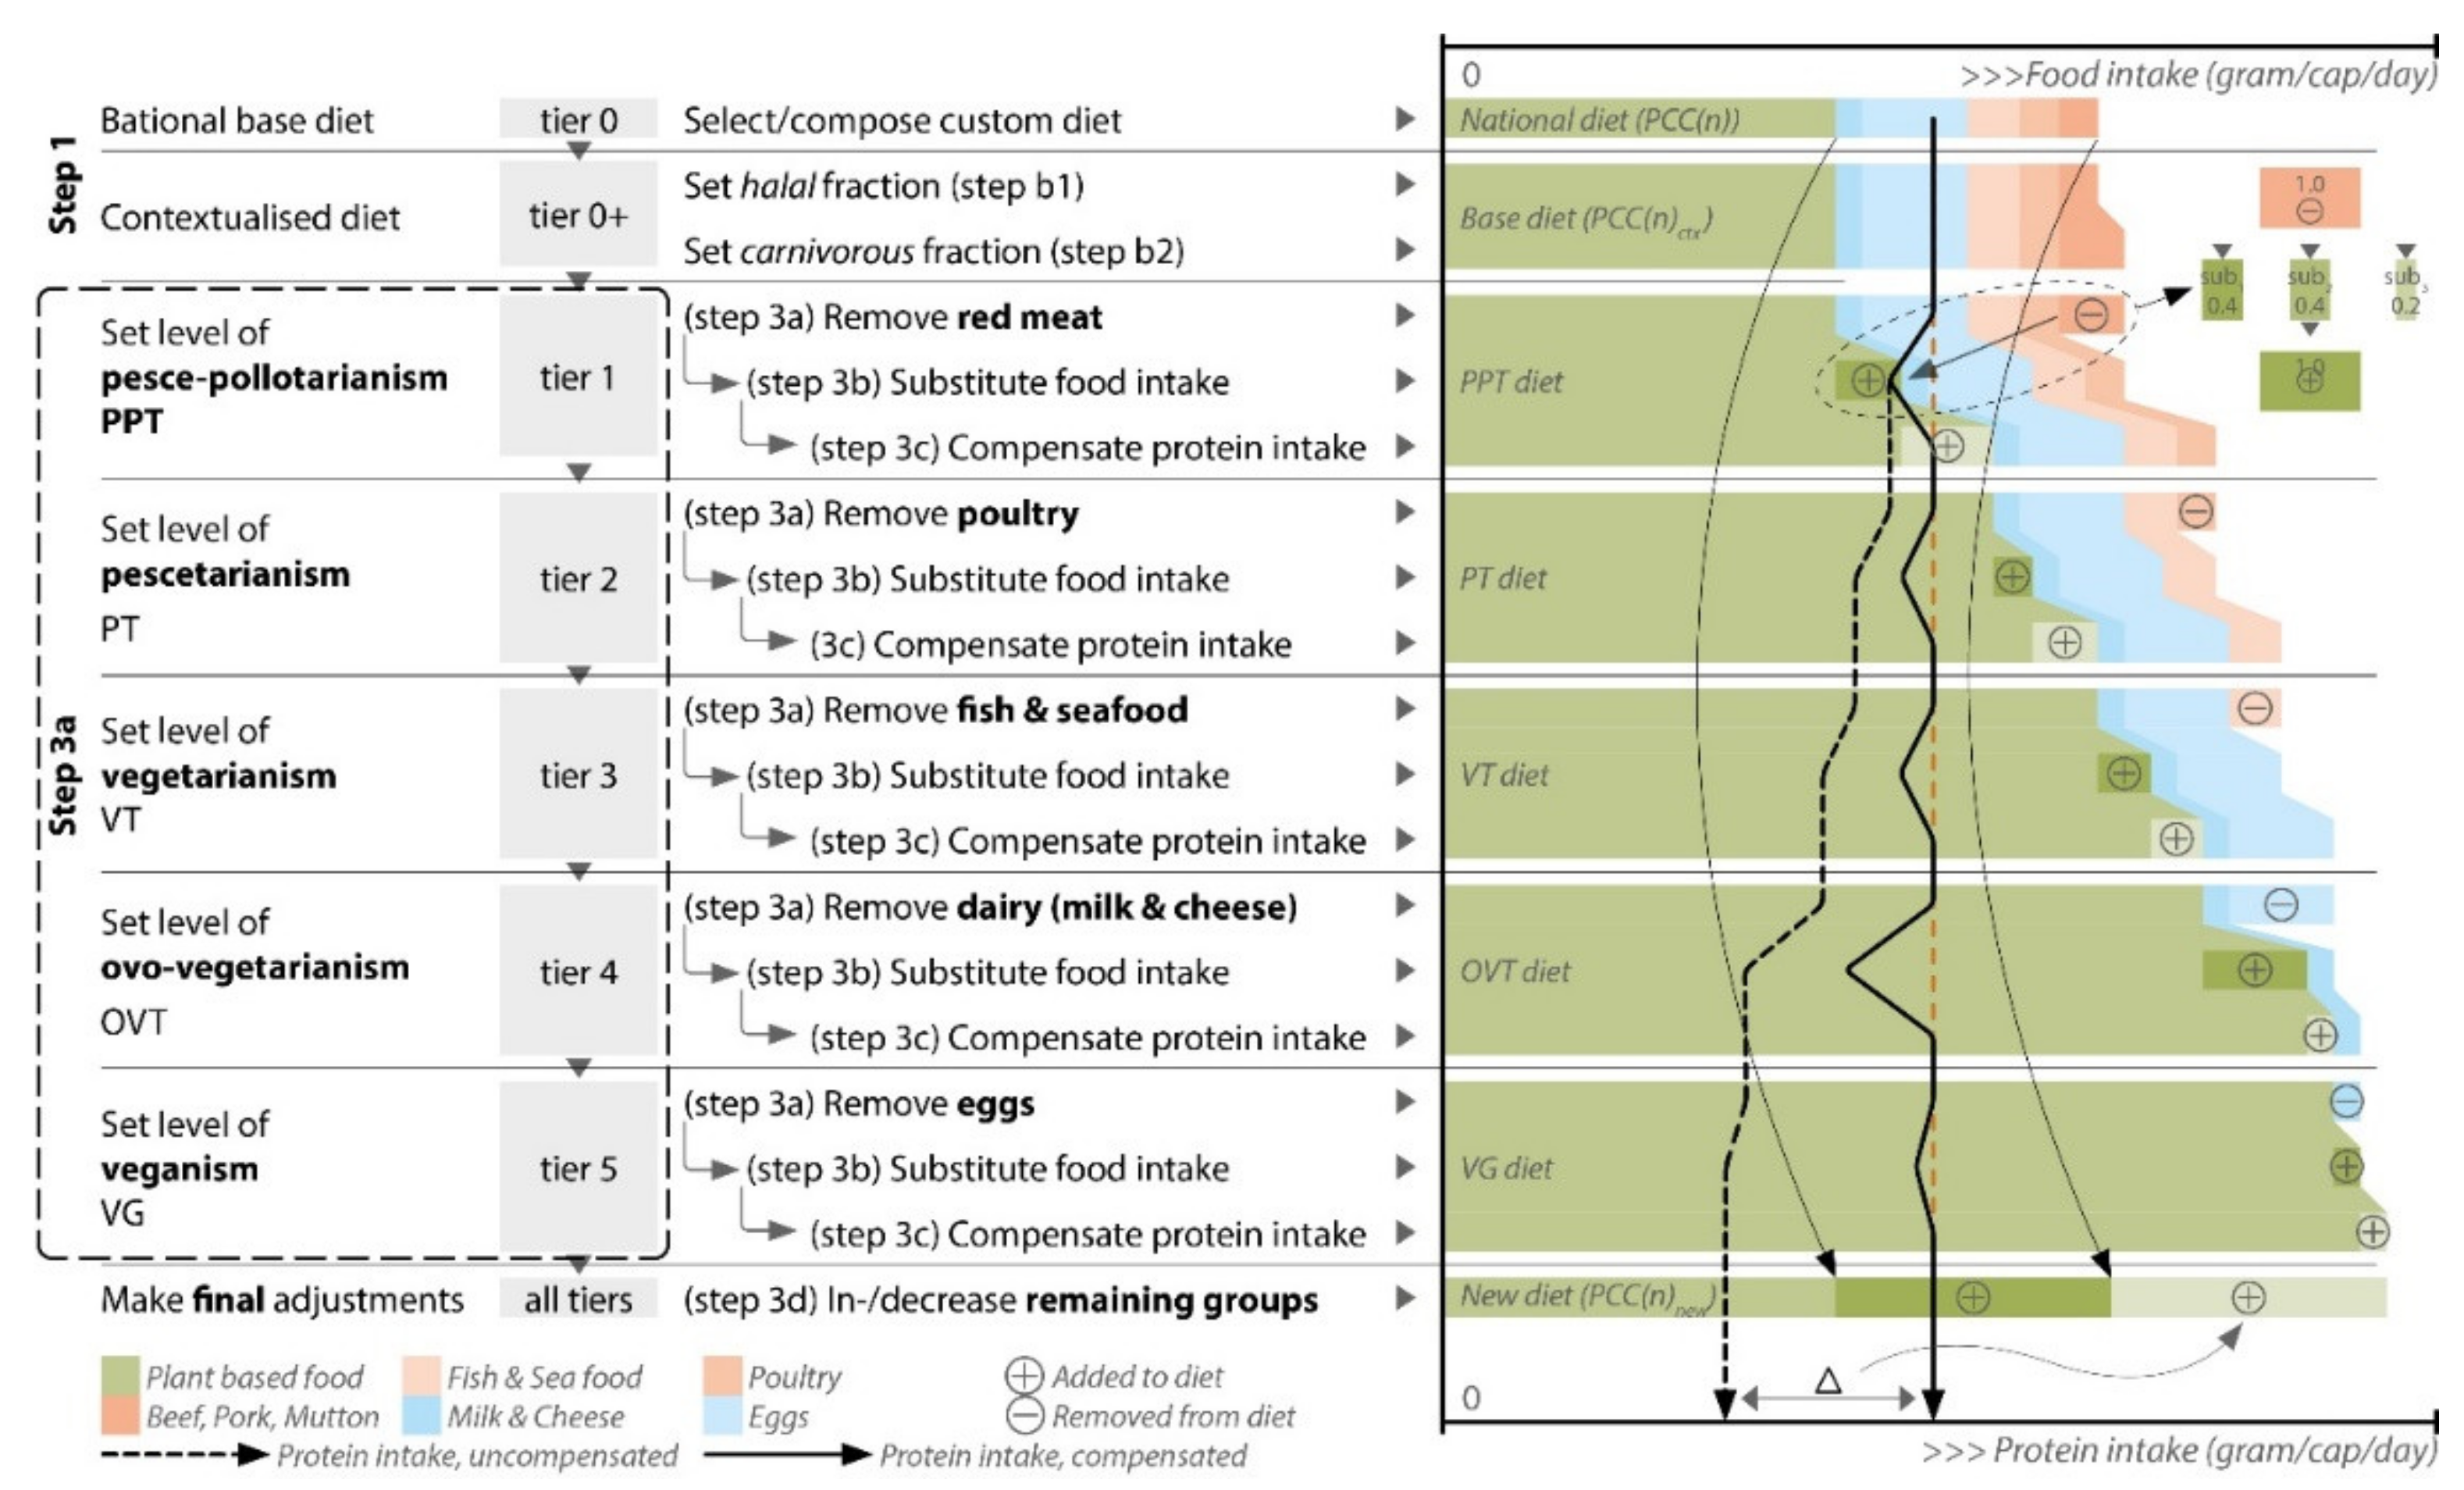
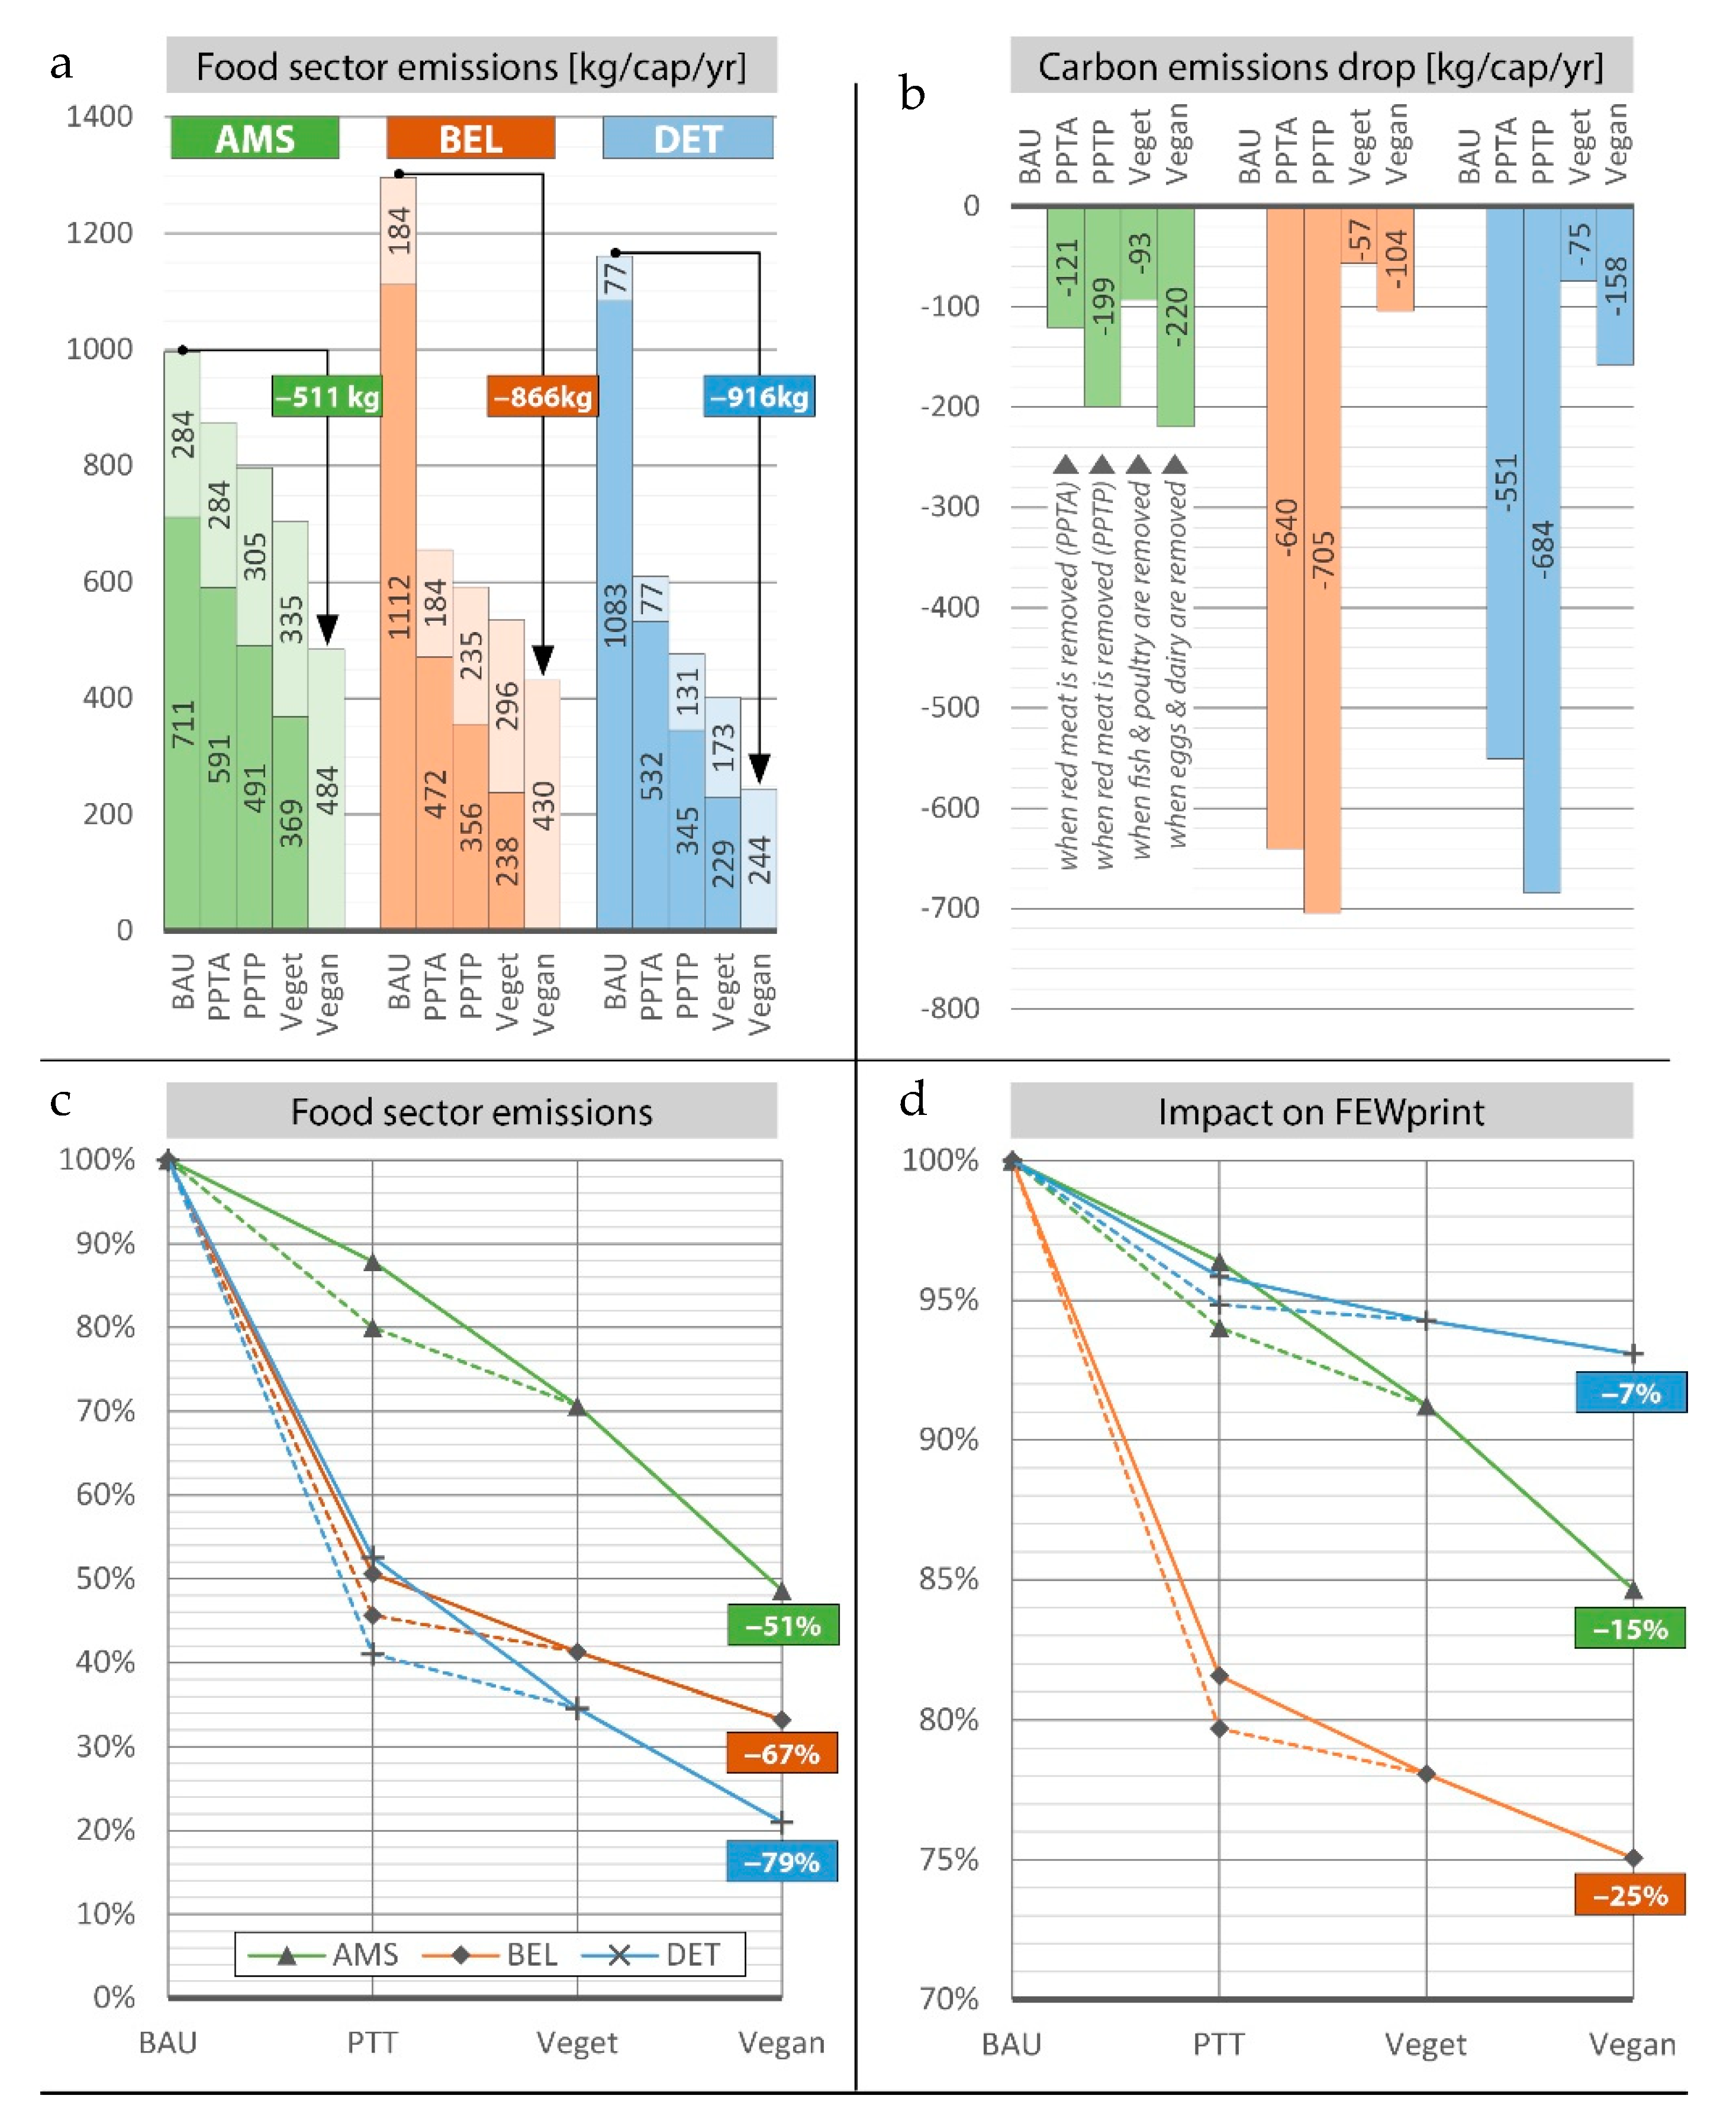
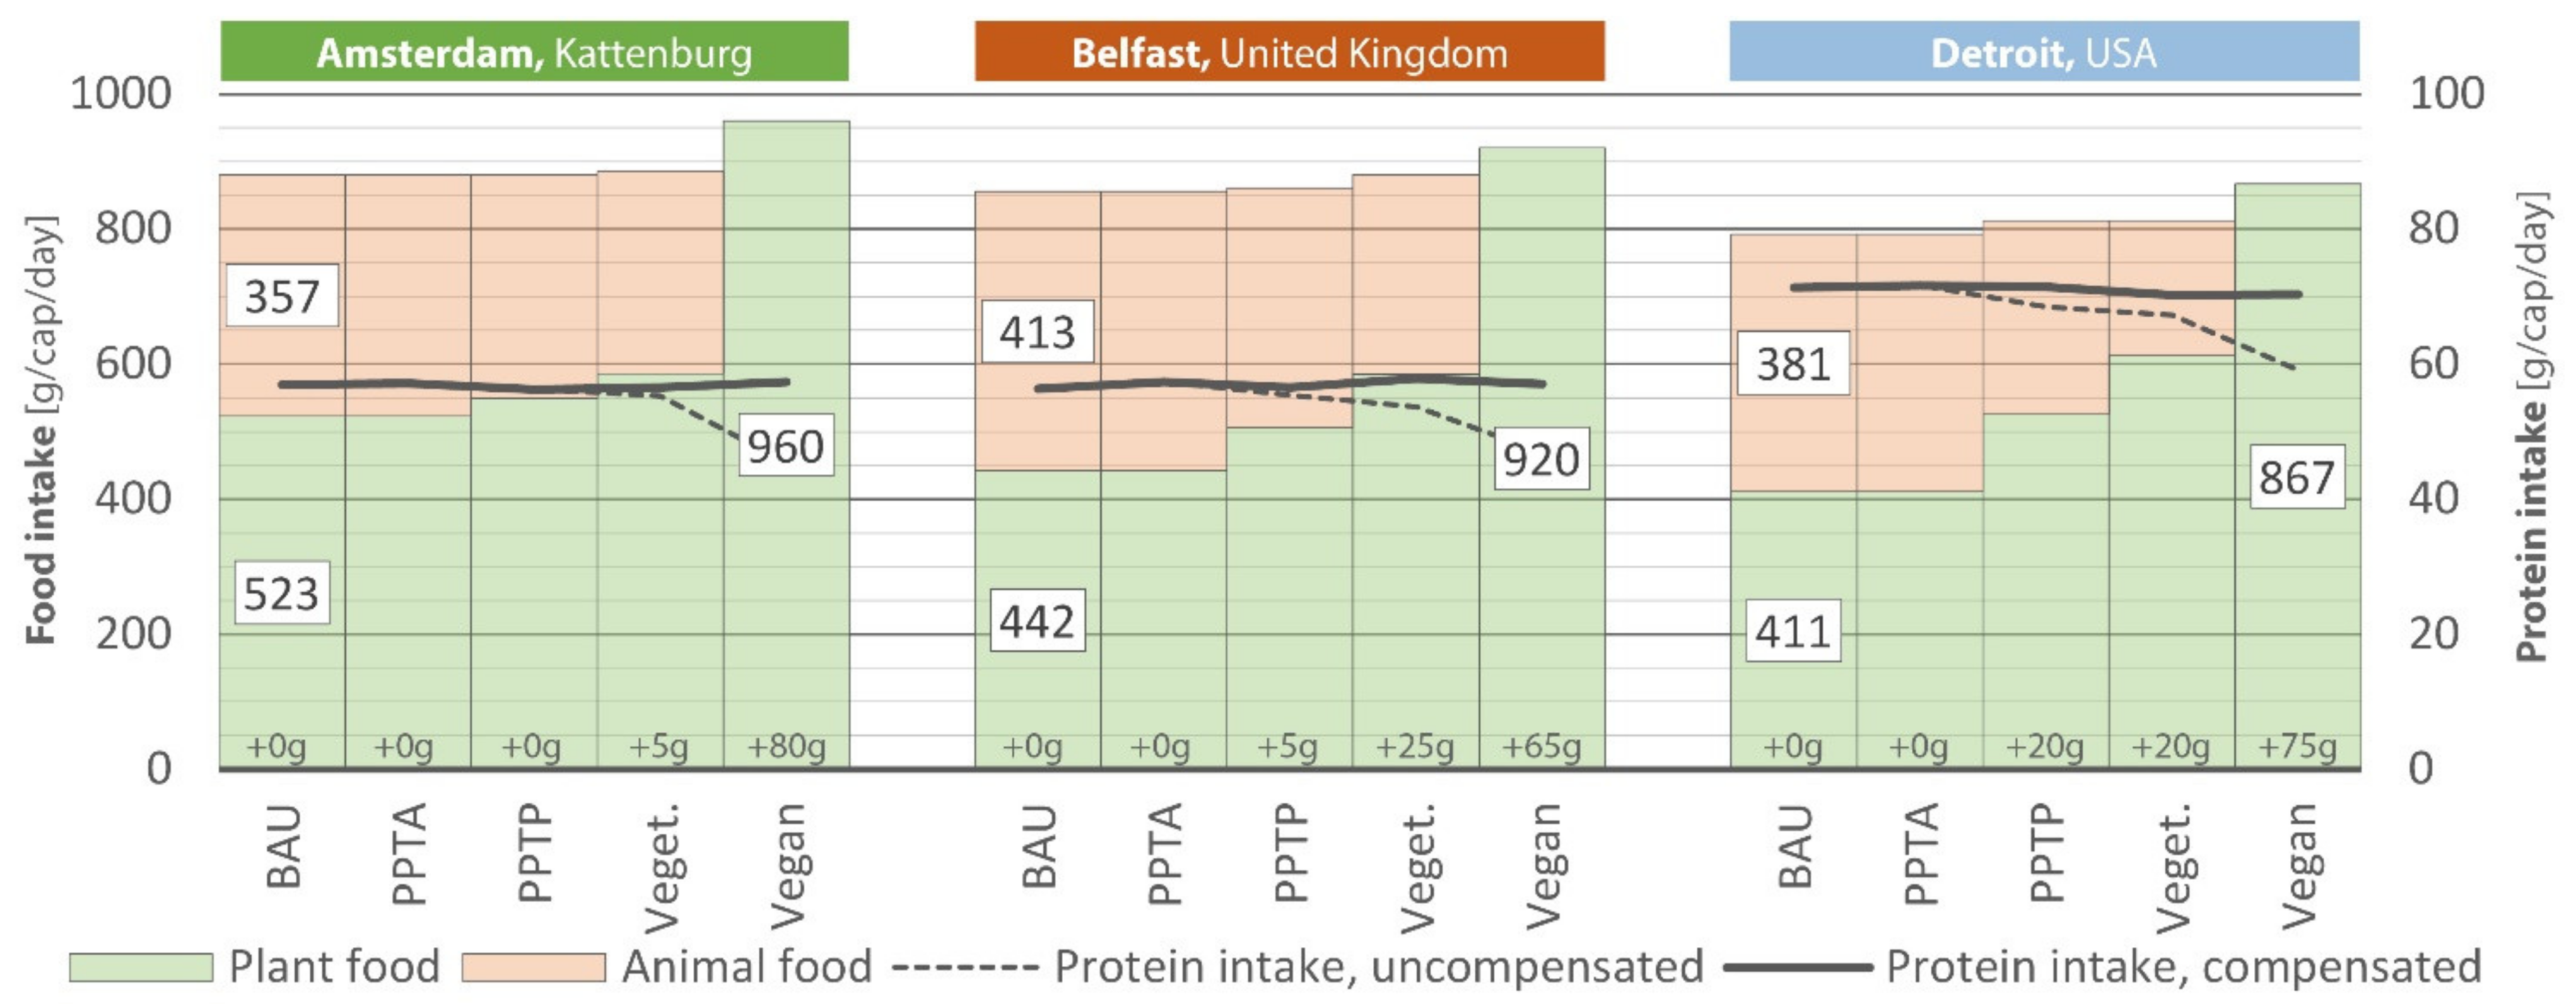
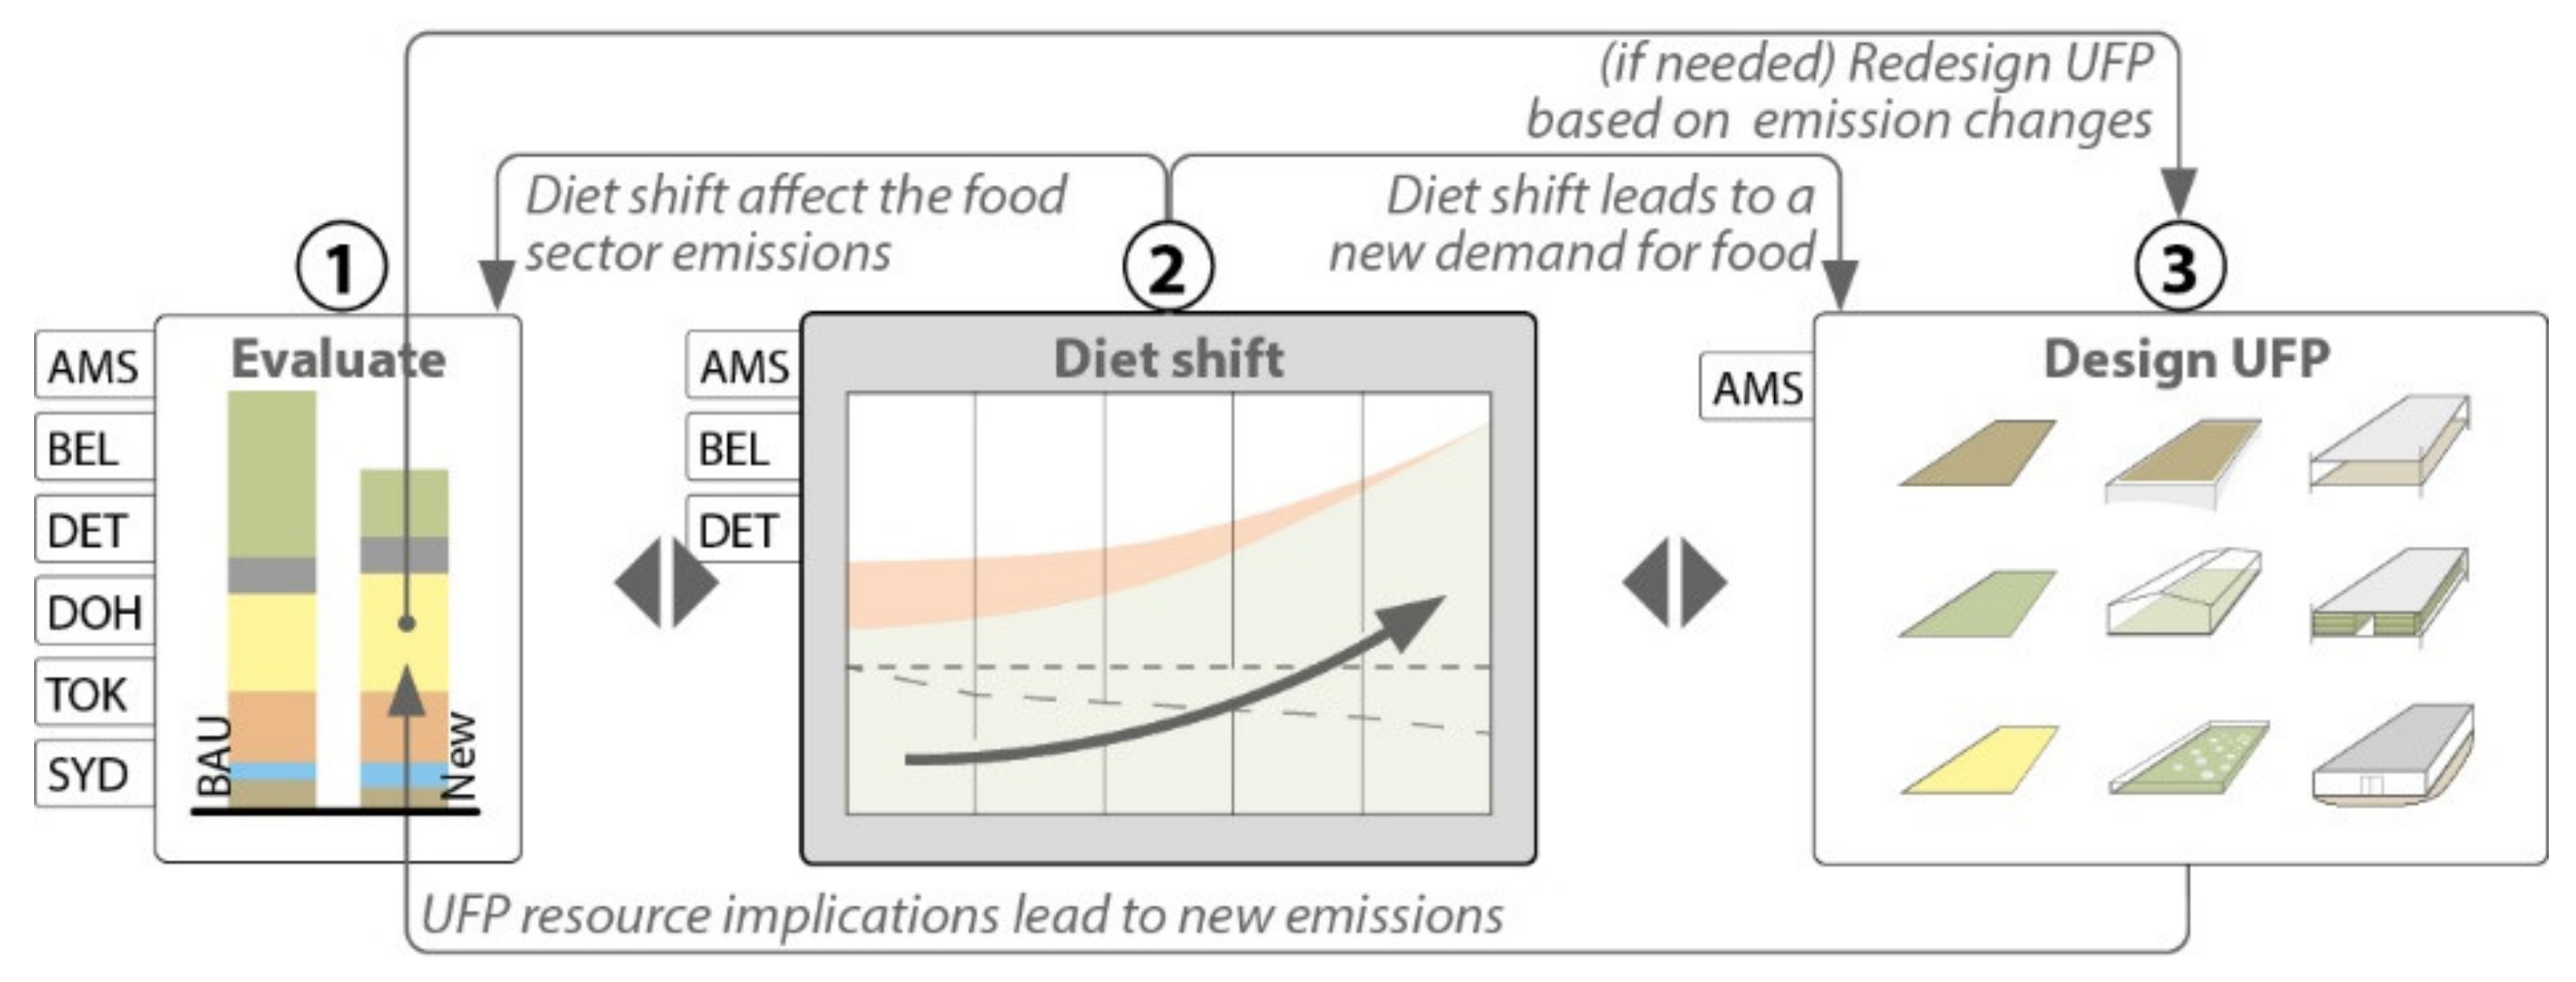
Publisher’s Note: MDPI stays neutral with regard to jurisdictional claims in published maps and institutional affiliations. |
© 2022 by the authors. Licensee MDPI, Basel, Switzerland. This article is an open access article distributed under the terms and conditions of the Creative Commons Attribution (CC BY) license (https://creativecommons.org/licenses/by/4.0/).