Abstract
Global warming caused by greenhouse gas emissions is highly concerning. Both the environmental Kuznets curve (EKC) hypothesis and decoupling analysis indicate a dynamic relationship between economic growth and environmental pollution, and each method has its own emphasis. The objective of this paper is to investigate the nexus between grain production and agricultural carbon emissions for the main grain-producing areas in China. Taking Henan Province, the second largest agricultural province, as an example, this paper examines the relationship between grain production and agricultural CO2 emissions during 2000–2019, using the EKC hypothesis and decoupling analysis. The results are as follows: (1) The estimation model of CO2 EKC shows the climbing stage of an inverted U-shaped relationship, which suggests that agricultural economic growth occurred at the cost of an increase in agricultural CO2 emissions in Henan Province during the past 20 years. (2) The results of the decoupling analysis show that incidences of weak decoupling and expansive coupling states took up most of the study period, accompanied by an occasionally strong decoupling state; decoupling and coupling states alternated irregularly, and no clear development trends were observed. (3) Considering the shape of the CO2 EKC and the decoupling state, environmental policies encouraged decoupling, but suffered from time lags and poor continuity; long-term incentives, such as an ecological compensation policy, could perhaps drive carbon emission reduction. On this basis, Chinese agricultural policy should combine environmentally targeted interventions with measures supporting production and farmers’ incomes, and environmental policy should also adapt to economic growth. Only when both supplement each other can sustainable agricultural goals be achieved.
1. Introduction
In the past 50 years, the economic growth mode of high inputs and high emissions has caused a series of environmental problems, which have affected the sustainable development of the economy and society [1]. As global warming becomes increasingly prominent, the question of how to deal with the economy–environment relationship is increasingly becoming a global concern, and green new deals to improve the development mode and reduce pollutant emissions are being promoted. Meanwhile, in academic circles, there is a large body of studies on the relationship between economic growth and environmental pressure. The environmental Kuznets curve (EKC) hypothesis [2] and decoupling analysis [3] are widely accepted methods of sustainability assessment. The shape of the economy–environment relationship or the decoupling/coupling state has implications for environmental policymaking [4,5].
With the extensive use of fossil energy materials, such as chemical fertilizers and pesticides, the rapid growth of crop-production-induced carbon emissions has brought public attention to low-carbon agricultural development [6,7,8,9]. According to a report by the Food and Agriculture Organization (FAO), agriculture is now the second largest source of greenhouse gas (GHG) emissions [10]. As a major agricultural country, China’s main grain-producing areas shoulder the important burden of maintaining food security. From 1999 to 2003, grain output declined year on year, resulting in insufficient production. Especially in 2003, the grain planting area dropped to the lowest level since the founding of the People’s Republic of China, shaking national food security. In this situation, grain-producing areas were set, and beneficial policy support was provided in order to stabilize national food production. Since 2004, China’s grain production has increased in 18 consecutive years, to which major grain-producing areas have significantly contributed. However, the excessive application of fertilizer not only promotes agricultural production efficiency, but also exacerbates GHG emissions [11]. Especially for major grain-producing areas, under the goal of high yield, agricultural production in these areas is intensified, and the contradictions and conflicts between agricultural economic growth and ecological environment protection are more concentrated. Agricultural nonpoint source pollution increased with the increase in production scale, resulting in growing environmental pollution [12]. Currently, China’s agricultural development goals include high yield, high quality, high efficiency, eco-environmental safety, and competitiveness. How can China substantially contribute to addressing global climate change while ensuring food security and the effective supply of agricultural products? Obviously, this depends on the policy guidance and the path choice of low-carbon agriculture.
Henan Province is the second largest agricultural province in China, which takes up one-quarter of China’s wheat output and feeds about 380 million people every year. Since 2014, the use of fertilizer in Henan Province has been the highest in China. Taking Henan Province as an example, the rest of this paper reports on the following: (1) Following the EKC hypothesis of an inverted U shape and a cubic function model estimation, the CO2 EKC was empirically tested between grain production and agricultural carbon emissions in Henan Province over the last 20 years. (2) Further, the decoupling degree of the relationship between grain production and agricultural carbon emissions was determined by the decoupling elasticity coefficient. (3) The results of the CO2 EKC fitting and decoupling analysis were evaluated and compared. Finally, in this article, policy suggestions are given for existing problems.
2. Literature Review
According to the EKC hypothesis, the economy–environment relationship follows an inverted U shape: in the process of economic growth, pollutant emissions rise from the beginning, peak in the middle, and fall at the end [2,13,14,15,16,17,18]. In fact, many EKC studies show that there is also an N shape [19,20], a linear shape [21,22], or even an irregular shape [23,24]. Recently, an increasing number of EKC studies have expanded from traditional pollutant indicators (including atmosphere, water, and land) to new indicators (such as ecological footprint and carbon footprint) [25,26], from indicators of emissions per capita to total emissions [23]. Regardless of the different methods employed in previous EKC studies, almost all follow a similar cubic function model [27,28,29]. Sarkodie and Strezov tested EKC hypotheses for Australia, China, Ghana, and the USA during 1971–2013, in order to determine the factors driving GHG emissions in their economic development [30]. Yan and Chen [31] examined the relationship between agricultural nonpoint pollution and economic development in China, and found that an inverted U-shaped relationship existed during 1998–2015. In further studies on a provincial scale in China, Shang et al. [32] found that pesticide application intensity and agricultural output value in Heilongjiang Province showed an inverted U shape, while the relationship between fertilizer application intensity and agricultural output value was N-shaped. Yan et al. [33] found that there was an N-shaped curve between fertilizer application intensity and agricultural output value in Henan Province during 1997–2017. As mentioned above, a high diversity of EKC estimations exist across spatial scales, from one country to a whole region, and over time.
In 2002, the OECD borrowed the concept of decoupling to estimate the economy–environment relationship [3] and provided an indicator for the judgement of decoupling degree. According to its classification, absolute decoupling means that the economy grows but environmental pressure remains unchanged or declines, whereas relative decoupling means that the economy grows faster than the rate of environmental degradation. In 2005, Tapio further developed an elastic coefficient as a decoupling index, which overcame the shortage due to base selection [34]. Subsequently, Vehas et al. [35] put forward suggestions for improving decoupling indicators. In an empirical study, Chen et al. [36] found that agricultural production and carbon emissions in Heilongjiang Province experienced an expansion and connection stage, a weak decoupling stage, a strong coupling stage, and a strong decoupling stage, from 2008 to 2017. For example, during 2014–2015, the use of agricultural chemicals in crop production was relatively high, as were agricultural carbon emissions; however, under the influence of the national policy of reducing the price of temporary storage, the income of corn and soybean production significantly decreased, which caused a strong coupling relationship between crop production and agricultural carbon emissions; that is, the economy shrank and the environment deteriorated. After the Ministry of Agriculture in China issued the Action Plan of Zero Growth of Chemical Fertilizer Usage by 2020 in 2015, Heilongjiang Province implemented clean technology in agricultural production and achieved the zero growth target of chemical fertilizer usage in advance. In this sense, the sustainable development goal from coupling to decoupling can be achieved on the basis of environmental policy interventions.
Considering ways through which to further explore the relationship between economic growth and pollutant emissions, the United Nations Environment Program (UNEP) suggested that decoupling analysis may be linked with the EKC hypothesis [37]. From this perspective, Lv et al. [38] examined the relationship between economic growth and the carbon emissions of the manufacturing industry in China during 1995–2017, integrating EKC with decoupling, and the fitting result was acceptable from the perspective of the whole manufacturing industry. Nonetheless, more relevant empirical explorations are needed [39]. In this regard, this study examines the nexus between grain production and agricultural carbon emissions in Henan Province during 2000–2019, using both the EKC hypothesis and decoupling analysis, so as to provide suggestions for achieving food and environmental security in Henan Province.
3. Materials and Method
3.1. Study Area
Wheat is one of China’s two staple foods, and Henan Province takes up one-quarter of China’s wheat output, which plays an important role in ensuring national food security. During 2000–2019, the proportion of sown grain area in Henan Province increased from 69% to 74%, the value added to agriculture increased from 1264.3 hundred million yuan to 2941.3 hundred million yuan (that is, it more than doubled), and rural per capita annual disposable income increased from 1986 yuan to 8578 yuan. Meanwhile, there was also a significant increase in agricultural chemical inputs: the use of chemical fertilizers increased from 419.5 × 10⁴ tons to 692.8 × 10⁴ tons, and has ranked first in China since 2014; the use of pesticides increased from 9.55 × 10⁴ tons to 11.36 × 10⁴ tons; the use of agricultural diesel increased from 79.6 × 10⁴ tons to 103.9 × 10⁴ tons; and the use of plastic films increased from 9.2 × 10⁴ tons to 15.3 × 10⁴ tons. All greatly increased agricultural carbon emissions and exerted great pressure on farmland ecosystems. Additionally, accompanied by rapid urbanization, the change in the agricultural labor force was significant. For example, the rural nonagricultural employment rate increased from 24.5% to 47.3%, and the aging rate of the agricultural labor force increased from 7.3% to 12.3%, which also indirectly influenced agricultural carbon emissions through agricultural chemical inputs.
3.2. Estimation and Data Source of Agricultural CO2 Emissions
According to the calculation method in China and elsewhere, the agricultural CO2 emission calculation follows Equation (1):
where C represents the estimation value of grain-production-based carbon emissions converted into CO2 equivalents, i is the agricultural input or source, Ei is the amount of each agricultural input or source i (including fertilizers, pesticides, plastic films, agricultural diesel, tillage, and electricity for irrigation), and Ti is the emission factor following existing research [40,41,42].
Following previous studies [43,44], agricultural carbon emission intensity (CI), also called agricultural production efficiency or carbon productivity, reflects the progress in low-carbon agricultural production mode, namely, CI in decline indicates agricultural carbon emission reduction due to improvements in technology, policy, and management. Here, CI is expressed by Equation (2):
where CI represents CO2 emissions per unit of value added to grain production (unit: tons per 10,000 yuan), C is agricultural CO2 emissions (unit: tons), and G is agricultural economic performance, measured by value added to grain production (unit: 10,000 yuan).
In data processing, we deflated the value added to agriculture and total agricultural output value in Henan Province according to the standard of the year 2000. Additionally, we took logarithms of the data of the variables to reduce the order of magnitude of the raw data, thereby reducing its volatility. Table 1 reports the descriptive statistical results of the variables, and further statistical analysis can be conducted.

Table 1.
Descriptive statistics of variables and data sources.
3.3. EKC Hypothesis and Model Specification
On the basis of the above research on EKC, and considering the agricultural development process in the main grain-producing areas in China, the goal of high grain yield was achieved at the cost of high material input and high pollutant emissions. We assume an EKC hypothesis, according to which there is an inverted U-shaped relationship between grain production and agriculturally driven carbon emissions in Henan Province during 2000–2019; that is, in the process of agricultural economic growth, agricultural carbon emissions increase in the beginning, and gradually decline after the turning point. Following David [45] and Selden and Song [46], the model specification of CO2 EKC for the relationship between grain production and agricultural carbon emissions in Henan Province is expressed in reduced form as Equation (3):
where C is agricultural carbon emissions; G is value added to agriculture; ln indicates the natural logarithm; is the constant term; ,, and are the coefficient estimates of the regressors; and is random error. If 0, 0, and the significance test is passed, an inverted U-shaped EKC can result; otherwise, an inverted U-shaped EKC does not exist.
3.4. Decoupling Index
Following Tapio [34], we constructed a decoupling index (DI) to examine the nexus between grain production and agricultural CO2 emissions in Henan Province. The equation is expressed as:
where DI indicates the change in agricultural CO2 emissions with respect to the value added to agriculture during the base period m and the last time n; we chose one year as the time interval in this paper. ΔC and ΔG denote the change in agricultural CO2 emissions and the value added to agriculture for a period of one year, respectively; Cm and Cn represent agricultural CO2 emissions for a period one year, respectively, and Gm and Gn represent the value added to agriculture within a year, respectively.
Decoupling degrees are determined according to environmental pressure (), economic growth (), and DI values (Table 2).
Table 2.
Decoupling degrees and features.
4. Results
4.1. Results of Agricultural CO2 Emission Estimation
According to Equations (1) and (2), both the agricultural CO2 emissions and the agricultural carbon emission intensity (CI) of Henan Province from 2000 to 2019 were estimated (Figure 1). Along with rising agricultural economic growth, except in 2003, when farmers’ willingness to plant bottomed out, agricultural CO2 emissions generally showed a trend of rising in fluctuations, with a low point in 2003 (768.9 × 10⁴ tons) and a high point in 2019 (1624.3 × 104 tons). The agricultural CO2 emission intensity (CI) rose and fell, with a high point in 2005 (0.61 tons per 104 yuan). During the most recent decade, agricultural carbon emission intensity (CI) dropped in fluctuation and fell to a new low in 2018 (0.48 tons per 104 yuan); however, it had a slight recovery in 2019 (0.53 tons per 104 yuan). As a whole, there was a downward trend in agricultural CO2 emission intensity (CI), which indicates that Henan Province has the potential for a low-carbon agriculture, despite its unclear development path.
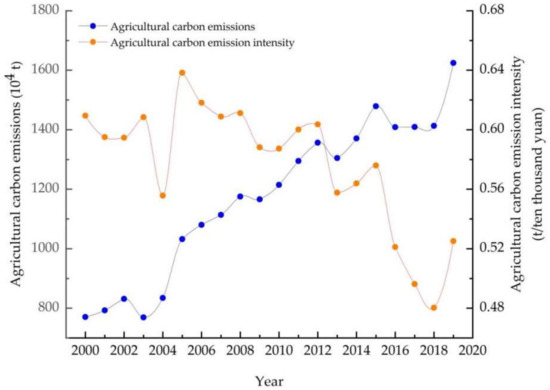
Figure 1.
Agricultural carbon emissions and agricultural carbon emission intensity (CI) in Henan Province during 2000–2019.
4.2. Results of CO2 EKC Fitting
On the basis of data for the value added to agriculture and agricultural CO2 emissions (2000–2019), a scatter diagram of grain production and agricultural carbon emissions in Henan Province was further fitted, as shown in Figure 2.
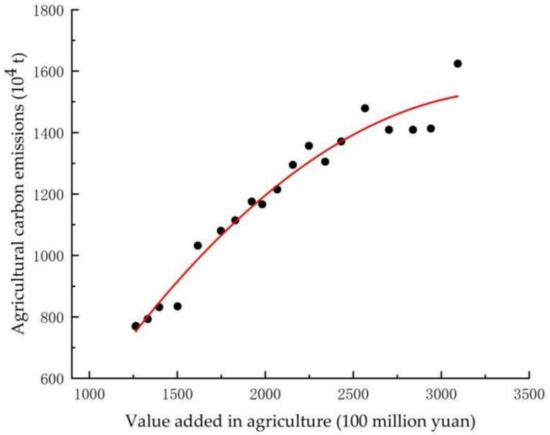
Figure 2.
Scatter diagram of value added to agriculture and agricultural carbon emissions in Henan Province (2000–2019).
It is not certain that the shape of the EKC in Figure 2 belongs to a linear or nonlinear case. Therefore, we next estimated the CO2 EKC on the basis of Equation (3). In order to prevent the occurrence of serial pseudo-regression, the ADF test method was used to test the stability of the series, and in order to eliminate the effect of heteroscedasticity and improve the accuracy of the estimation, the variables in the form of a natural logarithm were adopted. Table 3 shows the unit root test results of the variables; the value added to agriculture and agricultural carbon emissions in the form of natural logarithms was stationary at significance levels of 5% and 10%, respectively.
Table 3.
Unit root test results of variables.
Next, the Granger causality test was conducted for the correlational analysis of the variables. As shown in Table 4, the null hypothesis that “lnG is not the Granger cause for lnC” was rejected at a significance level of 10%, and the null hypothesis that “lnC is not the Granger cause of lnG” was not rejected. The results showed that agricultural economic growth was the cause of the increase in agricultural carbon emissions.
Table 4.
Results of Granger causality test.
We performed the EKC fitting according to Equation (3), and results are shown in Table 5; we obtained the nonlinear curve fitting as Equation (5):
Table 5.
Results of EKC fitting for Henan Province (2000–2019).
Table 5 suggests that there was an inverted U-shaped relationship between grain production and agricultural carbon emissions in Henan Province, which is currently at the climbing stage of an inverted U-shaped EKC (Figure 2), indicating that agricultural carbon emissions kept rising along with agricultural economic growth during the past 20 years, and no peak has yet appeared.
4.3. Results of Decoupling Analysis
There were four kinds of decoupling or coupling states in Henan Province during 2000–2019 (Table 6). Weak decoupling appeared for 8 years, expansive coupling appeared for 7 years, strong decoupling occurred for 3 years, and weak coupling appeared for 1 year. In addition, as seen from the time series, a decoupling state irregularly alternated with a coupling state.
Table 6.
Decoupling states in Henan Province (2000–2019).
Following Table 2, strong decoupling refers to a state in which the agricultural economy grows while agricultural carbon emissions decline. Table 6 shows that strong decoupling states appeared in 2009, 2013, and 2016 in Henan Province; here, we attempted to associate them with relevant environmental policies issued by the Chinese government since the beginning of the 21st century. For example, after the National Action Plan on Climate Change was introduced in 2007, and a target of reducing 40–45% of CO2 emissions per unit of GDP by 2020 against 2005 levels was set by the Chinese government in 2009, the use of chemical fertilizers, especially nitrogen fertilizers, decreased by 0.94% and 0.05%, respectively. As a result, the first strong decoupling state occurred in Henan Province in 2009. Additionally, after the goal of building a resource-conserving and environmentally friendly society was put forward in 2012, the reduction in chemical fertilizers attracted more attention, and agricultural carbon emissions showed a negative growth rate one year later, so a second strong decoupling state arose. Similarly, the Soil Pollution Prevention and Control Action Plan was issued in 2016, which promoted fertilizer reduction in grain production, and a third strong decoupling state reappeared in 2016. As mentioned above, we found tentative evidence that environmental policies encouraged the decoupling of agricultural carbon emissions from grain production in Henan Province during 2000–2019.
Weak decoupling refers to a state in which the growth rate of the economy is higher than the rate at which the state of the environment worsens. The occurrence of the weak decoupling state in Henan Province mostly appeared in the years when some environmental policies were issued, including the Clean Production Promotion Law issued in 2002, the Soil Pollution Prevention and Control Action Plan issued in 2017, and the writing of “Ecological Civilization” into the Chinese Constitution in 2018. Combing weak decoupling and strong decoupling states, we found that environmental policies played a role in reducing agricultural carbon emissions, despite time lags and poor continuity.
Expansive coupling means a state in which the agricultural economy grows at the cost of an increase in agricultural carbon emissions. In fact, the expansive coupling state occurred more frequently and often followed different degrees of decoupling state in Henan Province. The single occurrence of weak coupling occurred due to some specific factors, such as farmers’ low willingness to grow crops, with negative change rates in value added to agriculture and agricultural carbon emissions in 2003.
To sum up, strong decoupling has taken place since 2009; however, this situation has not lasted long. The high diversity in decoupling or coupling states indicated that the rising environmental costs and negative environmental impact affected sustainable agricultural production in Henan Province, and many challenges to Henan’s decoupling ambition are evident. Addressing these challenges requires a complex combination of scientific strategies, environmental policies, and farmers’ actions, and there is much room for policy improvement.
4.4. Results of Integrating EKC with Decoupling
Generally, the EKC hypothesis describes the long-term characteristics of the economy–environment relationship, and decoupling analysis reveals the short-term characteristics of the economy–environment relationship; both have their priorities. According to the UNEP [37], from the perspective of sustainability assessment, in the process of continued economic growth, the value of the decoupling index may be linked with three stages of the inverted U-shaped EKC (Figure 3).
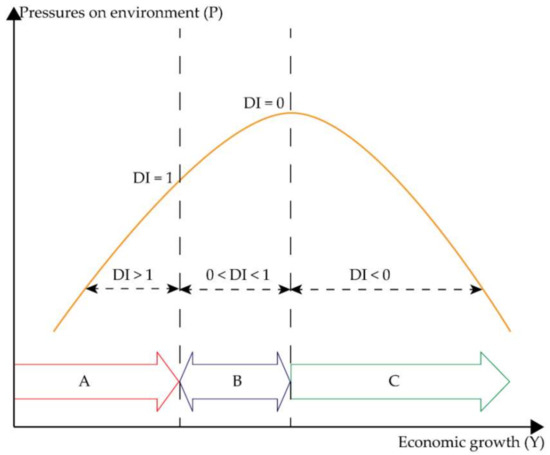
Figure 3.
Diagram of integrating EKC with decoupling. Adapted from Ref. [37].
As shown in Figure 3, area A in an inverted U-shaped EKC, the climbing stage, corresponds to the section of DI > 1, which means economic growth at the cost of high environmental pressure, and no decoupling occurred; area B corresponds to the section of 0 < DI < 1, which means that weak decoupling appeared; in other words, the economic growth rate was higher than that of the environmental degradation; similarly, area C, the declining stage, corresponds to the section of DI < 0, which means that economic growth decoupled from environmental pressures. DI = 1 means that a turning point between strong coupling and weak decoupling appeared, and DI = 0 means that a turning point between weak decoupling and strong decoupling appeared.
Following UNEP [37], in the case of grain-production-induced carbon emissions in Henan Province, we integrated the agricultural CO2 EKC with decoupling analysis, after the data in 2003 were removed due to negative economic growth. Figure 4 illustrates that the climbing stage of an inverted U-shaped EKC accompanied by mixed decoupling performance, namely, coupling states and decoupling states alternated irregularly; neither DI = 0 nor DI = 1 appeared, and we found no inflection point, which indicated that agricultural economic growth in Henan Province still took place at the cost of increasing agricultural carbon emissions, although it had the potential to occasionally enter a decoupling state (the value of DI < 0 appeared sporadically, although the section of area C does not appear in Figure 4). Henan Province is facing the dual pressure of food security and environmental protection.
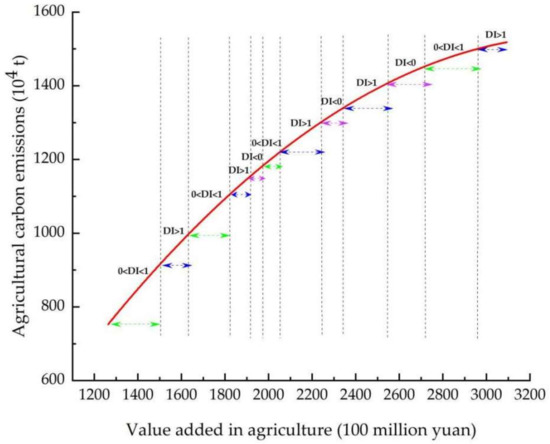
Figure 4.
Results of integrating EKC with decoupling analysis in Henan Province.
In view of the relationship between grain production and agricultural carbon emissions in Henan Province, although the ideal combination of EKC and decoupling, as in Figure 3, did not appear, Figure 4 displays the current status of Henan Province, which reminded us to adjust the agricultural production mode for the goals of ensuring food security and low-carbon agricultural development, especially for similar main grain-producing areas in China. More improvements are needed in agricultural scientific technology, policymaking, and strengthening field management. This empirical case focuses on the first steps, followed by problem diagnosis, so as to provide suggestions for more targeted policy interventions.
5. Discussion
(1) From the perspective of sustainability assessment, the EKC describes the long- term relationship between economic growth and environmental pressure, and decoupling analysis indicates the extent to which environmental pressure decouples from economic growth in the short term. The shape of the economy–environment relationship and the decoupling/coupling state each have their implications for environmental policymaking [4,5], so comprehensive analyses based on EKC and decoupling are conducive to constructive policies focused on green economic growth. For example, Xia and Zhong [39] combined these two methods to examine the relationship between economic growth and SO2 emissions in 271 cities in China during 2004–2013, and further explored the relationship between the decoupling elasticity coefficient and per capita GDP, when there was an inverted U-shaped curve. Taking their cue from UNEP [37], Lv et al. [38] investigated the nexus between the manufacturing industry and CO2 emissions in China from a long-term trend and short-term changes (Figure 5). Compared to Figure 3, despite the absence of a section of area A (which corresponds to the section of DI > 1), areas B and C in Figure 5 correspond to the sections of 0 < DI < 1 and DI < 0, respectively. According to Figure 5, we found tentative evidence that the overall manufacturing-industry-induced carbon emissions over the past 20 years passed the first inflection point (DI = 1) and the second inflection point (DI = 0), and entered the declining stage across the peak of the inverted U-shaped EKC. In fact, not every empirical case is consistent with the UNEP’s idea [37]. However, this idea is worth adopting.
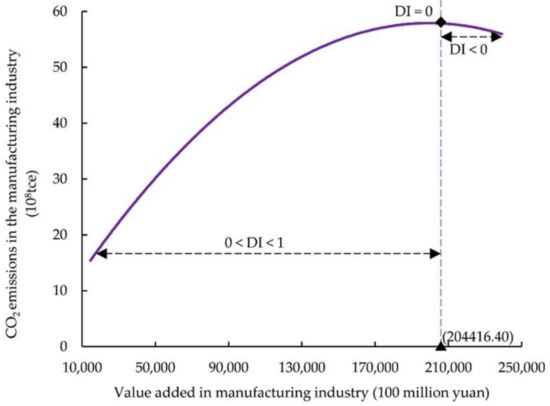
Figure 5.
Relationship between manufacturing industry and CO2 emissions in China during 1995–2017 based on EKC and decoupling. Reprinted from Ref. [38].
In this case study, with regard to the relationship between grain production and agricultural carbon emissions in Henan Province during 2000–2019, on the one hand, the results of the CO2 EKC estimation showed the climbing stage of an inverted U-shaped relationship, which indicated a poor relationship over the years; on the other hand, according to the annual decoupling analysis, various decoupling states occurred. However, they were interrupted frequently by expansive coupling states, which testified that existing policies need to be improved in order to achieve the goal of low-carbon agricultural development.
(2) From a policy perspective, more efficient policy interventions, such as the Common Agricultural Policy (CAP) in the EU, are worth learning from. In the CAP, the European Environment Agency successfully combined measures of environmentally targeted interventions and support for agricultural production and farmers’ incomes, which played key role in inhibiting greenhouse gas emissions, including the progressive shift in support from coupled to decoupled subsidy, in addition to measures that provide incentives towards sustainable and low-carbon practices and behaviors [47,48,49].
China is in the process of rapid urbanization. With its rural transformation, Henan’s countryside is faced with a large outflow of young adults and an aging agricultural labor force, which directly or indirectly lead to the excessive application of chemical fertilizers, pesticides, and other agricultural materials (the use of fertilizer in Henan Province has been the highest in China since 2014). In this paper, through the integration of EKC and decoupling, we found that existing environmental policies had time lags and poor continuity; the main reason probably lies in the shortage of long-run incentives for farmers. Therefore, this paper emphasizes an agricultural ecological compensation policy for promoting the development of low-carbon agriculture in China. Farmers, after all, are followers of agricultural economic interests, and the implementers of green and low-carbon agriculture.
The Chinese government has issued a series of agricultural benefit policies since 2004, including direct grain subsidies, subsidies for the purchase of agricultural machinery and tools, comprehensive subsidies for agricultural materials, and agricultural insurance. The purpose of the above policies is to stimulate farmers’ enthusiasm for growing grain, increasing farmers’ production and income. However, high output in agriculture often becomes the main driving factor of high pollutant emissions, which in turn undermines sustainable agricultural development. In 2005, the Chinese government proposed the establishment of an ecological compensation mechanism for the first time. In order to solve integral problems, such as single financial payments, a low compensation standard, and an unsustainable compensation mechanism, in practice, new policies have been intensively introduced in recent years. For example, “Opinions on Improving the Compensation Mechanism for Ecological Protection” was issued in 2016, and the establishment of a market-oriented and diversified ecological compensation mechanism was put forward in 2017. In particular, “Opinions on Deepening the Reform of the Ecological Protection Compensation System” was set out in 2021, which set clear requirements for vertical and horizontal compensation, and advocated a diversified compensation mechanism led by the government and involving the market. All the above policy interventions help to form a positive interaction between ecological protectors and ecological beneficiaries, and provide institutional support for the development of low-carbon agriculture in China.
Moreover, many studies focus on agricultural ecological compensation. Considering that the agricultural ecosystem has the dual properties of carbon source and carbon sink, Chen and Jiang [50] constructed the carbon account of the whole agricultural production process, and calculated the net agricultural carbon sink of each province in China from 2007 to 2015. Wu et al. [51] explored the spatial spillover effect, and found that agricultural economic growth had a positive impact on the agricultural carbon offset rate, while the size of the agricultural labor force and the intensity of chemical fertilizer application had a negative effect. Lastly, regional cooperation was suggested for exploring the diversified paths of carbon emission reduction. Zhu et al. [52] identified the determining factors in farmers’ willingness to participate in the market-based ecological compensation, and provided suggestions for stimulating farmers’ willingness to participate. All the above studies put forward suggestions for policymaking towards low-carbon agriculture in China.
(3) Policy suggestions. Under low-carbon agriculture targets, we provide the following policy suggestions on the basis of the above findings: ① Agricultural environmental objectives should be strengthened through the formulation and implementation of agricultural subsidy policies. With a single economic policy or environmental policy, it is difficult to achieve a globally beneficial effect, especially for major grain-producing areas, such as Henan Province, which performs the dual tasks of food security and environmental security. Therefore, new agricultural policies should give equal weight to environmental protection; besides, fiscal and tax policy support for agricultural scientific and technological innovation should be increased, both for increasing grain output and for building environmentally friendly production modes, so as to minimize pollutant emissions from production sources. ② The agricultural ecological compensation policy should be improved, and detailed and operable implementation rules should be set out, according to voluntary and incentive-based policy measures, and by means of transfer payments from the central finance system. Farmers who input low-carbon agricultural materials (such as organic fertilizer) or adopt low-carbon agricultural activities (such as no tillage and returning straw to the field) and enterprises producing low-carbon agricultural materials should receive loss subsidies, rewards, and financial discount loans. The long-acting incentive mechanism will give full play to farmers’ initiatives towards emission reduction, which will produce twice the result with half the effort. ③ We will focus on regional integration and build a platform for the regional collaborative promotion of agricultural carbon reduction, especially for major grain-producing areas in China. Since the reward and punishment funds mainly come from the financial expenditure of each region, in practice, the national level is responsible for overall coordination and optimizing the flow of reward and punishment funds. In short, it is a difficult task to achieve food and environmental security, especially for a country with a large population; however, continuous efforts are being undertaken towards achieving sustainable and low-carbon agriculture.
6. Conclusions
The objective of this paper was to investigate the nexus between grain production and agricultural carbon emissions in Henan Province during 2000–2019, using both the EKC hypothesis and decoupling analysis, so as to promote the stable sustainable development of agriculture and consolidate the strategic position of food security in Henan Province.
The results of the CO2 EKC estimation showed an inverted U-shape EKC during 2000–2019, and the current status is at the climbing stage, which indicates a poor relationship between grain production and agricultural carbon emissions. The results of the decoupling analysis showed that weak decoupling and expansive coupling were prevalent during the study phase, and decoupling and coupling states alternated irregularly, which indicates that Henan Province has the potential for low-carbon agricultural development, although opportunities and pressure coexist.
On the basis of integrating the EKC hypothesis with decoupling analysis, we found that the environmental policies promulgated by the Chinese government in the 21st century have helped to mitigate agricultural carbon emissions, but they also showed time lags and poor continuity. The main reason for this may lie in the shortage of long-term incentives, such as an ecological compensation system for farmers. Lastly, this paper highlights the great importance of agricultural subsidy policies to environmental impact, and suggests that agricultural subsidy policies should give equal weight to farmers’ incomes and environmental protection in order to achieve low-carbon agricultural goals.
Author Contributions
D.L. designed and conceived this research; Z.W. processed the data and wrote the paper. All authors have read and agreed to the published version of the manuscript.
Funding
This research was funded by the National Natural Science Funds of China, grant number Grant No. 41571115.
Data Availability Statement
Data can be found in China Rural Statistical Yearbook (https://data.cnki.net/trade/Yearbook/Single/N2020120306?z=Z009%29, accessed on 10 May 2021), and Henan Statistical Yearbook (https://data.cnki.net/Yearbook/Single/N2020020050, accessed on 10 May 2021).
Conflicts of Interest
The authors declare no conflict of interest.
References
- Wilschut, R.A.; Geisen, S.; Martens, H.; Kostenko, O.; de Hollander, M.; ten Hooven, F.C.; Celik, T. Latitudinal Variation in Soil Nematode Communities under Climate Warming -Related Range-Expanding and Native Plants. Glob. Chang. Biol. 2019, 25, 2714–2726. [Google Scholar] [CrossRef]
- Grossman, G.M.; Krueger, A.B. Economic Growth and the Environment. Q. J. Econ. 1995, 110, 353–377. [Google Scholar] [CrossRef]
- Organisation for Economic Co-Operation and Development (OECD). Indicators to Measure Decoupling of Environmental Pressure from Economic Growth. SG/SD(2002)1/FINAL. Available online: http://www.oecd.org/env/indicators-modelling-outlooks/1933638.pdf (accessed on 10 May 2021).
- Azomahou, T.; Laisney, F.; Van, P.N. Economic Development and CO2 Emissions: A Nonparametric Panel Approach. Soc. Sci. Electron. Publ. 2005, 90, 1347–1363. [Google Scholar] [CrossRef][Green Version]
- Sarkodie, S.A.; Strezov, V. A Review on Environmental Kuznets Curve Hypothesis Using Bibliometric and Meta-Analysis. Sci. Total Environ. 2019, 649, 128–145. [Google Scholar] [CrossRef] [PubMed]
- Knudsen, M.T.; Meyer-Aurich, A.; Olesen, J.E.; Chirinda, N.; Hermansen, J.E. Carbon Footprints of Crops from Organic and Conventional Arable Crop Rotations-Using A Life Cycle Assessment Approach. J. Clean. Prod. 2014, 64, 609–618. [Google Scholar] [CrossRef]
- Khanali, M.; Movahedi, M.; Yousefi, M.; Jahangiri, S.; Khoshnevisan, B. Investigating Energy Balance and Carbon Footprint in Saffron Cultivation: A Case Study in Iran. J. Clean. Prod. 2016, 115, 162–171. [Google Scholar] [CrossRef]
- Ahsan, F.; Chandio, A.A.; Fang, W. Climate Change Impacts on Cereal Crops Production in Pakistan. Int. J. Clim. Chang. Strateg. Manage. 2020, 12, 257–269. [Google Scholar] [CrossRef]
- Koondhar, M.A.; Aziz, N.; Tan, Z.; Yang, S.; Abbasi, K.R.; Kong, R. Green Growth of Cereal Food Production under the Constraints of Agricultural Carbon Emissions: A New Insights from ARDL and VECM Models. Sustain. Energy Technol. Assess. 2021, 47, 101452. [Google Scholar] [CrossRef]
- Food and Agriculture Organization (FAO). Food Security and Agricultural Mitigation in Developing Countries: Options for Capturing Synergies. 2009. Available online: http://www.fao.org/docrep/012/i1318e/i1318e00.pdf (accessed on 1 June 2021).
- Koondhar, M.A.; Qiu, L.; Li, H.; Liu, W.; He, G. A Nexus between Air Pollution, Energy Consumption and Growth of Economy: A Comparative Study between the USA and China-based on the ARDL Bound Testing Approach. Agric. Econ. 2018, 64, 265–276. [Google Scholar]
- Luo, S.; He, K.; Zhang, J. The More Grain Production, the More Fertilizers Pollution? Empirical Evidence from Major Grain-producing Areas in China. China Rural Econ. 2020, 1, 108–131. [Google Scholar]
- Zaman, K.; Moemen, M.A. Energy Consumption, Carbon Dioxide Emissions and Economic Development: Evaluating Alternative and Plausible Environmental Hypothesis for Sustainable Growth. Renew. Sustain. Energy Rev. 2017, 74, 1119–1130. [Google Scholar] [CrossRef]
- Al-Mulali, U.; Ozturk, I. The Investigation of Environmental Kuznets curve Hypothesis in the Advanced Economies: The Role of Energy Prices. Renew. Sustain. Energy Rev. 2016, 54, 1622–1631. [Google Scholar] [CrossRef]
- Apergis, N.; Ozturk, I. Testing Environmental Kuznets Curve Hypothesis in Asian Countries. Ecol. Indic. 2015, 52, 16–22. [Google Scholar] [CrossRef]
- Alam, M.M.; Murad, M.W.; Noman, A.H.M.; Ozturk, I. Relationships among Carbon Emissions, Economic Growth, Energy Consumption and Population Growth: Testing Environmental Kuznets Curve Hypothesis for Brazil, China, India and Indonesia. Ecol. Indic. 2016, 70, 466–479. [Google Scholar] [CrossRef]
- Ahmad, A.; Zhao, Y.; Shahbaz, M.; Bano, S.; Zhang, Z.; Wang, S.; Liu, Y. Carbon Emissions, Energy Consumption and Economic Growth: An Aggregate and Disaggregate Analysis of the Indian Economy. Energy Policy 2016, 96, 131–143. [Google Scholar] [CrossRef]
- Sarkodie, S.A.; Strezov, V. Assessment of Contribution of Australia’s Energy Production to CO2 Emissions and Environmental Degradation Using Statistical Dynamic Approach. Sci. Total Environ. 2018, 639, 888–899. [Google Scholar] [CrossRef] [PubMed]
- William, R.M.; Gregory, C.U. Are Environmental Kuznets Curves Misleading Us? The Case of CO2 Emissions. Environ. Dev. Econ. 1997, 2, 451–463. [Google Scholar]
- Sui, J.; Lv, W. Crop Production and Agricultural Carbon Emissions: Relationship Diagnosis and Decomposition Analysis. Int. J. Environ. Res. Public Health 2021, 18, 8219. [Google Scholar] [CrossRef]
- Farhani, S.; Ozturk, I. Causal Relationship between CO2 Emissions, Real GDP, Energy Consumption, Financial Development, Trade Openness, and Urbanization in Tunisia. Environ. Sci. Pollut. Res. 2015, 22, 15663–15676. [Google Scholar] [CrossRef] [PubMed]
- Chen, Y.; Li, S.C.; Shui, W. Study on Carbon Footprint of Agro-Ecosystem in Southwest China based on EKC Model. J. Agro-Tech. Econ. 2013, 2, 120–128. [Google Scholar]
- Friedl, B.; Getzner, M. Determinants of CO2 Emissions in a Small Open Economy. Ecol. Econ. 2003, 45, 133–148. [Google Scholar] [CrossRef]
- Chowdhury, R.R.; Moran, E.F. Turning the Curve: A Critical Review of Kuznets Approaches. Appl. Geog. 2012, 32, 3–11. [Google Scholar] [CrossRef]
- Ahmad, N.; Du, L.; Lu, J.; Wang, J.; Li, H.; Muhammad, Z.H. Modelling the CO2 Emissions and Economic Growth in Croatia: Is There Any Environmental Kuznets Curve? Energy 2017, 123, 164–172. [Google Scholar] [CrossRef]
- Dong, K.; Sun, R.; Jiang, H.; Zeng, X. CO2 Emissions, Economic Growth, and the Environmental Kuznets Curve in China: What Roles Can Nuclear Energy and Renewable Energy Play? J. Clean. Prod. 2018, 196, 51–63. [Google Scholar] [CrossRef]
- Zhang, H.; Jiang, Q.; Lv, J. Economic Growth and Food Safety: FKC Hypothesis Test and Policy Implications. Econ. Res. 2019, 11, 180–194. [Google Scholar]
- Cui, X.; Han, M.; Fang, Z. Inverted “U”-shape of EKC with Dynamic Evolution Trend. China Popul. Resour. Environ. 2019, 29, 74–82. [Google Scholar]
- Lei, J.; Su, S.; Yu, W.; Sun, X. Temporal and Spatial Pattern Evolution and Grouping Prediction of Nonpoint Source Pollution of Chemical Fertilizers in China. China J. Eco-Agric. 2020, 28, 1079–1092. [Google Scholar]
- Sarkodie, S.A.; Strezov, V. Empirical Study of the Environmental Kuznets Curve and Environmental Sustainability Curve Hypothesis for Australia, China, Ghana, and USA. J. Clean. Prod. 2018, 201, 98–110. [Google Scholar] [CrossRef]
- Yan, Q.; Chen, Y. The Enlightenment of Chinese Agricultural EKC in Rural Revitalization. J. Agri. Sci. 2019, 40, 77–82. [Google Scholar]
- Shang, J.; Li, X.; Deng, Y. Analysis of the Relationship between Agricultural Economic Growth and Agricultural Nonpoint Source Pollution based on EKC: Taking Heilongjiang Provinceas An Example. Ecol. Econ. 2017, 33, 157–160. [Google Scholar]
- Yan, M.; Ma, L.; Qiao, J. Discussion on the Relationship between Agricultural Economic Growth and Agricultural Nonpoint Source Pollution in Henan Province: Empirical Analysis based on EKC Theory. J. Henan Univ. 2021, 51, 12–19. [Google Scholar]
- Tapio, P. Towards A Theory of Decoupling: Degrees of Decoupling in the EU and the Case of Road Traffic in Finland between 1970 and 2001. Transp. Policy 2005, 12, 137–151. [Google Scholar] [CrossRef]
- Vehmas, J.V.; Luukkanen, J.; Kaivo-Oja, J. Linking Analyses and Environmental Kuznets Curves for Aggregated Material Flows in the EU. J. Clean. Prod. 2007, 15, 1662–1673. [Google Scholar] [CrossRef]
- Chen, H.; Wang, H.; Qin, S. Analysis of Decoupling Effect and Driving Factors of Agricultural Carbon Emission: A Case Study of Heilongjiang Province. Sci. Technol. Manag. Res. 2019, 17, 247–252. [Google Scholar]
- United Nations Environment Programme (UNEP). Decoupling Natural Resource Use and Environmental Impacts from Economic Growth; A Report of the Working Group on Decoupling to the International Resource Panel; UNEP: Nairobi, Kenya, 2011; pp. 1–174. [Google Scholar]
- Lv, D.; Wang, R.; Zhang, Y. Sustainability Assessment based on Integrating EKC with Decoupling: Empirical Evidence from China. Sustainability 2021, 13, 655. [Google Scholar] [CrossRef]
- Xia, Y.; Zhong, M. Relationship between EKC Hypothesis and the Decoupling of Environmental Pollution from Economic Development: Based on Decoupling Partition of China Prefecture-Level Cities. China Popul. Resour. Environ. 2016, 26, 8–16. [Google Scholar]
- Tian, Y.; Chen, C. Research on the Compensation Mechanism of Agricultural Carbon Emission Reduction in China from the Perspective of Combination of Market and Government. Issues Agric. 2021, 5, 121–136. [Google Scholar]
- Tian, Y.; Zhang, J. Differentiation of Net Carbon Effect of Agricultural Production in China. J. Nat. Resour. 2013, 8, 1298–1309. [Google Scholar]
- Wu, X.; Zhang, J.; Cheng, L.; Tian, Y. Agricultural Carbon Reduction Potential and Its Spatial Correlation in China: A Spatial Durbin Model Based on Spatial Weight Matrix. China Popul. Resour. Environ. 2015, 6, 53–61. [Google Scholar]
- Li, B.; Zhang, J.; Li, H. Research on Spatial-Temporal Characteristics and Affecting Factors Decomposition of Agricultural Carbon Emissions in China. China Popul. Resour. Environ. 2011, 21, 80–86. [Google Scholar]
- Li, N.; Wei, C.; Zhang, H.; Cai, C.; Song, M.; Miao, J. Drivers of the National and Regional Crop Production-Derived Greenhouse Gas Emissions in China. J. Clean. Prod. 2020, 257, 120503. [Google Scholar] [CrossRef]
- David, I.S. The Rise and Fall of the EnvironmentalKuznets Curve. World Dev. 2004, 32, 1419–1439. [Google Scholar]
- Selden, T.M.; Song, D.Q. Environmental Quality and Development: Is there a Kuznets Curve for Air Pollution Emissions? J. Environ. Econ. Manag. 1994, 27, 147–162. [Google Scholar] [CrossRef]
- European Environment Agency. Annual European Union Greenhouse Gas Inventory 1990–2010 and Inventory Report 2012 Submission to the UNFCCC Secretariat; EEA-European Environment Agency: Copenhagen, Denmark, 2012; ISSN 1725–2237. [Google Scholar]
- Silvia, C.; Roberto, E. Is There A Long-Term Relationship between Agricultural GHG Emissions and Productivity Growth? A Dynamic Panel Data Approach. Environ. Resour. Econ. 2014, 58, 273–302. [Google Scholar]
- Zong, Y.; Cui, H. How to Embed Environmenral Regulation into Agricultural Policy: Experience of EU’S Cross-Compliance System. World Agric. 2022, 1, 15–23. [Google Scholar]
- Chen, R.; Jiang, Z. Transverse Space Ecological Compensation of Low-Carbon Agriculture in China. China Popul. Resour. Environ. 2018, 28, 87–97. [Google Scholar]
- Wu, H.; He, Y.; Huang, H.; Chen, W. Spatial Effect and Influencing Factors of China’s Agricultural Carbon Compensation Rate based on Spatial Durbin model. J. Agro-Tech. Econ. 2020, 3, 110–123. [Google Scholar]
- Zhu, K.; Lu, Y.; Jin, L. Rural Household’s Willingness to Participate in Market-based Eco-Compensation Programs and its Determinant Factors. Chin. J. Agric. Resour. Reg. Plan. 2021, 42, 192–199. [Google Scholar]


Publisher’s Note: MDPI stays neutral with regard to jurisdictional claims in published maps and institutional affiliations. |
© 2022 by the authors. Licensee MDPI, Basel, Switzerland. This article is an open access article distributed under the terms and conditions of the Creative Commons Attribution (CC BY) license (https://creativecommons.org/licenses/by/4.0/).