Abstract
A total of 40% of the world’s energy produced is utilized to maintain thermal comfort for the occupants of the building. Governments are taking measures collectively to regulate energy efficient buildings to reduce carbon emissions globally. Windows account for more than half of total energy losses in the buildings. The employment of energy efficient glazing in the construction industry is not common in Australia. This paper investigates several types of commercially available windows and their effectiveness in the hot and humid climate of Darwin. Although extensive literature is available for cold regions, these windows have not been studied in hot and humid climates such as the climate in Darwin. Building cooling loads of an academic building were calculated using Autodesk Revit Architecture and Carrier HAP. Double glazed variants offered approximately a 5% reduction in cooling loads and had a payback period of nearly 7 to 9 years, depending on the type of gas used to fill the pane cavity. The results indicate that triple glazed, or aerogel-based windows will provide about 11–12 % of energy saving in cooling loads. These can be a viable alternative and have a payback period of 11 years, while their average service life expectancy is 30 years. It was found that the feasibility of efficient glazing depends on market price, building usage, and energy efficiency of an overall building envelope.
1. Introduction
With the increase in the population, more buildings have been constructed, leading to a rise in cooling/heating loads. It is estimated that nearly 90% of a human’s life is spent in an indoor environment. To achieve a level of thermal comfort, each building has its own thermal load based on specific parameters. The electricity is the primary power source that maintains this thermal comfort by the continuous extraction or supply of heat in the conditioned space. The construction industry produces hundreds of new buildings every day, which in turn, are raising energy demands exponentially. Lu and Lai found that almost one-third of all the energy generated is consumed by buildings [1]. Pérez-Lombard et. al. and Alghoul et. al. found a range from 20% to 40%, with higher consumptions in developed countries [2,3]. For example, buildings consume 40% of energy and cause 36% of greenhouse gas emissions in Europe [4].
This significant energy consumption due to achieve thermal comfort has attracted the attention of governments. In particular, the energy crisis in the 1970s that triggered an increase in the cost of oil and energy proved to be the first milestone towards energy conservation considerations [5]. A reduction in energy consumption and a shift towards clean energy is one of two of important strategies to achieve environmental and health goals [6]. The reduction in cooling/heating loads can help to achieve these goals.
1.1. Energy Regulating Standards and Systems
Governments worldwide are legislating on the construction industry to support and standardize energy efficient buildings through regulating bodies to reduce their carbon footprint with strict time deadlines. The European Union (EU) is taking measures to enhance the energy efficiency of buildings and to reduce the carbon footprint and has set targets under the Climate and Energy Package (CEP), but many leading countries, including Germany, Austria, and France have been shown to be less serious; there is a less than a 1% probability of achieving the set targets in these countries [7].
Australia is bound to introduce new policies that should help to limit the annual global climate change below 2 °C compared to pre-industrial levels according to the Paris Agreement from 2016. The National Australian Built Environment Rating System (NABERS) is a nationwide rating system that assesses buildings based on their environmental performances such as energy efficiency, waste production, and water consumption. NABERS compares a building with other energy-efficient buildings located in similar climatic regions and then issues the energy efficiency rating for that building. The rating ranges from one to six stars, with number six indicating the highest level of energy performance while one indicates the lowest energy efficient performance [8]. In the same way, the National House Energy Rating Scheme (NatHERS) is a government institution that rates residential buildings on a scale of one to ten based on their heating and cooling requirements [9]. The Windows Energy Rating Scheme (WERS) is responsible for providing the energy rating to windows while following the Australian Fenestration and Rating Council (AFRC). The energy ratings provided by WERS are the third party certified to AFRC requirements and are in perfect accordance with the National Construction Code [10].
1.2. Thermal Comfort in Buildings
Thermal comfort can be defined according to the ANSI/ASHRAE standard 55 as “the peace of mind with the prevalent thermal conditions in a conditioned space” [11]. The air temperature, relative humidity, clothing, metabolic activity rate, mean radiant temperature, and air velocity are considered as the main factors that define thermal comfort. The enormous amount of energy is consumed by buildings to deliver thermal comfort in buildings [12]. Thermal comfort is viewed as the value of the parameters mentioned above, where at least 80% of the occupants show satisfaction with the environmental conditions inside the conditioned space. Air movement provides better control over thermal comfort even when the temperatures are out of the thermal comfort range.
1.3. Active vs. Passive Methods
Both the active and passive methods can be opted to achieve thermal comfort in buildings. Active processes utilize power or are directly involved in some manner that helps to generate heat in a heating-dominated environment and enables the extraction of heat in a cooling-dominated climate, whereas the passive methods include measures that are not directly involved in the generation of heat or cooling, but the implementation of these methods helps to reduce thermal loads. Due to their effectiveness, these have attracted significant attraction and are considered in our research study.
Some of the common passive methods include indirect evaporative cooling, ventilation, night flushing, radiative cooling, and earth coupling, etc. Passive techniques for building construction have proven to be highly cost-effective solutions that save time and money. Some primary passive techniques include window type changes, cool paint technology, shading systems, phase change materials (PCMs), and thermal mass insulation, etc. The advancements in metallurgical science have introduced smart materials that exhibit exceptional insulation properties and can help to achieve zero or near zero-energy consumptions for thermal comfort [13].
An additional advantage of the passive methods is that these methods never cause adverse thermal comfort levels; instead, they just help to maintain the desirable comfort conditions with no or minimal energy requirements. A survey-based study found that almost half of the occupants in a building were not satisfied with the prevalent thermal conditions [14]. It has been found that the facilities are excessively heated or cooled to the other extreme of thermal comfort. This makes most people feel uncomfortable and increases the energy usage or thermal load [15]. It has been observed that providing some relaxation in the set point temperature in either the hot or cold direction can help to save energy by 10% per degree Celsius [16]. Higher the relaxation means more energy saving.
Tropical climates mainly have cooling requirements, which are required almost throughout the year. The Building Code of Australia (BCA) has introduced measures that can help improve a building’s energy efficiency. This includes developing a building rating system designed by the National House Energy Rating Scheme. In Australia, the minimum 5-star energy requirements were introduced in 2005 and they were later improved to a minimum 6-star energy rating in 2011 and were implemented in the greater Melbourne area.
Since most of the research has been conducted for hot, arid, and cold regions, this study focuses on the energy conservation in tropical climate areas. Therefore, the study is primarily concerned with cooling loads only. The primary focus is on present construction practices and the glazing types that are analyzed are market available glazing types only. The research focuses on the practical considerations when choosing glazing in terms of thermal performance and costs involved.
The approach consists of computer-based model simulations and considers various retrofits to analyze the effects on cooling loads. Climate considerations and building dimensions and orientation are also considered along with the glazing characteristics while calculating the cooling loads. The economic feasibilities of glazing options are performed using payback period calculations.
1.4. Research Objectives
The study covers the performance of commercially available windows in a hot and humid climate such as Darwin. Many methods including adding a film, coating, or a shutter have been developed to improve the thermal resistance of window units. The energy performance of commercially available glazing is analyzed under the local climate conditions. A variety of glazing types are available with a diverse number of panes, differently filled gaps, and gases in the market.
The objective of this research is to analyze the efficiencies of commercially available windows by systematically evaluating the performance of various glass types, filled insulating gases, number of glazing, and spacing between the glazing. The economic perspectives of energy efficient buildings have been ignored in hot climates so far [17,18]. The analysis focuses on the economic efficiency of assorted options and identifies more effective and economically efficient combinations of glazing parameters. The analysis also covers the impacts of local climate and building enclosures considering the glazing characteristics using heat transfer coefficients and solar heat gain coefficients.
The paper focuses on the construction practices in Darwin that are dominated by single glazed 6 mm windows in most buildings. This engineering practice has persisted in the absence of costly but energy efficient glazing types available in the market. The problem involves several aspects, including the typical climate conditions, market availability, and costs involved. The research provides a solution to this applied interdisciplinary engineering issue by covering construction practices, heating ventilation and air-conditioning (HVAC) requirements, and engineering economics.
2. Thermal Loads
Compared to other building components, the insulating properties of windows are quite weak [19]. These properties include the leakage points from which the internal heating/cooling of the building is lost. However, the thermal performance of a window is subjected to local climatic conditions, the thermal properties of the building envelope, and the thermal properties of the windows itself that are based on the components and manufacturing of the windows. The following sections provide a clear overview of these factors.
2.1. Climate and Building Enclosure Considerations
The energy loading requirement of a building is primarily driven by the local weather conditions which are defined by the temperature, humidity, and sun exposure. A building’s enclosure defines how a much a building is equipped to handle the weather severity. A building’s orientation, dimensions, construction material, and window-to-wall ratio (WWR) are the main aspects of the building enclosure that control the thermal performance of a building. The following sections provide a further explanation of these factors.
2.1.1. Weather Conditions
The insulating properties of windows become important in extreme weather conditions. Maintaining thermal comfort in a building demands more energy if the building does not demonstrate good insulating behavior.
2.1.2. Sun Path and Seasonal Arcs
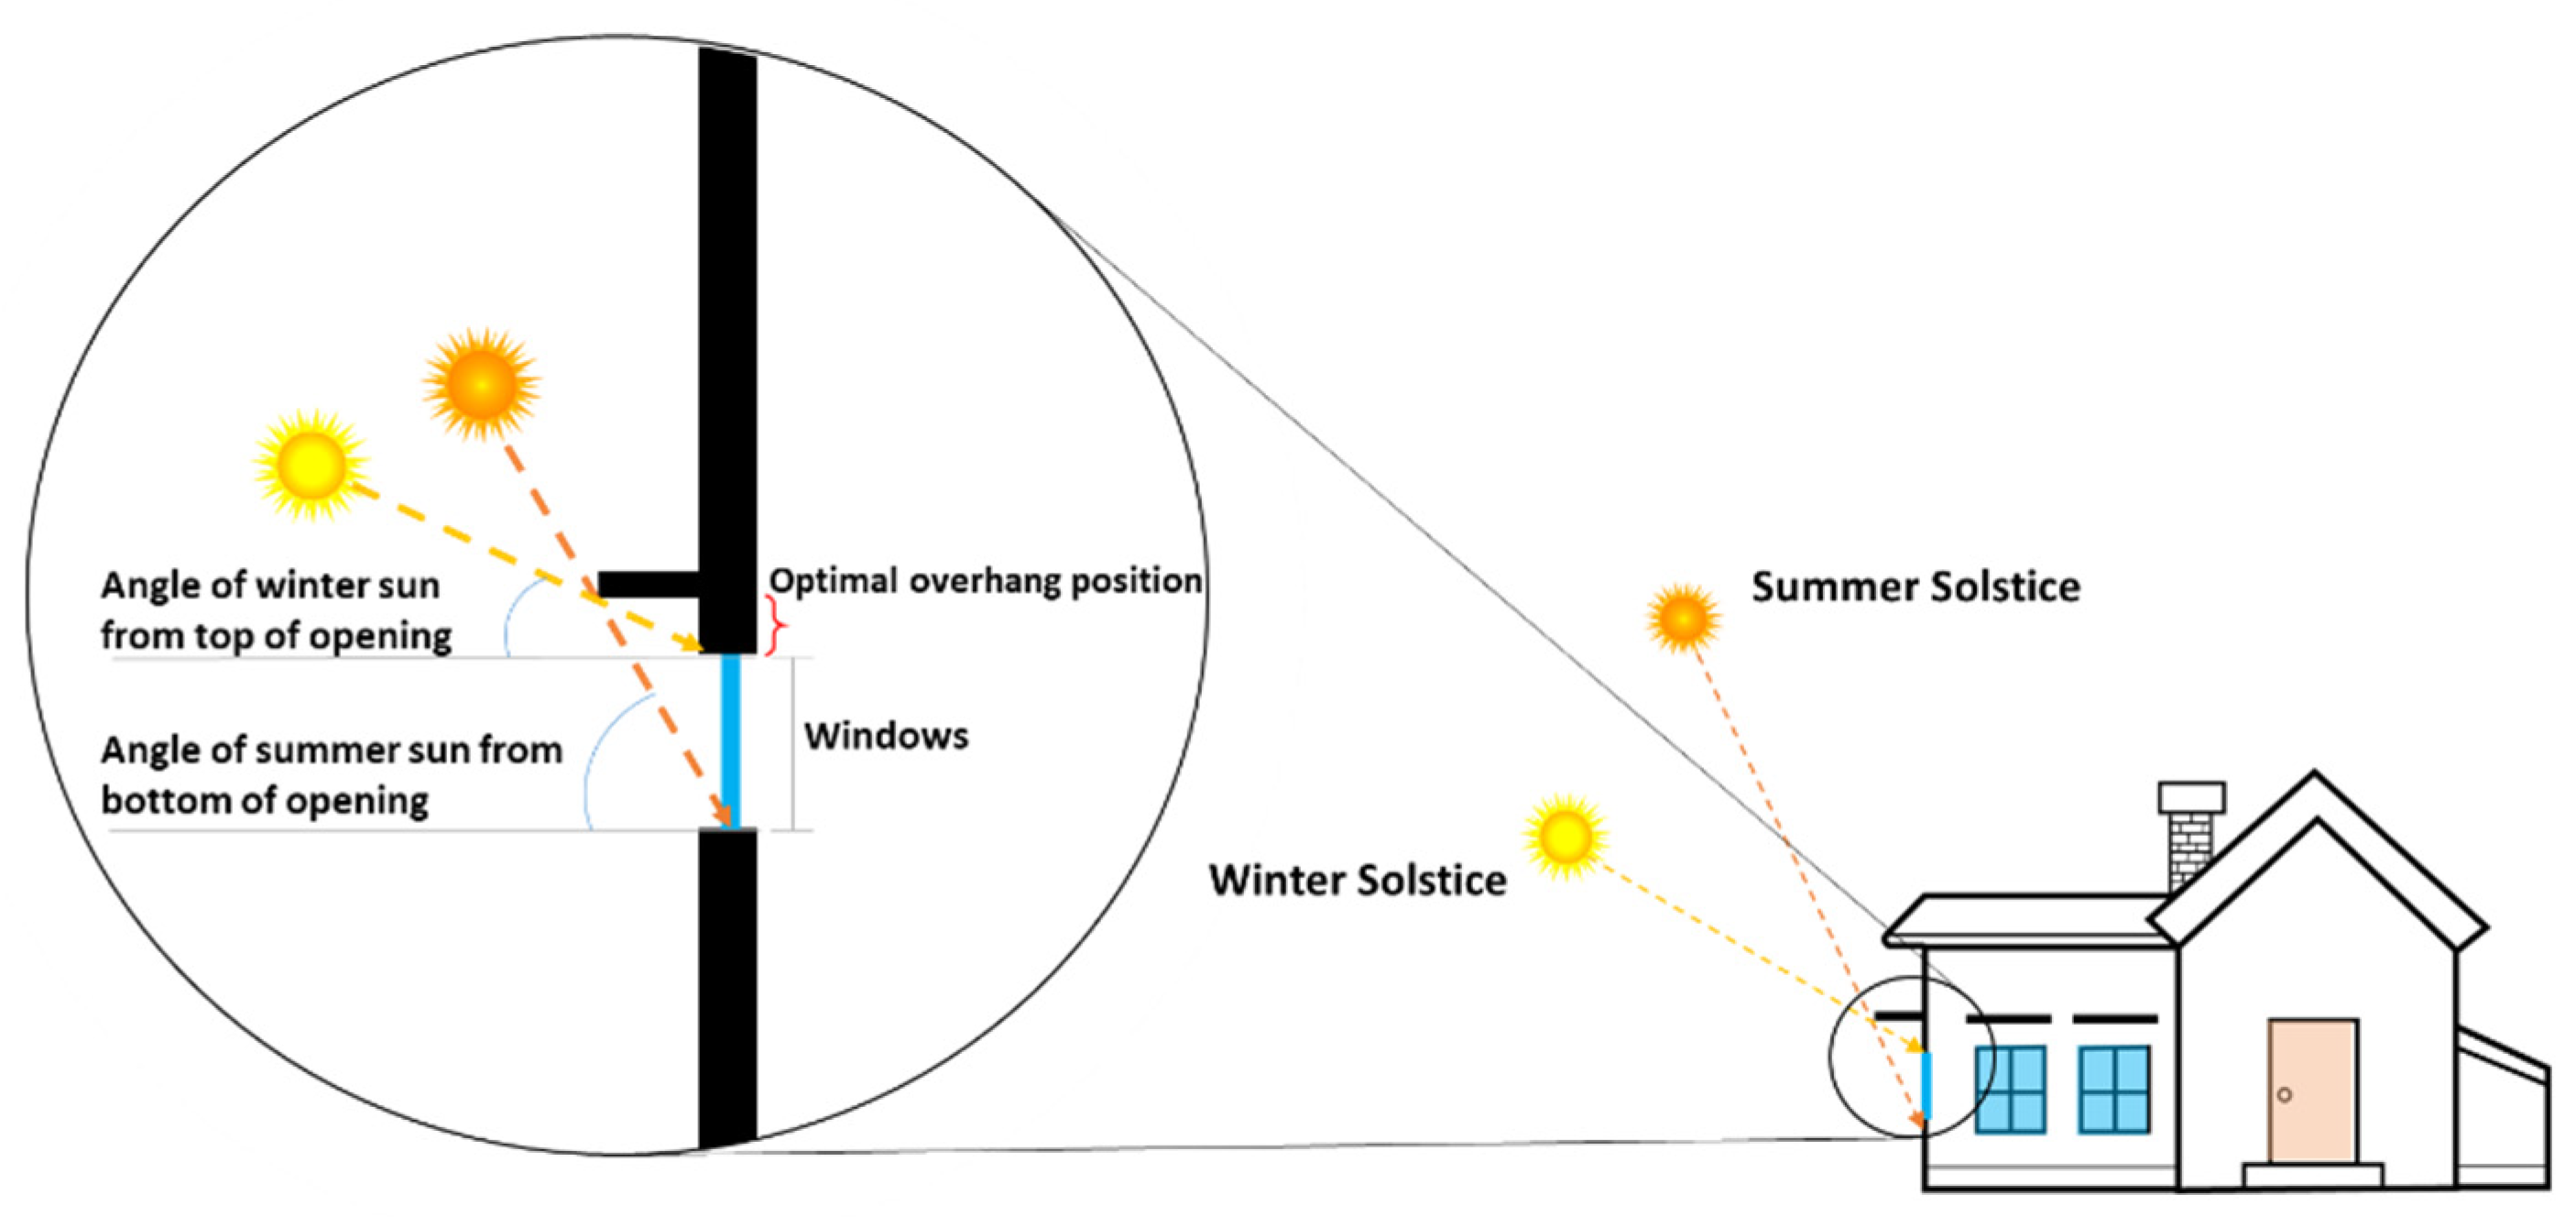
The sun path refers to the seasonal path of the sun over the building. It is commonly also known as the day arc or seasonal arc. The arc formed by the sun’s movement over the building is entirely dependent on the latitude location of the building. This is a critical factor in determining the overall energy performance of the building. The radiation entering the building changes the demand for heating and cooling, and that is why it needs to be rectified depending on the time of the year. Some areas receive more radiation in the winter than in the summer and vice versa. This location-dependent variable helps determine the ideal location for windows and facade structures that receive minimal radiation in the summer and maximum radiation in the winter. This helps to reduce cooling loads in summer as well as to reduce the heating requirements in winter. Figure 1 shows how the sun’s angle impacts the shadows and radiation at contrasting times of the year.
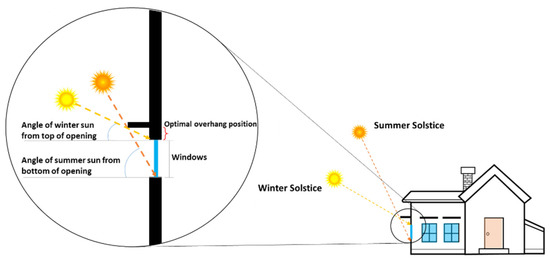
Figure 1.
Effects of variation in sun path (winter vs. summer).
2.1.3. A Building’s Orientation
A building’s orientation plays a vital role in energy requirements [20]. A properly oriented building can save a significant amount of thermal energy. The orientation helps to expose the windows to sun to ensure a selective filter for thermal gain according to the season of the year [21].
2.1.4. A Building’s Material and Dimensions
The thermal properties of a building envelope depend on the thermal performance of the construction material as well as on the internal dimensions of the rooms. The use of an energy efficient material can save the thermal loads, whereas different ceiling heights, buffer zones, and the floor level play a critical role in determining the thermal load requirements.
2.1.5. Window to Wall Ratio (WWR)
The window to wall ratio (WWR) plays a vital role in improving the building’s design in terms of energy requirements. It has been observed that the higher the percentage, the higher the value of the cooling loads [18,22,23,24].
2.2. Heat Transfer Parametrs
While designing the window, the most emphasized parameters are the U−value, the solar eat gain coefficient (SHGC), visible transmittance (VT), and air leakage. These values vary over a wide range and are entirely dependent on the type of window. However, the most common desire is to install a widow with low values of SHGC and U−value. It should also have an acceptable level of visible transmittance (VT).
For the analysis presented here, the air leakage magnitude is negligible. However, the following need to be considered when substantial amounts of air leakage are present in the window structure:
- U−value;
- Solar heat gain coefficient (SHGC);
- Air infiltration/leakage.
2.2.1. Heat Transfer Coefficients (U−Value)
The U−value helps to evaluate the thermal insulation performance of windows [25]. This parameter is calculated/estimated through numerical modeling [26] until recently when ISO 19467 developed the guidelines to measure the parameters through an experimental setup [27]. The U−value of a window is affected by glazing as well as the frame conduction properties [28,29]. The lower the mean U−value, the better the insulation performance of a window.
2.2.2. Solar Heat Gain Coefficient (SHGC)
The solar heat Gain Coefficient (SHGC) measures the capability of a windows to let solar radiation pass through the windows. According to ISO 15099:2003, SHGC can be defined as the “total solar energy transmittance” that can be defined as the ratio of solar heat gained over the incident solar heat [30]. A glass is characterized by its Solar Heat Gain Coefficient (SHGC) value, ranging from 0 to 1. The lower the value of SHGC, the greater the glass’s effectiveness in blocking excess heat from entering the building [31]. A lower value is desirable in hot climates, like the area under study, to increase the blocking of solar heat [27].
Visible transmittance (VT) is another property of window glazing which only focuses on the transmittance of the visible light spectrum and is used for the visual performance of the windows. Solar shadings (SC) have been used in the past for the same purpose as SHGC for buildings, filtering out excess radiation, and providing extra leverage to reduce cooling loads in a facility [32,33]. However, for our study, SHGC values were used for the analysis.
Another property associated with visible transmittance is the daylight factor. Daylight factor is a measure that expresses the potential illuminance inside a room in the worst possible scenario, under overcast sky conditions when there is less exterior daylight [34]. Smart windows adjust transmittance when required in daylight. This results in color rendering. Aste et al. [35] found that advanced smart glazing produces color rendition especially when these are brought to low transmittance rate.
2.2.3. Air Leakage
Although air leakage can change the thermal performance of window, reducing the air leakage to virtually zero can be achieved practically in most window installations. Even if any negligible magnitude is there, the air leakage is commonly ruled out from the analysis. That is why no air leakage was assumed for analysis.
The U−value and SHGC are main parameters that control the thermal performance of a window. The U−value is characterized by the difference of room temperature and the ambient temperature in both the summer and winter seasons, whereas SHGC plays a significant role in the summer and depends on solar radiations that incident directly on the windows [36]. That is why role of SHGC is significant in the tropical climate of Darwin.
2.3. Glazing Components
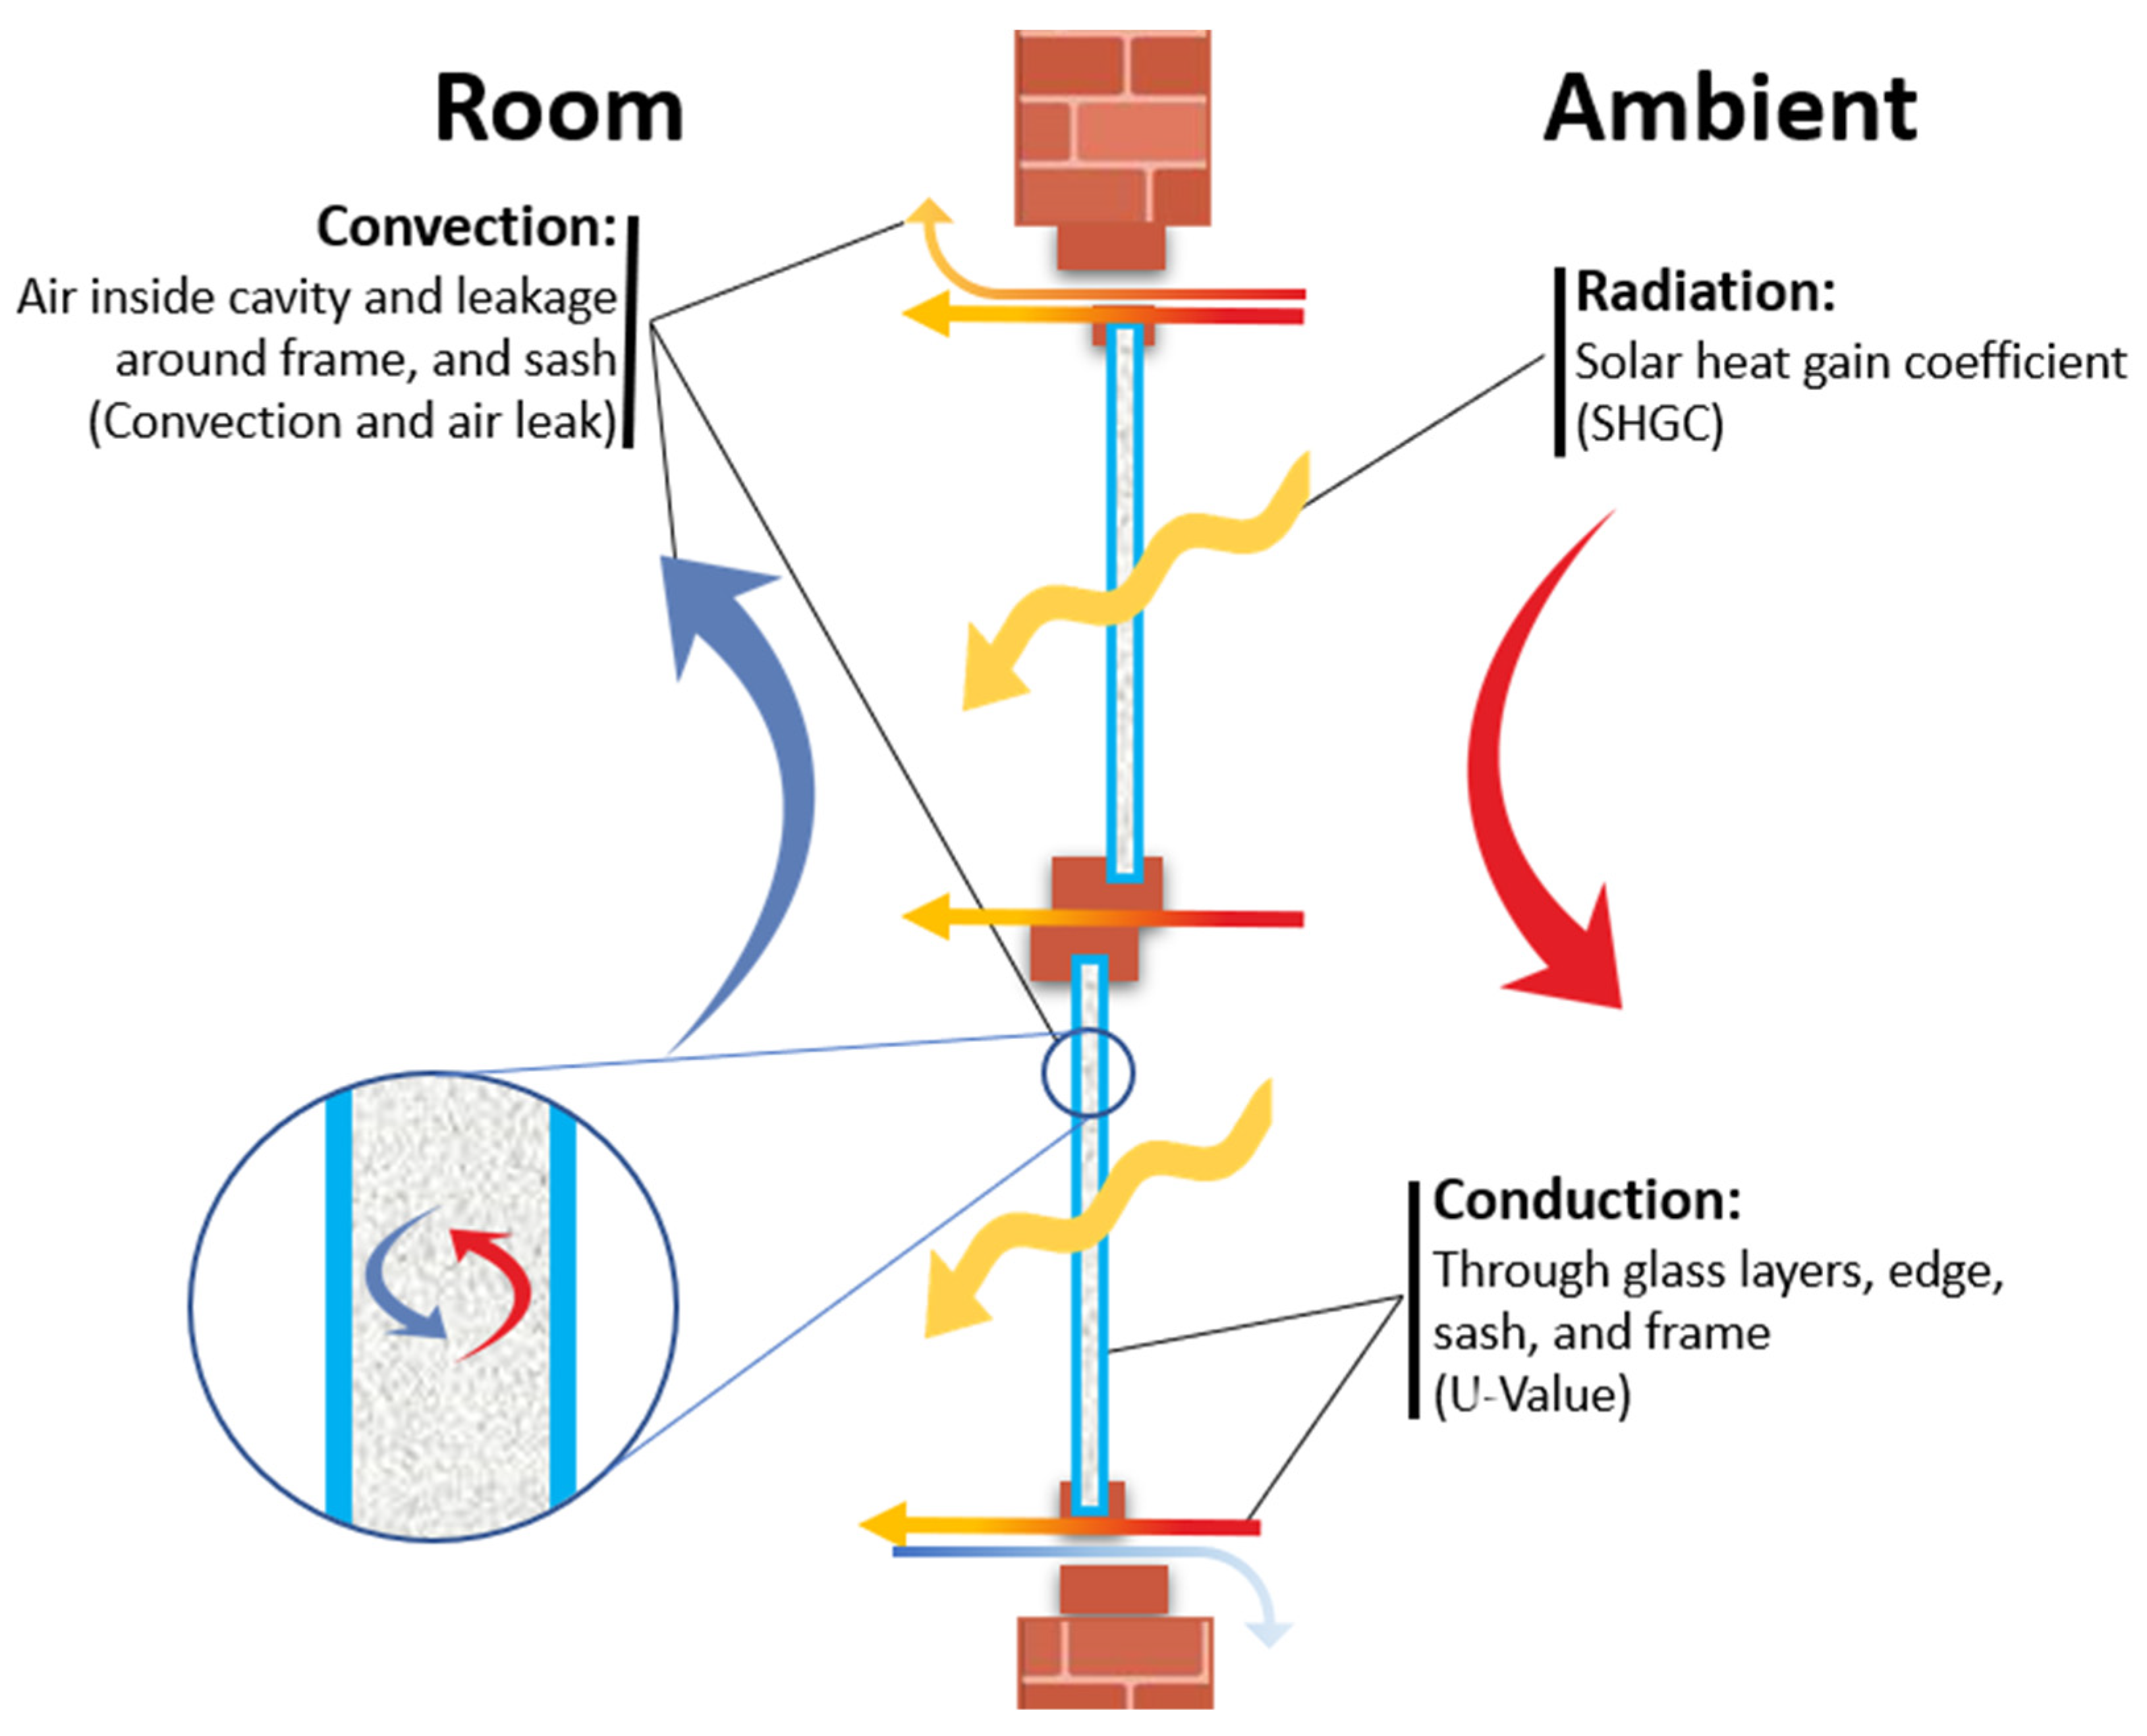
Where windows help in using the daylight to reduce additional lighting requirements inside a building, they also increase the solar heat gain [37]. It is estimated that almost 60% of the heat transfer occurs through glass structures in a building [6,25,38]. To enhance the visual comfort of a building, the windows exhibit a lower insulating performance compared to other components [5]. Windows involve all three modes of heat transfer, i.e., conduction, convection, and radiation. The U−value of windows considers all three methods, representing an overall heat transfer coefficient of the window. Figure 2 shows how all three modes take place through a window. Conduction takes place through the glass panes and the window frame. Convection is present in between the glass layers or on top of glass pane, while radiation occurs through every element of the window.

Figure 2.
Heat loss mechanism demonstrated in a double-glazed window.
The physical parameters of window components determine the thermal response of a window [39]. Any modifications in the design of the window modify one or more of these heat transfer modes and this is turn affects the overall U−value of the window, e.g., adding an extra glass layer reduces heat transfer by conduction and a drop is observed in the overall U−value of the window. Bitaab et. Al. [40] found that increasing the air gap from 12 to 21 mm results in a 5.1% less energy loss through the window. Similar advantages are associated with glass thickness, the number of layers, and the insulation material used in the cavity between the glass layers. The following glazing types/variations are common:
- Glass thickness;
- Numbers of layers;
- Interspace gap;
- Filled gas/airspace insulation medium.
3. Methodology
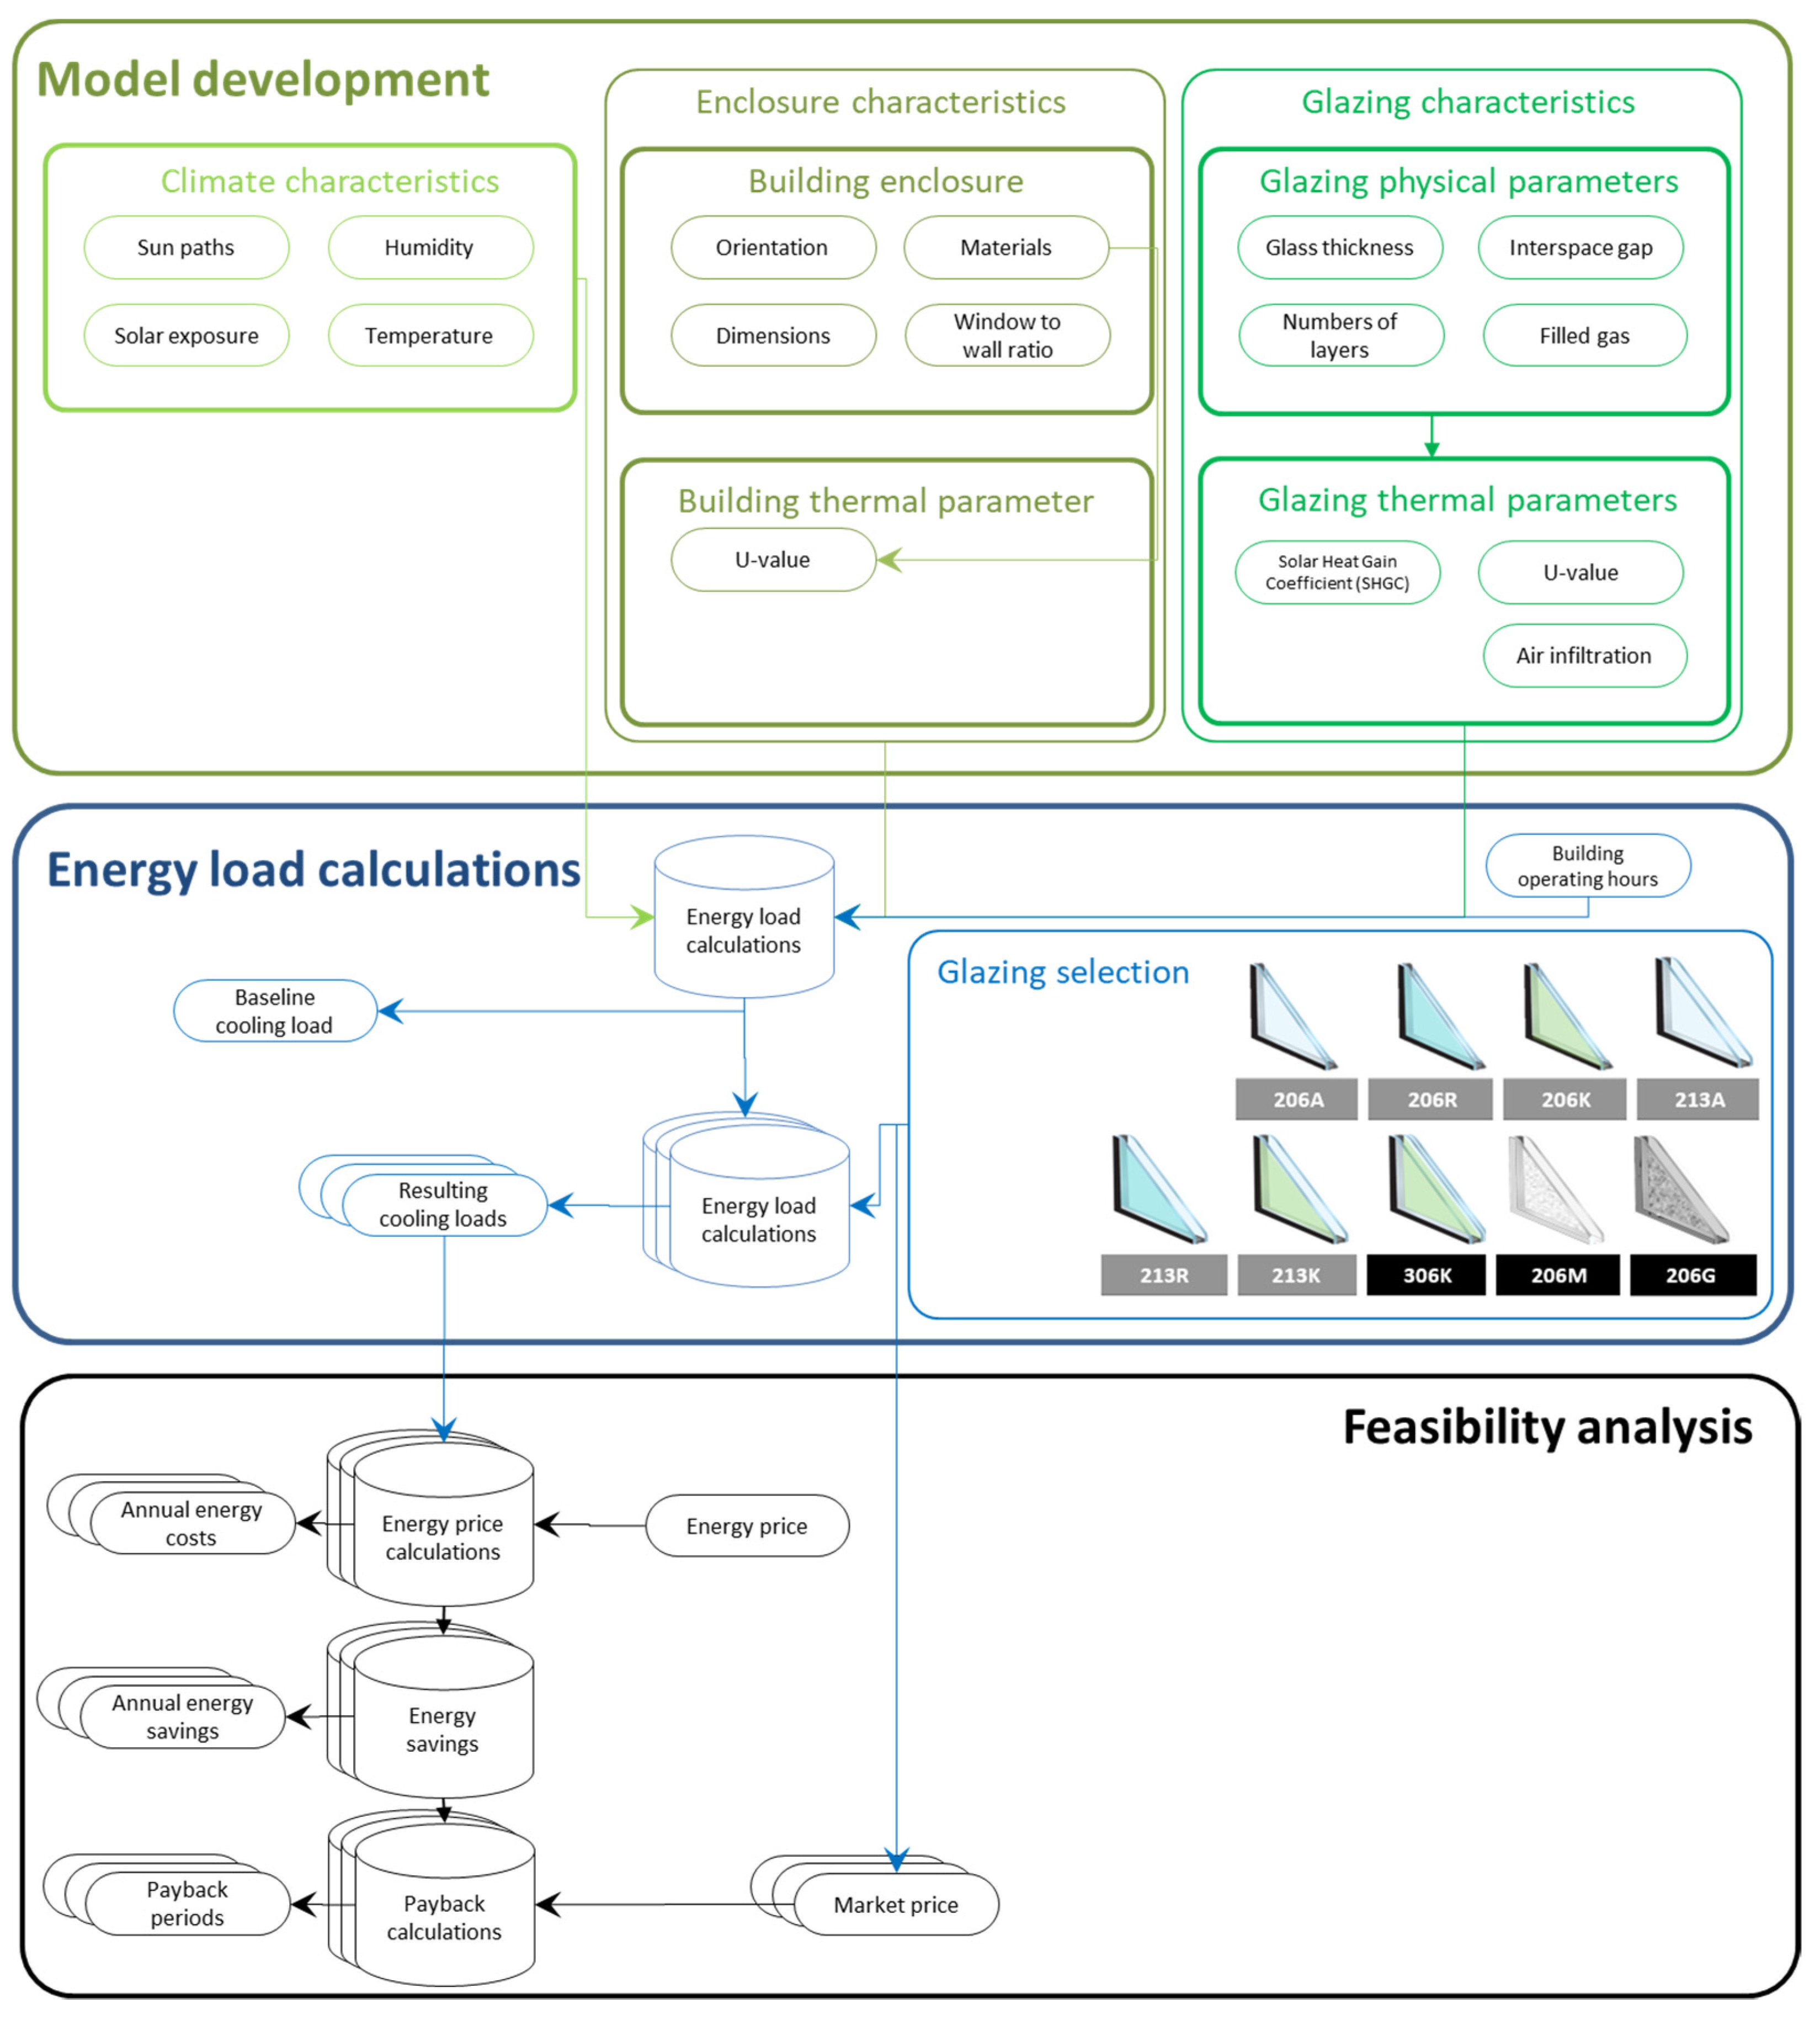
Based on above-mentioned literature, a systematic methodology was developed to analyze the thermal performance of locally available commercial glazing types as shown in Figure 3.
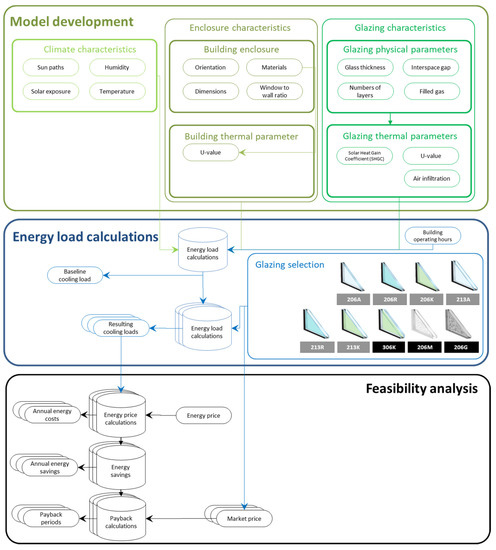
Figure 3.
Methodology adopted for the feasibility calculations of commercially available glazing types.
3.1. Climate and Building Enclosure
The research focused on Darwin, which is the capital city of the Northern Territory. The city is in a tropical climate. The Menzies building in Charles Darwin University was selected for the analysis due to the fact it has curtain walls on three sides with a large window to wall ratio (WWR).
Darwin has two distinct dry and wet seasons in a year. The dry season starts in April and lasts till September, while the wet season starts in late November and ends around April, depending on the monsoon rainfall pattern. During the wet season, an immense increase in temperature and humidity is observed, making the climate unbearable and increasing the demand for air-conditioning to maintain thermal comfort. The dry season also demands cooling loads with lower requirements at nighttime due to the cooling effects of air currents. These areas are also known as cooling-dominated areas when referring to their thermal load requirements.
3.1.1. Building Enclosure
The selected building is in Casuarina, Darwin. This building is a research and development office building dedicated to medicinal research. Most of the rooms serve the purpose of offices and involve sedentary activities. The structure comprises two floors, the ground floor and the first floor. The information of the building is tabulated below in Table 1.

Table 1.
Description of Building Parameters.
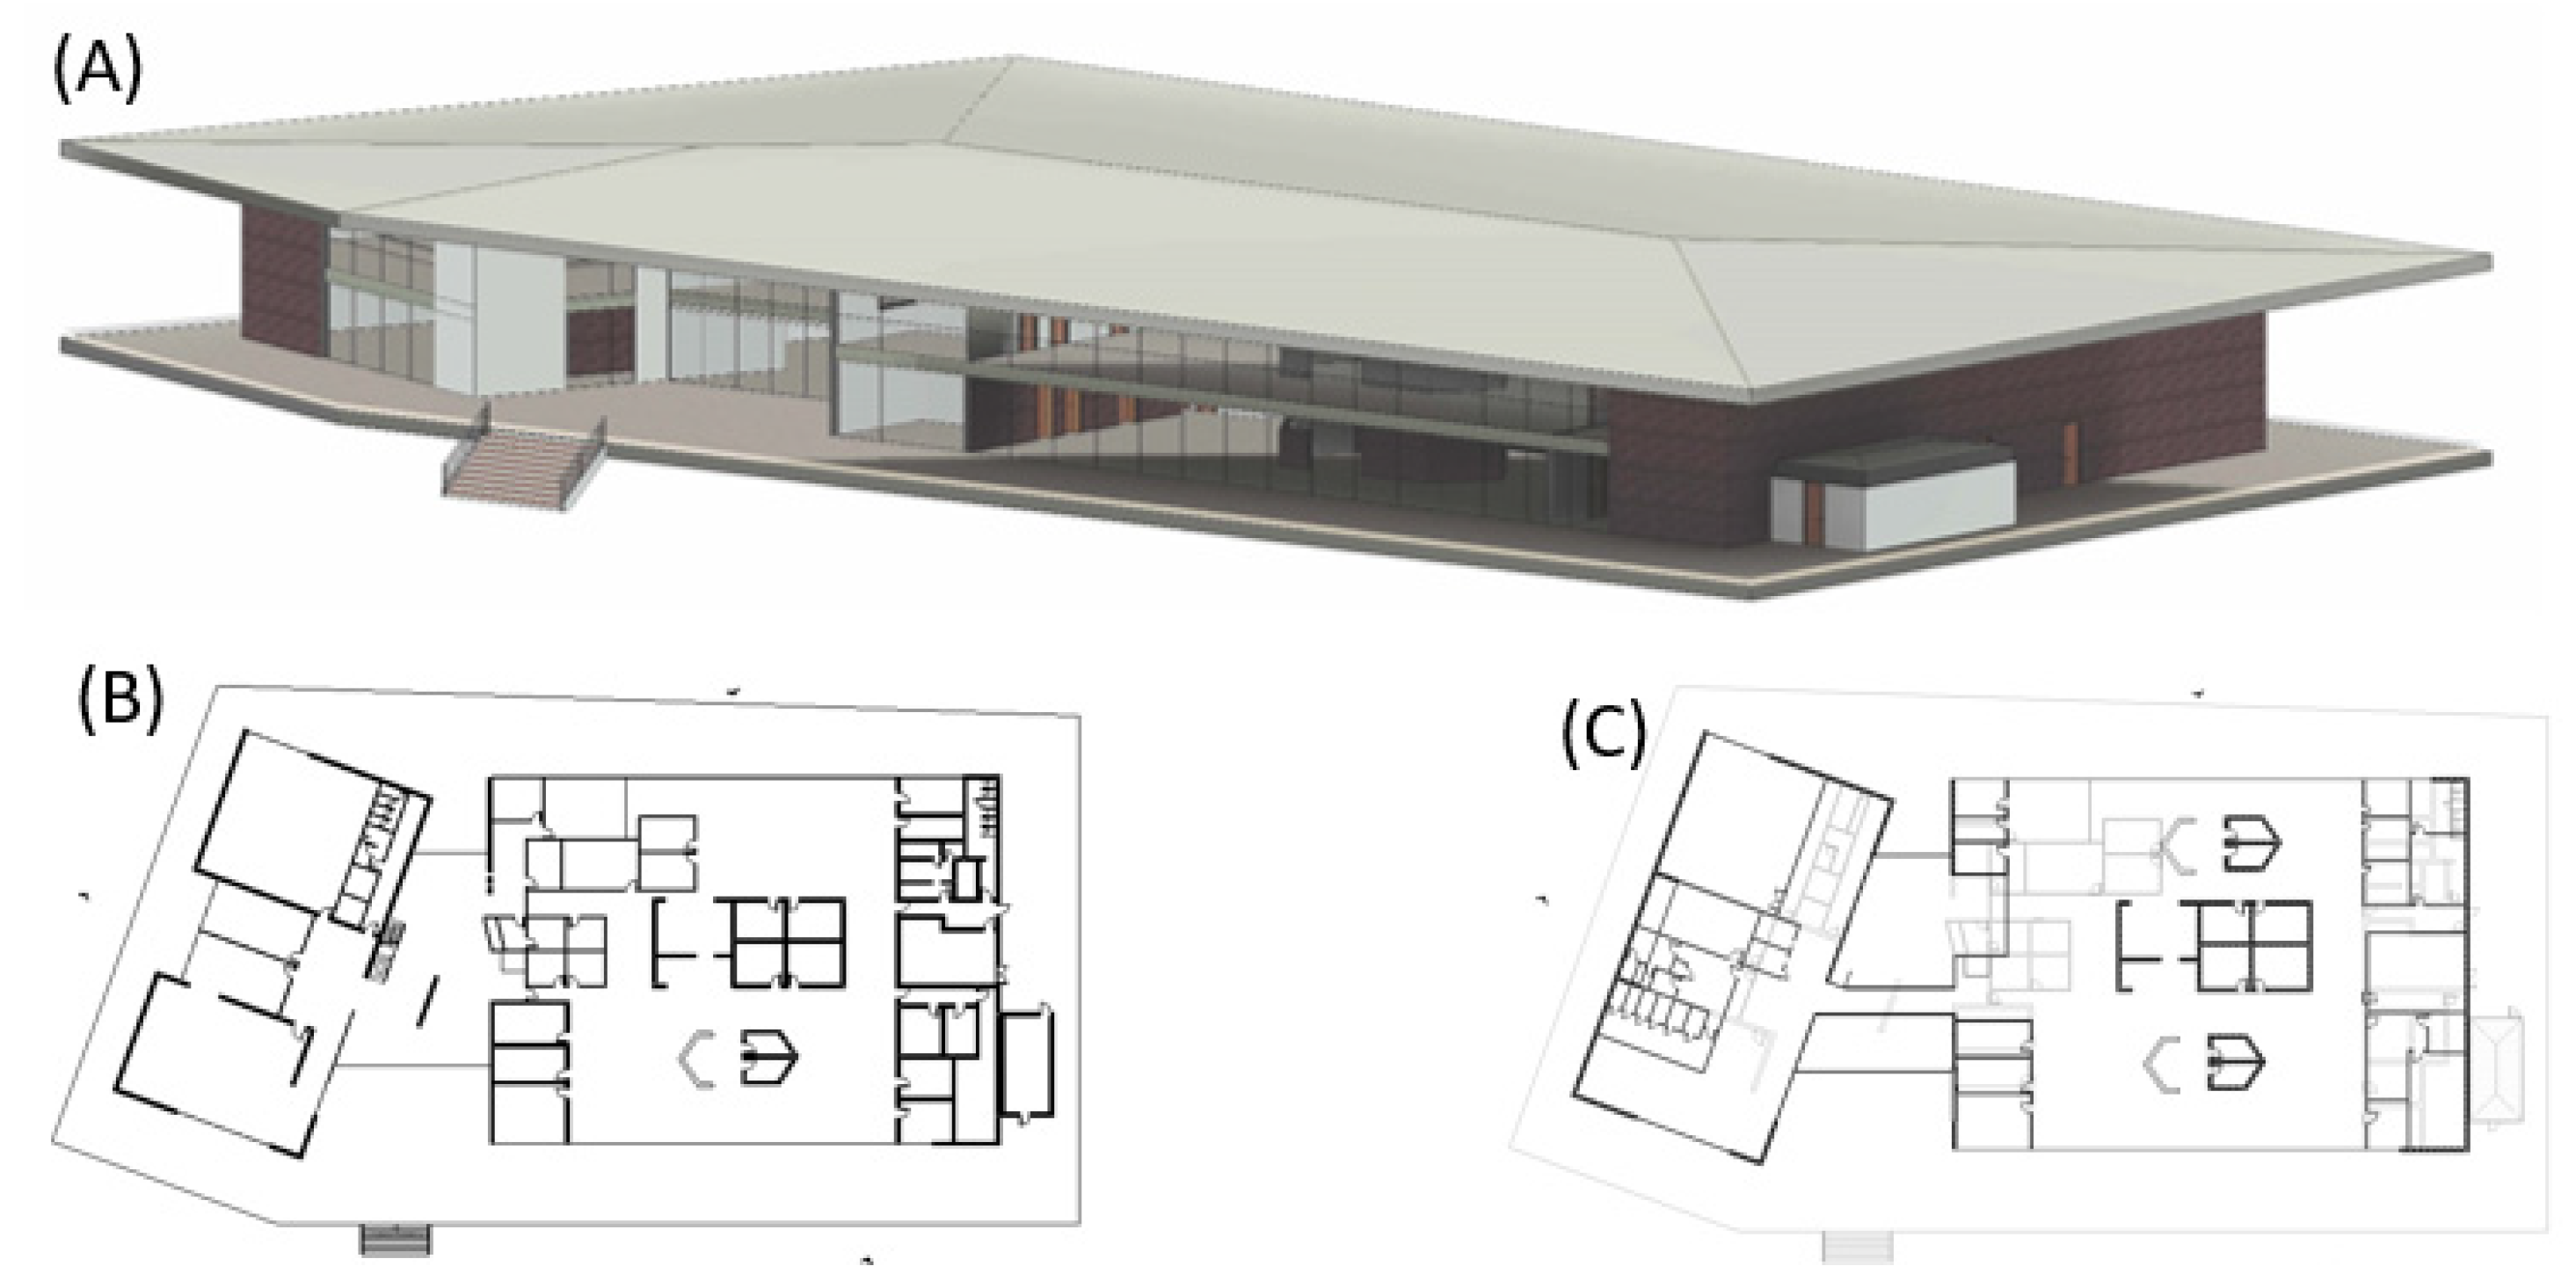
The Revit Architecture mode was used to develop a 3D model of the study building. The building materials were selected from the pre-built materials available within the Revit families. Figure 4 shows the 3D view of the selected building, the ground floor plan, and the first floor. The curtain wall is visible, which was the focus of our analysis.

Figure 4.
Autodesk Revit model showing the maximum possible features; 3D view of the study building in (A), Zone-1 the ground floor plan in (B), and Zone-2 the first-floor plan in (C).
The heat transfer coefficients of some primary building components are shown in Table 2.
Table 2.
U−values of different building components used in the study building.
3.1.2. Climate
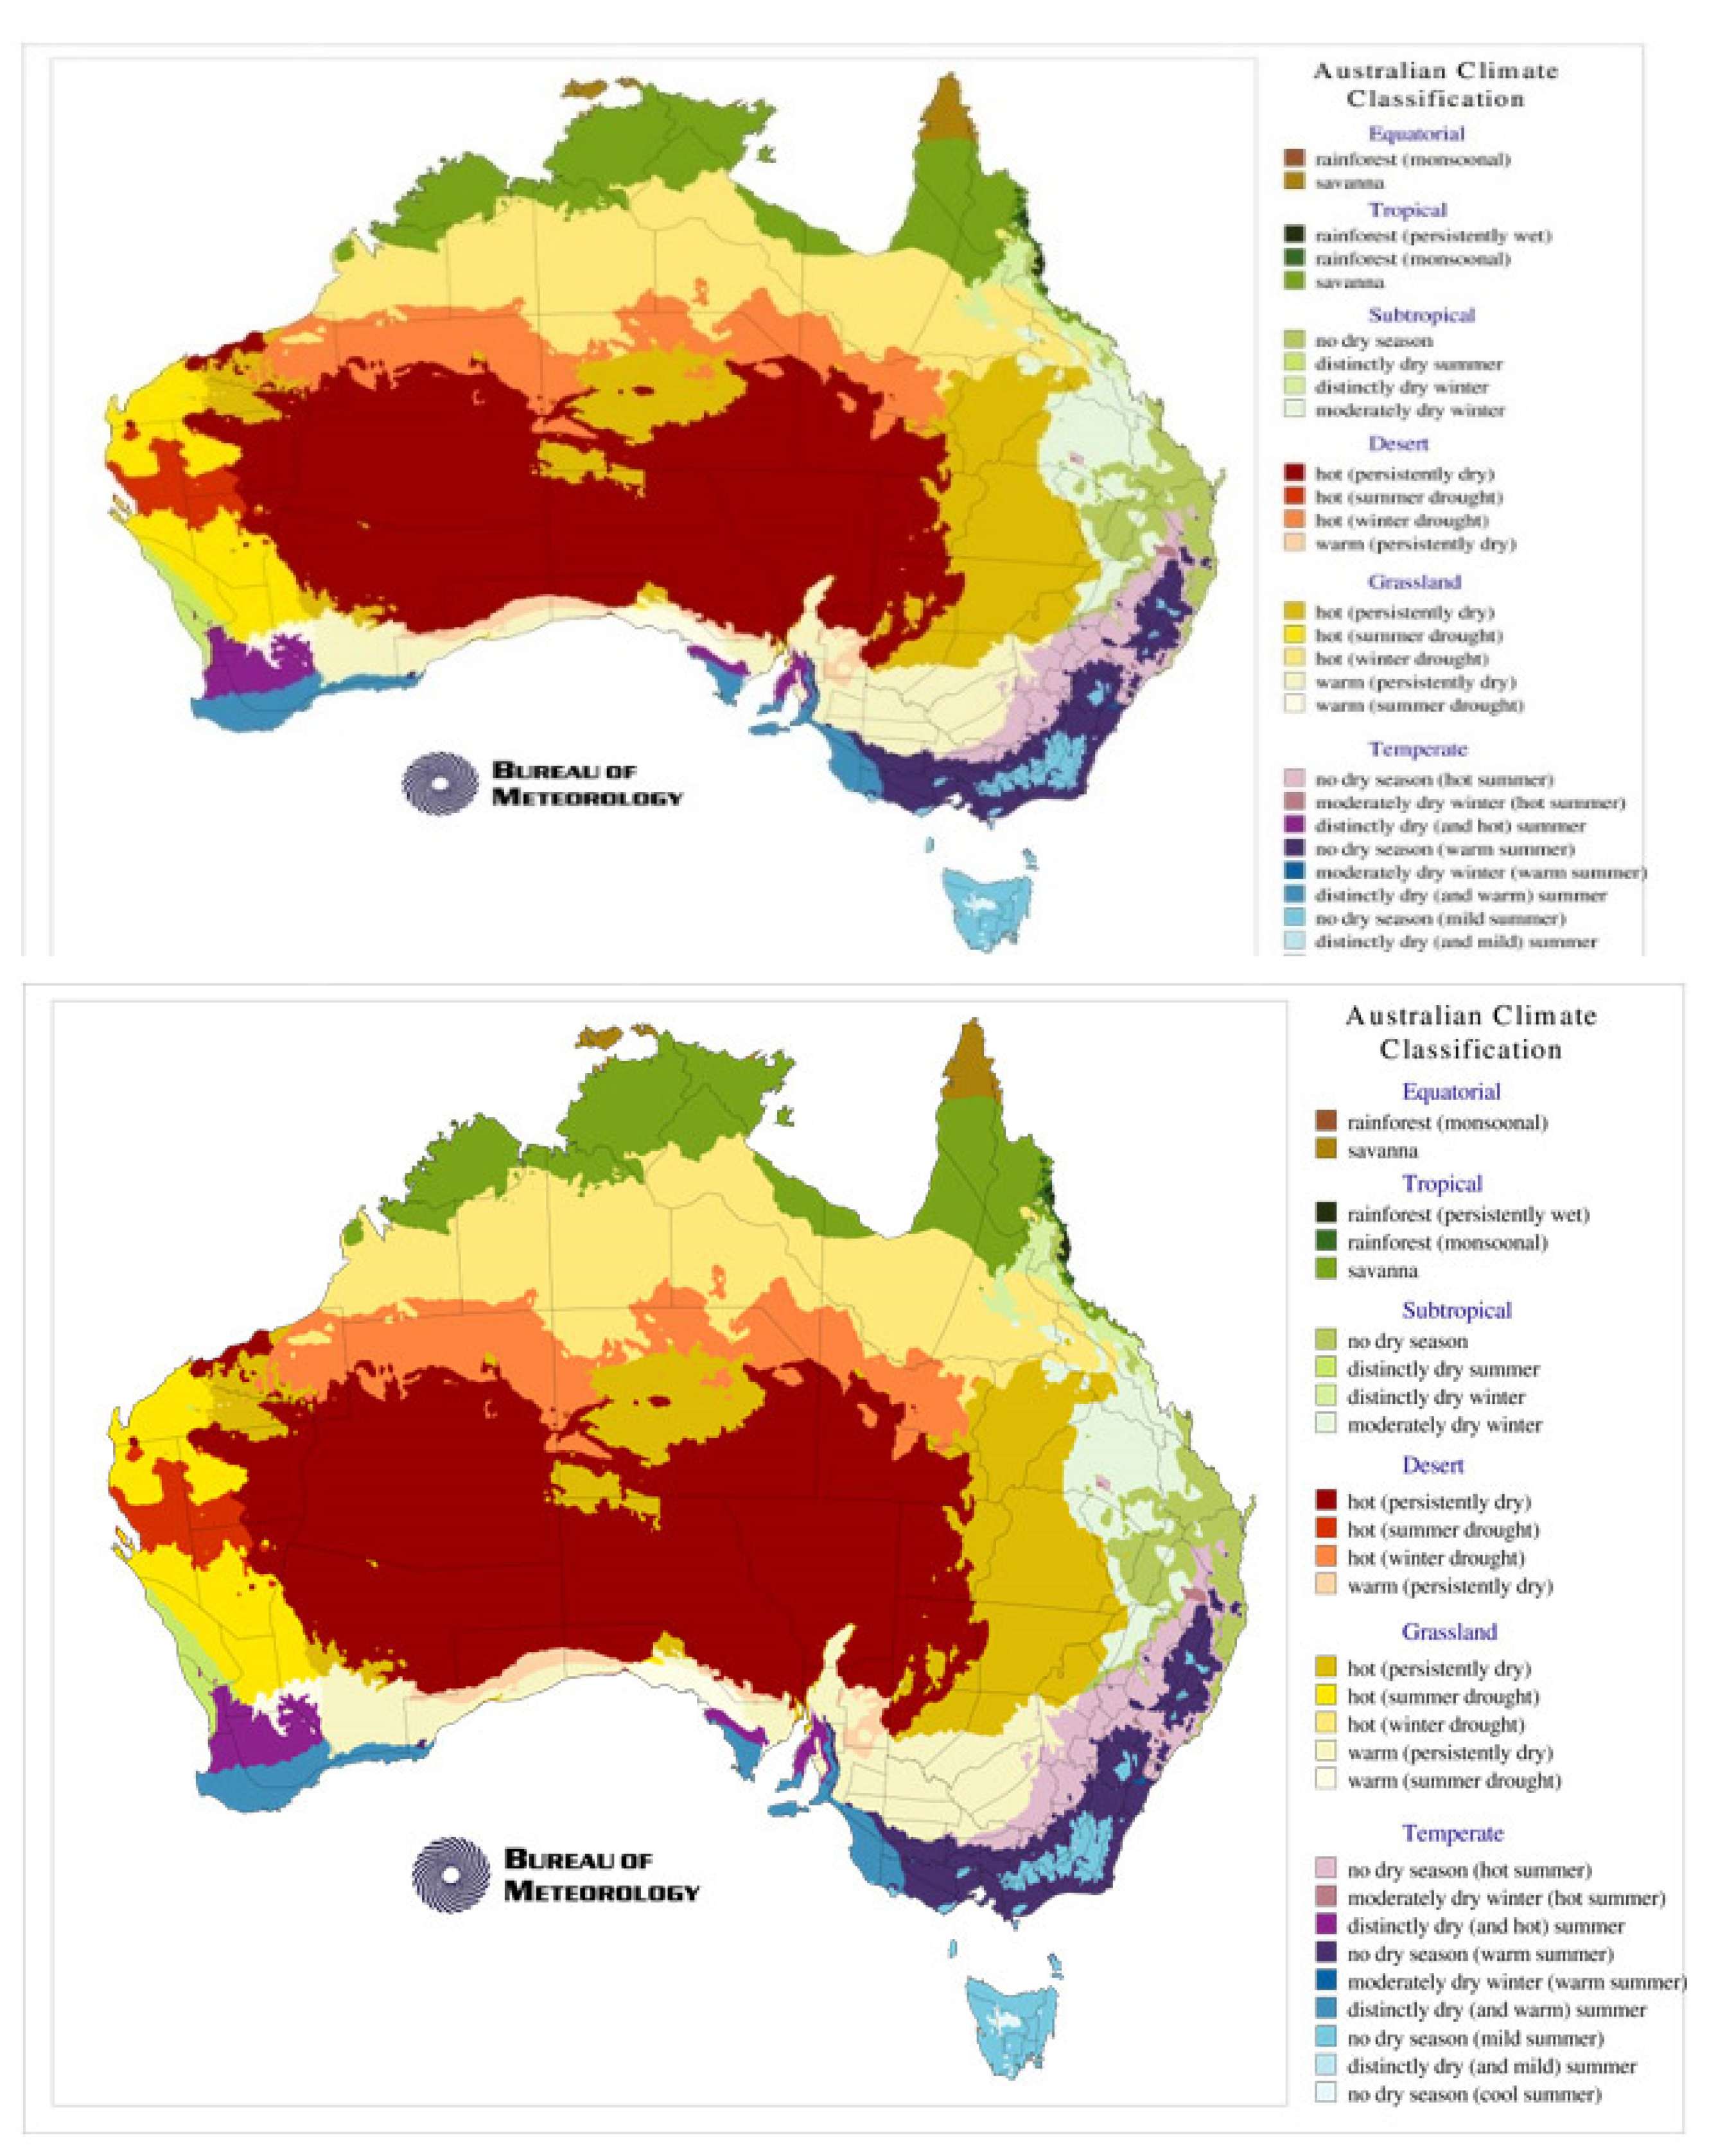
Darwin’s climate is a tropical climate as described by the climate classification of overall Australia completed by the Bureau of Meteorology, Australia [41] (for further visualization, a map is provided in Appendix A).
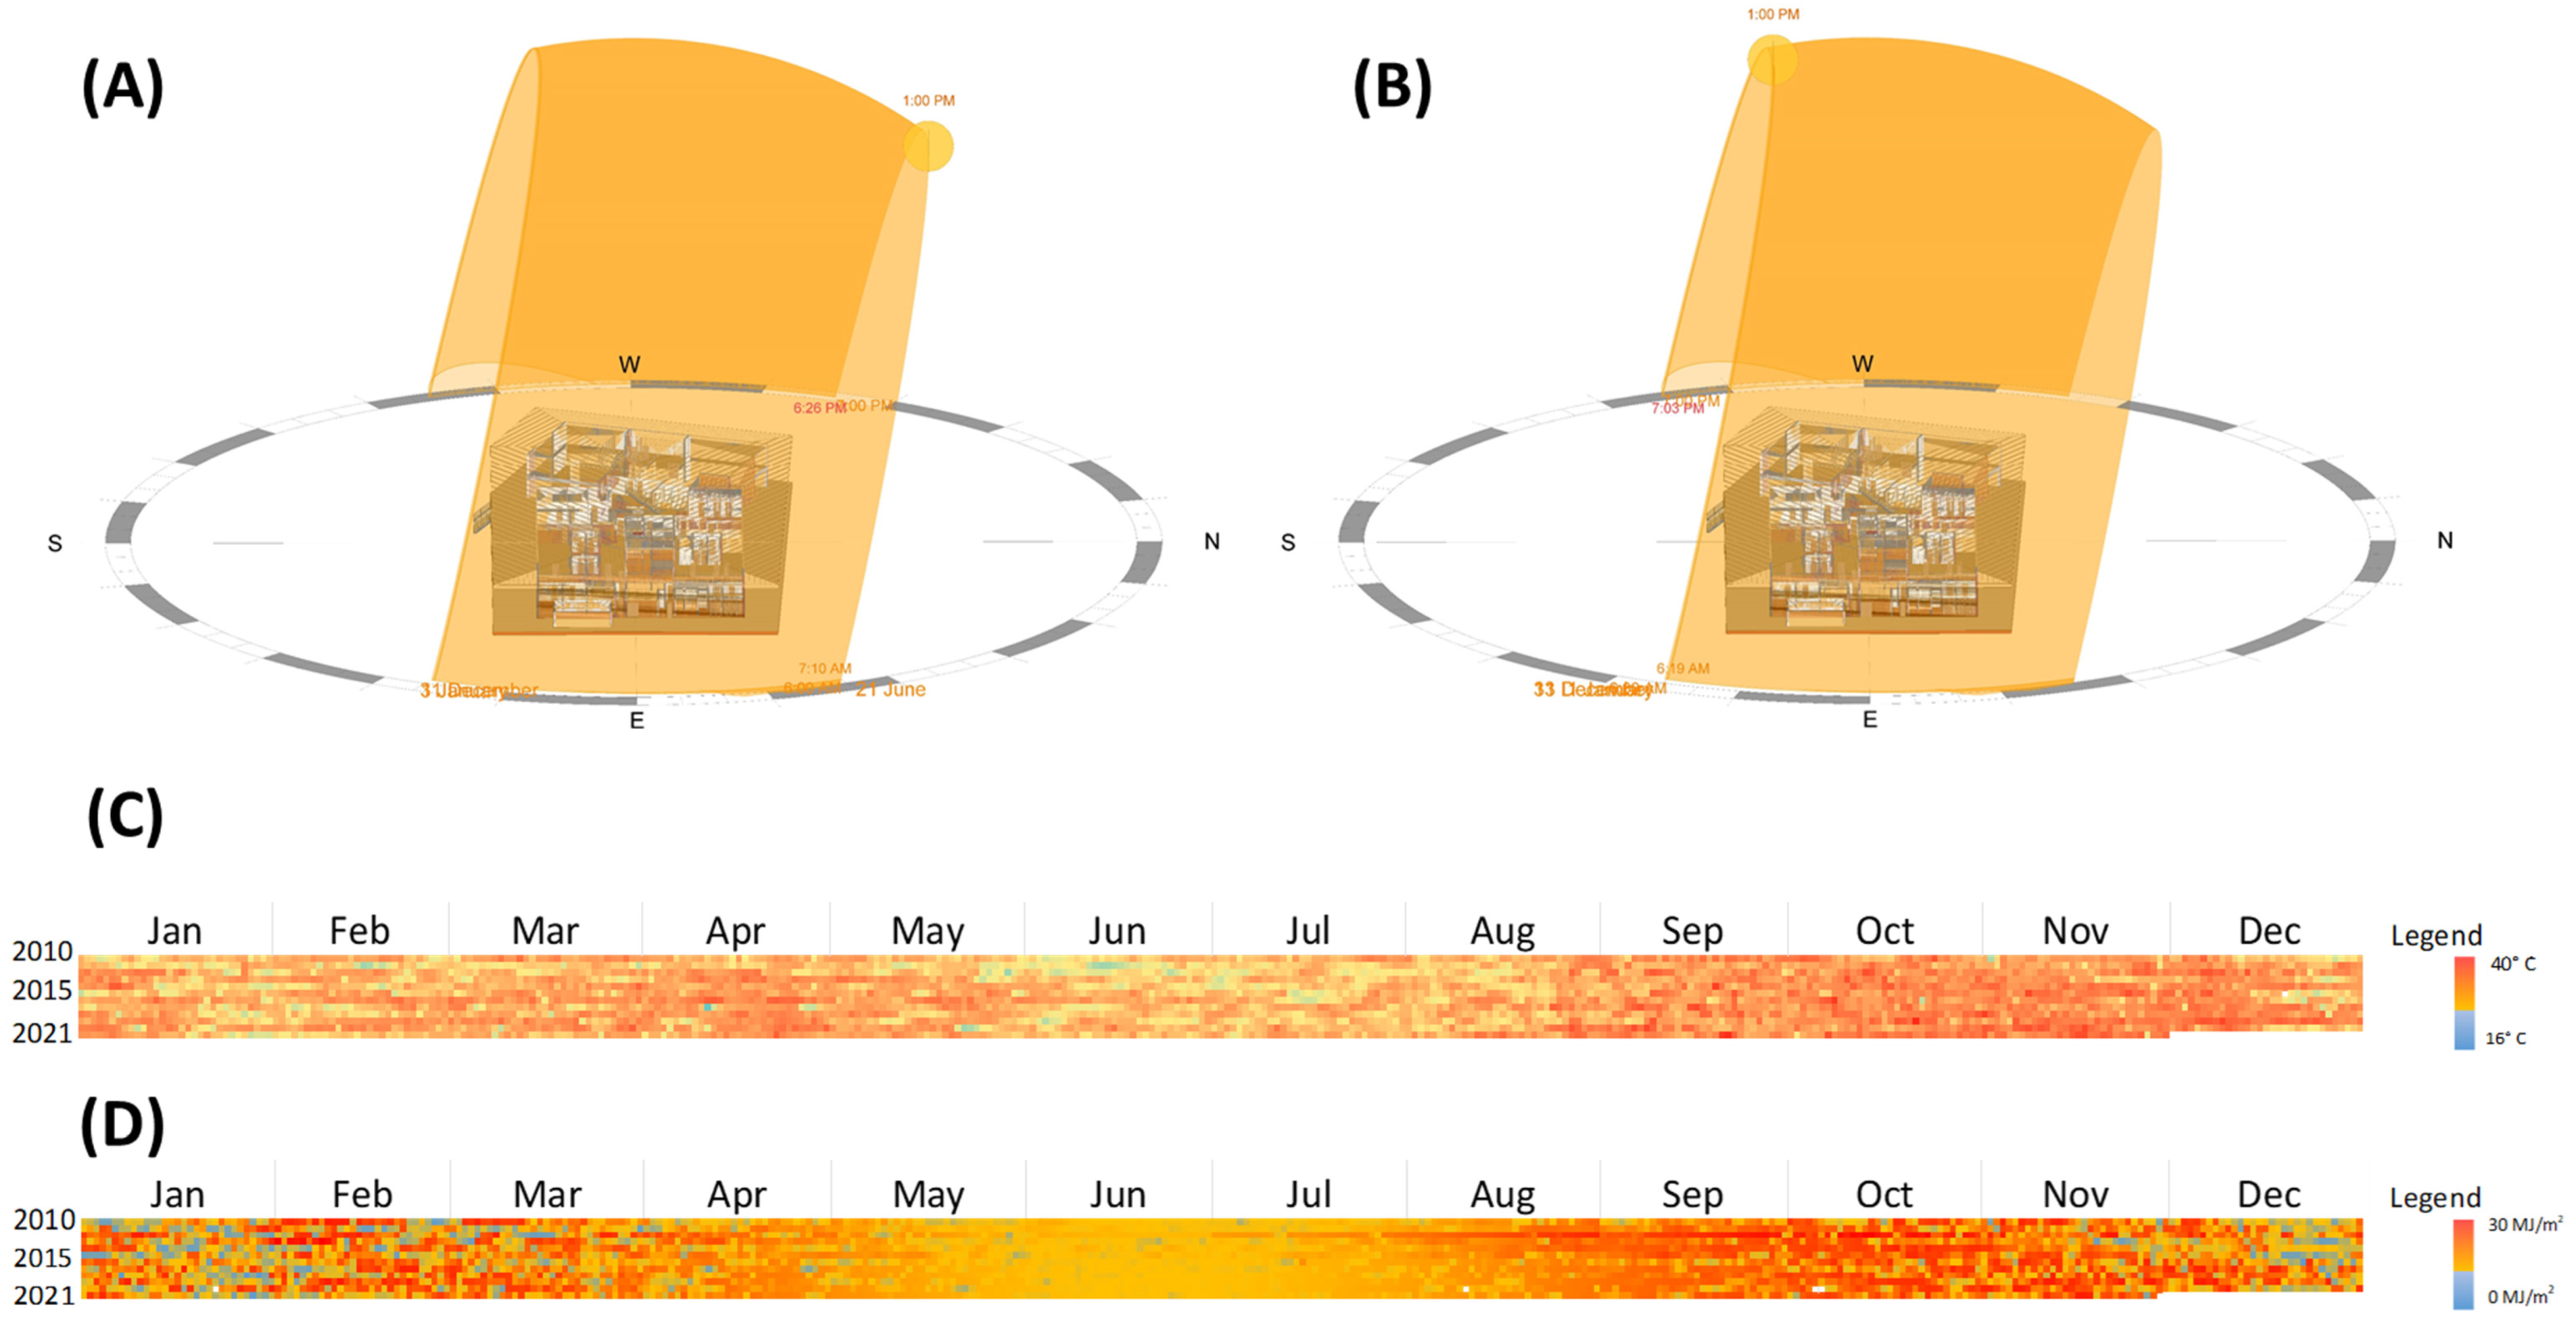
The maximum mean temperature in this region lies between 30 to 34 °C, with the highest temperature observed in November and the lowest observed in July. The minimum mean temperatures are 19 to 25 °C with similar trends as maximum temperatures. Further details related to the data at the daily level for 10 years can be seen in Figure 5. Darwin receives an annual average rainfall of around 1700 mm, with the most precipitation occurring between December and March [42].

Figure 5.
Climatic parameters of the study area: (A,B) show the sun path over the entire year with the summer solstice at (A) and the winter solstice at (B,C) shows the maximum daily temperature over a range of years from 2010 to 2021 and (D) shows the daily solar exposure over the years ranging from 2010 to 2021.
Sun paths were introduced in our model. The winter solstice occurs on 22 December and the sun is at 54.1° altitude. The summer solstice occurs on 21 June when the sun achieves a 79° altitude. It was observed that the existing building’s orientation and façade performed well considering the sun paths. A huge portion of fenestration is located on almost the northern and southern sides of the building. As a result, the amount of radiation received in the summer is almost diminutive, whereas, the radiation received in the winter season, the dry season, ensure an improved energy efficiency of the building.
3.2. Selection of Glazing
Most of the buildings in Australia have single glazed windows. However, many energy efficient windows are now commercially available. A retrofitting of old windows can improve the energy efficiency of the buildings. Based on a market survey, a diverse selection of the exterior windows was chosen to compare their effect on the cooling loads. The number of layers, thickness, spacing between the layers, and insulating noble gas or air in cavity are the elements that enhance the thermal performance of windows. The use of noble gases not only enhances the insulating properties of windows, but it also reduces the deterioration of the panels [43]. Table 3 shows the window elements considered for the purposes of the analysis:
Table 3.
Selection of windows based on different combinations of elements.
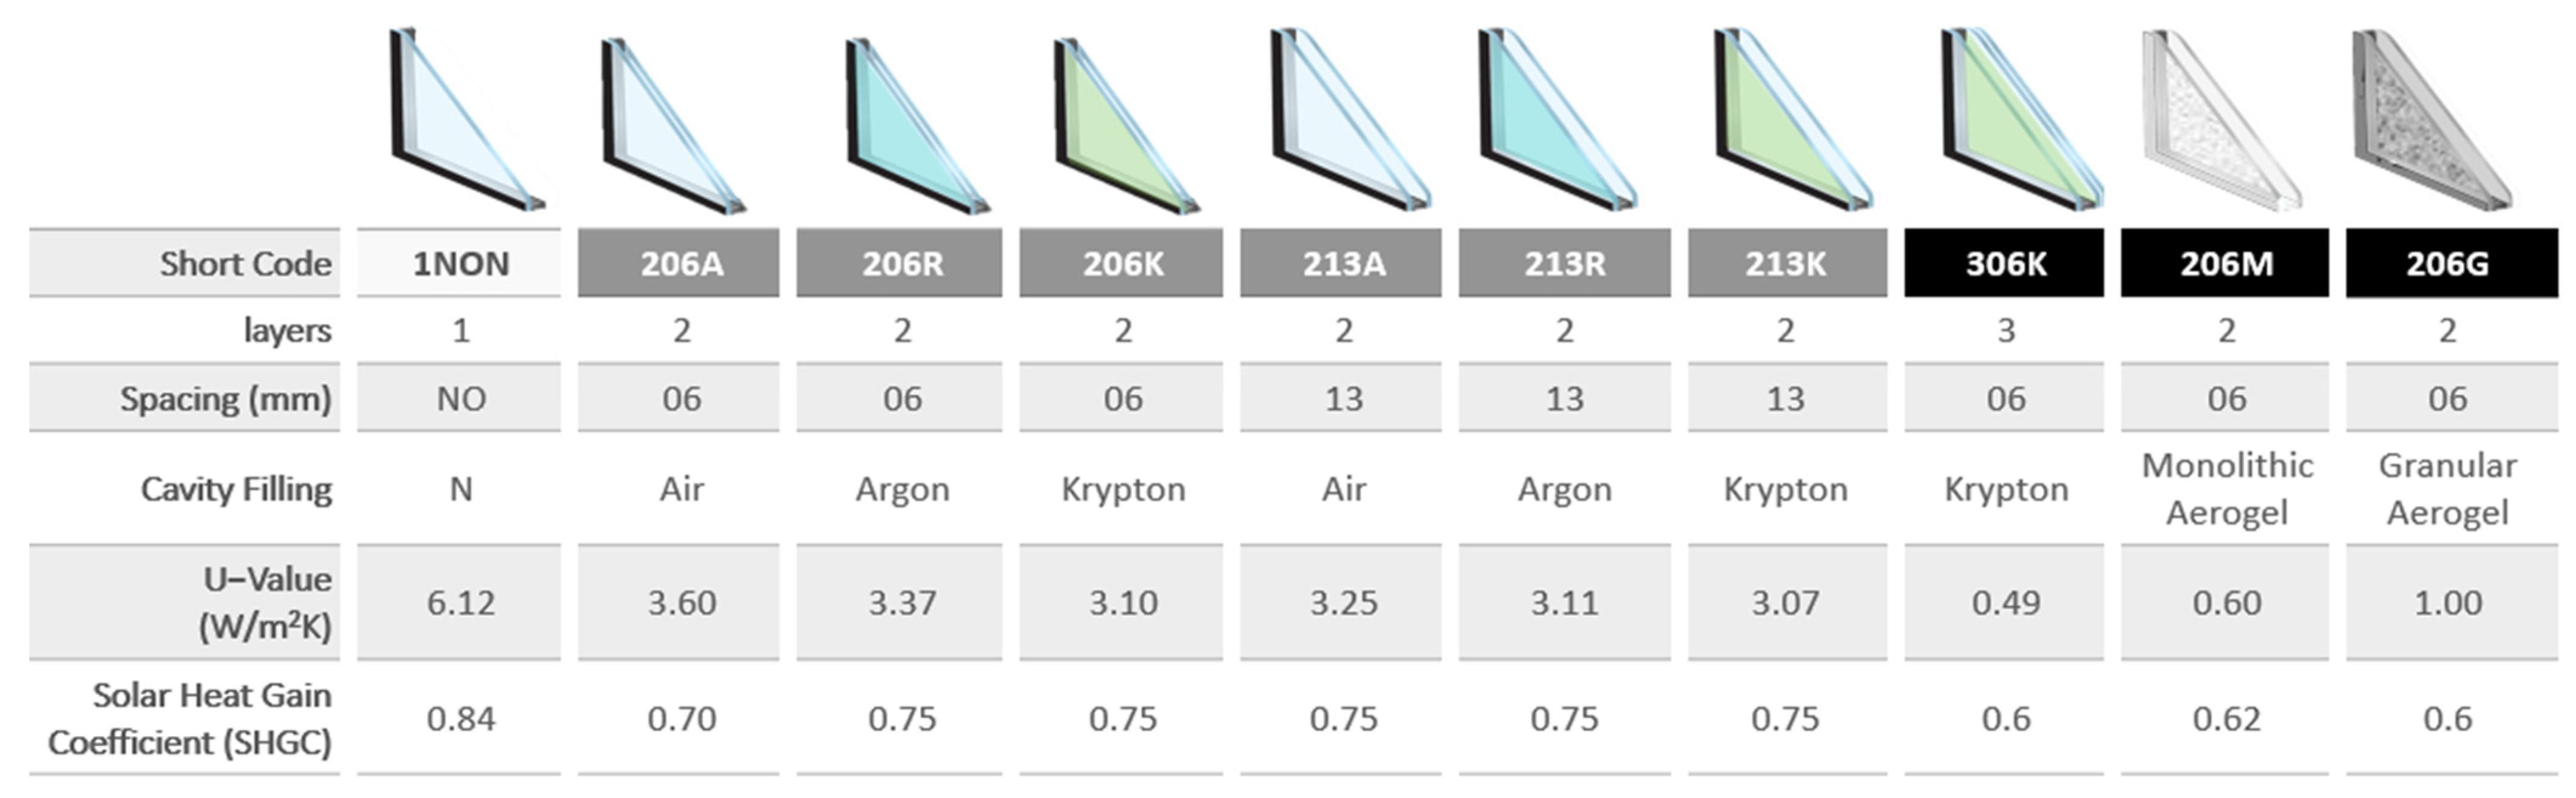
A single glazed window consisting of a single glass panel and a 6 mm thicknesses was taken as the baseline/control case. Different versions of double-glazed windows were chosen with various air space thicknesses and three types of gases to fill the air space. Two types of aerogel double glazing were also considered, along with one triple glazed window with krypton used as the filling gas between panes. The glazing used for analysis purposes is shown Figure 6 along with the detailed specifications and transfer parameters.
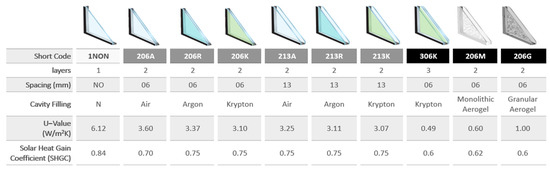
Figure 6.
Detailed specifications of glazing and short codes used for the analysis.
3.3. Energy Load Calculations
The cooling loads were calculated using SHGC and U−values. For the calculation of energy loads for selected glazing types, the parameters for the windows were changed while the U−values of other building components remained the same. As mentioned, the basic load calculations were carried out for the 6 mm glass and were considered as the baseline/control value. Any reduction in the cooling loads was compared against this value to evaluate the effectiveness of the glazing options.
Two software tools were used to complete the task. Carrier HAP was used to calculate the cooling loads based for various glazing types. However, the extensive data input required for this tool was calculated using the Autodesk Revit Architecture software tool. Since Revit did not have all the types of windows chosen for the study purpose, another software, the “Hourly Analysis Program” (HAP), which uses the U−value, was additionally used to carry out the load calculations. This software utilizes the ASHRAE 90.1 standards to predict the heating and cooling loads of the buildings. The standards cover the requirements of SHGC for a range of window-to-wall ratio for different regions [28]. This software can also calculate energy consumption and compare the energy costs for design alternatives. This is used extensively in both domestic and commercial sectors for modern designs and to check the effectiveness of the retrofits for the older buildings to improve their energy efficiency. A few assumptions were considered to facilitate smooth calculations (for further details, refer to Appendix A). The U−values were taken out after Mempouo [44], Carrier HAP (based on ASHRAE 90.1 standards), experts’ opinion, and from the literature review for the modeling purpose.
4. Results and Discussions
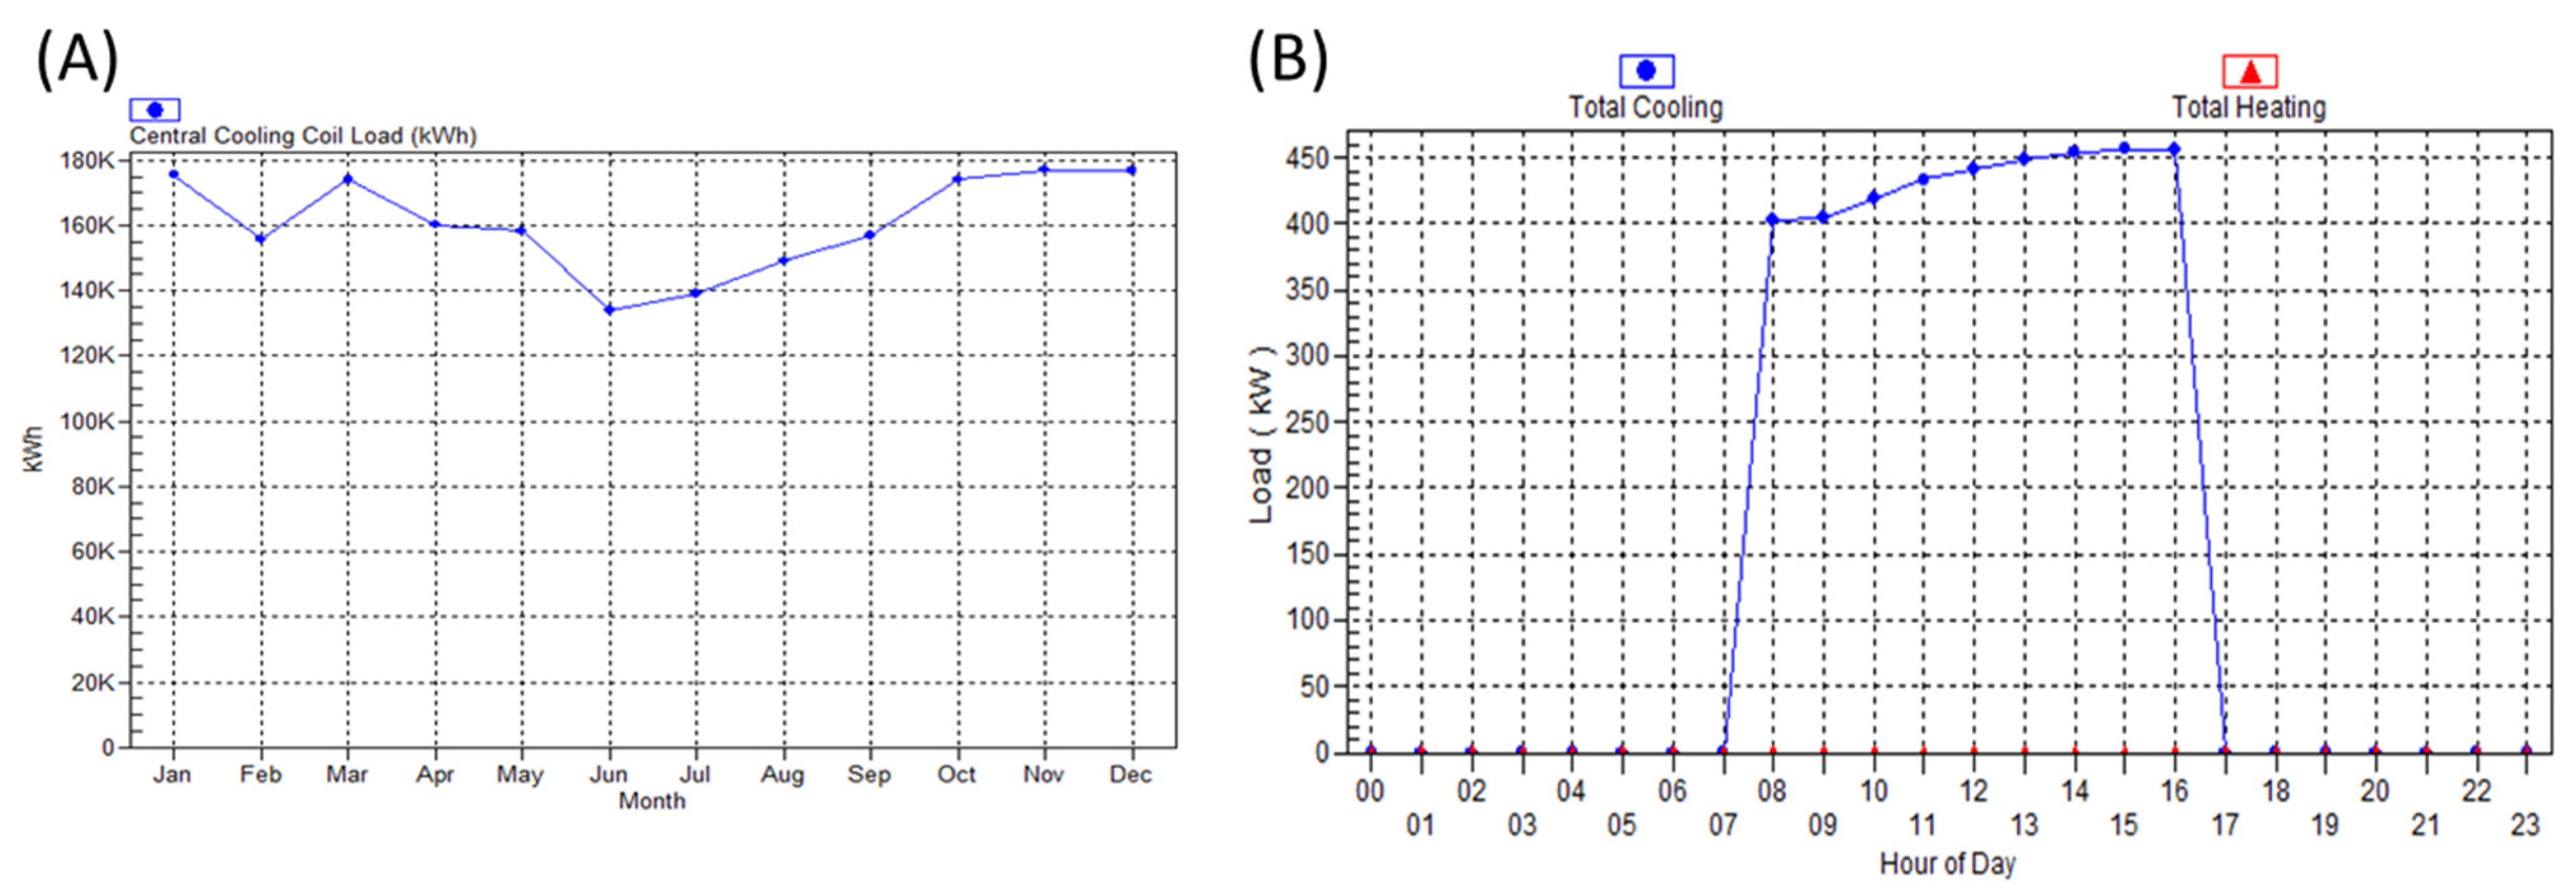
As the building under study was an office building, the energy loads were expected during office hours only. The study site was assumed to utilize the air conditioning systems for an average of 9 h daily, 5 days a week and 50 weeks in a year including holidays. Thus 2250 h of working air conditioning was used for calculation purposes. The peak cooling load occurs in December for the study building, while the least load is observed in June. The annual energy consumption by the cooling coil on a monthly average in a year as well as the hourly for a day in December is shown in Figure 7. It can be observed that the demand rose around mid-day by a considerable amount and remained same till the end of office hours.
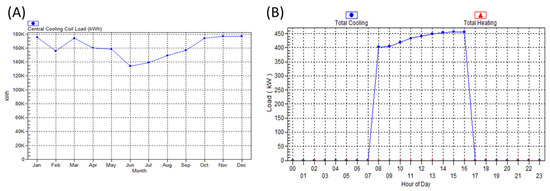
Figure 7.
Monthly cooling loads estimated using Carrier HAP in (A) and hourly cooling loads in (B) at the peak demand month of December for the control case.
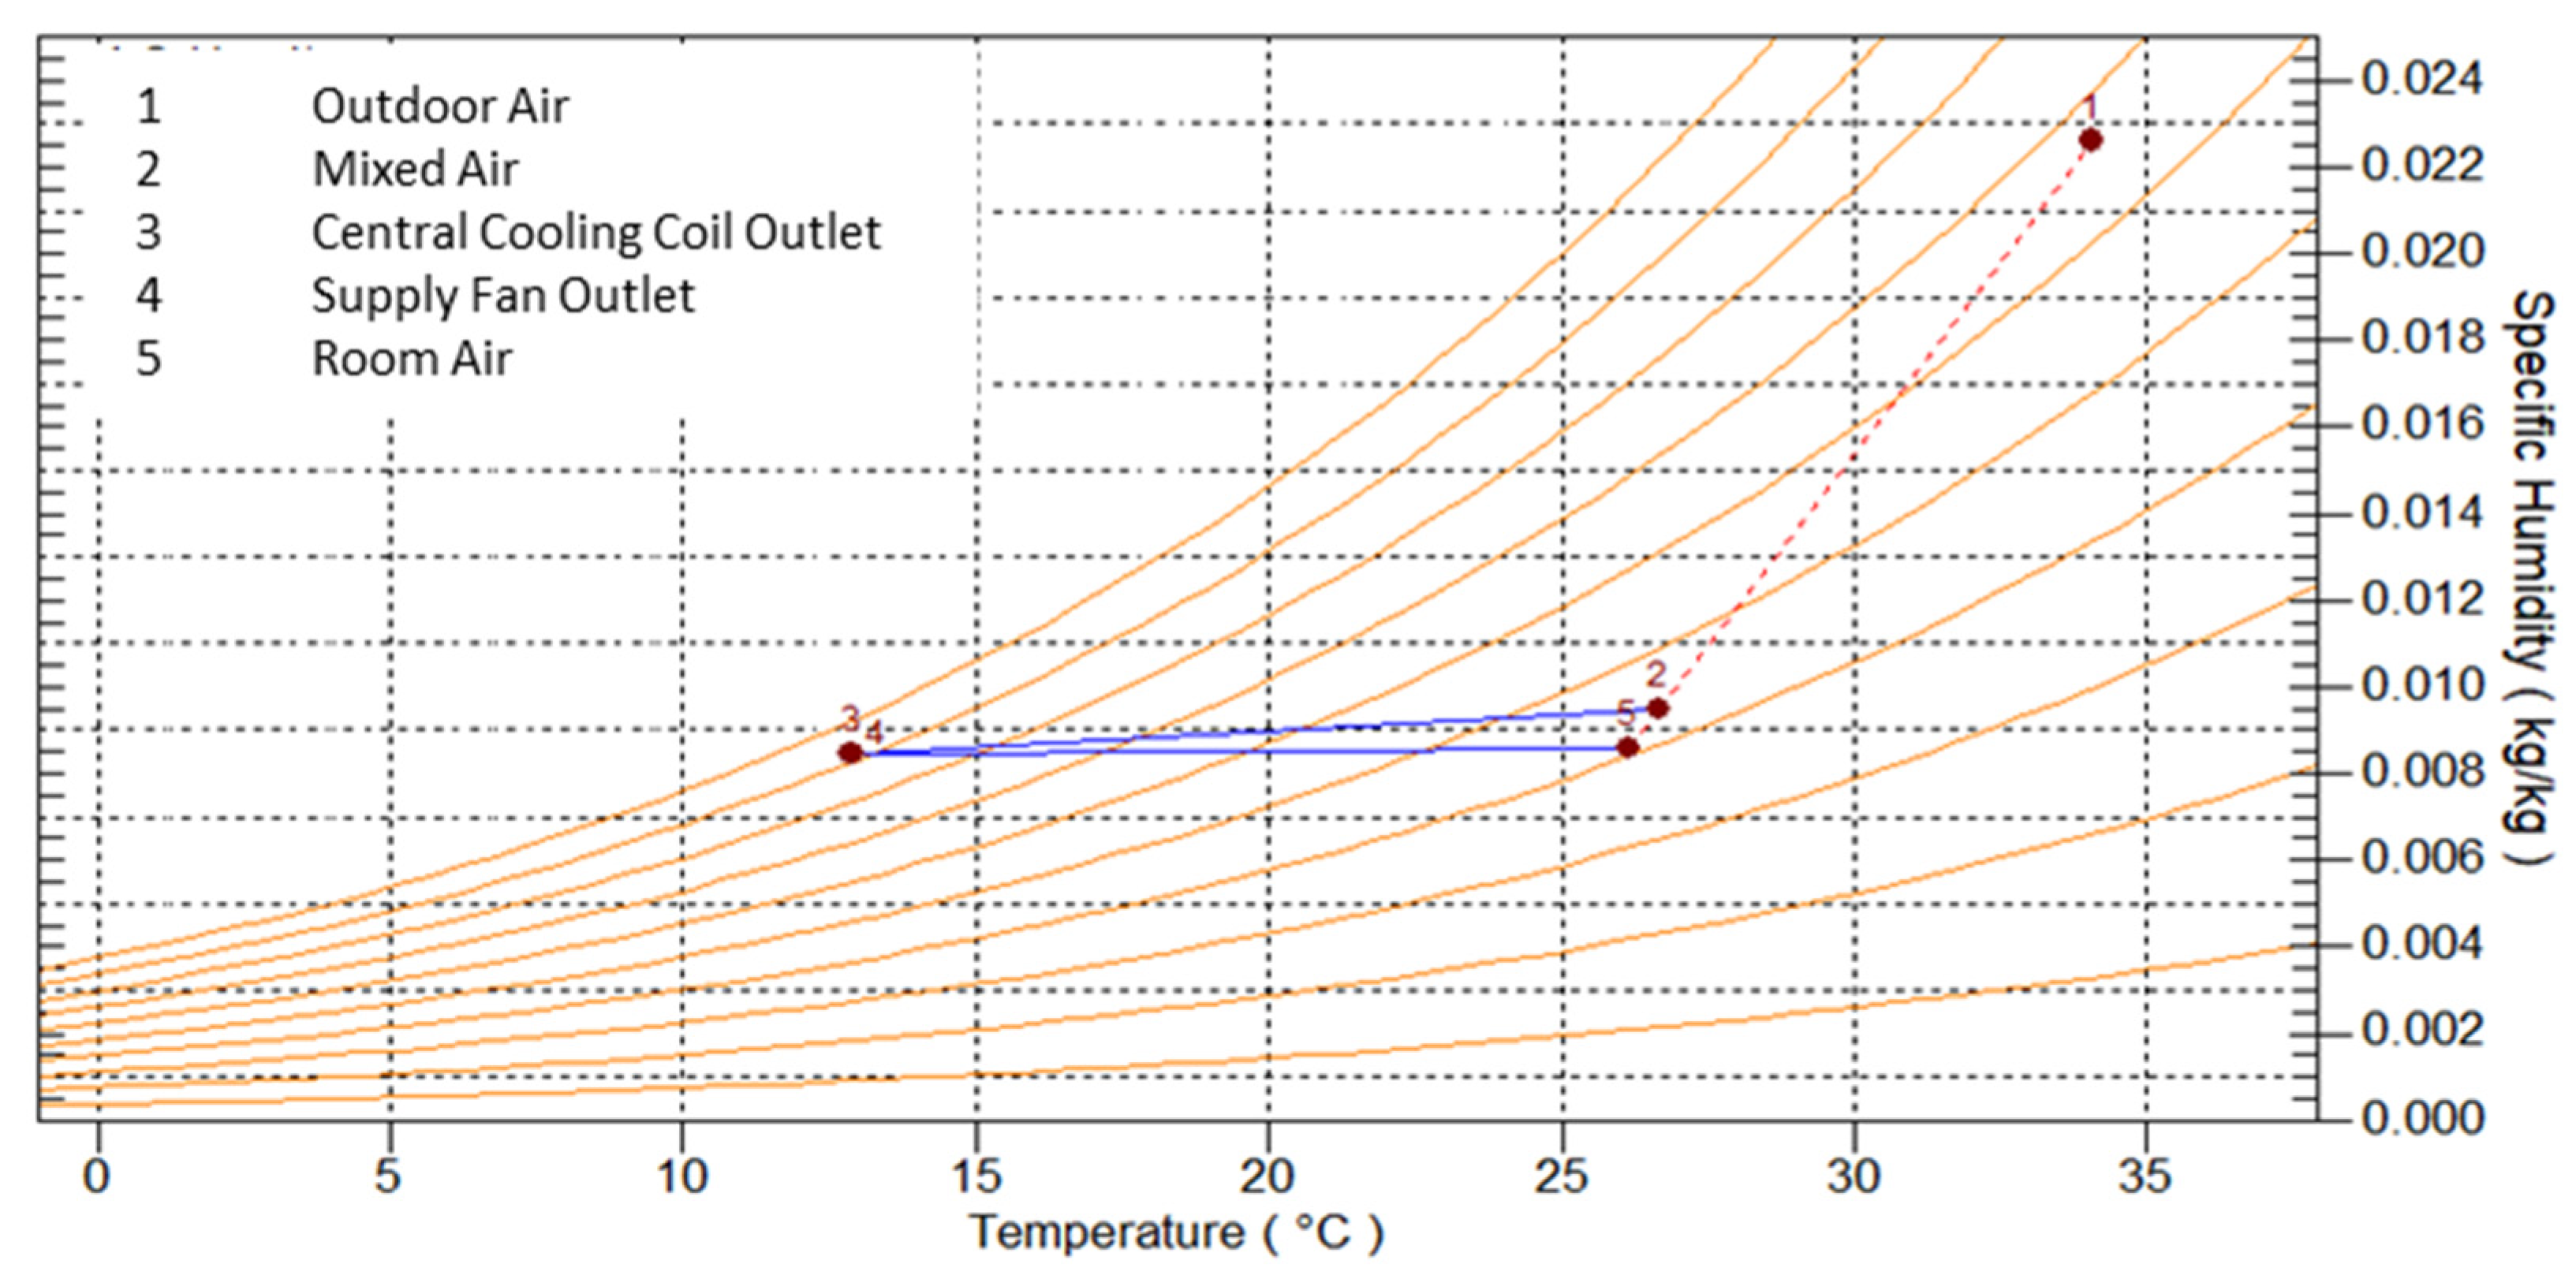
If the sensible heat ratio (SHR) (the ratio of sensible heat load to the total cooling load) is analyzed, it obvious that approximately 80–85% of the heat was extracted from the building to reduce the temperature, while the remaining heat was utilized to remove the moisture content from the conditioned space. The psychometric variation can be seen in Figure 8 for December.

Figure 8.
Psychometric variation for a typical day in December modelled using Carrier HAP for the control case.
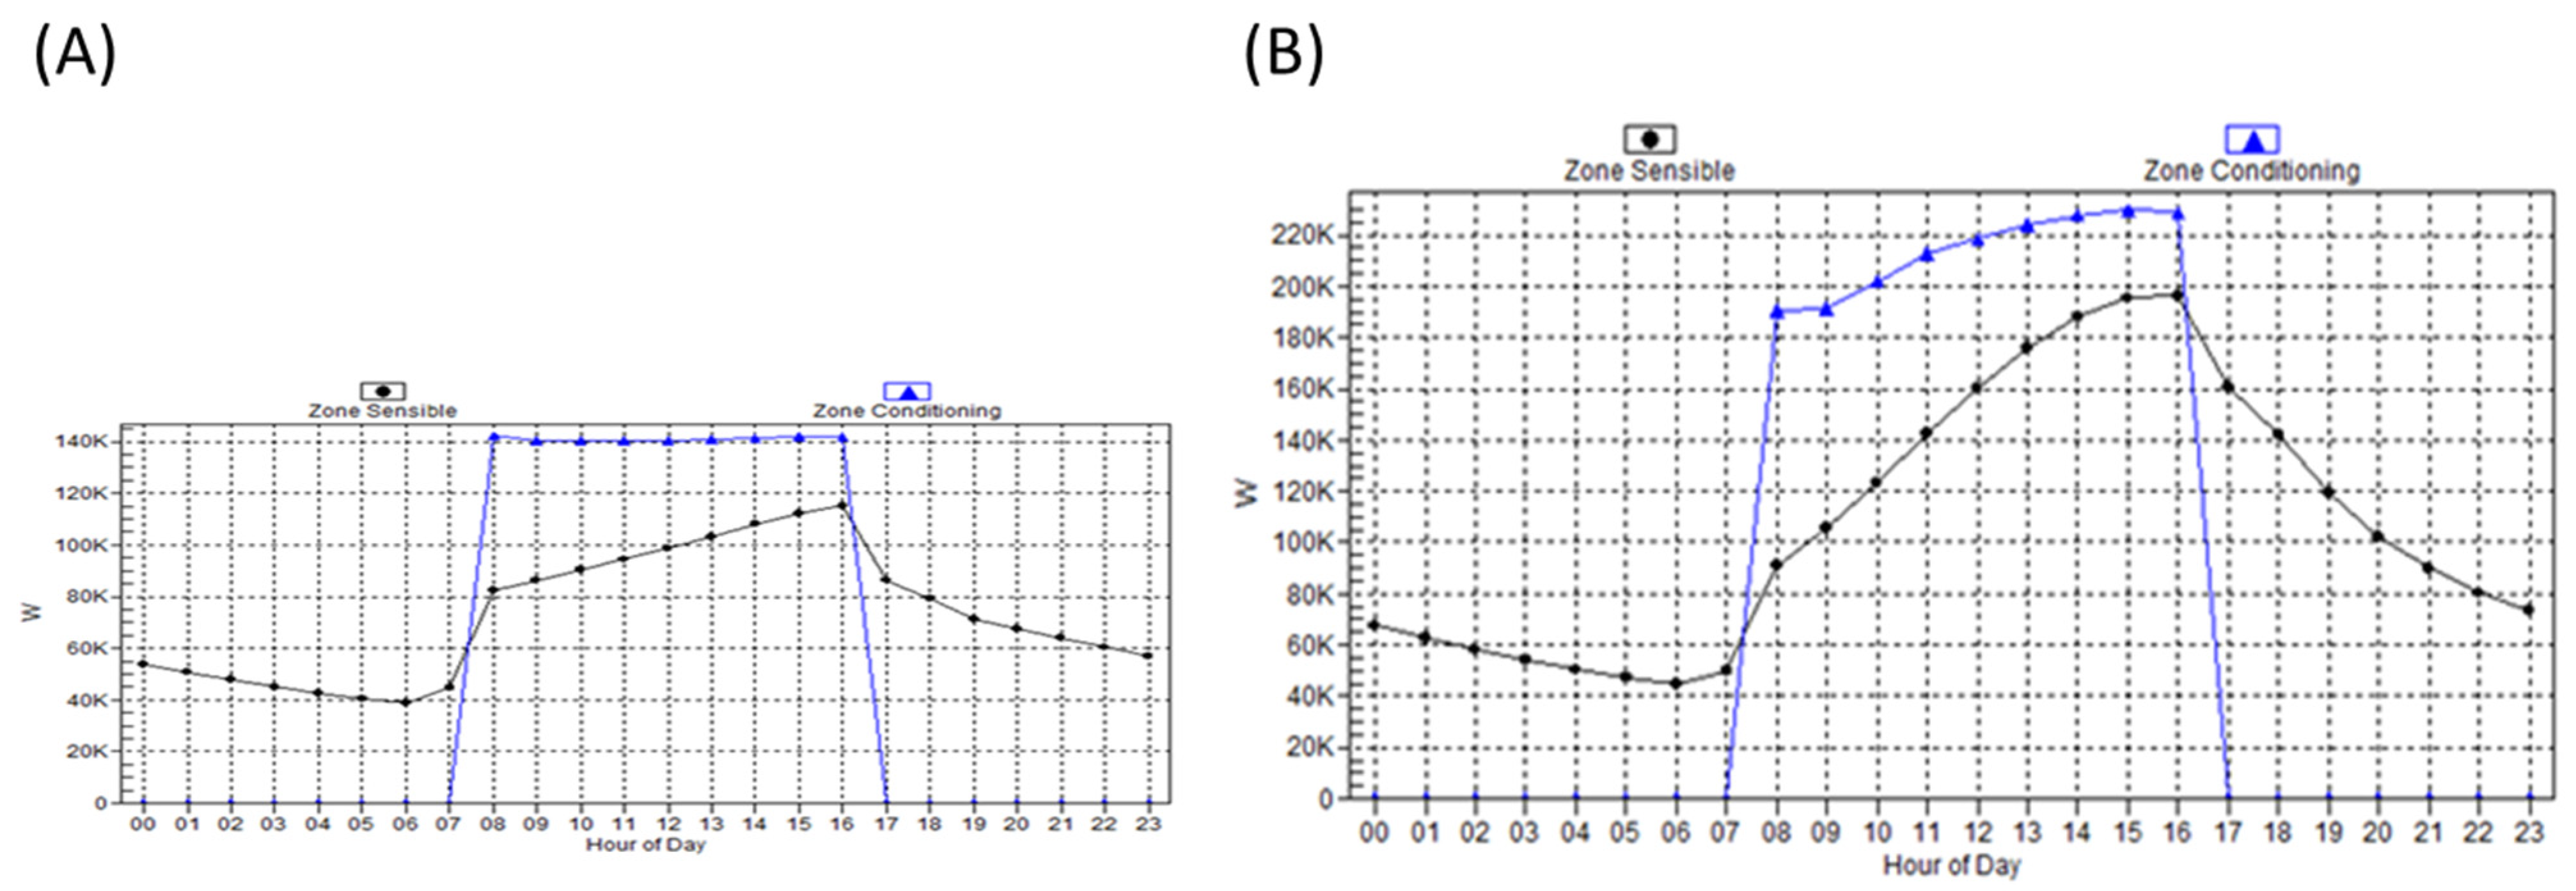
The variation in sensible heat for the day can be seen in Figure 9 for Zone-1 (the ground floor) in (A), and Zone-2 (the first-floor plan) in (B). The demand for a sensible load exhibited an increasing trend with the temperature increase during the operational hours in a day. After office hours, the need considerably reduced since the building is not in use. The variation in sensible heat for the ground floor was less than that of the first floor as the first floor has a larger area directly exposed to the sunlight from the roof. In addition, less radiation reached the ground floor as nearby buildings caused some shadows on the ground floor walls.
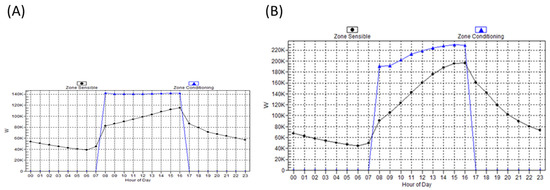
Figure 9.
The variation in sensible heat for the day can be seen for Zone-1 (the ground floor plan) in (A), and Zone-2 (the first-floor plan) in (B) for the control case.
Cooling load analyses were repeated for all glazing types. A reasonable reduction in cooling load, ranging from 20 to 50 kW, was observed depending on the window type. Additionally, the difference in cooling loading was observed form the sensible cooling, while the latent cooling values remained approximately the same in all cases.
During the model calibration, it was observed that the roof, floor, and external walls were the dominant elements of the building in terms of the contact area and the insulating efficiency of the building and played more dominant roles compared to the windows.
4.1. Cooling Loads Analysis
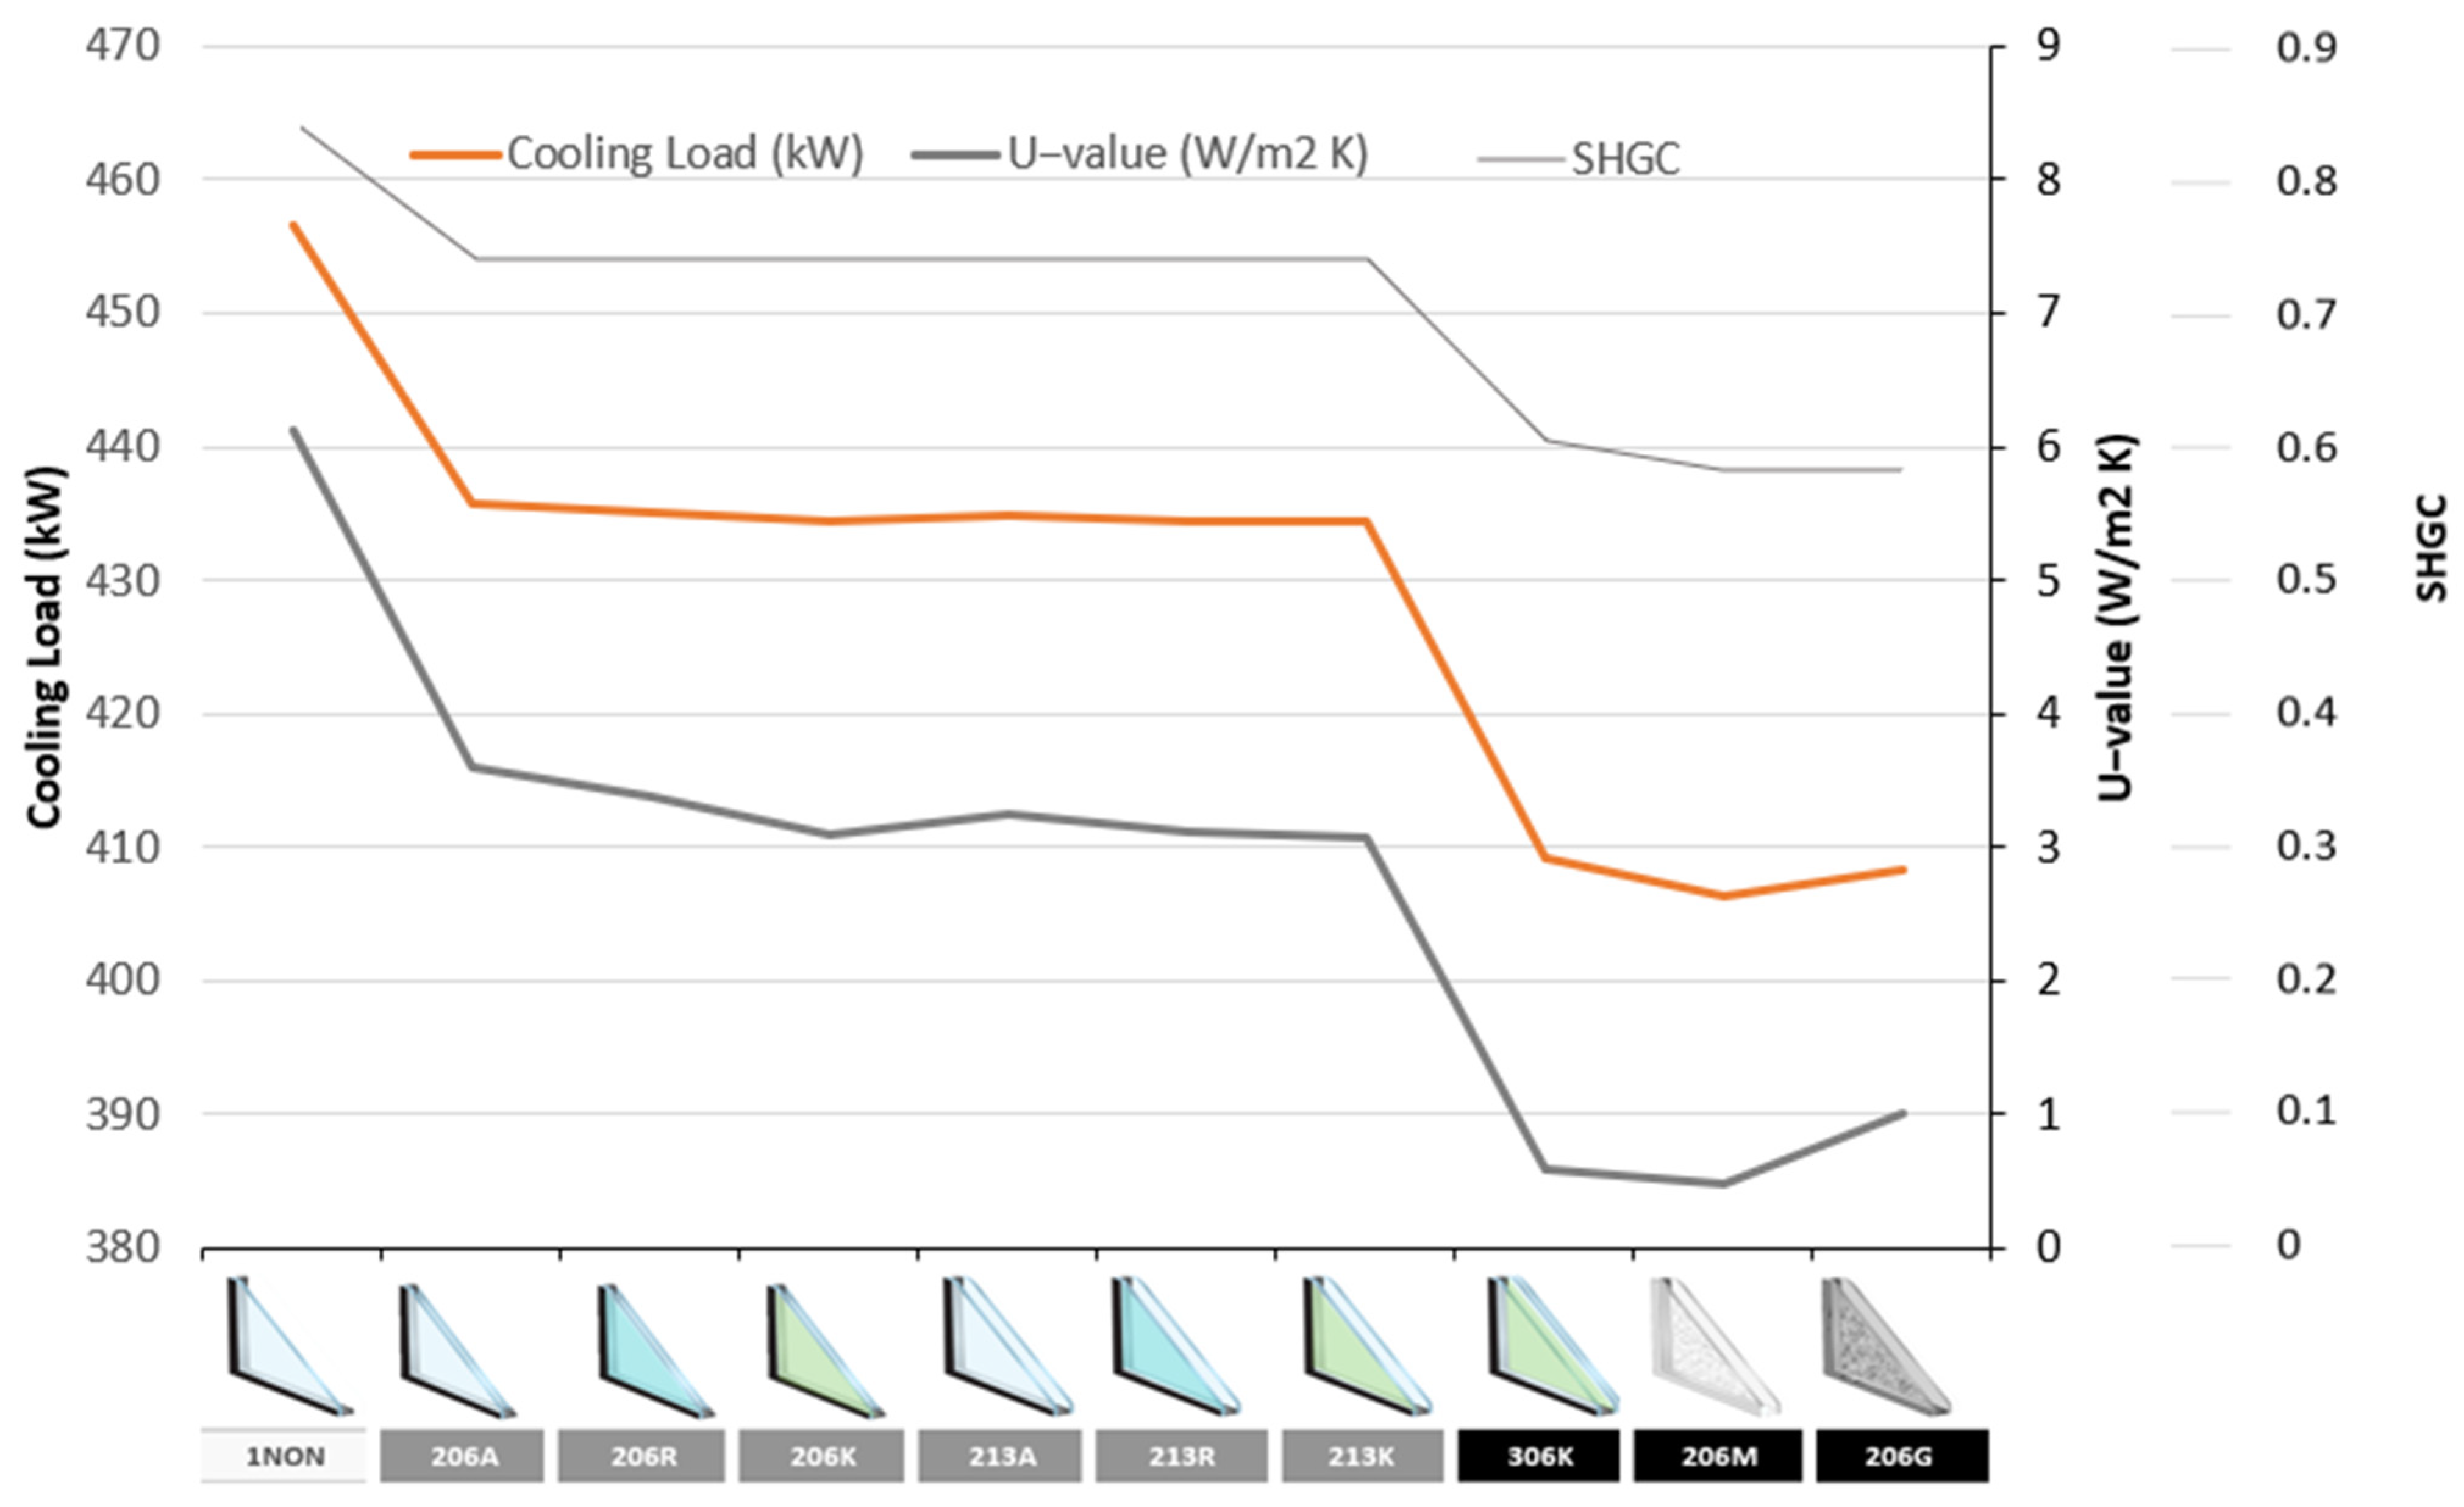
The cooling loads were calculated for ten types of windows, out of which six were commercially available variants of double glazed, two were aerogel filled, one was triple glazed, and one was single glazed and was used as the baseline. Figure 10 shows the graph indicating variation in cooling loads when the simulations were performed using the different air gaps, glazing, and cavity-filled gas types.
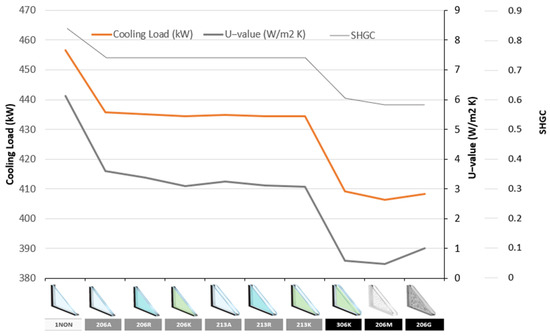
Figure 10.
A comparison of double glazing with the baseline for SHGC, U-values, and cooling loads.
While comparing double glazing to baseline, a reasonable energy saving in terms of a cooling load reductions was observed. The energy savings ranged between 20−22 kW (5%) approximately depending on the type of gas used to fill the cavity between the panes. The change of gas affected the overall U−value of the window. For example, an approximate reduction of 0.25 W/m2 K in U−value occurred when the filling gas was replaced from air to argon as well as from argon to krypton.
It was observed that the U−values were not reduced significantly when the cavity spacing was increased to 13 mm. The reduction in the cooling load was within the range of 1 kW compared to 6 mm air space. Moreover, the volume of the window (thickness) increased considerably. It can be concluded from the above deduction that the change in air space width did not have a considerable effect on the overall performance of the window, regardless of the gas used to fill the air space. Moreover, adding an extra gap require an additional quantity of gas, which means additional manufacturing costs.
Figure 10 shows the graph indicating the net energy savings that are achieved by increasing the spacing between the panels for different gas filling options. The mean value of energy savings was only 0.5 kW, which indicates that increasing the air gap between glass panes does not increase the insulating efficiency effectively.
4.2. Economic Feasibility Analysis
The total glazing area at the exterior faces of the building was 655 m2. The total average costs of each glazing type were calculated accordingly, whereas the cost of electricity was charged by the energy consumption in kilowatt-hour (kWh). The number units of electricity saved by reducing the cooling loads per annum for different glazing options were calculated. The calculated savings in the cooling load were then used to find out the total cost of electricity. The average price of electricity for the commercial sector in Australia is 0.3 AUD/kWh [45]. This value was then compared against the costs of the systems separately, and the payback period was estimated accordingly.
The single glazing was the cheapest in terms of price. It is the most widely used type in Australia (almost 85% of all windows) because of its easy, fast, and affordable installation supported with easy construction and a modest maintenance cost [46]. The double-glazed versions have high-cost differences due to the expensive setup of gas filling in the air space between glass panels. The price for single glazed is 359 USD/m2, whereas the price of air filled doubled glazed starts from 481 USD/m2 (34%) and reach a maximum to 756 USD/m2 for two are aerogel filled and one triple glazed type (111%). The cost difference between the single glazed and other types is significant.
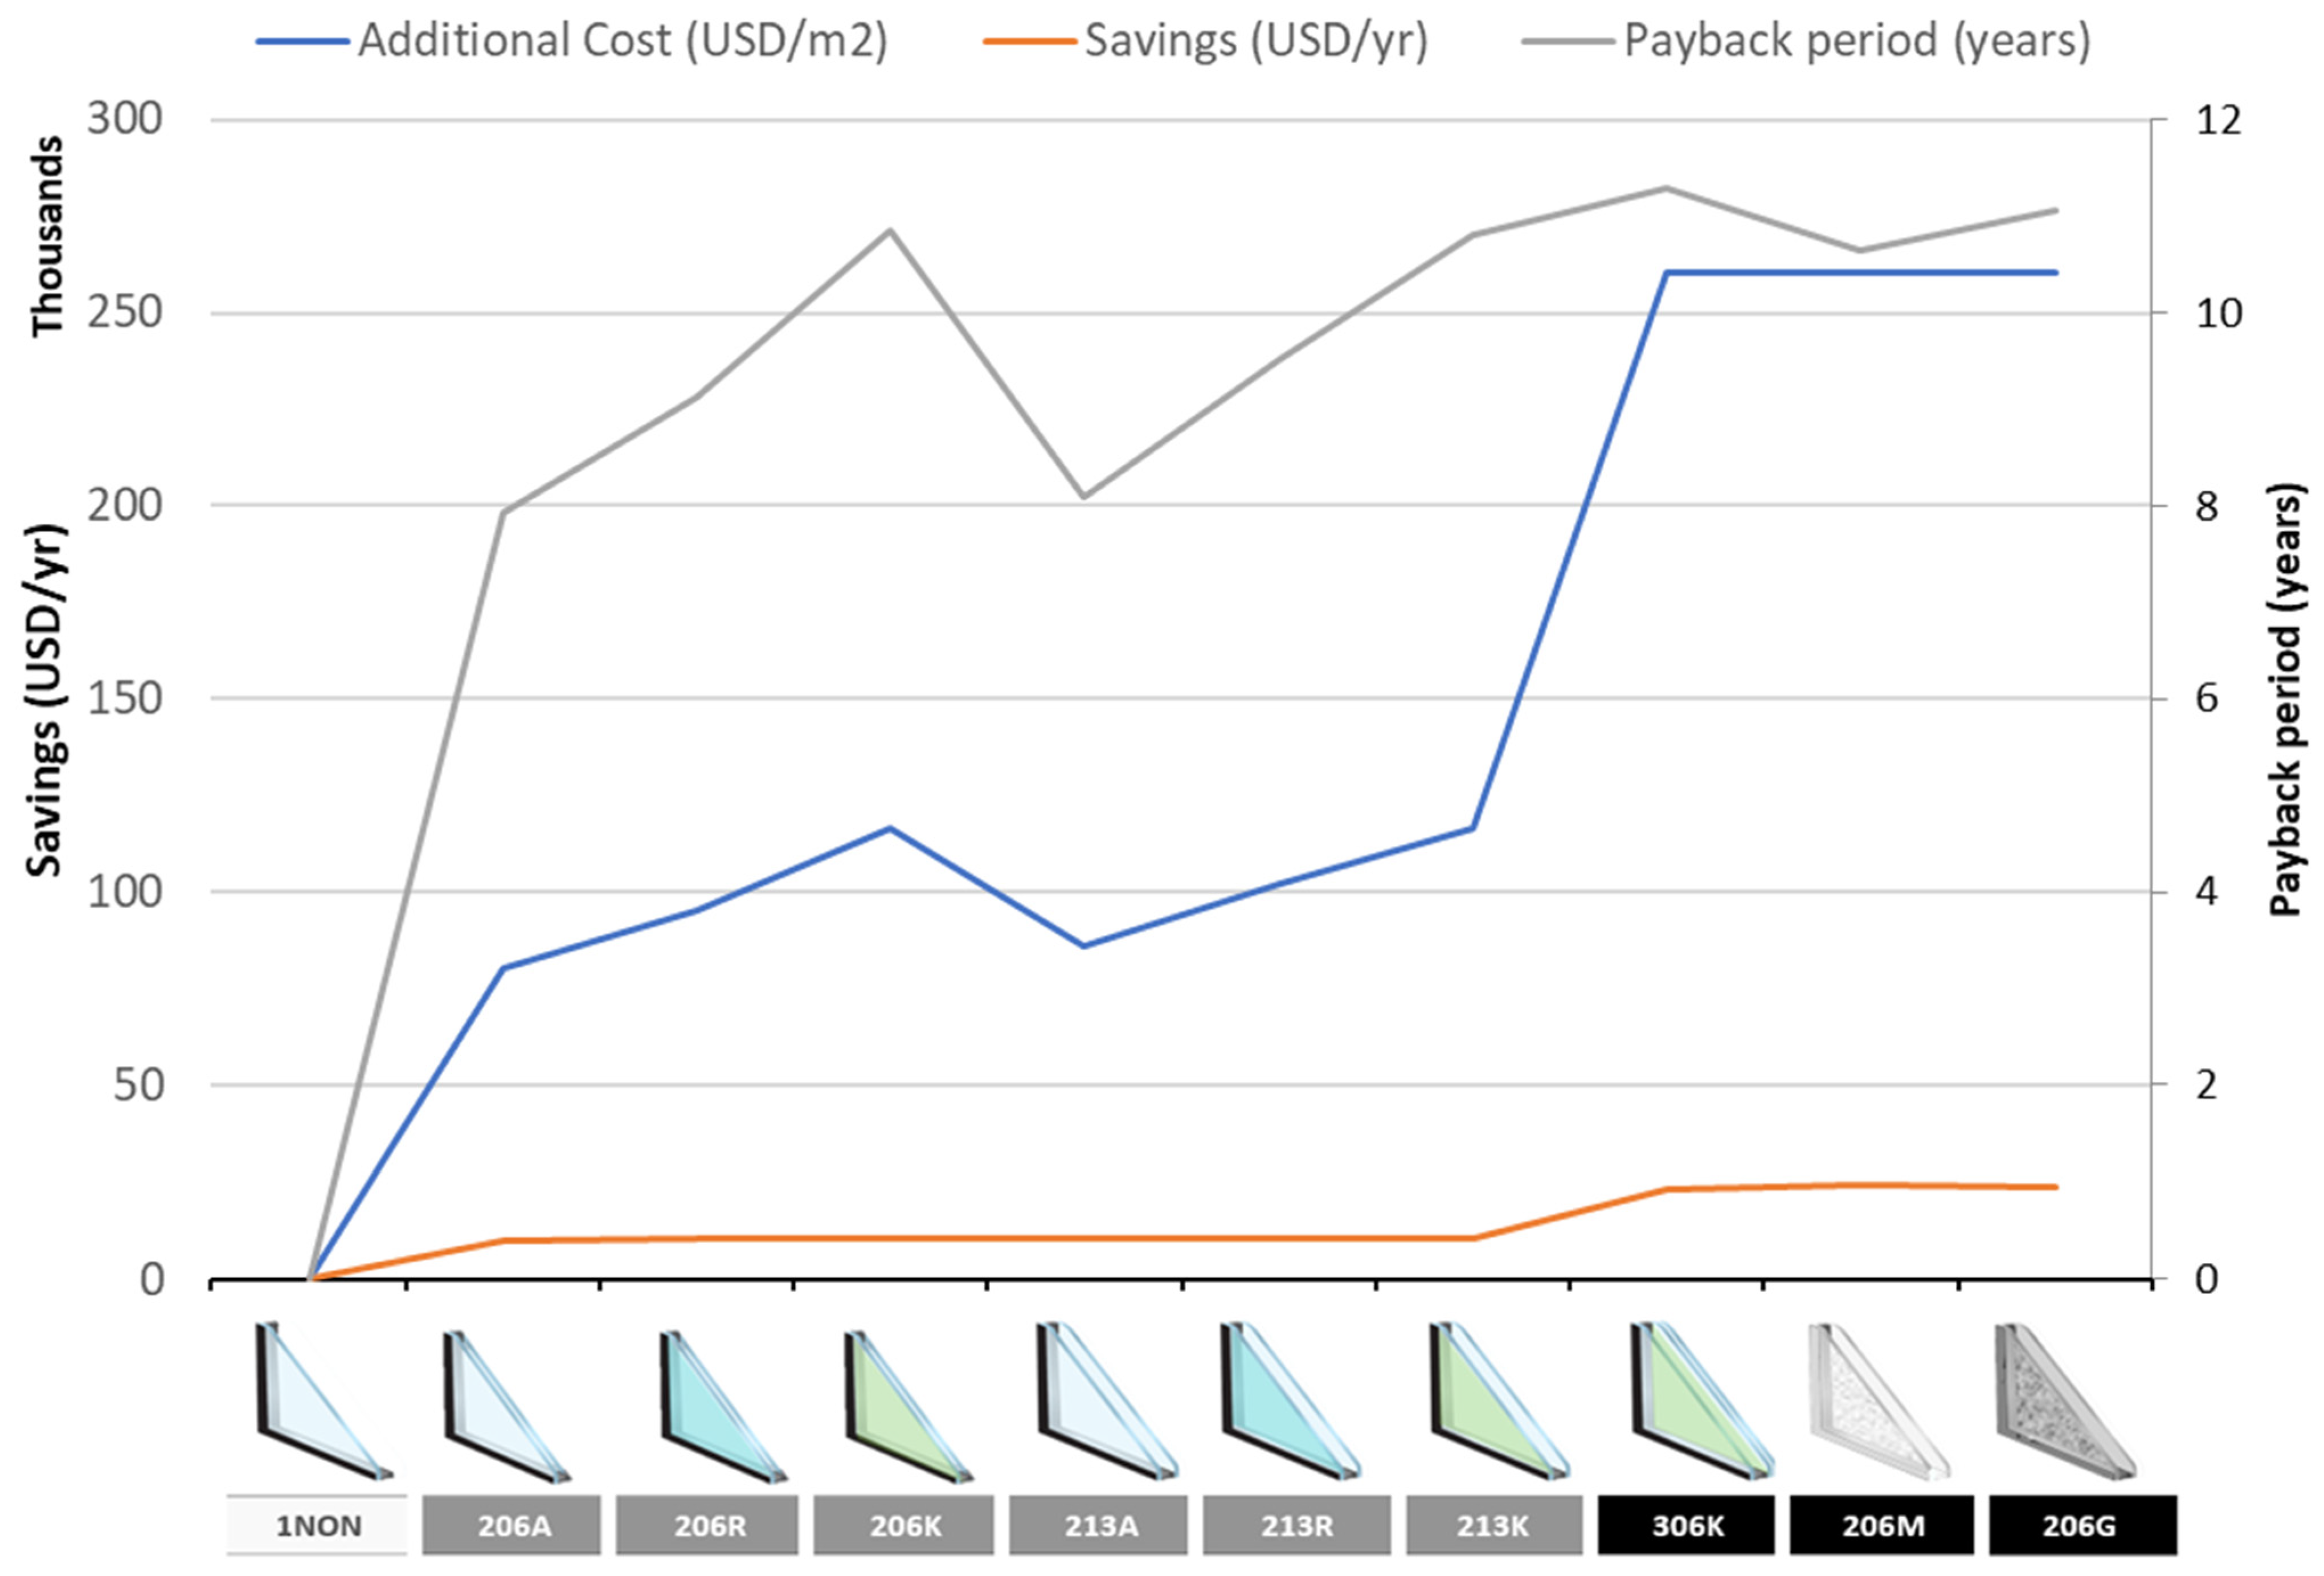
It was observed that the approximate payback period for double glazed windows was 8, 9, and 11 years for air, argon, and krypton filled variants, respectively (refer to Figure 11). These periods remain approximately the same regardless of the air space size, i.e., 6 mm and 13 mm. When comparing the aerogel variants and triple glazed windows, it was observed that their average payback period was approximately the same (within 11–12 years).
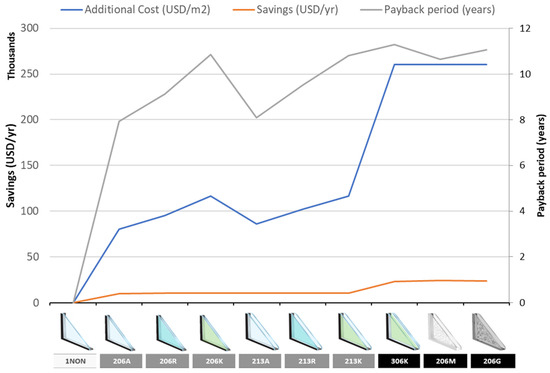
Figure 11.
Cooling loads, savings, and payback periods of selected galzing types.
5. Conclusions and Recommendations
The triple glazed window filled with krypton provided the highest energy saving. Based on the results, the study building demonstrated up to 12% of energy saving by changing the window type from single to triple glazed glass. A similar performance was observed in double glazed with air, argon, and krypton fillings. Therefore, it is reasonable to conclude that if air is used instead of krypton, the amount of energy savings will be worth promising. It will also help in reducing the payback period as krypton variants are expensive.
The economic feasibility of glazing depends on usage type of the building and building service life. Buildings that are used for a longer duration in a day and have longer service lives should be energy efficient and must use high efficiency window glazing. In addition, the window to wall ratio is important if the remaining building components have excellent insulating properties. The feasibility depends on the electricity price as well. Australia is moving towards renewable energy that might be slightly more expensive than the conventional energy sources. It can be concluded that the use of more efficient windows glazing can be feasible in near future. Based on the calibration process of this case study, it can be concluded that the insulating performance of a building enclosure plays a key role and glazing becomes feasible when the overall building is efficient. In an inefficient building, the efficiency of the windows does not play any significant role.
The common type of glazing is single glazing in Australia and efficient types of windows are not easily available in Darwin. If efficient glazing is made more common in practice, the market price can be lowered further due to bulk production and the payback period can be reduced significantly. Potential investors can be urged to invest in these projects to help in their mass production and to ensure cheaper availability to increase their demand, thus helping to conserve the environment and reduce the market price of the efficient windows.
Analyzing the effect of different shading types and the overall impact on the performance of the building can be performed. Further research on material development may result in a reduction in the U−value, which will help to reduce the cooling loads.
Author Contributions
Conceptualization, H.M.-R., A.W.M.N., M.F.R. and M.A.U.R.T.; Data curation, T.A.C.; Formal analysis, H.M.-R., T.A.C., A.W.M.N. and M.A.U.R.T.; Funding acquisition, A.W.M.N.; Investigation, T.A.C., Z.R., A.Z. and M.A.U.R.T.; Methodology, H.M.-R., T.A.C., Z.R., M.F.R. and M.A.U.R.T.; Project administration, H.M.-R. and M.A.U.R.T.; Resources, A.W.M.N.; Software, M.A.U.R.T.; Supervision, M.A.U.R.T.; Validation, Z.R. and A.Z.; Writing – original draft, Z.R., M.F.R., A.Z. and M.A.U.R.T. All authors have read and agreed to the published version of the manuscript.
Funding
This research received no external funding.
Institutional Review Board Statement
Not applicable.
Informed Consent Statement
Not applicable.
Data Availability Statement
Not applicable.
Conflicts of Interest
The authors declare no conflict of interest.
Appendix A
Figure A1 describes the climate classification of overall Australia that shows that the Darwin climate is a tropical climate.

Figure A1.
Australian climate classification showing the northern region of the Northern Territory as tropical [41].
Figure A1.
Australian climate classification showing the northern region of the Northern Territory as tropical [41].
Assumptions
There are certain assumptions that define the limits/generalization of the research carried out:
- Uniform material properties were considered, so the overall heat transfer value remained the same throughout the materials;
- The U−value of windows remained the same irrespective of the orientation of the glass;
- Perfect seals were assumed with no room for air particles or water entering the window gaps between glass panes;
- The heat transfer through the window panels was considered negligible in comparison to glass;
- The heat gain by electrical or other components was neglected;
- The occupancy of the building remains the same for all study scenarios.
- The whole building was considered to be a two-zone based on the floors as our main target was to analyze the external heat gain.
- The solar panels installed on the roof of the building were neglected.
- The building was assumed to have a VAV duct system for air conditioning.
References
- Lu, M.; Lai, J.H.K. Building energy: A review on consumptions, policies, rating schemes and standards. Energy Procedia 2019, 158, 3633–3638. [Google Scholar] [CrossRef]
- Pérez-Lombard, L.; Ortiz, J.; Pout, C. A review on buildings energy consumption information. Energy Build. 2008, 40, 394–398. [Google Scholar] [CrossRef]
- Alghoul, S.K.; Gwesha, A.O.; Naas, A.M. The Effect of Electricity Price on Saving Energy Transmitted from External Building Walls. Energy Res. J. 2016, 7, 1–9. [Google Scholar] [CrossRef] [Green Version]
- de Groote, M.; Rapf, O. The Active Role of Buildings in a Transforming Energy Market Discussion Paper; Buildings Performance Institute Europe: Brussels, Belgium, 2015; p. 20. [Google Scholar]
- Tafakkori, R.; Fattahi, A. Introducing novel configurations for double-glazed windows with lower energy loss. Sustain. Energy Technol. Assess. 2021, 43, 100919. [Google Scholar] [CrossRef]
- Forughian, S.; Aiini, M.T.S. Comparative Study of Single-glazed and Double-glazed Windows in Terms of Energy Efficiency and Economic Expenses. J. Hist. Cult. Art Res. 2017, 6, 879. [Google Scholar] [CrossRef] [Green Version]
- Peña, J.I.; Rodríguez, R. Are EU’s Climate and Energy Package 20-20-20 targets achievable and compatible? Evidence from the impact of renewables on electricity prices. Energy 2019, 183, 477–486. [Google Scholar] [CrossRef]
- NABERS. About NABERS. New South Wales Government, 2014. Available online: https://www.nabers.gov.au/about (accessed on 3 January 2022).
- Williams, F.; Wyndham, W.; Nationwide House Energy Rating Scheme* Certificate. What Is NatHERS? 2014. Available online: http://www.nathers.gov.au/ (accessed on 4 January 2022).
- WERS. Window Energy Rating Scheme—Australian Glass and Window Association. Available online: https://www.wers.net/ (accessed on 4 January 2022).
- Parsons, K. ISO standards on physical environments for worker performance and productivity. Ind. Health 2018, 56, 93–95. [Google Scholar] [CrossRef] [Green Version]
- Kirankumar, G.; Saboor, S.; Vali, S.S.; Mahapatra, D.; Setty, A.B.T.P.; Kim, K.H. Thermal and cost analysis of various air filled double glazed reflective windows for energy efficient buildings. J. Build. Eng. 2020, 28, 101055. [Google Scholar] [CrossRef]
- Ferreira, M.; Almeida, M.; Rodrigues, A.; Silva, S.M. Comparing cost-optimal and net-zero energy targets in building retrofit. Build. Res. Inf. 2016, 44, 188–201. [Google Scholar] [CrossRef]
- Frontczak, M.; Schiavon, S.; Goins, J.; Arens, E.; Zhang, H.; Wargocki, P. Quantitative relationships between occupant satisfaction and satisfaction aspects of indoor environmental quality and building design. Indoor Air 2012, 22, 119–131. [Google Scholar] [CrossRef] [Green Version]
- Zhang, H.; Arens, E.; Zhai, Y. A review of the corrective power of personal comfort systems in non-neutral ambient environments. Build. Environ. 2015, 91, 15–41. [Google Scholar] [CrossRef] [Green Version]
- Hoyt, T.; Arens, E.; Zhang, H. Extending air temperature setpoints: Simulated energy savings and design considerations for new and retrofit buildings. Build. Environ. 2015, 88, 89–96. [Google Scholar] [CrossRef] [Green Version]
- Alwetaishi, M.; Al-Khatri, H.; Benjeddou, O.; Shamseldin, A.; Alsehli, M.; Alghamdi, S.; Shrahily, R. An investigation of shading devices in a hot region: A case study in a school building. Ain Shams Eng. J. 2021, 12, 3229–3239. [Google Scholar] [CrossRef]
- Alwetaishi, M.; Taki, A. Investigation into energy performance of a school building in a hot climate: Optimum of window-to-wall ratio. Indoor Built Environ. 2019, 29, 24–39. [Google Scholar] [CrossRef]
- Valachova, D.; Zdrazilova, N.; Panovec, V.; Skotnicova, I. Using of aerogel to improve thermal insulating properties of windows. Civ. Environ. Eng. 2018, 14, 2–11. [Google Scholar] [CrossRef] [Green Version]
- Kontoleon, K.J.; Zenginis, D.G. Analysing Heat Flows Through Building Zones in Aspect of their Orientation and Glazing Proportion, under Varying Conditions. Procedia Environ. Sci. 2017, 38, 348–355. [Google Scholar] [CrossRef]
- Cots, A.; Dicorato, S.; Giovannini, L.; Favoino, F.; Manca, M. Energy Efficient Smart Plasmochromic Windows: Properties, Manufacturing and Integration in Insulating Glazing. Nano Energy 2021, 84, 105894. [Google Scholar] [CrossRef]
- Ayoosu, M.I.; Lim, Y.W.; Leng, P.C.; Idowu, O.M. Daylighting evaluation and optimisation of window to wall ratio for lecture theatre in the tropical climate. J. Daylighting 2021, 8, 20–35. [Google Scholar] [CrossRef]
- Chi, F.; Wang, Y.; Wang, R.; Li, G.; Peng, C. An investigation of optimal window-to-wall ratio based on changes in building orientations for traditional dwellings. Sol. Energy 2020, 195, 64–81. [Google Scholar] [CrossRef]
- Alwetaishi, M.; Benjeddou, O. Impact of Window to Wall Ratio on Energy Loads in Hot Regions: A Study of Building Energy Performance. Energies 2021, 14, 1080. [Google Scholar] [CrossRef]
- Cuce, E. Accurate and reliable U-value assessment of argon-filled double glazed windows: A numerical and experimental investigation. Energy Build. 2018, 171, 100–106. [Google Scholar] [CrossRef]
- Paulos, J.; Berardi, U. Optimizing the thermal performance of window frames through aerogel-enhancements. Appl. Energy 2020, 266, 114776. [Google Scholar] [CrossRef]
- ISO. ISO 19467:2017 Thermal Performance of Windows and Doors—Determi; The International Organization for Standardization: Geneva, Switzerland, 2017. [Google Scholar]
- American Society of Heating. ANSI/ASHRAE/IES Standard 90.1-2016: Energy Standard for Buildings Except Low-Rise Residential Buildings; ASHRAE: Peachtree Corners, GA, USA, 2016. [Google Scholar]
- Aguilar-Santana, J.L.; Velasco-Carrasco, M.; Riffat, S. Thermal Transmittance (U-value) Evaluation of Innovative Window Technologies. Futur. Cities Environ. 2020, 6, 12. [Google Scholar] [CrossRef]
- ISO15099:2003 (E); Thermal performance of windows, doors and shading devices-Detailed calculations Performance thermique des fenêtres, portes et stores-Calculs détaillés; The International Organization for Standardization: Geneva, Switzerland, 2003.
- Marinoski, D.L.; Güths, S.; Lamberts, R. Development of a calorimeter for determination of the solar factor of architectural glass and fenestrations. Build. Environ. 2012, 47, 232–242. [Google Scholar] [CrossRef]
- Babaizadeh, H.; Haghighi, N.; Asadi, S.; Broun, R.; Riley, D. Life cycle assessment of exterior window shadings in residential buildings in different climate zones. Build. Environ. 2015, 90, 168–177. [Google Scholar] [CrossRef]
- Huang, Y.; Niu, J.L.; Chung, T.M. Energy and carbon emission payback analysis for energy-efficient retrofitting in buildings—Overhang shading option. Energy Build. 2012, 44, 94–103. [Google Scholar] [CrossRef]
- Acosta, I.; Munoz, C.; Campano, M.A.; Navarro, J. Analysis of daylight factors and energy saving allowed by windows under overcast sky conditions. Renew. Energy 2015, 77, 194–207. [Google Scholar] [CrossRef]
- Aste, N.; Leonforte, F.; Piccolo, A. Color rendering performance of smart glazings for building applications. Sol. Energy 2018, 176, 51–61. [Google Scholar] [CrossRef]
- Cho, K.J.; Cho, D.W. Solar heat gain coefficient analysis of a slim-type double skin window system: Using an experimental and a simulation method. Energies 2018, 11, 115. [Google Scholar] [CrossRef] [Green Version]
- Yassin, A.A.; Sheta, S.A.; Wazeer, M.A.E.L. Parametric Study on Window-Wall Ratio (WWR) for Day lighting Optimization in Multi-Story Residential Buildings: Case Study of an Apartment Complex in Mansoura City, Egypt. Iarjset 2017, 4, 21–32. [Google Scholar] [CrossRef]
- Liang, R.; Kent, M.; Wilson, R.; Wu, Y. The Effect of Thermochromic Windows on Visual Performance and Sustained Attention. Energy Build. 2021, 236, 110778. [Google Scholar] [CrossRef]
- Aguilar-Santana, J.L.; Jarimi, H.; Velasco-Carrasco, M.; Riffat, S. “Review on window-glazing technologies and future prospects. Int. J. Low-Carbon Technol. 2019, 15, 112–120. [Google Scholar] [CrossRef]
- Bitaab, M.; Abardeh, R.H.; Movahhed, S. Experimental and numerical study of energy loss through double-glazed windows. Heat Mass Transf. Stoffuebertragung 2019, 56, 727–747. [Google Scholar] [CrossRef]
- Australian Building Codes Board. ABCB map of Australian Climate Zones. Building Code of Australia (BCA). 2012. Available online: http://www.abcb.gov.au/~/media/Files/DownloadDocuments/MajorInitiatives/EnergyEfficiency/ClimateZoneMaps/2012LogoUpdates/AUST_ABCB_Map_2012_v41.pdf (accessed on 4 January 2022).
- The Bureau of Meteorology. Climate statistics for Australian locations. 2022. Available online: http://www.bom.gov.au/climate/averages/tables/cw_200288_All.shtml (accessed on 4 January 2022).
- Asphaug, S.K.; Jelle, B.P.; Gullbrekken, L.; Uvsløkk, S. Accelerated ageing and durability of double-glazed sealed insulating window panes and impact on heating demand in buildings. Energy Build. 2016, 116, 395–402. [Google Scholar] [CrossRef]
- Mempouo, B.; Cooper, E.; Riffat, S.B. Novel window technologies and the Code for Sustainable Homes in the UK. Int. J. Low-Carbon Technol. 2010, 5, 167–174. [Google Scholar] [CrossRef] [Green Version]
- Calma, V. Cost of Electricity in Australia—How Are We Doing in 2020? 2020. Available online: https://www.leadingedgeenergy.com.au/news/cost-of-electricity-in-australia-in-2020/ (accessed on 4 January 2022).
- O’Dea, D. 85% of Windows going into Australian Homes are Single Glazed in 2017? Linkedin 2017. Available online: https://www.fabricfirst.com.au/post/85-of-windows-going-into-australian-homes-are-single-glazed-in-2017 (accessed on 2 January 2022).
Publisher’s Note: MDPI stays neutral with regard to jurisdictional claims in published maps and institutional affiliations. |
© 2022 by the authors. Licensee MDPI, Basel, Switzerland. This article is an open access article distributed under the terms and conditions of the Creative Commons Attribution (CC BY) license (https://creativecommons.org/licenses/by/4.0/).