Abstract
The objective of the study was the translation and adaptation into Arabic language of the Questionnaire on Teacher Interaction and the examination of psychometric properties among students in Tunisia. A set of students (N = 778) were recruited to complete a translated, Arabic version of the Teacher Interaction Questionnaire (AQTI). The subjects represented both female and male with an average age of 15.98 ± 2.17 years. The subjects were divided into exploratory (N = 226) and confirmatory (N = 552) samples. For the exploratory sample, the female sex represented 46.90% and the male 53.10% (N = 120). Likewise, the confirmatory sample consisted of females (48.01%) and males (51.99%). The scale designed in Arabic AQTI presented eight components for exploratory factor analysis. The result was a first factorial solution, which kept these eight components of the predetermined instrument. The confirmatory factor analysis provided good fit indices. Similar results for instrument reliability were confirmed for all dimensions, through good Cronbach’s coefficient, which were superior to 0.80. The Arabic version of AQTI is valid and reliable and can be administered to assess teacher/student interactions in Tunisia. However, further research needs to examine the construct validity of the instrument.
1. Introduction
Teacher–student relationships play a significant role in the quality of teaching and learning at school [1,2], especially when they are facilitated by the natural environment [3]. Indeed, several recent studies confirmed the presence of direct and indirect links between teacher–student relationships and student performance in several school subjects [4,5], their emotions [6] and even their social behaviors [7]. Moreover, natural environments usually seem to be used by schools to increase these factors, because the contact with nature makes individuals more susceptible to cooperation and creates new awareness [8]. As an example, in mathematics, in a recent study, Semeraro et al. [9] showed that the quality of the student–teacher relationship has an indirect influence on student achievement through the mediation of anxiety. Iotti et al. [10] showed that, in adolescent, students who are concerned about having a good relationship with their teachers may be more motivated to engage in good social relationships with the others. In addition, emotional support in the classroom is significantly positively associated with the growth of children’s attention and perseverance in different age groups [11].
In fact, it has been shown that daily interpersonal interactions in the classroom are the building blocks of teacher–student relationships [12]. Good interaction between teachers and students creates good relationships in the classroom and contribute to effective learning. According to Bucholz and Sheffler [13], teachers can transform the classroom into a more comfortable environment where students feel more relaxed and do their best. Hence, their learning abilities are improved. In addition, in a recent meta-analysis, Vandenbroucke et al. [14] established a link between student performance in the executive functions of the cognitive process and qualitative teacher–child interactions. These authors suggested that teachers can promote an essential cognitive process for learning by modifying their behavior and creating an emotionally positive, structured and cognitively stimulating classroom environment.
2. Literature Review
Successful teachers can feel changes in student behavior and understand their needs in the classroom [15]. Teacher–student relationships were shown in numerous studies to be associated with cognitive learning outcomes, student motivation [16] and well-being in teachers [17]. In fact, several studies reported that good interpersonal relationships between teachers and students are positively associated with teacher satisfaction with their profession and the prevention of burnout [18,19,20].
Green learning, associated with outdoor physical activity experiences, deeply activates cognitive processes that promote and even strengthen a good interaction between teachers and students and contribute to effective learning.
Given the importance of this teacher–student interaction, several measurement instruments were developed and validated to assess the concept for the different levels of study. Indeed, several questionnaires were validated over time to assess students’ perception. As an example, Fraser [21] reported the Individualized Classroom Environment Questionnaire (ICEQ), the Science Laboratory Environmental Inventory (SLEI), the Constructivist Learning Environment Survey (CLES) and the Questionnaire on Teacher Interaction (QTI). Today, the QTI remains the most widely used instrument in the field. Originally, the instrument was in Dutch [22], and then it was submitted to and translated for a wide range of revisions and adaptations [23,24,25,26]. The instrument is based on a model of interpersonal teacher behavior and was designed to measure the perception of student–teacher relationships, an important aspect of interpersonal communication in the classroom [27]. The questionnaire measures the eight possible behaviors of teachers, namely: “Leadership”, “Helping/Friendly”, “Understanding”, “Student Responsibility/Freedom”, “Uncertain”, “Dissatisfied”, “Admonishing” and “Strict Behavior”.
QTI was originally developed in Dutch [21]; it has been adapted and translated into several other languages, including American English [28], Australian English [29], Malay [30], Turkish [31], Greek [32], Italian [33] and Chinese [34]. In addition, Den Brok et al. [35] carried out a transnational validation in six countries: The Netherlands, the United States, Australia, Slovakia, Singapore and Brunei.
Although the QTI has been translated and validated in many languages and in various populations, the instrument has not yet received validation in the Arabic language. In addition, to our knowledge, no paper has examined the instrument in the specific context of physical education. Indeed, physical education is a supportive classroom environment that emphasizes cooperation and openness between teachers and students in the presence of physical knowledge and practice simultaneously. Therefore, when learning and being taught, students are allowed to interact with teachers, their classmates and their environment, which is not true in other subjects. In addition, recent studies showed links between student motivations in similar environments such as virtual field trips [36].
The objective of the present study was to adapt an Arabic language version of QTI and verify the psychometric properties of this instrument in terms of validity and reliability in the context of physical and sports education.
3. Materials and Methods
3.1. Participants and Ethics
A set of middle and high school students (N = 778) were recruited for the present study. Students were enrolled in five colleges and four high schools in the greater Tunis region. The age of the subjects varied between 12 and 19 years with an average of 15.98 ± 2.17 years. The subjects were distributed over two exploratory (N = 226) and confirmatory (N = 552) samples. For the exploratory sample, the female sex represented 46.90% (N = 106) of the population and the male 53.10% (N = 120). Likewise, the confirmatory sample consisted of females (N = 265; 48.01%) and males (N = 287; 51.99%). Students represented seven different educational levels and three different socioeconomic levels (low, medium and high) while the size of the classes varied between 27 and 36 students.
The current investigation’s research protocol was approved by the Higher Institute of Sport and Physical Education in Ksar Said, Tunisia. All participants in this research gave their written, informed consent. The current inquiry followed the ethical guidelines outlined in the 2013 Helsinki Declaration.
3.2. Arabic Questionnaire on Teacher Interaction: AQTI
In the present study, an adapted Arabic version of the QTI (48 items) [34] was used to collect the data. The QTI was originally designed in Dutch and consists of a set of 77 items [21] to measure pupils’ perceptions of their teachers (and teachers’ self-perception of level of agency and communication that they pass on to the classroom).
The questionnaire is based on a model which describes the interpersonal behavior of teachers according to two orthogonal dimensions: Influence, which describes the degree of control over the communication process (Dominance–Submission), and Proximity, which represents the degree of affinity and cooperation felt by communicators (Opposition–Cooperation).
The two dimensions of the initial version of QTI are divided into eight different facets of teacher behavior: Leadership, Helping/Friendly, Understanding, Student Responsibility/Freedom, Uncertain, Dissatisfied, Admonishing and Strict Behavior. These different facets form the axes of a coordinate system in a circle of eight sectors for the two dimensions listed below. Questionnaire items are rated on a Likert-type scale of one to five points, delimited by the responses “Never” and “Always”.
This first version has undergone several cross-cultural adaptations and validations with stable psychometric properties. As an example, an American version consisting of 64 elements was built in 1988 [25], and another version, designed in Australia, consisting of 48 elements, followed in 1995 [35]. This Australian-English-language version of the measurement tool contained 48 items and was used in several studies involving different classes in Western Australia, Tasmania and other countries [36,37,38]. These studies confirmed the psychometric robustness of the instrument in terms of reliability and validity when used in multiple grade levels.
3.3. Procedures
A committee made up of two English language teachers, an Arabic language teacher and an academic specializing in human sciences translated the measuring instrument. A reverse translation procedure was conducted to see the robustness of the adapted version and to adjust the items if there were any anomalies [39].
Responses to the questionnaires were collected over a period of one month following agreements made by school principals and teachers of physical education and sports.
We allocated approximately 30 min to each volunteer participant to answer the instrument items after the physical education sessions and in the absence of the teacher.
3.4. Statistical Analysis
All statistical analyses were conducted on IBM SPSS version 26.0 software and IBM SPSS Amos software version 25.0.
The significance level was set at 0.05 for all statistical tests performed, and all descriptive statistics were represented by means and standard deviations for the different dimensions of the measurement scale.
Preliminary analysis of numerical data on both exploratory and confirmatory samples was performed to examine the quality of the data collected and inspect for any anomalies or missing boxes. Missing data were excluded from the analysis. Subsequently, tests for univariate (Skewness and Kurtosis) and multivariate normality by Mardia’s coefficient were performed, and descriptive statistics for each variable were completed for both samples.
For the present study, we treated for the cross-cultural validation of the tool: exploratory factor analysis, the stability of the instrument to confirmatory factor analysis and the internal consistency of the designed version.
The exploratory factor analysis was performed by the principal component analysis extraction method with eigenvalues greater than 1 and a vari-max rotation with Kaiser’s normalization. The factors were retained after analysis for the Kaiser–Mayer–Oklins index (KMO) >0.80 and a significant chi-square value [40].
Internal consistency of the constructs of the tool was checked by Cronbach’s alpha coefficient. Tabachnick and Fidell [41] suggested a value of 0.70 to accept the model in the humanities. The questionnaire structure for the entire population was achieved by confirmatory factor analysis (CFA). Several indices of the CFA were retained to examine the model: (a) the χ2; (b) χ2/DF; (c) the comparative fit index (CFI); (d) the Tucker–Lewis index (TLI); and (e) the approximation mean squared error (RMSEA).
The recommendations of Hu and Bentler (1999) [42] suggested values greater than 0.95 for CFI and TLI and, for RMSEA, values <0.08 for reasonable fits.
4. Results
4.1. Descriptive Statistics for the Exploratory Sample
Table 1 shows the means, standard deviations (SD), Skewness and Kurtosis normality indices for the 48 TIQA items. The items did not present any abnormality at the Skewness and Kurtosis level (between −1 and 1); therefore, the normality of the data was ensured.

Table 1.
Descriptive statistics for the exploratory sample (N = 226).
4.2. Exploratory Factor Analysis
The 48 items of the AQTI were exposed to exploratory factor analysis by the principal component analysis method with a vari-max rotation. The adequacy of the sampling was supported by the index KMO = 0.86 (Kaiser–Meyer–Olkin), which measured the quality of sampling and the quality of the correlation matrices by the significant Bartlett test (x2 = 842,312.87, p < 0.001).
The component statistics, the Kaiser-Meyer-Olkin (KMO) Measure of Sampling Adequacy and Bartlett’s test of Sphericity, are presented in Table 2. One the eight extracted factors accounted for 73.12% of the total variance.
Table 2.
Component statistics, Bartlett’s test of sphericity, Kaiser–Meyer–Olkin measure of the factor analysis for considered variables.
The first component extracted explained 16.3% of the variance for an eigenvalue = 7.69, while the last component explained 3.86% of the total variance for an eigenvalue = 1.85. All eight factors explained 73.12% of the total variance. An examination of the scree plot was performed to determine the number of factors to retain to explain the more than 70% cumulative variance. A scree plot displays the eigenvalues in a downward curve, ordering the eigenvalues from largest to smallest. The importance of each component extracted is given by the percent of variance explained (by each component), and our scree plot confirmed the presence of eight factors (Figure 1).
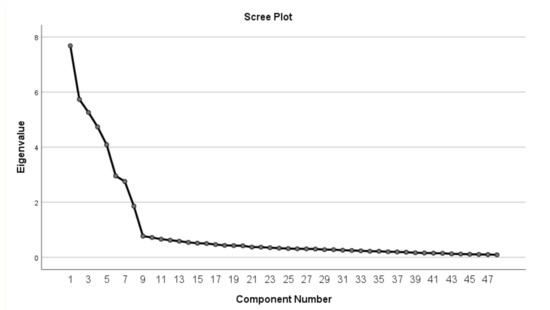
Figure 1.
Scree plot of the components (AQTI).
4.3. The Correlation Matrix
The correlation matrix between the eight components showed a strong positive correlation between the four components of the first dimension, while moderate correlations were demonstrated between the four components of the second dimension. In addition, the orthogonality between the two dimensions was presented by the values of the Pearson correlation coefficients (Table 3).
Table 3.
Correlation matrix of the eight components.
4.4. Reliability of Scale
The reliability of the scale was tested by checking its internal consistency using Cronbach’s alpha for each factor. All indices were good to excellent. The smallest alpha value was for Uncertain (0.82), while the largest value was for Strict Behavior, which was 0.94 (Table 4).
Table 4.
Internal consistency of the AQTI.
4.5. Confirmatory Factor Analysis
In this part of the study, we tested the stability of the instrument by first and second order factor analysis. Before performing the factor analysis for first and second order factor models, we examined the normality of the data distributions for each item and the multivariate normality. The analysis revealed that the univariate normality was adequate with Skewness values close to 1. In addition, the Kurtosis coefficients did not exceed 2 with a superior value of 1.73 for item 24, while the Mardia’s coefficient of multivariate normality was 31.17 with a Cr of 5.33. We then performed a first order confirmatory factor analysis (CFA) using the robust maximum likelihood estimation method.
Figure 2 describes the different relationships of the model, as well as the adjustment measures of the constructs in the AQTI questionnaire. The fit of the model was tested using several fit indices. By using models of structural equations for testing, the null hypothesis was established so that a precedent expects the null value not to be rejected.
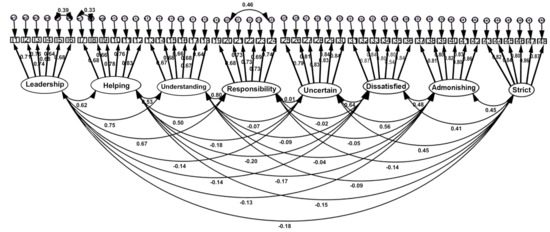
Figure 2.
First order confirmatory factor analysis of the AQTI scale. All parameters are standardized and significant at p < 0.01.
The adequacy of an item in factorial modelling is given by a high factor loading. Comrey and Lee (2013) [43] suggested that a factor weight greater than 0.71 is considered excellent, superior to 0.63 is considered very good, greater than 0.55 is considered acceptable and less than 0.45 is considered poor. All the factor weights of the 48 AQTI items varied between acceptable and excellent.
The first order model converged with chi2 value = 1441, 38 (ddl = 1049). The value of chi2/DF = 1.37, the GFI index was 0.90 and the AGFI index value was 0.89. However, the CFI was 0.98 and TLI was 0.97, which are values that exceed the recommended threshold of 0.95. In addition, the two indexes, RMR and RMSEA, were, respectively, 0.030 and 0.026.
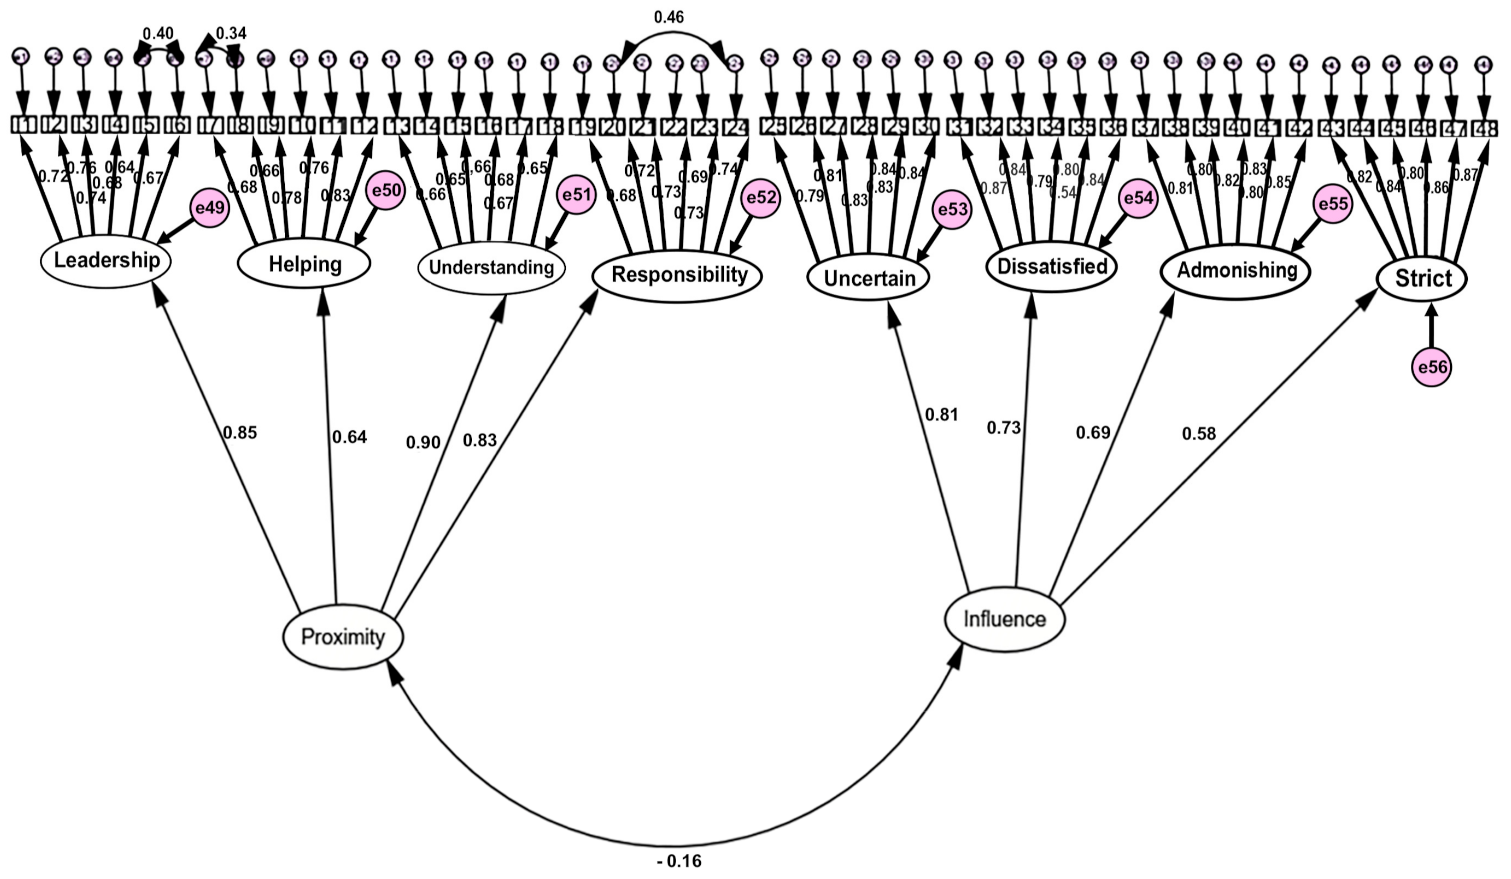
The adjustment indices revealed a satisfactory chi2/df index with a value of 1.42 (chi2 = 1512.51; df = 1069), while the GFI, AGFI, CFI and TLI indices were of values 0.90, 0.89, 0.98 and 0.97, respectively, which are values that match the recommended threshold. The two indices relating to RMR and RMSEA errors were, respectively, 0.046 and 0.027 (Figure 3).

Figure 3.
Second order confirmatory factor analysis of the AQTI scale. All parameters are standardized and significant at p < 0.01.
All the fit indices among the first and second order factor analysis were close to the values recommended in the literature [41,44]. Therefore, the results of the indices from the AFC showed a factor structure consistent with the theoretical model tested for the developed version of the measurement scale.
5. Discussion
The Tunisian context of the QTI scale: the initial scale designed in Arabic AQTI, which presents the eight-dimensional factors, was evaluated using a population of both male and female students in college and high school, aged around 16 years. For the exploratory sample, the female sex represented 46.90% and the male 53.10%. Likewise, the confirmatory sample consisted of females (48.01%) and males (51.99%). The stability of the instrument was initially established by exploratory factor analysis, which resulted in an initial factor solution which kept the eight factors. Then, the adapted model of the TIQA in Arabic was estimated by confirmatory factor analysis; the GFI/AGFI indices were adequate (above 0.90) as an acceptance threshold. Likewise, the two CFI and TLI indices were above the recommended value of 0.95, and the two error thresholds, RMR and RMSEA, were below 0.08. These results proved the robustness of the factor structure of the instrument on both exploratory and confirmatory levels. The consistency values for all eight dimensions were all adequate and greater than 0.80, which established the reliability of the instrument. In addition, the results showed that, when the individual ratings of the observable variables were used, two independent dimensions, Proximity, and Influence, explained the eight scales. Our results agreed with those of a recent Spanish study, which is among the few studies to have confirmed the reliability and structural validity of the adapted version in Spanish for upper elementary, cycle two (QTI-P) students through the factor analysis of confirmation. In another study, which involved a very large sample which contained 44,415 pupils and 1913 teachers in 207 schools, Den et al. [35] performed a one-dimensional and multidimensional confirmatory factor analysis on instrument components with a specification of the template and with a free template.
The best-fit indices were obtained for the free, two-dimensional model (chi2 = 1290.9, TLI = 0.99, CFI = 0.96, RMSEA = 0.05). However, the QTI-P retained 31 of the original 48 items, distributed across the eight scales [45]. In line with our results, Sivan et al. [45] confirmed the 48-item Chinese version of the Teacher Interaction Questionnaire (C-QTI) with two samples of primary school students in Hong Kong. Exploratory and confirmatory factorial results supported the eight-factor, 48-item structure. Likewise, the 48-item measure had acceptable internal consistency reliability; however, the authors found low reliability coefficients for four scales. The results of the factor analyses were also consistent with several previous research works carried out with high school students in several countries through exploratory, confirmatory factor analyses and the study of the matrix of structures, in addition to reliability: for example, Australia, Singapore, Brunei [35], Korea [46] and China [47], as well as among primary school pupils in Cyprus [32].
In contrast, in a similar study in Greece, Kokkinos et al. [32] reported confirmatory factor analysis results that did not seem to adequately support the construct validity of the 48-item scale adapted for a population of a primary school students in Greece; confirmatory factor analysis, guided by the theory of structural equation modelling, led to a 27-item instrument that presented more robust reliability and validity indices in terms of instrument psychometry.
For instrument reliability, Sivan et al. [45] failed to confirm consistency for four components of the scale. Likewise, Passini et al. [33] demonstrated for reliability (through the coefficients of internal consistency of individual student scores) that, for the eight components, seven out of eight were acceptable. This can be explained by the fact that the QTI items for elementary school students are formulated in simple language to minimize comprehension difficulties [27]; its application for middle and high school students could give more results that are relevant.
For the correlation between the components of the scale, Scott and Fisher [30], in Malaysia, reported similar results with strong positive correlations for the first factor and moderate correlations for the second factor. Likewise, Telli et al. [31] proved that the correlation between the two dimensions was statistically insignificant with a low coefficient of association. Thus, based on what was discussed, educational institutions must acknowledge the importance of evaluating the relationship between teachers and students [48,49] to promote and facilitate learning and encourage the child to be physically active [50].
Limitations of the Study
This study had certain limitations that must be taken into account. First, we carried out the study only on a Tunisian population; future research should target other students in other Arab countries. Second, we treated neither the convergent validity nor the concurrent validity of the instrument with other similar measures. In addition, the sensitivity of the instrument was not verified in this study.
6. Conclusions
In conclusion, the eight extracted components explained 73.12% of the variance and had an overall KMO index equal to 0.863. These findings confirm that the adapted version, AQTI, can be used to assess interactions between teachers and students in middle and high school. However, more work is needed to test the version in other Arab populations and for other school subjects.
Author Contributions
Conceptualization, S.B. (Samia Boukari), N.G. and S.G.C.; methodology, S.B. (Sami Bouzid) and N.G.; software, A.K.; validation, S.B. (Samia Boukari), S.G.C., A.M. and R.K.; formal analysis, N.G. and R.K.; investigation, S.B. (Samia Boukari); resources, S.B. (Sami Bouzid) and S.B. (Samia Boukari); data curation, R.K.; writing—original draft preparation, S.B. (Samia Boukari), A.K. and S.G.C.; writing—review and editing, S.B. (Sami Bouzid), R.K. and A.M.; visualization, A.K.; supervision, R.K. and A.M.; project administration, S.B. (Samia Boukari), S.B. (Sami Bouzid) and A.K; methodology, S.B. (Samia Boukari) and N.G.; funding acquisition, S.B. (Samia Boukari). All authors have read and agreed to the published version of the manuscript.
Funding
This research received no external funding.
Institutional Review Board Statement
The study was conducted in accordance with the Declaration of Helsinki and approved by the Institutional Review Board of Research Unit (UR17JS01) Sport Performance, Health & Society, Higher Institute of Sport and Physical Education, Ksar-Saîd University.
Informed Consent Statement
Not applicable.
Data Availability Statement
The raw data supporting the conclusions of this article will be made available by the authors without undue reservation.
Acknowledgments
The authors would thank all subjects for their active contribution in this study.
Conflicts of Interest
The authors declare no conflict of interest.
References
- Ascione, A.; Di Palma, D. Sense-motor didactics to stimulate educational development in formative contexts. G. Ital. Educ. Alla Salut. Sport Didatt. Inclusiva 2021, 5, 38–48. [Google Scholar]
- Latino, F.; Fischetti, F.; Colella, D. Lߣinfluenza dellߣattività fisica sulle funzioni cognitive e sulle prestazioni scolastiche tra i ragazzi in età scolare: Una revisione della letteratura. Form. Insegn. 2020, 3, 124–134. [Google Scholar] [CrossRef]
- Latino, F.; De Candia, M.; Morano, M.; Carvutto, R. The impact of an extracurricular outdoor physical activity program on long-term memory in adolescent during COVID-19 pandemic. J. Hum. Sport Exerc. 2021, 16, 1114–1125. [Google Scholar]
- Scales, P.C.; Pekel, K.; Sethi, J.; Chamberlain, R.; Van Boekel, M. Academic Year Changes in Student-Teacher Developmental Relationships and Their Linkage to Middle and High School Students’ Motivation: A Mixed Methods Study. J. Early Adolesc. 2020, 40, 499–536. [Google Scholar] [CrossRef]
- Jeffrey, A.J.; Richard, W.A.; Jennifer, L. Pepperell. If We’re Ever in Trouble They’re Always There A Qualitative Study of Teacher-Student Caring. Elem. Sch. J. 2013, 114, 100–117. [Google Scholar] [CrossRef]
- Goetz, T.; Bieleke, M.; Gogol, K.; van Tartwijk, J.; Mainhard, T.; Lipnevich, A.A.; Pekrun, R. Getting along and feeling good: Reciprocal associations between student-teacher relationship quality and students’ emotions. Learn. Instr. 2021, 71, 101349. [Google Scholar] [CrossRef]
- Longobardi, C.; Settanni, M.; Lin, S.; Fabris, M.A. Student-teacher relationship quality and prosocial behaviour: The mediating role of academic achievement and a positive attitude towards school. Br. J. Educ. Psychol. 2021, 91, 547–562. [Google Scholar] [CrossRef] [PubMed]
- Latino, F.; Fischetti, F.; Cataldi, S.; Monacis, D.; Colella, D. The Impact of an 8-Weeks At-Home Physical Activity Plan on Academic Achievement at the Time of COVID-19 Lock-Down in Italian School. Sustainbility 2021, 13, 5812. [Google Scholar] [CrossRef]
- Semeraro, C.; Giofre’, D.; Coppola, G.; Lucangeli, D.; Cassibba, R. The role of cognitive and non-cognitive factors in mathematics achievement: The importance of the quality of the student-teacher relationship in middle school. PLoS ONE 2020, 15, e0231381. [Google Scholar] [CrossRef] [Green Version]
- Iotti, N.O.; Thornberg, R.; Longobardi, C.; Jungert, T. Early Adolescents’ Emotional and Behavioral Difficulties, Student–Teacher Relationships, and Motivation to Defend in Bullying Incidents. Child Care Q. 2019, 49, 59–75. [Google Scholar] [CrossRef] [Green Version]
- Hu, B.Y.; Wu, Z.; Winsler, A.; Wu, Y.; Fan, X. Teacher–child Interaction and Preschoolers’ Learning Behavior in China: A Piecewise Growth Model. Early Educ. Dev. 2021, 32, 677–694. [Google Scholar] [CrossRef]
- Pennings, H.J.; Brekelmans, M.; Sadler, P.; Claessens, L.C.; van der Want, A.C.; van Tartwijk, J. Interpersonal adaptation in teacher-student interaction. Learn. Instr. 2018, 55, 41–57. [Google Scholar] [CrossRef]
- Bucholz, J.L.; Julie, L.S. Creating a warm and inclusive classroom environment: Planning for all children to feel welcome. Electron. J. Incl. Educ. 2009, 2, 1–13. [Google Scholar]
- Vandenbroucke, L.; Spilt, J.; Verschueren, K.; Piccinin, C.; Baeyens, D. The Classroom as a Developmental Context for Cognitive Development: A Meta-Analysis on the Importance of Teacher–Student Interactions for Children’s Executive Functions. Rev. Educ. Res. 2017, 88, 125–164. [Google Scholar] [CrossRef] [Green Version]
- Ahmad, C.N.C.; Shaharim, S.A.; Abdullah, M.F.N.L. Teacher-student interactions, learning commitment, learning environment and their relationship with student learning comfort. J. Turk. Sci. Educ. 2017, 14, 57–72. [Google Scholar]
- Roorda, D.L.; Koomen, H.M.; Spilt, J.L.; Oort, F.J. The influence of affective teacher–student relationships on students’ school engagement and achievement: A meta-analytic approach. Rev. Educ. Res. 2011, 81, 493–529. [Google Scholar] [CrossRef]
- Veldman, I.; van Tartwijk, J.; Brekelmans, M.; Wubbels, T. Job satisfaction and teacher–student relationships across the teaching career: Four case studies. Teach. Teach. Educ. 2013, 32, 55–65. [Google Scholar] [CrossRef]
- Saloviita, T.; Pakarinen, E. Teacher burnout explained: Teacher-, student-, and organisation-level variables. Teach. Teach. Educ. 2021, 97, 103221. [Google Scholar] [CrossRef]
- Madigan, D.J.; Kim, L.E. Towards an understanding of teacher attrition: A meta-analysis of burnout, job satisfaction, and teachers’ intentions to quit. Teach. Teach. Educ. 2021, 105, 103425. [Google Scholar] [CrossRef]
- Dias, P.C.; Peixoto, R.; Cadime, I. Associations between burnout and personal and professional characteristics: A study of Portuguese teachers. Soc. Psychol. Educ. 2021, 24, 965–984. [Google Scholar] [CrossRef]
- Fraser, B.J.; Malone, J.A.; Neale, J.M. Neale. Assessing and improving the psychosocial environment of mathematics classrooms. J. Res. Math. Educ. 1989, 20, 191–201. [Google Scholar] [CrossRef]
- Wubbels, T.; Creton, H.A.; Hooymayers, H.P. Discipline problems of beginning teachers, interactional teacher behavior mapped out. Abstr. Resour. Educ. 1985, 20. ERIC document 260040. [Google Scholar]
- Goh, S.C.; Eraser, B.J. Validation of an Elementary School Version of the Questionnaire on Teacher Interaction. Psychol. Rep. 1996, 79, 515–522. [Google Scholar] [CrossRef]
- Coll, R.K.; Taylor, N.; Fisher, D.L. An Application of the Questionnaire on Teacher Interaction and College and University Classroom Environment Inventory in a Multicultural Tertiary Context. Res. Sci. Technol. Educ. 2002, 20, 165–183. [Google Scholar] [CrossRef]
- Den Brok, P.; Fisher, D.; Brekelmans, M.; Rickards, T.; Wubbels, T.; Levy, J.; Waldrip, B. Students’ perceptions of secondary science teachers’ interpersonal style in six countries: A study on the cross-national validity of the Questionnaire on Teacher Interaction. In Proceedings of the Annual Meeting of the National Association for Research in Science Teaching (NARST) 2003, Philadelphia, PA, USA, 23–26 March 2003. [Google Scholar]
- Ziqiang, X.; Chongde, L.; Guoliang, Y. Preliminary revising and application of the questionnaire on teacher interaction. Psychol. Sci. 2000, 23, 404–407. [Google Scholar]
- Goh, S.C. Introducing a model of interpersonal teacher behaviour. Teach. Learn. 1994, 15, 30–40. [Google Scholar]
- Wubbels, T.; Levy, J. A comparison of interpersonal behavior of Dutch and American teachers. Int. J. Intercult. Relat. 1991, 15, 1–18. [Google Scholar] [CrossRef]
- Levy, J.; Wubbels, T. Do you know what you look like? In Interpersonal Relationships in Education; Routledge: London, UK, 2005. [Google Scholar]
- Scott, R.H.; Fisher, D.L. Development, validation and application of a Malay translation of an elementary version of the Questionnaire on Teacher Interaction. Res. Sci. Educ. 2004, 34, 173–194. [Google Scholar] [CrossRef]
- Telli, S.; Den Brok, P.; Cakiroglu, J. Students’ perceptions of science teachers’ interpersonal behaviour in secondary schools: Development of a Turkish version of the Questionnaire on Teacher Interaction. Learn. Environ. Res. 2007, 10, 115–129. [Google Scholar] [CrossRef] [Green Version]
- Kokkinos, C.M.; Charalambous, K.; Davazoglou, A. Interpersonal teacher behaviour in primary school classrooms: A cross-cultural validation of a Greek translation of the Questionnaire on Teacher Interaction. Learn. Environ. Res. 2009, 12, 101–114. [Google Scholar] [CrossRef]
- Passini, S.; Molinari, L.; Speltini, G. A validation of the Questionnaire on Teacher Interaction in Italian secondary school students: The effect of positive relations on motivation and academic achievement. Soc. Psychol. Educ. 2015, 18, 547–559. [Google Scholar] [CrossRef]
- Sun, X.; Mainhard, T.; Wubbels, T. Development and evaluation of a Chinese version of the Questionnaire on Teacher Interaction (QTI). Learn. Environ. Res. 2017, 21, 1–17. [Google Scholar] [CrossRef] [Green Version]
- Den Brok, P.; Brekelmans, M.; Wubbels, T. Multilevel issues in research using students’ perceptions of learning environments: The case of the Questionnaire on Teacher Interaction. Learn. Environ. Res. 2006, 9, 199–213. [Google Scholar] [CrossRef]
- Cheng, K.-H.; Tsai, C.-C. A case study of immersive virtual field trips in an elementary classroom: Students’ learning experience and teacher-student interaction behaviors. Comput. Educ. 2019, 140, 103600. [Google Scholar] [CrossRef]
- Fisher, D.; Fraser, B.J.; Wubbels, T. Interpersonal teacher behavior and school environment. In Do you know what you look like? Interpersonal Relationships in Education.; Routledge: London, UK, 1993; pp. 103–112. [Google Scholar]
- Fisher, D.; Fraser, B.; Cresswell, J. Using the questionnaire on teacher interaction in the professional development of teachers. Aust. J. Teach. Educ. 1995, 20, 8–18. [Google Scholar] [CrossRef]
- Hambleton, R.K.; Kanjee, A. Increasing the validity of cross-cultural assessments: Use of improved methods for test adaptations. Eur. J. Psychol. Assess. 1995, 11, 147–157. [Google Scholar] [CrossRef]
- Cho, G.; Hwang, H.; Sarstedt, M.; Ringle, C.M. Cutoff criteria for overall model fit indexes in generalized structured component analysis. J. Mark. Anal. 2020, 8, 189–202. [Google Scholar] [CrossRef]
- Tabachnick, B.G.; Fidell, L.S. Using Multivariate Statistics. Northridge; Harper Collins: New York, NY, USA, 1996. [Google Scholar]
- Hu, L.-T.; Bentler, P.M. Cutoff criteria for fit indexes in covariance structure analysis: Conventional criteria versus new alternatives. Struct. Equ. Model. Multidiscip. J. 1999, 6, 1–55. [Google Scholar] [CrossRef]
- Comrey, A.L.; Howard, B.L. A First Course in Factor Analysis; Psychology Press: New York, NY, USA, 1992. [Google Scholar]
- Orçan, F. Exploratory and confirmatory factor analysis: Which one to use first? J. Meas. Eval. Educ. Psychol. 2018, 9, 414–421. [Google Scholar]
- Sivan, A.; Chan, D.W.K.; Kwan, Y.W. Psychometric Evaluation of the Chinese Version of the Questionnaire on Teacher Interaction (C—QTI) in Hong Kong. Psychol. Rep. 2014, 114, 823–842. [Google Scholar] [CrossRef]
- Bacete, F.J.G.; Remírez, J.F.R. Validación en español del Questionnaire on Teacher Interaction en los cursos superiores de educación primaria (QTI-P) y cómo esta interacción influye en el rendimiento académico. An. Psicol. Ann. Psychol. 2021, 37, 101–113. [Google Scholar] [CrossRef]
- Kim, H.-B.; Darrell, L.F.; Barry, J.F. Classroom environment and teacher interpersonal behaviour in secondary science classes in Korea. Eval. Res. Educ. 2000, 14, 3–22. [Google Scholar] [CrossRef]
- Wei, M.; den Brok, P.; Zhou, Y. Teacher interpersonal behaviour and student achievement in English as a Foreign Language classrooms in China. Learn. Environ. Res. 2009, 12, 157–174. [Google Scholar] [CrossRef] [Green Version]
- Bonavolontà, V.; Cataldi, S.; Latino, F.; Carvutto, R.; De Candia, M.; Mastrorilli, G.; Messina, G.; Patti, A.; Fischetti, F. The Role of Parental Involvement in Youth Sport Experience: Perceived and Desired Behavior by Male Soccer Players. Int. J. Environ. Res. Public Health 2021, 18, 8698. [Google Scholar] [CrossRef]
- Gallotta, M.C.; Bonavolontà, V.; Guidetti, L.; Baldari, C.; Innocenti, L.; Cardinali, L.; Falcioni, L.; di Fronso, S.; Emerenziani, G.P.; Zimatore, G.; et al. Initial validation of the Italian version of the Volition in Exercise Questionnaire (VEQ-I). PLoS ONE 2021, 16, e0249667. [Google Scholar] [CrossRef] [PubMed]


Publisher’s Note: MDPI stays neutral with regard to jurisdictional claims in published maps and institutional affiliations. |
© 2022 by the authors. Licensee MDPI, Basel, Switzerland. This article is an open access article distributed under the terms and conditions of the Creative Commons Attribution (CC BY) license (https://creativecommons.org/licenses/by/4.0/).