Abstract
This research aimed to develop an effective algorithm to minimize the energy use of vertical transportation in elevators while controlling the number of passengers in the elevator waiting area and the number of passengers in the elevator during rush hour, thus maintaining social distancing to limit the spread of COVID-19. A mobile application and Internet of Things (IoT) devices were used to electronically communicate between the elevator’s control system and the passengers. IoT devices were used to reduce the number of passengers waiting for an elevator and passengers’ waiting time, while the energy consumption of the lift was reduced by using passenger scheduling and elevator stopping strategies. Three mathematical models were formulated to represent the different strategies used to cause the elevator to stop. These strategies were normal (allowing the elevator to stop at every floor), odd–even (some elevators are allowed to stop at odd floors and others are allowed to stop at even floors of the building), and high–low (some elevators are allowed to stop at high floors and others are allowed to stop at low floors of the building). Lingo v.11 and the differential evolution algorithm (DE) were used to address the optimal scheduling of the passengers and the elevators. The computational results show that the odd–even strategy had a 13.91–23.71% lower energy consumption compared with the high–low and normal strategies. Furthermore, the use of DE consumed 6.67–7.99% less energy than the use of Lingo.v11. Finally, the combination of DE and the designed application reduced the number of waiting passengers, the average passenger waiting time, and the total energy consumption by 74.55%, 75.12%, and 45.01%, respectively.
1. Introduction and Related Work
1.1. Research Motivation
Climate change is the most important problem that currently faces the world. Greenhouse gas (GHG) emissions are the most significant factor in the climate change problem. There are many sources of GHGs, such as transportation, livestock, manufacturing, and electricity usage [1]. In urban environments, high-rise buildings are designed and constructed to solve the problem of limited area. There are more than 4 million high-rise buildings across the world, and they are used as residential buildings and office buildings [2]. High-rise buildings consume enormous amounts of electricity and cause more significant GHG emissions than low-rise buildings [3]. Elevators in high-rise building consume about 4–7% of the total energy of the building [4]. For example, in a group of six elevators in a high-rise building, the yearly consumption of electricity was around 138,240 kWh, which equals an emission of 67.35 ton CO2eq [5]. Therefore, making the energy consumption of elevators in high-rise buildings more efficient will lead to a reduction in GHG emissions and contribute to establishing sustainable cities across the world [6,7,8].
The use of elevators (lifts) in high office buildings generates several problems, which are: (1) the high electricity consumption for the transportation of office workers to their office, and (2) the fact that, during rush hour, office workers must wait and use a lift at the same time. The second factor generates two problems during rush hour, especially in relation to the COVID-19 pandemic: (1) the spread of COVID-19 amongst individuals waiting for the lift, in the lift waiting area, and between the high density of people in the same lift, and (2) making the average waiting time for a lift user high due to the large number of passengers simultaneously congregating in the waiting area. In this study, we solve these problems via the following: (1) By reducing the waiting time and the number of passengers that are waiting and using the lift simultaneously using a lift booking application, which will inform the passenger of the time to arrive at the waiting area, their lift number, the time of the lift they should take, and the time they will arrive at the required floor. (2) Reducing energy consumption by matching passenger demand and lift scheduling using the differential evolution algorithm to estimate the lift’s optimal schedule and the determined lift assignment. Moreover, this study assesses lift stopping strategies, such as: (1) normal—this strategy allows all lifts to stop on every floor as requested by the users (passengers); (2) odd–even—this strategy allows half of the elevators to stop only on odd floors and the other half to stop only on even floors; and (3) high–low—this strategy allows half of the elevators to stop only on high floors (the top half of the building) and the other half of the elevators to stop only on low floors (high–low).
From Figure 1, we can see that the management of elevator operations and passenger scheduling can be executed by (1) installing a camera on the first floor to monitor the waiting line; (2) installing a sensor on each building floor to assess the current position and situation of the elevators (these data will be sent to the server); (3) constructing a solution for the scheduling of the elevators and passengers by designing an algorithm; and (4) communicating between the elevators’ control system and passengers using the newly designed mobile application.
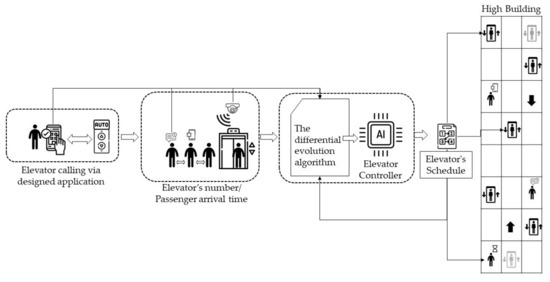
Figure 1.
Framework of the proposed problem.
1.2. Related Works
Energy consumption is a critical issue in high-building management, especially in regard to elevator usage management. There are several ways to reduce energy usage in a building. Zhang et al. (2018) discovered that using AC and DC hybrid power distribution systems led to a higher conversion efficiency than a single AC power system in a high building [9]. Lai and Ting (2016) used aircraft energy control to solve the problem of coordinated control of an elevator, and an energy distribution loop was presented based on a linear quadratic Gaussian (LQG) regulator [10]. Zhang et al. (2019) used a direct current (DC) micro-grid and an innovative energy-efficiency device to reduce the elevator’s energy consumption rate and found that they were able to reduce this rate by 15.87–54.5% [11]. Qiu et al. (2020) used particle swarm optimization to optimize the car air pressure curve in order to increase passenger comfort, reduce energy consumption, and affect aerodynamic characteristics [12]. Qiu et al. (2020) presented an energy-based vibration model (EVM) to describe the multi-directional coupling properties of high-speed elevators. They presented the precise Gaussian integration method to find the values of kinematic characteristics; a combination of the kinematic energy, elastic potential energy, and theoretical work was found to affect the vibrational characteristics of the high-speed elevator [13].
Kermani et al. (2021) presented a hybrid energy storage system (HESS) that integrated ultra-capacitor energy storage (UCES) and battery energy storage (BES) systems to reduce the energy use of elevators [14]. Yu et al. (2017) presented a methodology for reducing the stack effect in high-rise buildings, revealing effective operation schemes for a sixty-story commercial building in Seoul, Korea. They suggested that adopting the right scheme and adjusting the air pressure appropriately can pressurize the upper zone of the building, which directly relates to the stack effect [15]. Oh et al. (2020) presented construction management (CM), which integrates design and construction to reduce the pressure, noise, and vibration of high-rise residential buildings (HRBs) [16].
Many researchers have proposed methods for solving the routing problem related to a group of elevator cars (GE). The GE problem relates to managing the demand triggered by calling an elevator using the call button. The scheduling and routing of the lift is managed so as to minimize the passenger waiting time and the energy used during the working day [17,18,19,20,21,22,23,24,25]. Most articles focus on reducing the energy used by the elevator by managing the electricity it uses. For the elevator in our case study, we adjusted the electricity to a mixed AC/DC power system, and we used smart control to control the movement of the elevator during rush hour in a high-rise office building.
Bapin et al. (2020) presented a novel method for the optimal dispatching of conventional passenger elevators using the information obtained by surveillance cameras installed in and in front of the lift car. The video is collected by an image processing system that can determine the number of passengers in the elevator car and the number of passengers that are waiting. This information is used to control the movement of the elevator in order to reduce energy consumption [26]. Chen et al. (2021) presented a real-time elevator reservation method in order to obtain the optimal total running time and shortest round-trip of the elevator [27]. Ge et al. (2021) employed automatic control of the energy consumption of the elevator, such as its light status, occupancy, and moving status. The study used a real building and found that the proposed building management approach is more effective than the current situation [28]. In our research, we used Internet of Things (IoT) devices such as sensors and cameras installed in and in front of the lift. These devices report the current situation of the lift, such as its current position, current speed, etc. This information is used as the input of the computer/mobile application to set elevator and passenger schedules. Elevator and passenger schedules are developed using Java.
Advanced optimization plays a key role in our problem-solving method. There are many different domains in which advanced optimization algorithms have been applied as solutions, such as online learning [29], scheduling [30], multi-objective optimization [31], transportation [32], medicine [33], data classification [34], and others.
The algorithms that have been used in previous studies to solve the GE problem include genetic algorithms, particle swarm optimization, and tabu searches [21,24,25]. In our study, we use the differential evolution algorithm to solve this problem. The differential evolution algorithm (DE) is a type of population-based metaheuristic and is one of the most powerful and interesting evolutionary algorithms. It has five typical steps: (1) generate an initial solution; (2) perform a mutation process; (3) perform a recombination process; (4) perform a selection process; (5) redo steps (2)–(4) until the termination conditions, such as computational time and the maximum number of iterations, are met.
DE has been successfully applied in several fields, such as in production scheduling [35,36], manufacturing problems [37], vehicle scheduling problems [38], and vehicle routing problems [39]. We have developed an efficient DE for solving the vertical transportation problem and thus minimizing the energy needed to operate a group of elevators during rush hour at the same time as maintaining social distancing to prevent the spread of COVID-19.
1.3. Contribution
The contributions of this research are three-fold:
- (1)
- The differential evolution algorithm has been proposed to construct the passenger and lift schedule in order to minimize the energy usage of the building, while controlling the spread of, and thus preventing, COVID-19 (reducing the number of passengers waiting and passenger waiting time);
- (2)
- A mobile application is developed to communicate between the elevator’s control system and the passengers;
- (3)
- The optimal elevator stopping strategy is revealed.
The framework of the proposed problem is shown in Figure 1.
As shown in Figure 1, the passengers call to use the lift by using the lift management application. These data is sent to the main computer. A differential evolution algorithm (DE) is used to match the passengers to the lifts via demand and the availability of the elevators. The DE gives the solution, which is composed of the number of lifts that the passengers will take and the arrival time of the passengers at the waiting area; this way, they can catch the target lift on time. This information is sent back to the passengers via the mobile application. The DE also constructs the lift schedule that controls the lift, taking the passengers from the first floor to their target floors. The solution is based on: (1) maintaining a social distancing strategy to prevent the spread of COVID-19; (2) minimizing the use of energy by the lift, and (3) reducing the waiting time of the passengers using the designed application.
2. Mathematical Model Formulation
For the vertical transportation of elevators (VTE), we sought to minimize the energy used to deliver passengers during rush hours while maintaining social distancing to reduce the spread of COVID-19. Our mathematical model is shown as follows.
2.1. VTE When the Elevators Are Allowed to Stop at Each Floor of the Building
Indices
- i—Indices for passenger label i = 1, …, I
- j—Indices for elevator label j = 1, …, J
- k—Indices for the transportation of the elevator k = 1, …, K
- l—Indices for the level of the building l = 1, …, L
Parameter
- I—Number of available passengers
- J—Number of elevators available
- K—Maximum number of rounds of transportation allowed per elevator
- L—Maximum number of building levels
- S1—Electric consumption rate per floor when moving up
- S2—Electric consumption rate per floor when moving down
- S3—Electric consumption rate each time the elevator stops (open/close the door)
- Li—Floor of the building the passenger must stop at i
- Gil—
- Wi—Weight of passenger i
- Cj—Capacity of elevator j
- D—Time taken to load passengers in/out (duration of the door being open)
- R—Movement speed of the elevator (minutes/floor)
- Q—Maximum working time of the elevator (minutes)
Decision Variables
- Yijk—
- Xjk—
- Tijkl—
- Bjkl—
- Mjk—Maximum floors that the elevator j travels in round k
- Njk—Starting time of elevator j round k
- Fjk—Finish time of elevator j round k
Objective Functions
Subject to
Objective function (1) is composed of three cost terms, which are: (1) the cost of moving the elevator up, which is a function of the number of floors that elevator j traverses in round k; (2) the cost of moving the elevator down, which is a function of the maximum number of floors elevator j traverses in round k−1; and (3) the number of times the elevator door opens, which is a function of the number of floors that the elevator opens on in round k.
Constraints (2) mean that a passenger must be assigned to elevator j round k once at most. Constraints (3) and (4) show that elevator j round k cannot be operated if round k−1 has not yet been operated. Constraints (5) are used to calculate the floors (l) at which elevator j round k has to stop due to customer i being assigned to that elevator. Constraints (6) illustrate that passenger i cannot be assigned to elevators that are not being operated. Constraints (7) reveal the maximum number of floors that elevator j round k has to move to, which is the maximum number of floors that the passengers who are assigned to that elevator can use. Constraints (8) ensure that the total weight of the passengers that are assigned to that elevator is less than the maximum allowed weight of that elevator. Constraints (9), (10), and (11) ensure that customer I will be assigned to elevator j round k only when that elevator stops at level l. Constraints (12) and (14) are used to define the starting time of elevator j round k, while constraints (13) and (15) are used to define the finishing time of elevator j round k. Finally, constraints (16) are used to control the time at which all elevators must be at the office.
2.2. VTE When Some Elevators Are Allowed to Stop Only at Odd Floors, While Others Are Allowed to Stop Only at Even Floors of the Building (Odd–Even)
Odd–even: In this strategy, the levels at which elevator j can stop are controlled by parameter Pjl, which is equal to 1 when elevator j is allowed to stop at a given floor. Gil, Gil-1, and Gil+1 are 1 because the lift does not stop at the preferred floor, meaning the passenger must stop one floor before or after the target floor.
To fulfill the requirements, constraints (16) is added to the previous model.
2.3. VTE When Some Elevators Are Allowed to Stop Only at High Floors While Others Are Allowed to Stop Only at Low Floors of the Building
This model uses the same formulation as that used in the second model. The value of Pjl is controlled to allow some elevators to stop at the lower floors (first half of all floors in the building) and higher floors (last half of all floors in the building).
3. The Proposed Heuristics
In this article, the differential evolution algorithm is modified to solve the vertical transportation of an elevator (VTE) problem. The differential evolution algorithm (DE) is composed of five typical steps: (1) generate an initial solution, (2) perform a mutation process, (3) perform a recombination process, (4) perform a selection process, and (5) redo steps (2) to (4) until the termination condition is met. The DE used to solve the vertical transportation of an elevator problem (VTE) can be explained stepwise, as below.
3.1. Generate a Set of Initial Vectors
We encode the vector to represent the VTE by designing a 1 × D vector, where D is the number of passengers. A set of initial vectors is encoded, as shown in Table 1. In Table 1, we show six vectors, each of which has nine positions (D).

Table 1.
Example of vector used in the proposed method.
To obtain the solution to the proposed problem, we need to develop a decoding method, which can be explained as follows.
The Decoding Method
To allow the vectors shown in Table 1 to be the complete solution, it is necessary to use the decoding method to obtain the complete solution for the proposed problem. The decoding method is composed of five steps: (1) set the probability for the passengers selecting their preferred elevator; (2) calculate the cumulative probability of passengers selecting their elevator; (3) assign the passengers to an elevator according to the cumulative probability obtained from step (3). This requires us to take into account the following conditions: (1) the capacity of the elevator and (2) the floors that an elevator stops at (the passengers are allowed to walk—at most—one floor up or down).
Table 2 shows the floor to which the passengers want to go and the weight of the passengers. Table 3 shows the probability, the cumulative probability, the floors at which the elevator is allowed to stop, and the elevator’s capacity. Table 4 shows the result of assigning the passengers to the lift using a value in the position of vector 1. The cost of moving the elevator up and down is THB 9 and 7, and the cost of opening the door of the elevator is THB 5 each time. The cost of calculation is also shown in Table 4.
Table 2.
Detail of the passengers.
Table 3.
Detail of the elevators.
Table 4.
Result of the assignment.
From Table 4, we can see that elevator 1 moves two rounds due to the limitations imposed on its capacity, while elevators 2 and 3 move one and three rounds, respectively. The total cost of the assignment is THB 818 per day. The decoding method used in this article is shown in Algorithm 1.
| Algorithm 1: DeCoding WP to Vertical Transportation Problem. |
| input:Population (WP), User Size (D), Cost and Time Data (CT), Max Weight of Elevator List(CJ), Number of Elevator(NE) output: Vertical_Tran _Solution, Total_Cost begin lift_route = Generate Elevator(CJ) cj_pop = get_ElevatorPop(CJ) For i = 1: D //Loop for the user selected elevator current_pop = 0 For j = 1:NE current_pop = current_pop + cj_popj If current_pop ≥ WPi.zk lift_routej.user_list.add(WPi) break End For Loop End For Loop Vertical_Tran _Solution = [] For i = 1: NE //Loop for the new routing elevator weight_sum = 0 new_user_list = [] size_user = length(lift_routei.user_list) For j = 1: size_user If weight_sum + lift_routei.user_listj.wi ≤ CJi Then new_user_list.add(lift_routei.user_listj) weight_sum = weight_sum + lift_routei.user_listj.wi Else new_route = Generate Route() new_route. user_list = new_user_list num_up = max(new_route. user_list.Li) – 1 time_up_down = (num_up* CT. R) * (num_up* CT. R) time_open= Count(new_route. user_list) * CT. D route _Time = (time_up_down + time_open) If route _Time ≤ CT. Q Then cost_up = num_up* CT. S_1 cost_down = num_up* CT. S_2 cost_open = Count(new_route. user_list) * CT. S_3 Total_Cost = Total_Cost + (cost_up+ cost_down+ cost_open) new_route.route_cost = (cost_up+ cost_down+ cost_open) new_route. route _time = route _Time Vertical_Tran _Solution.add(new_route) Else Return null weight_sum = 0 new_user_list = [] End For Loop End For Loop Return Vertical_Tran _Solution, Total_Cost end |
3.2. Perform Mutation Process
The mutation process is used to transform the target vector shown in Table 1 to the mutant vector. The transforming process makes use of Equation (18):
where r1, r2, and r3 are the indices of randomly selected vectors; F is a scaling factor, which is set as 0.8 (Qin et al., 2009); i represents the vector number, i = 1, 2,…, NP; j is the position of a vector when j = 1, 2,…, D.
3.3. Perform the Recombination Process
A recombination process is used to transform the mutant vector into the trial vector; in this process, we use Equation (19), where is the mutant vector, is the target vector, and is the trial vector. This formula was presented by Pitakaso and Sethanan (2015); randbij1 is random number one of vector i, position j, and randbij1 is random number two of vector i, position j.
3.4. Perform the Selection Process
The last process—completed before the vector can proceed to the next iteration—is known as the selection process. This process is used to select the new target vector. The candidates for the next target vector are the current target () and the current trial vector (). The selection is executed using Equation (20), where and are the objective functions of the trial vector and target vector, respectively.
3.5. Redo Step (3.2–3.4) until Termination Condition Is Met
In this research, the termination condition is set as the computational time (5–20 min depending on the size of the test problem). Details of the termination condition are shown in Table 5. The proposed method (differential evolution algorithm) procedure is shown in Algorithm 2.
| Algorithm 2: Differential evolution algorithm (DE). |
| input:Population size (NP), Problem Size (D), Mutation Rate (F), Recombination rate (R) output: Best_Vector_Solution begin Population = Initialize Population (NP, D) encode Population to WP while the stopping criterion is not met do for i = 1: NP Vrand1, Vrand2, Vrand3 = Select_Random_Vector (WP) For j = 1:D // Loop for the mutation operator Vy [j] = Vrand1 [j] + F (Vrand2 [j] + Vrand3 [j]) End For Loop//end mutation operator For j = 1:D //Loop for recombination operation If (randj [0,1) < R) Then u [j] = Vi [j] Else u [j] = Vy [j] End For Loop//end recombination operation IF(CostFunction(u) ≤ CostFunction(Vi)) Then Vi = u End For Loop End decode WP to get the solution for the problem Return Best Vector Solution end |
Table 5.
Computational results of various test instances.
4. Computational Result and Framework
This section contains three subsections: (1) the evaluation of the elevator’s stopping strategies, (2) the result of the case study, and (3) the design of the application for the lift users. In each section, tables and figures are provided to clearly illustrate the procedures and the findings of the computation.
4.1. The Evaluation of the Elevator’s Stopping
In this section, the performance of the proposed method (differential evolution algorithm) is coded with C++ and tested using an Intel ® Core™ i5-2467M PC with 1.6 GHz CPU. The mathematical model is coded using Lingo v.11. Twenty randomly generated data sets with different numbers of passengers, elevators, and floors are tested. Details of the test instances are shown in Table 5. We have also tested the problem in a case study consisting of 218 passengers, four lifts, and 31 floors. The results of the case study are shown in Table 5. The computational time of Lingo v.11 can be separated into two types. In the first type, we operate Lingo until it finds the optimal solution, then record the computational time taken. The second computational time is used when Lingo cannot find the optimal solution within 48 h, at which point we stop the operation and record the best solution found by Lingo v.11 during the 48 h. The termination condition of DE is set as the computational time. The execution time of DE is set to vary from 5 to 30 min, depending on the size of the problem. The results of the experiment are shown in Table 5.
The 20 test instances are sub-problems in the case study, which use different numbers of passengers, elevators, and maximum floors to be traversed. For example, test instance number 9 contains 15 passengers, 4 lifts, and 15 maximum floors to be traversed. All 218 passengers are categorized into two groups: (1) the passengers that need to stop after floor 15 (floor 16–31), named set A, and (2) passengers that are not in set A, named set Z. Afterwards, 15 customers from set Z are randomly selected for use in test instance number 9. The fourth out of six lifts is randomly selected for use in test instance number 9. We have performed the same procedure for all test instances.
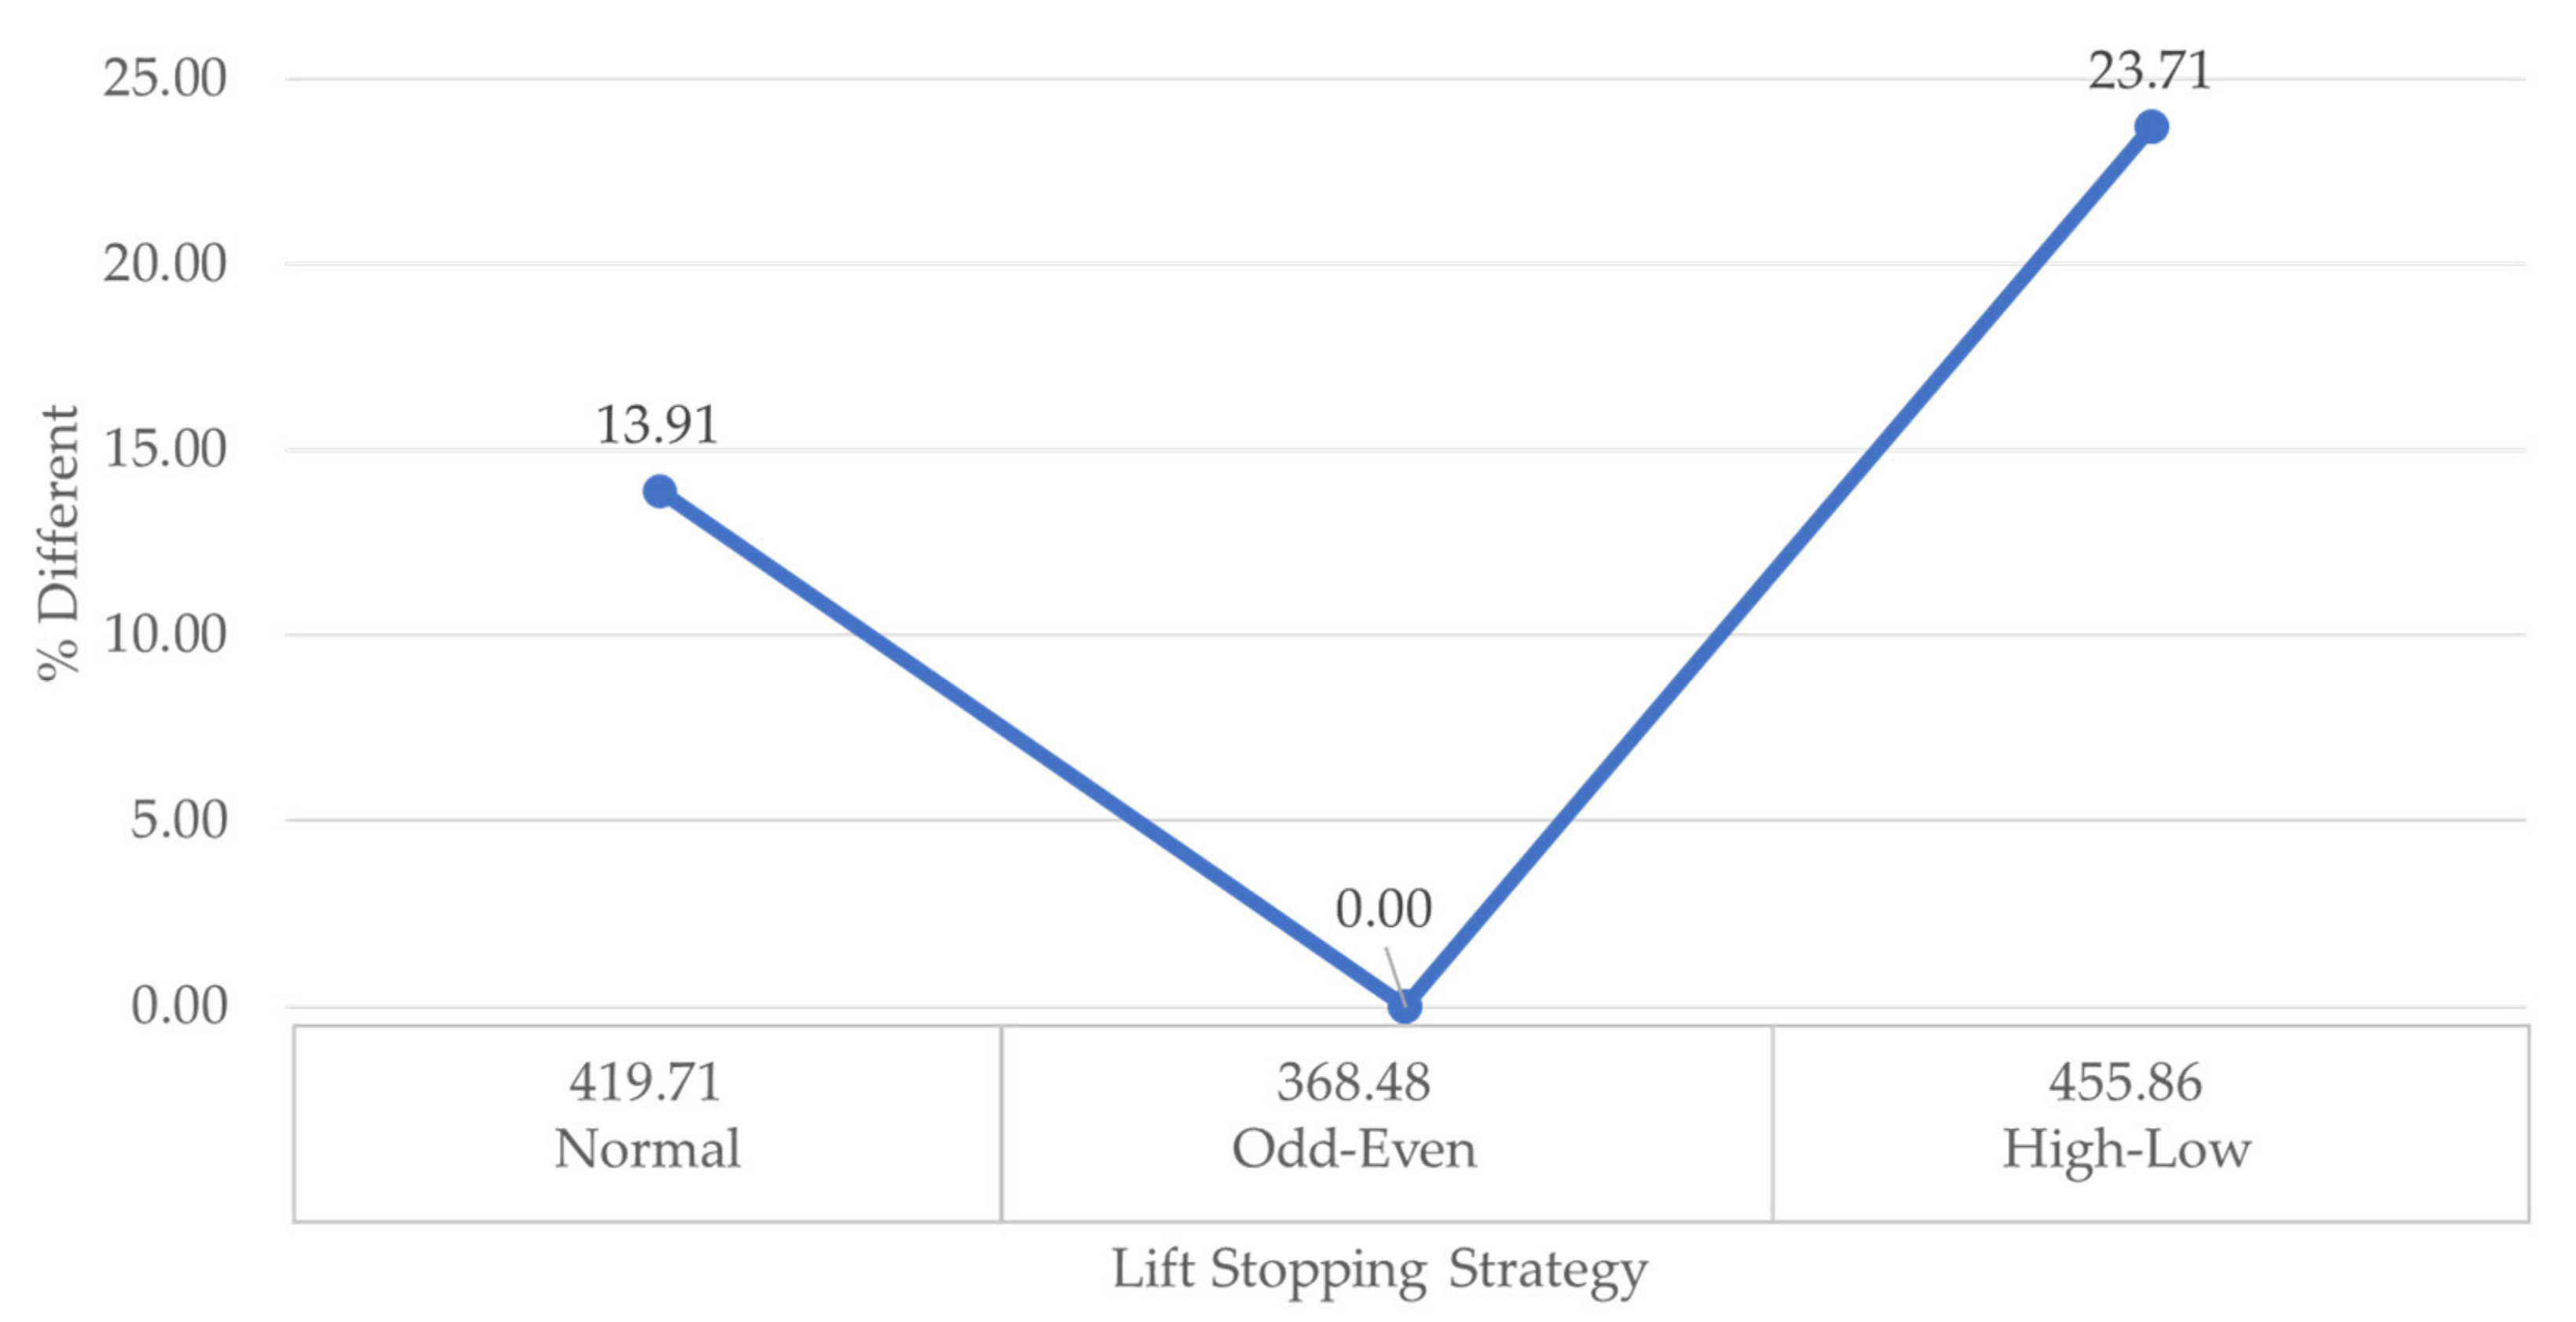
We used the results shown in Table 5 to plot a graph showing how the different stop strategies affect the total cost. These three strategies are: (1) normal (where the elevator stops at every required floor), (2) odd–even (where the elevator stops at either odd or even floors), and high–low (where the elevator stops at either high or low floors). The results of the comparison are shown in Figure 2.
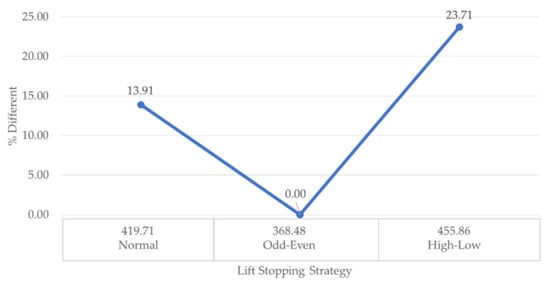
Figure 2.
Average cost using different stop strategies.
From Figure 2, we can see that using the high–low floor stop strategy generates a 23.71% higher cost than that incurred using the odd/even strategy. The odd–even strategy generates a 13.91% lower cost than when the elevator stops at every floor at which it is requested (normal strategy). The % difference in the number is calculated using Equation (21):
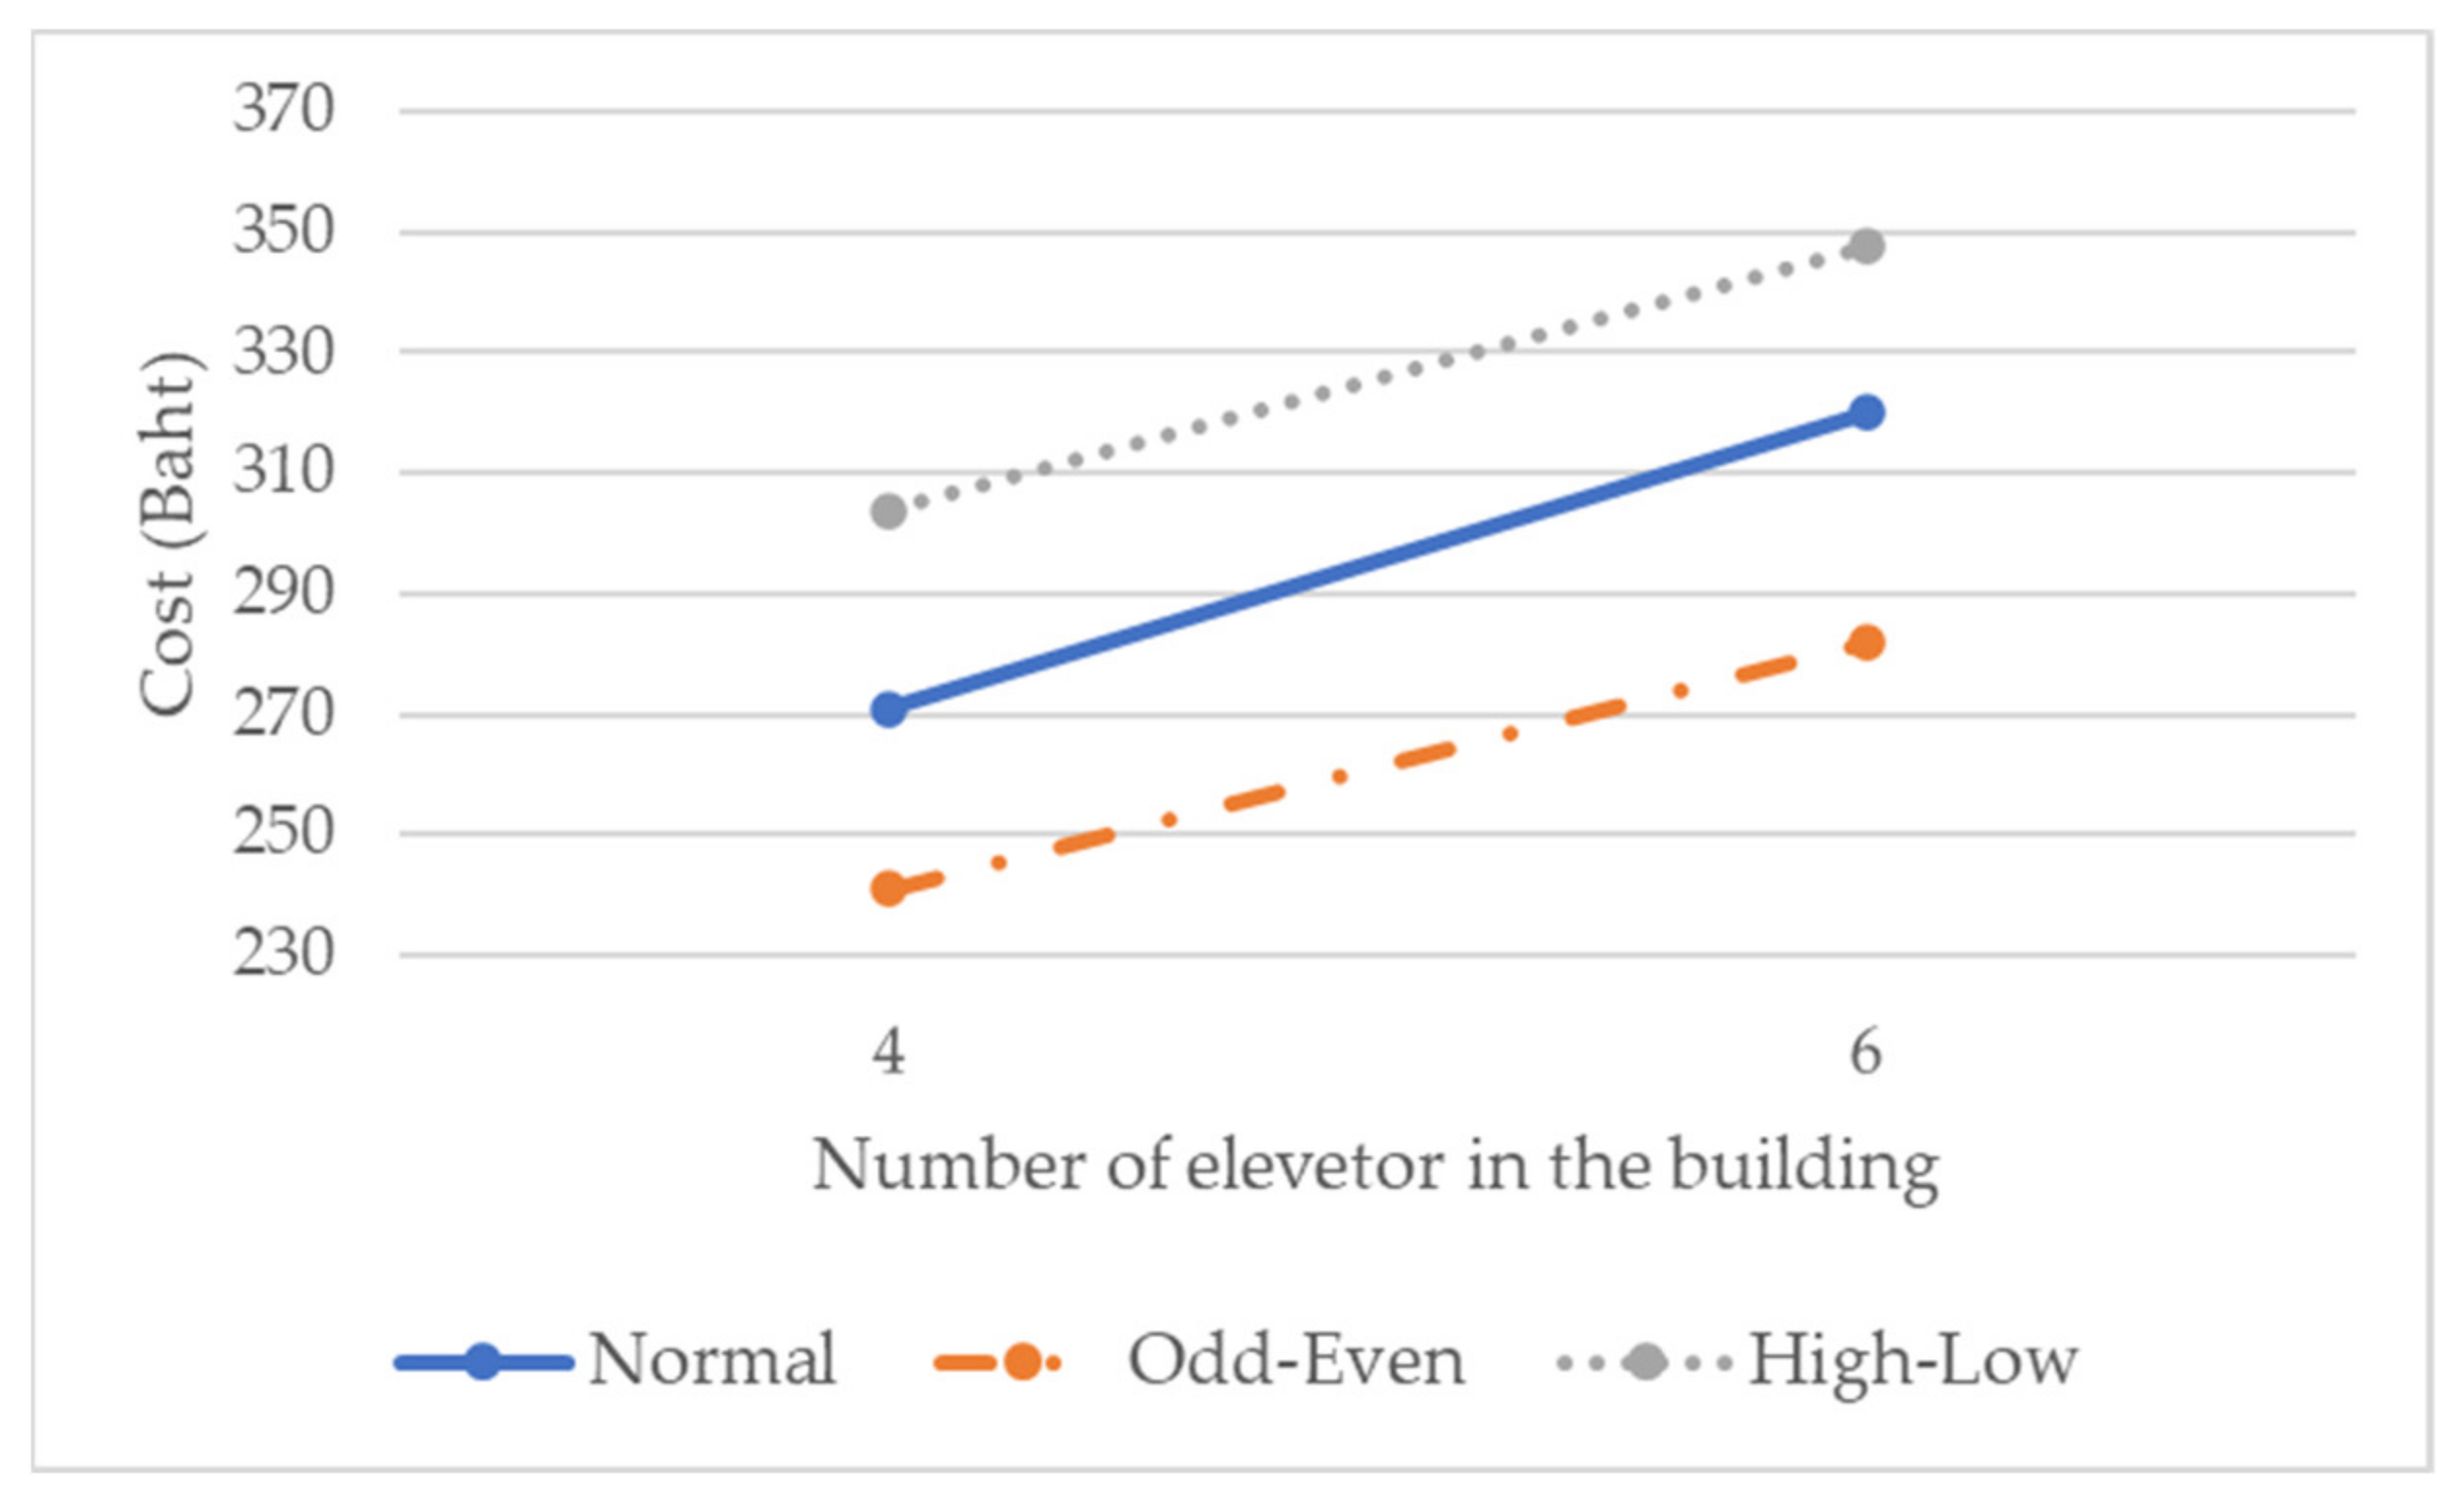
where T is the cost generated from by the target methods/strategy and B is the cost generated from by the base algorithm/method/strategy. Figure 3 shows that, when the number of elevators increases, the total costs of all the stopping strategies also increases.

Figure 3.
Average cost when comparing number of elevator available.
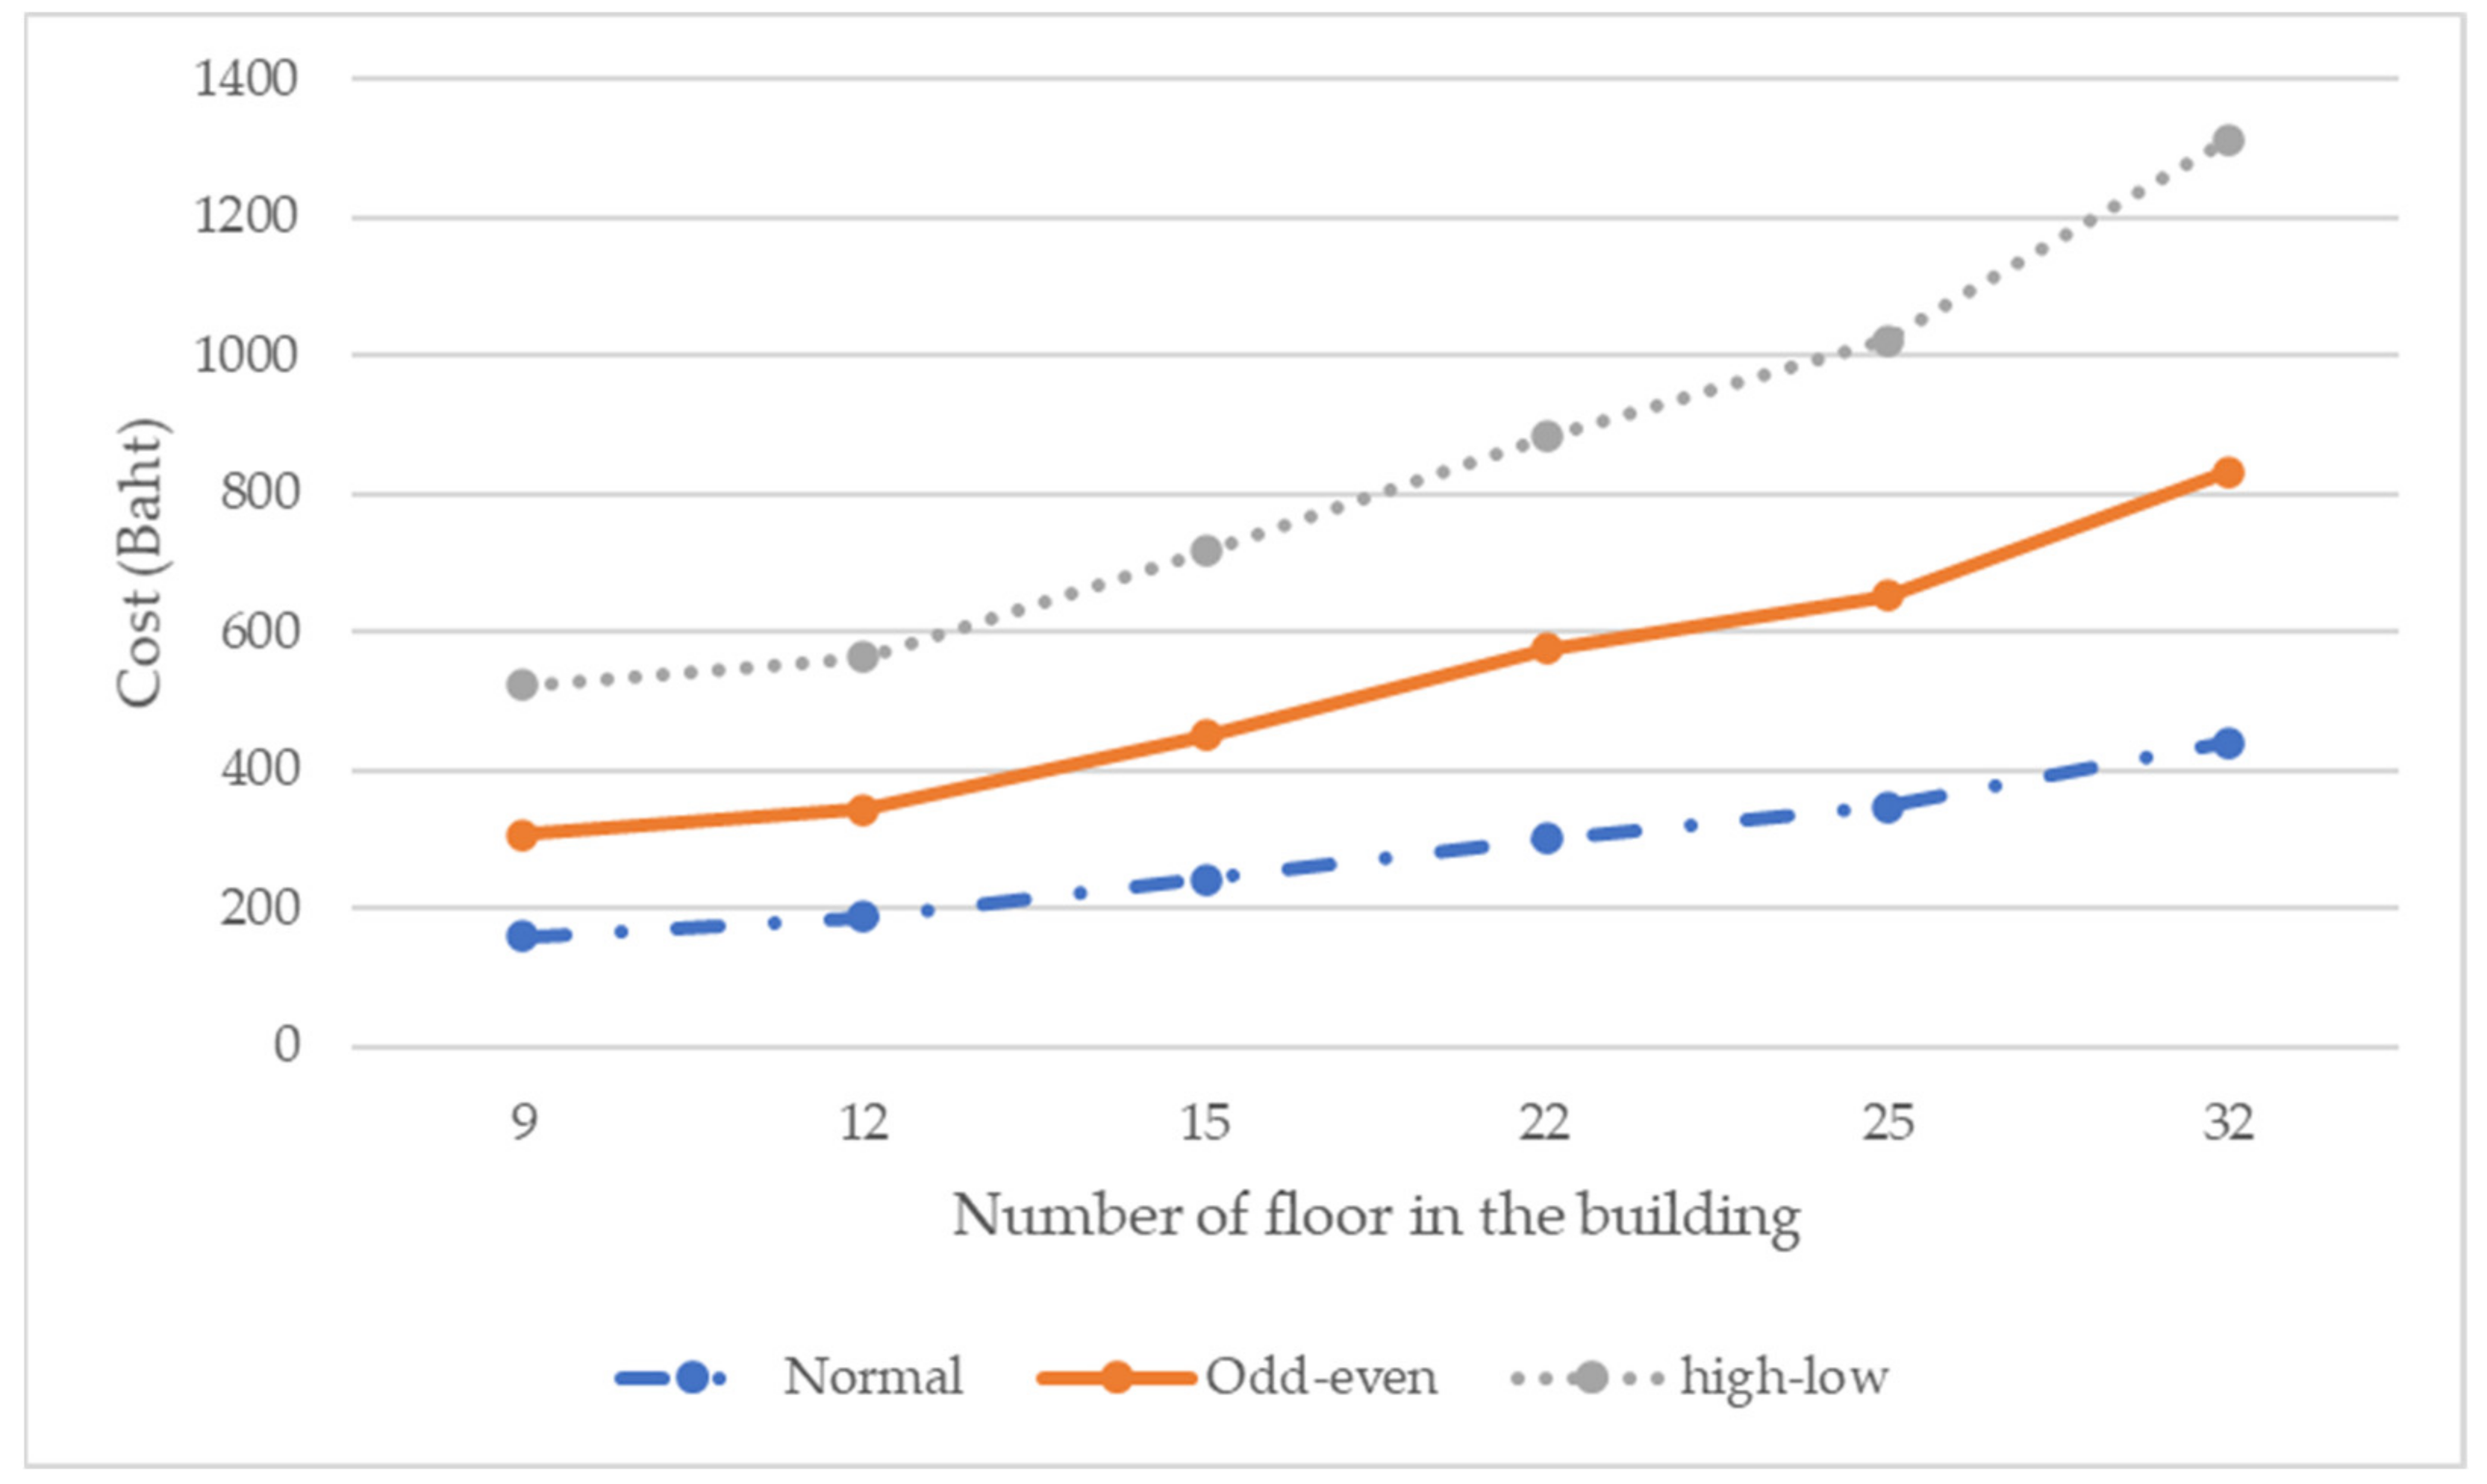
From Figure 3, we can see that, when the number of elevators increases, the costs of all stopping strategies increase. Figure 4 shows that, when the number of floors in the building increases, all the strategies have a higher operating cost.
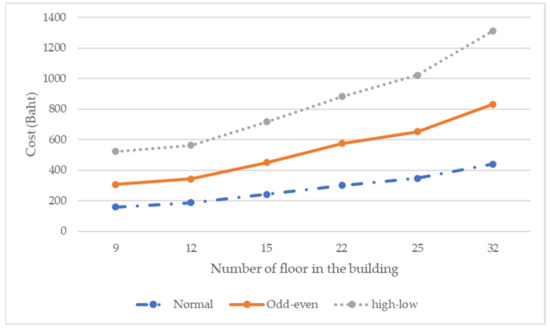
Figure 4.
Average cost when comparing the effect of the number of floors available in the building.
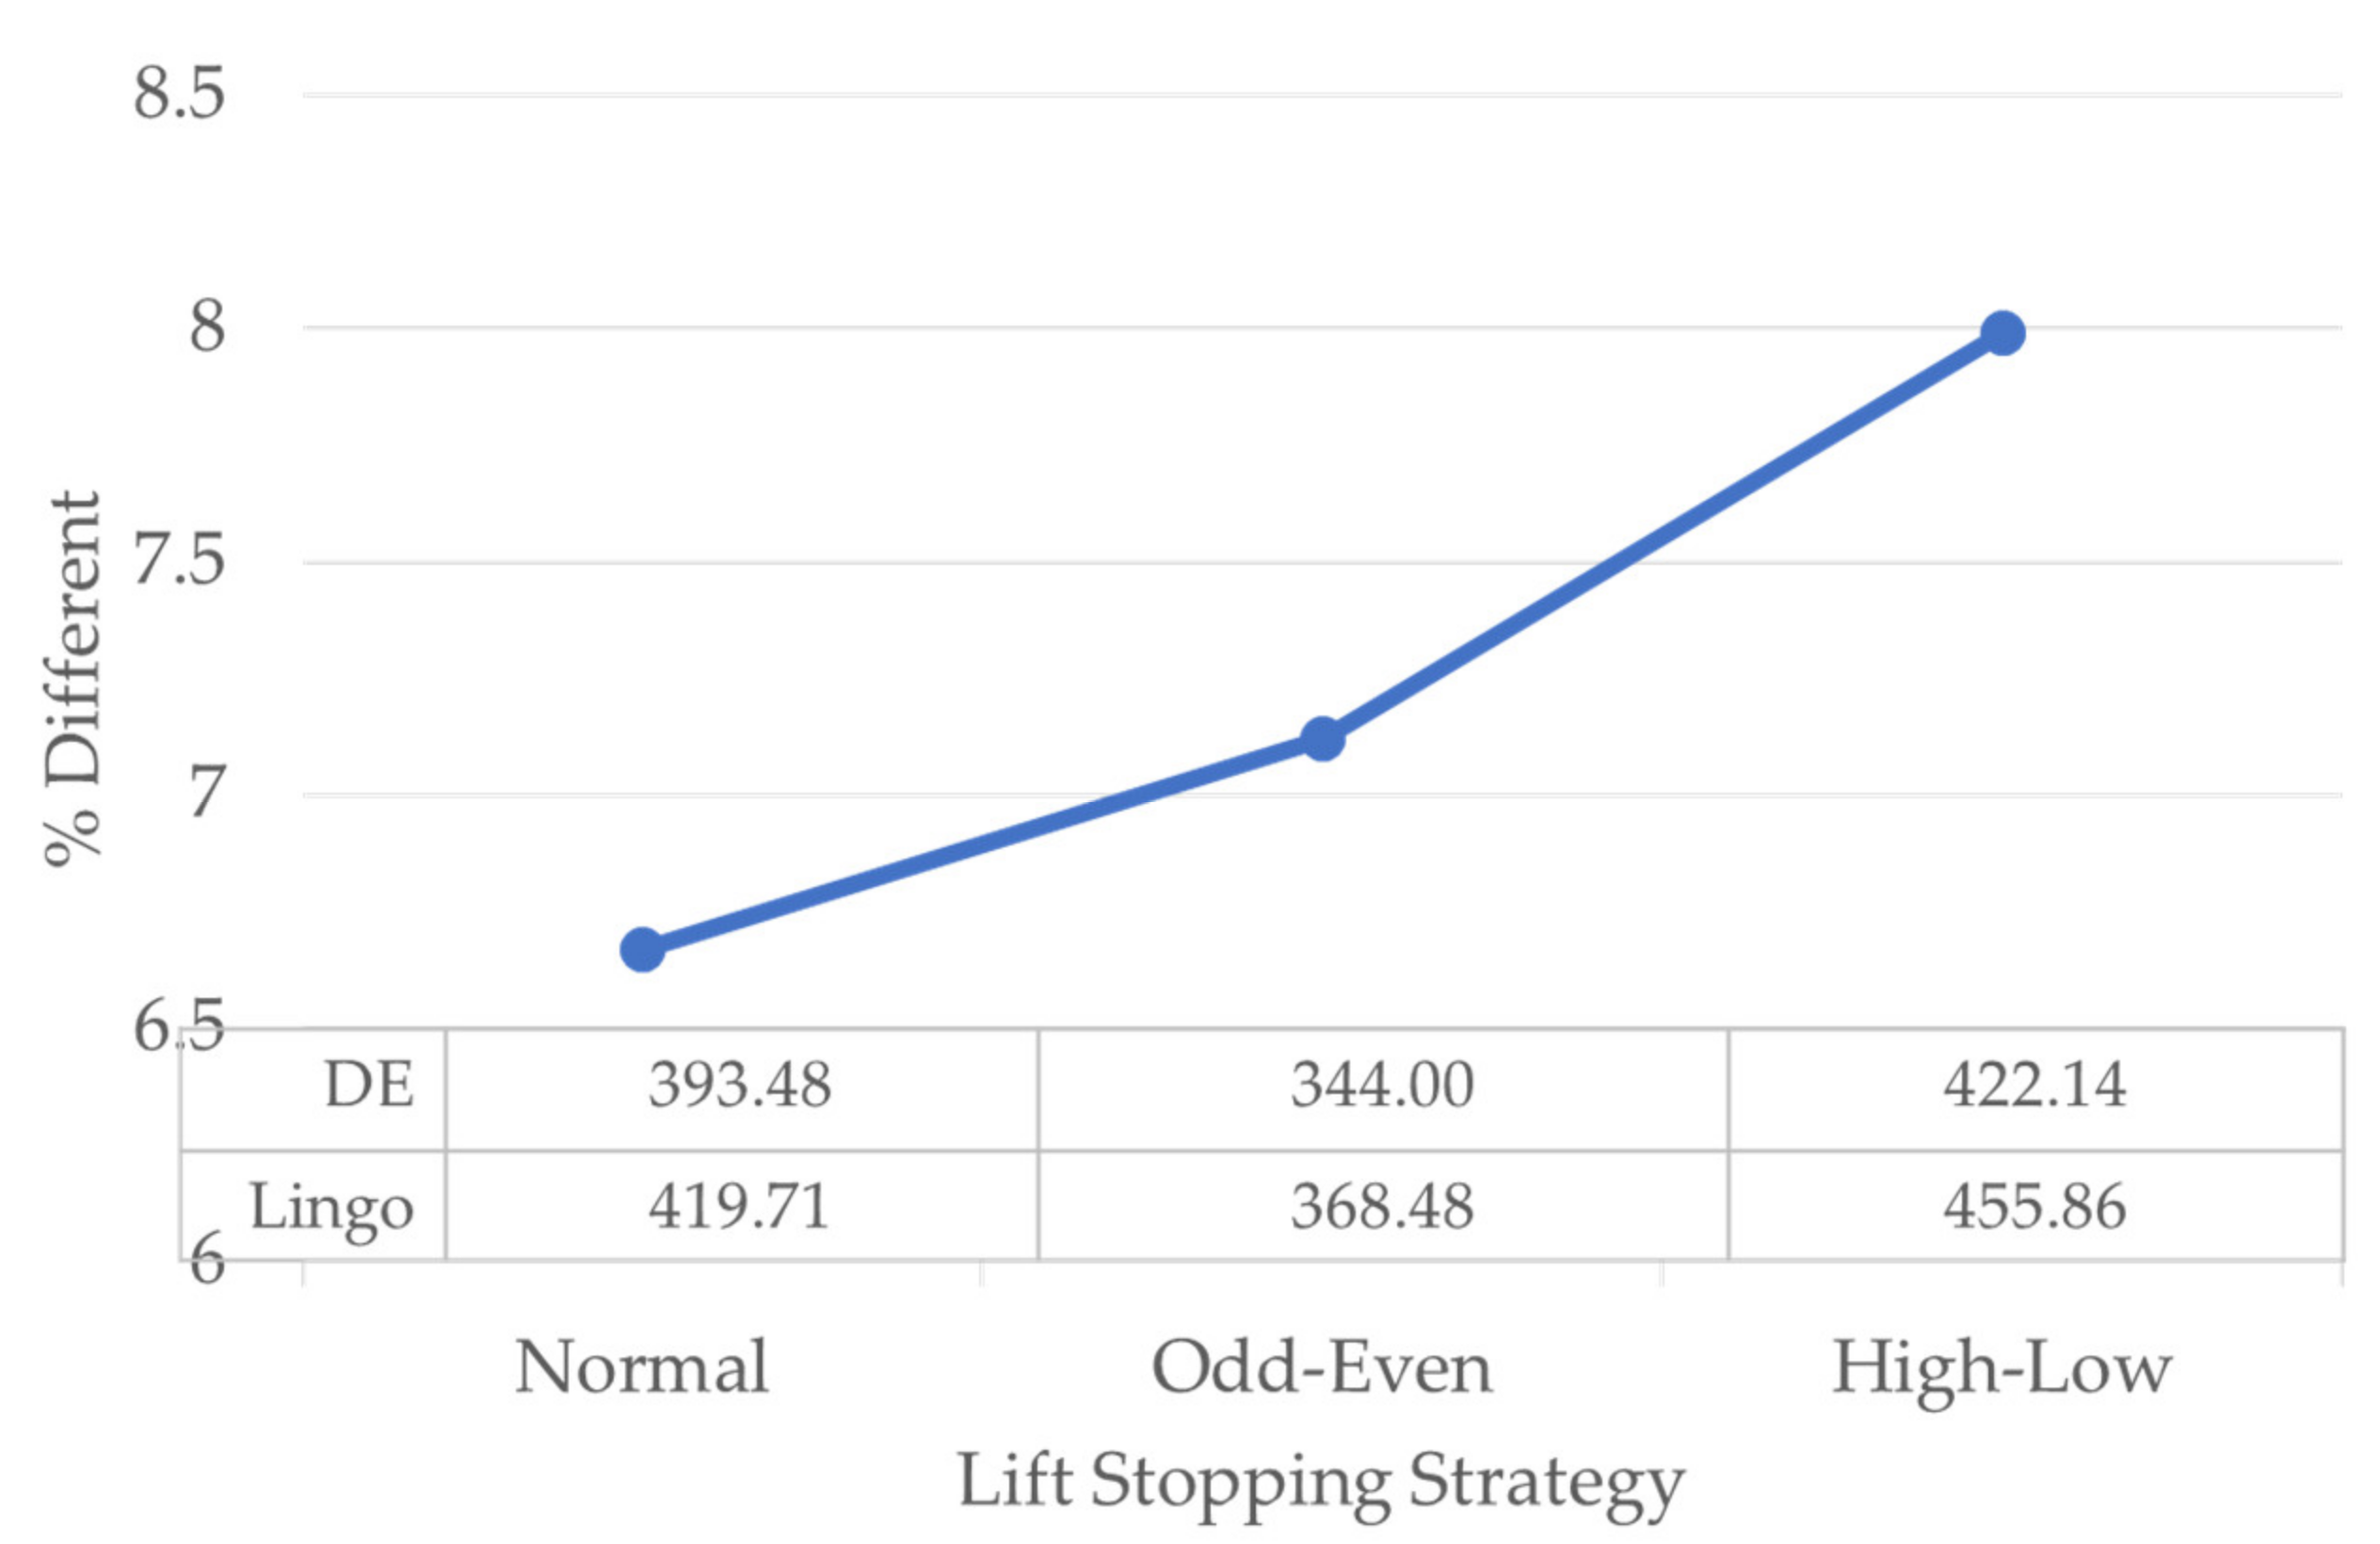
Figure 5 shows the % difference in the cost generated using different methods. These two methods use Lingo v.11 and DE. The average difference between results when using Lingo and DE is 6.67–7.99%, depending on which elevator stop strategy is used.

Figure 5.
The average % difference when using DE and Lingo v.11 as the solution approach.
In summary, we tested the performance of the proposed method with 20 instances and have presented the result in Table 5. Then, we tried to show the average costs of three strategies in several aspects in Figure 2, Figure 3 and Figure 4. Finally, we compared the costs of all strategies using DE and Lingo.
4.2. The Elevator Control System and Application Design
A camera was installed using HIKSISION DS-2CD1123G0E-I to assess the number of waiting lines. To assess the movement of the elevator, we used IoT devices, installing an infrared sensor 24 V on every floor of the building, and used C programming in the PLC system to control the movement and operation of the elevators. The framework of the operational design of the proposed method is shown in Figure 6.
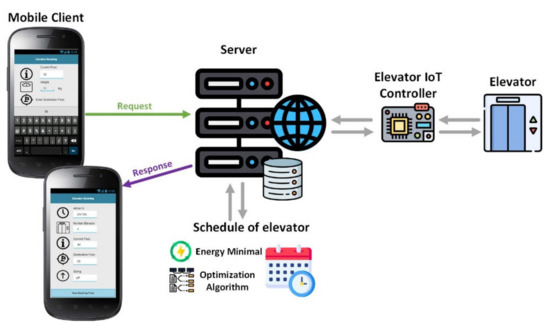
Figure 6.
The proposed architecture designs.
Figure 6 shows the system architecture design when the mobile client requests the server, which records the daily elevator requests of users; then, the system queries all elevator bookings to schedule the use of elevators. This system uses an optimization algorithm to ensure the minimum energy consumption of scheduling elevators, and the system relays the results of the elevator booking to each mobile client. In addition, this system also has an elevator IoT controller, which sends the elevator status information in real time via the internet to the server for mobile client response. The application runs on the Android platform. Furthermore, PHP scripts were run on the server for mobile client requests and responses. The Python script of the optimization algorithm was run each time a mobile client made an elevator booking. The elevator booking system is also installed in the touchscreen panels of kiosks at the entrances of elevator zones, to serve one-time visitors who do not have the booking system on their smartphone.
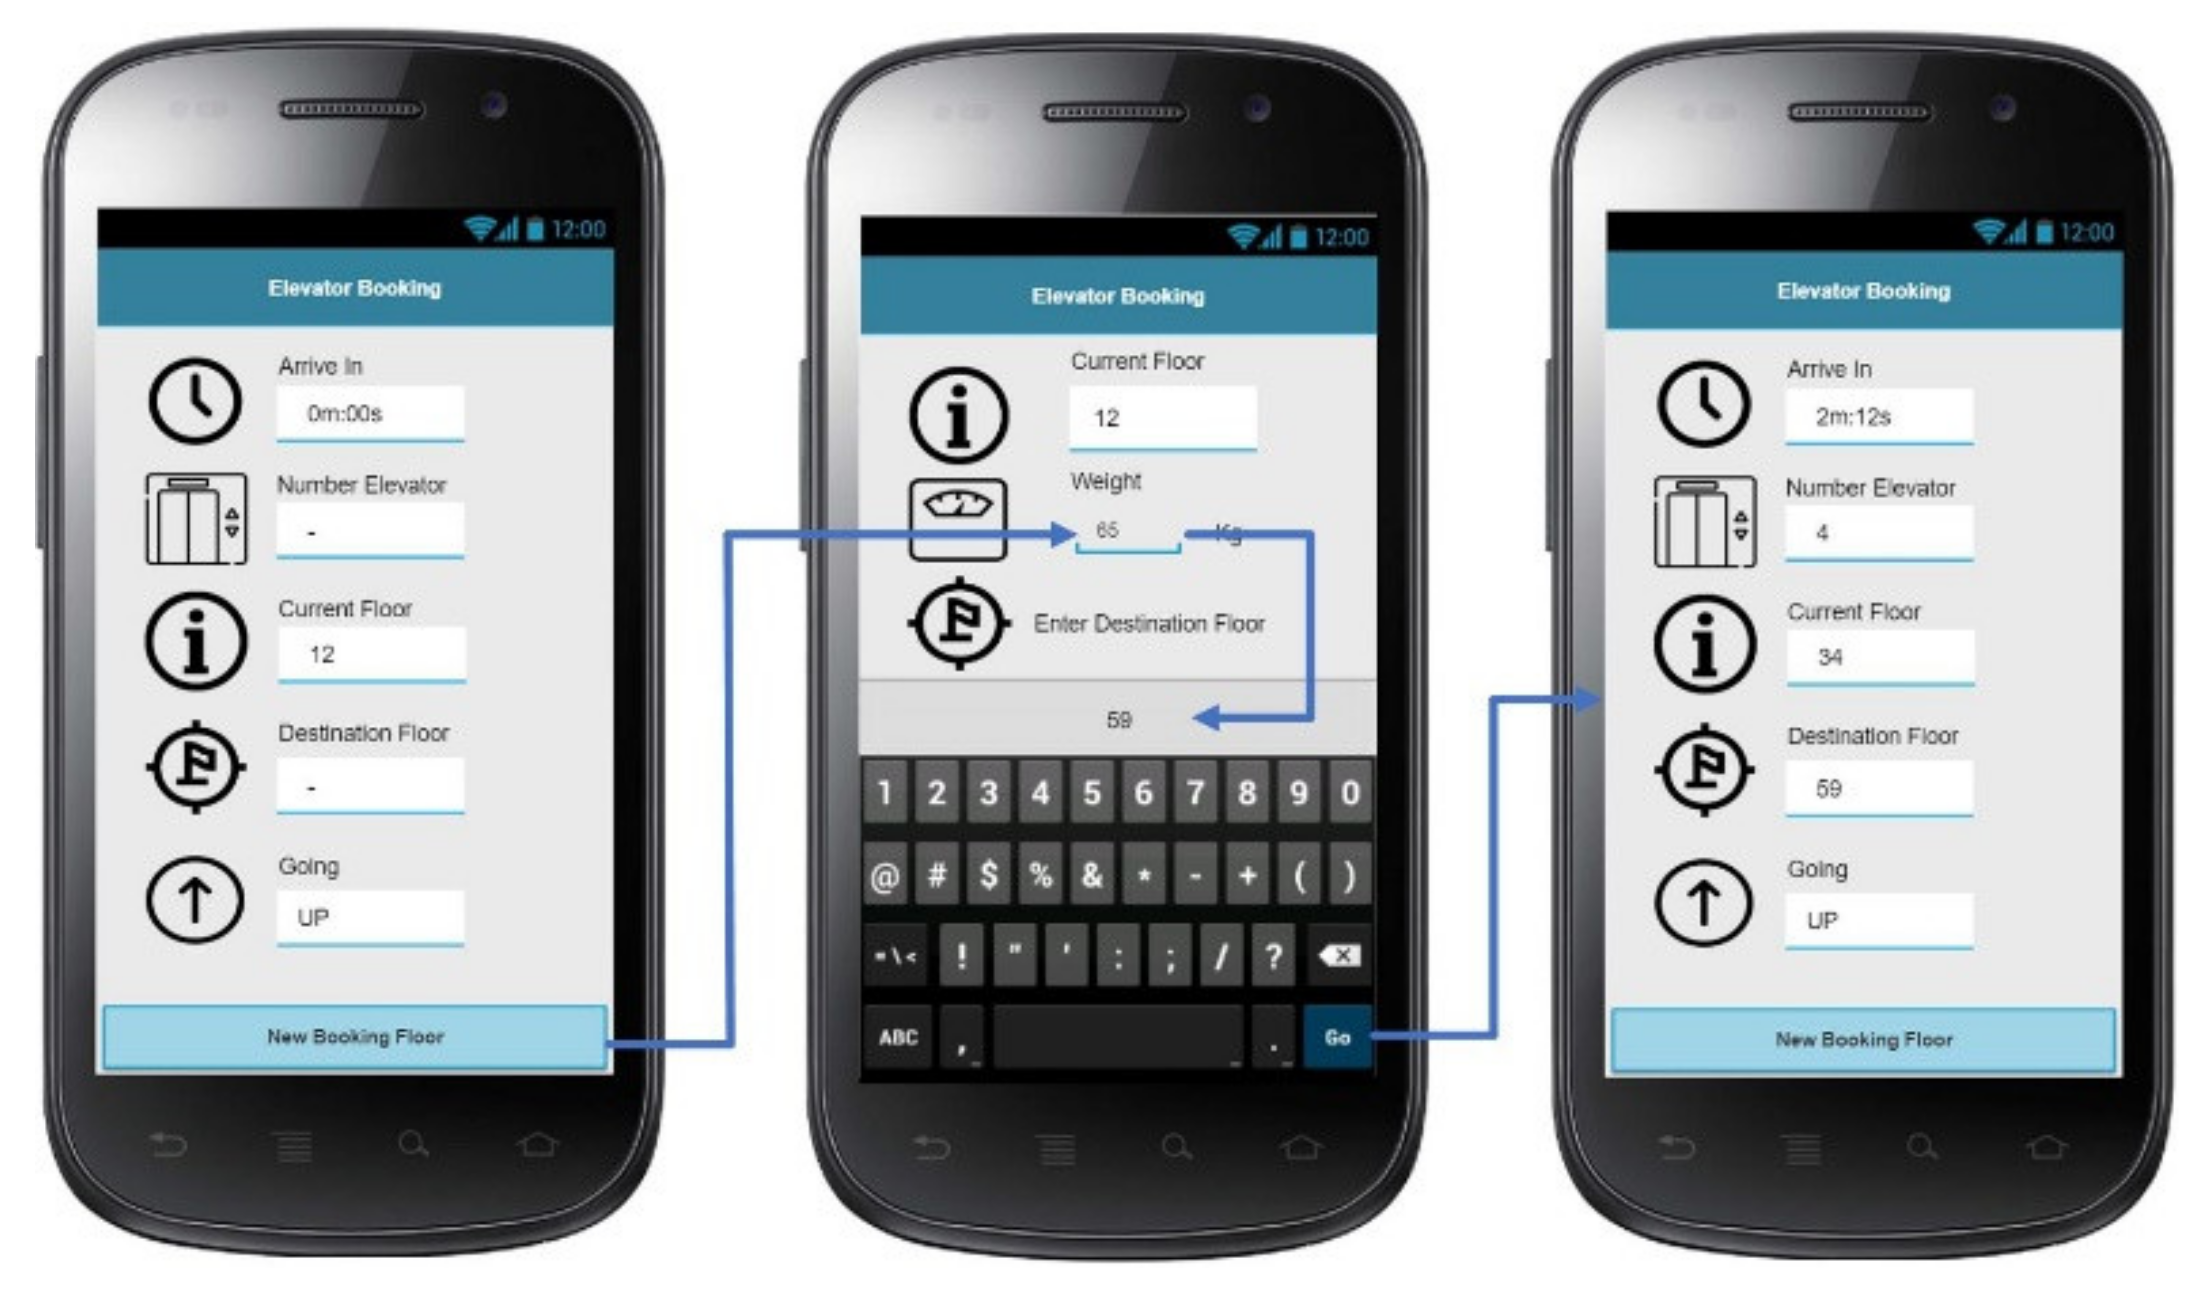
Figure 7 shows the user interface of the elevator booking design: the user clicks on “New Booking Floor” to book an elevator, and the system then asks the user to fill in their weight information and select the floor; the user then clicks “go” for confirmation. The system displays the result, the number of elevators, and elevator usage time. In addition, the current floor status of the elevator is displayed in real time.
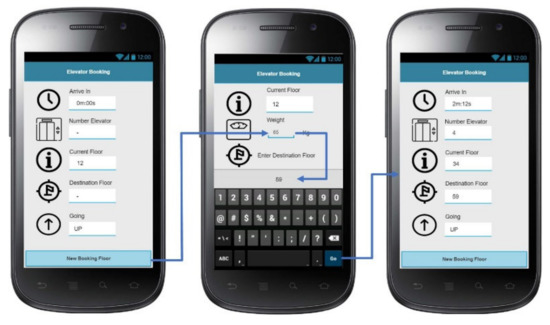
Figure 7.
The proposed user interface.
4.3. Numerical Result of the Case Study
The designed application and the DE have been implemented in a real building in Bangkok, Thailand, and were used for 80 days. The results of the average waiting time, the average number of waiting passengers, and the energy used in the building were recorded and compared with the current situation and are shown in Table 6.
Table 6.
Comparison of the results of the current situation and the proposed method.
From the computational results, we can see that the use of DE and the designed application can reduce the number of passengers that have to wait in the elevator waiting area and the average waiting time by 74.55% and 75.12%, respectively, while the energy used was reduced by 45.01%. The energy reduction rate can be converted to a GHG emission of 1127.94 kg CO2e per year [40]. An example of passenger scheduling is shown in Table 7.
Table 7.
Passenger scheduling example using DE and designed application.
Table 7 shows a numerical example of the case study on day 4 of application testing. We can see that the elevator working from 48.5 to 65.69 depending on the load that each lift has to serve. The total cost of day 4 is THB 2444. Each day, the cost can vary depending on the passengers’ demand of the life.
5. Conclusions and Outlook
In this research, we developed a mathematical model to represent passenger and elevator scheduling in order to optimize the energy consumption of elevators using the differential evolution algorithm (DE). An application was designed to communicate between the elevator control system and the passenger in order to manage the waiting time and number of passengers waiting in the elevator’s waiting area, aiming to reduce the spread of COVID-19. Moreover, to reduce energy consumption, three elevator stopping strategies have been presented and verified.
From the computational results, we can conclude that the DE improved the solution’s quality; the best solution was found using Lingo v.11 (found within 24–48 h), with an improvement of 6.67–7.99%. Moreover, the elevator stopping strategy that was used affected the solution quality. The solution in which we allowed the elevator to stop only on odd or even floors (odd–even) generated the lowest energy compared with all other strategies. This strategy could save 13.91% and 23.71% of the energy used by normal and high–low floor strategies, respectively. Moreover, from the computational results, we can conclude that the number of floors contained in the building and the number of elevators used in the building also affect the total energy used. A higher building, and a higher level of elevator usage in a building, translate to greater energy requirements to operate the elevator. The energy consumption of the proposed methods reduced the average waiting time, the average number of passengers waiting in the elevator waiting area, and the energy consumption, as well as GHG emissions, by 74.55%, 75.12%, and 45.01%, as inferred from a case study involving the investigated building.
There are some limitations to this research, including:
- We assumed that all elevator types and sizes in the same building have the same rates of usage;
- GHG emissions were calculated from electricity usage only.
Therefore, this research can be extended in various ways. For instance:
- (1)
- Various types and sizes of elevator under study should be included in the model;
- (2)
- GHG emissions should be calculated as the carbon footprints of activities related to using an elevator;
- (3)
- Passenger satisfaction, which is a function of the time the passengers spend waiting for the elevator, should be taken into account in the next model in future research.
Author Contributions
Mathematical formulation and algorithm design, S.K.; conceptualization, R.P.; methodology, R.P.; software, P.S. and C.K.; validation, K.S., N.N. and K.P.; formal analysis, K.S.; investigation, S.K.; resources, P.S. and C.K.; data curation, R.P.; writing—original draft preparation, R.P.; writing—review and editing, N.N.; visualization, N.N.; supervision, R.P.; project administration, N.N.; funding acquisition, K.S. All authors have read and agreed to the published version of the manuscript.
Funding
This research was funded by Fundamental Fund 65 and Research Unit on System Modelling for Industry, Khon Kaen University (Grant No. SMI.KKU 64/06) and Research Unit on Artificial Intelligence Optimization, Ubon Ratchathani University.
Institutional Review Board Statement
Not applicable.
Informed Consent Statement
Not applicable.
Data Availability Statement
Not applicable.
Acknowledgments
The authors acknowledge the research supports received from Faculty of Computer Science, Faculty of Industrial Technology, Ubon Ratchathani Rajabhat University, Thailand and, research scholarships (Fundamental Fund 65) from Ubon Rachathani University.
Conflicts of Interest
The authors declare no conflict of interest. The funders had no role in the design of the study; in the collection, analyses, or interpretation of data; in the writing of the manuscript, or in the decision to publish the results.
References
- Egbue, O.; Long, S.; Kim, S.D. Resource availability and implications for the development of plug-in electric vehicles. Sustainability 2022, 14, 1665. [Google Scholar] [CrossRef]
- Ali, M.M.; Al-Kodmany, K. Tall buildings and urban habitat of the 21st century: A global perspective. Buildings 2012, 2, 384–423. [Google Scholar] [CrossRef] [Green Version]
- Ekici, B.; Turkcan, O.F.S.F.; Turrin, M.; Sariyildiz, I.S.; Tasgetiren, M.F. Optimising high-rise buildings for self-sufficiency in energy consumption and food production using artificial intelligence: Case of Europoint complex in Rotterdam. Energies 2022, 15, 660. [Google Scholar] [CrossRef]
- Hakala, H.; Siikonen, M.L.; Tyni, T.; Ylinen, J. Energy-efficient elevators for tall buildings. In Proceedings of the CTBUH 6th World Congress (CTBUH2001), Melbourne, Australia, 26 February–1 March 2001; pp. 559–574. [Google Scholar]
- Al-Sharif, L. Lift and escalator energy consumption. In Proceedings of the CIBSE/ASHRAE Joint National Conference, Harrogate, UK, 29 September–1 October 1996; pp. 231–239. [Google Scholar]
- Victorovna Morozova, T.; Alayi, R.; Grimaldo Guerrero, J.W.; Sharifpur, M.; Ebazadeh, Y. Investigation and optimization of the performance of energy systems in the textile industry by using CHP systems. Sustainability 2022, 14, 1551. [Google Scholar] [CrossRef]
- Zhukovskiy, Y.L.; Kovalchuk, M.S.; Batueva, D.E.; Senchilo, N.D. Development of an algorithm for regulating the load schedule of educational institutions based on the forecast of electric consumption within the framework of application of the demand response. Sustainability 2021, 13, 13801. [Google Scholar] [CrossRef]
- Sena, B.; Zaki, S.A.; Rijal, H.B.; Ardila-Rey, J.A.; Yusoff, N.M.; Yakub, F.; Liana, F.; Hassan, M.Z. Development of an electrical energy consumption model for Malaysian households, based on techno-socioeconomic determinant factors. Sustainability 2021, 13, 13258. [Google Scholar] [CrossRef]
- Zhang, Y.; Yan, Z.; Li, L.; Yao, J. A hybrid building power distribution system in consideration of supply and demand-side: A short overview and a case study. Energies 2018, 11, 3082. [Google Scholar] [CrossRef] [Green Version]
- Lai, Y.-C.; Ting, W.O. Design and implementation of an optimal energy control system for fixed-wing unmanned aerial vehicles. Appl. Sci. 2016, 6, 369. [Google Scholar] [CrossRef] [Green Version]
- Zhang, Y.; Yan, Z.; Yuan, F.; Yao, J.; Ding, B. A novel reconstruction approach to elevator energy conservation based on a DC micro-grid in high-rise buildings. Energies 2019, 12, 33. [Google Scholar] [CrossRef] [Green Version]
- Qiu, L.; Zhou, H.; Wang, Z.; Lou, W.; Zhang, S.; Zhang, L. A stepped-segmentation method for the high-speed theoretical elevator car air pressure curve adjustment. Energies 2020, 13, 2585. [Google Scholar] [CrossRef]
- Qiu, L.; He, C.; Yi, G.; Zhang, S.; Wang, Y.; Rao, Y.; Zhang, L. Energy-based vibration modeling and solution of high-speed elevators considering the multi-direction coupling property. Energies 2020, 13, 4821. [Google Scholar] [CrossRef]
- Kermani, M.; Shirdare, E.; Abbasi, S.; Parise, G.; Martirano, L. Elevator regenerative energy applications with ultracapacitor and battery energy storage systems in complex buildings. Energies 2021, 14, 3259. [Google Scholar] [CrossRef]
- Yu, J.-y.; Song, K.-d.; Cho, D.-w. Resolving stack effect problems in a high-rise office building by mechanical pressurization. Sustainability 2017, 9, 1731. [Google Scholar] [CrossRef] [Green Version]
- Oh, Y.; Kang, M.; Lee, K.; Kim, S. Construction management solutions to mitigate elevator noise and vibration of high-rise residential buildings. Sustainability 2020, 12, 8924. [Google Scholar] [CrossRef]
- Pout, C.H. N-DEEM: The National Nondomestic Buildings Energy and Emissions Model. Environ. Plan. B Plan. Des. 2000, 27, 721–732. [Google Scholar] [CrossRef]
- Tukia, T.; Uimonen, S.; Siikonen, M.L.; Donghi, C.; Lehtonen, M. High-resolution modeling of elevator power consumption. J. Build. Eng. 2018, 18, 210–219. [Google Scholar] [CrossRef] [Green Version]
- Tyni, T.; Ylinen, J. Genetic algorithms in elevator car routing problem. In Proceeding of Genetic and Evolutionary Computation Conference (GECCO-2001), San Francisco, CA, USA, 7–11 July 2001; Spector, L., Goodman, E.D., Wu, A., Langdon, W.B., Voigt, M., Gen, M., Sen, S., Dorigo, M., Pezeshk, S., Garzon, M.H., et al., Eds.; Morgan Kaufmann: San Francisco, CA, USA, 2001; pp. 1413–1422. [Google Scholar]
- Tartan, E.O.; Erdem, H.; Berkol, A. Optimization of waiting and journey time in group elevator system using genetic algorithm. Proceeding of 2014 IEEE International Symposium on Innovations in Intelligent Systems and Applications (INISTA 2014), Alberobello, Italy, 23–25 June 2014; Piuri, V., Yildirim, T., Eds.; IEEE: Piscataway, NJ, USA, 2014; pp. 361–367. [Google Scholar]
- Bolat, B.; Altun, O.; Cortés, P. A particle swarm optimization algorithm for optimal car-call allocation in elevator group control systems. Appl. Soft Comput. 2013, 13, 2633–2642. [Google Scholar] [CrossRef]
- Smith, R.S.; Peters, R.D.; Al-Sharif, L. Elevator system to minimize entrapment of passengers during a power failure. U.S. Patent No. 7,967,113 B2, 28 June 2011. [Google Scholar]
- Cortés, P.; Larrañeta, J.; Onieva, L. Genetic algorithm for controllers in elevator groups: Analysis and simulation during lunchpeak traffic. Appl. Soft Comput. 2004, 4, 159–174. [Google Scholar] [CrossRef]
- Gharieb, W. Optimal elevator group control using genetic algorithms. In Proceedings of the 1st International Conference on Advanced Control Circuits and Systems (ACCS’05), Cairo, Egypt, 6–10 March 2005. [Google Scholar]
- Sorsa, J.; Siikonen, M.L.; Ehtamo, H. Optimal control of double-deck elevator group using genetic algorithm. Int. Trans. Oper. Res. 2013, 10, 103–114. [Google Scholar] [CrossRef]
- Bapin, Y.; Alimanov, K.; Zarikas, V. Camera-driven probabilistic algorithm for multi-elevator systems. Energies 2020, 13, 6161. [Google Scholar] [CrossRef]
- Chen, W.; Zheng, B.; Liu, J.; Li, L.; Ren, X. A real-time matrix iterative optimization algorithm of booking elevator group and numerical simulation formed by multi-sensor combination. Electronics 2021, 10, 3179. [Google Scholar] [CrossRef]
- Ge, H.; Peng, X.; Koshizuka, N. Applying knowledge inference on event-conjunction for automatic control in smart building. Appl. Sci. 2021, 11, 935. [Google Scholar] [CrossRef]
- Zhao, H.; Zhang, C. An online-learning-based evolutionary many-objective algorithm. Inf. Sci. 2022, 509, 1–21. [Google Scholar] [CrossRef]
- Dulebenets, M.A.; Pasha, J.; Abioye, O.F.; Kavoosi, M.; Ozguven, E.E.; Moses, R.; Boot, W.R.; Sando, T. Exact and heuristic solution algorithms for efficient emergency evacuation in areas with vulnerable populations. Int. J. Disaster Risk Reduct. 2019, 39, 101114. [Google Scholar] [CrossRef]
- Fathollahi-Fard, A.M.; Dulebenets, M.A.; Hajiaghaei–Keshteli, M.; Tavakkoli-Moghaddam, R.; Safaeian, M.; Mirzahosseinian, H. Two hybrid meta-heuristic algorithms for a dual-channel closed-loop supply chain network design problem in the tire industry under uncertainty. Adv. Eng. Inf. 2021, 50, 101418. [Google Scholar] [CrossRef]
- Pasha, J.; Dulebenets, M.A.; Kavoosi, M.; Abioye, O.F.; Wang, H.; Guo, W. An optimization model and solution algorithms for the vehicle routing problem with a “factory-in-a-box”. IEEE Access 2020, 8, 134743–134763. [Google Scholar] [CrossRef]
- D’Angelo, G.; Pilla, R.; Tascini, C.; Rampone, S. A proposal for distinguishing between bacterial and viral meningitis using genetic programming and decision trees. Soft Comput. 2019, 23, 11775–11791. [Google Scholar] [CrossRef]
- Liu, Z.Z.; Wang, Y.; Huang, P.Q. AnD: A many-objective evolutionary algorithm with angle-based selection and shift-based density estimation. Inf. Sci. 2020, 509, 400–419. [Google Scholar] [CrossRef] [Green Version]
- Pitakaso, R. Differential evolution algorithm for simple assembly line balancing type 1 (SALBP-1). J. Ind. Prod. Eng. 2015, 32, 104–114. [Google Scholar] [CrossRef]
- Pitakaso, R.; Sethanan, K. Modified differential evolution algorithm for simple assembly line balancing with a limit on the number of machine types. Eng. Optim. 2015, 48, 253–271. [Google Scholar] [CrossRef]
- López Cruz, I.; van Willigenburg, L.; van Straten, G. Optimal control of nitrate in lettuce by a hybrid approach: Differential evolution and adjustable control weight gradient algorithms. Comput. Electron. Agric. 2003, 40, 179–197. [Google Scholar] [CrossRef]
- Liao, T.; Egbelu, P.; Chang, P. Two hybrid differential evolution algorithms for optimal inbound and outbound truck sequencing in cross docking operations. Appl. Soft Comput. 2012, 12, 3683–3697. [Google Scholar] [CrossRef]
- Hou, L.; Zhou, H.; Zhao, J. A novel discrete differential evolution algorithm for stochastic VRPSPD. J. Comput. Inf. Syst. 2010, 6, 2483–2491. [Google Scholar]
- Greenhouse Gas Emissions (Emission Factor) from Transmission Lines and from Heat Production for Greenhouse Gas Reduction Projects and Activities. 2021. Available online: http://ghgreduction.tgo.or.th/th/download-tver/120-gwp-emission-factor/353-2564.html (accessed on 11 December 2021).


Publisher’s Note: MDPI stays neutral with regard to jurisdictional claims in published maps and institutional affiliations. |
© 2022 by the authors. Licensee MDPI, Basel, Switzerland. This article is an open access article distributed under the terms and conditions of the Creative Commons Attribution (CC BY) license (https://creativecommons.org/licenses/by/4.0/).