Abstract
Due to increases in truck traffic, truck traffic safety has become an unavoidable societal issue in Korea. Truck traffic accidents were responsible for 24% of all traffic deaths in 2019, and the fatality rate was significantly higher than that of other forms of traffic. This study analyzes not only the driver and environmental factors, but also the traffic condition factors which are considered to contribute to the severity of truck traffic accidents, and presents practical truck safety solutions based on the findings. This study examines the fatal and serious injury truck traffic accidents in Incheon, which has large logistics facilities and the highest fatality rate (3.3) in Korea’s capital area. According to the regression analysis results, ‘Nighttime’, ‘Vehicle-single’, ‘Vehicle to Pedestrian’, ‘Lane violation’, and ‘Signal violation’ contribute to the severity of truck traffic accidents. Furthermore, truck traffic accidents in the logistics influencing area are more likely to be serious than in the non-influencing area. In terms of the traffic condition factors, the number of lanes, the maximum speed, and the number of road property-changing nodes were significant. The results of this study will provide useful data for establishing traffic safety policies in urban areas.
1. Introduction
Based on the Korean ‘Automobile Management Act’, a truck is a vehicle that has a cargo storage space suitable for transporting cargo, and the total weight of cargo in the storage space is greater than the weight of all passengers (except the driver) in the boarding space. With economic growth, the Korean freight transportation market has developed rapidly. According to the Korea Transport Database (KTDB), Korean truck registration is approximately 3.6 million (December 2019). The O/D traffic volume of trucks increased from 4.45 million in 2017 to 4.46 million in 2020, and will probably exceed 5.00 million by 2030. However, the problem of truck traffic safety has become an inevitable social issue, due to truck traffic volume increasing in urban areas. In an emergency, a truck braking is more difficult due to its huge and hefty body. Compared to other vehicle types, truck traffic accidents have a high risk of personal injury [1]. In 2019, traffic accidents caused by trucks accounted for 13% of all traffic accidents, and the proportion of deaths caused by truck traffic accidents was 24% in Korea. The fatality rate (deaths of every 100 traffic accidents) of truck traffic accidents fell from 3.6 in 2016 to 2.8 in 2019, but it was still significantly higher than that of other vehicles (bus: 1.5, passenger car: 1.0). Since Korea’s traffic safety index (deaths caused by traffic accidents per 100 thousand people) was in the lower level (18th, 2019) among the 35 Organization for Economic Co-operation and Development (OECD) countries, the government of Korea is contemplating efficient policies to prevent traffic accidents (Ministry of Culture, Sports and Tourism, the Republic of Korea, 2021).
Due to the difficult driving circumstances in densely populated areas, there is considerable risk of traffic accidents. Areas with high severity of truck traffic accidents are not only highways, but also urban areas that have large logistics facilities generating a high volume of truck traffic [2]. The majority of previous studies concentrated on the accidents that happened on the highways or at specific intersections. The objective of this study was to identify the severity factor of truck traffic accidents that happened in an urban area, and propose practical truck traffic safety policies to improve social health. Incheon, a major logistics city in Korea has large logistics facilities (airport, seaport, industrial complex), and the fatality rate of truck traffic accidents in 2019 was 3.32, the highest in Korea’s capital area (Figure 1). This study analyzes the truck traffic accidents that occurred in Incheon to ensure the representativeness of the study.
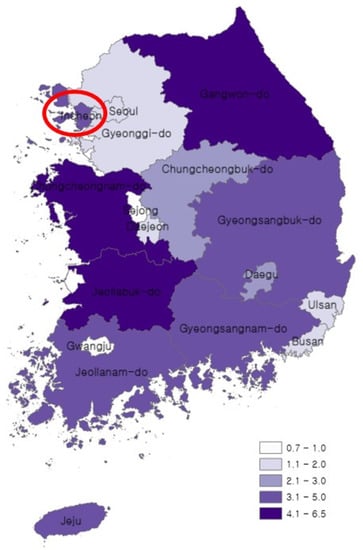
Figure 1.
Fatality rate of truck traffic accidents in Korea, 2019.
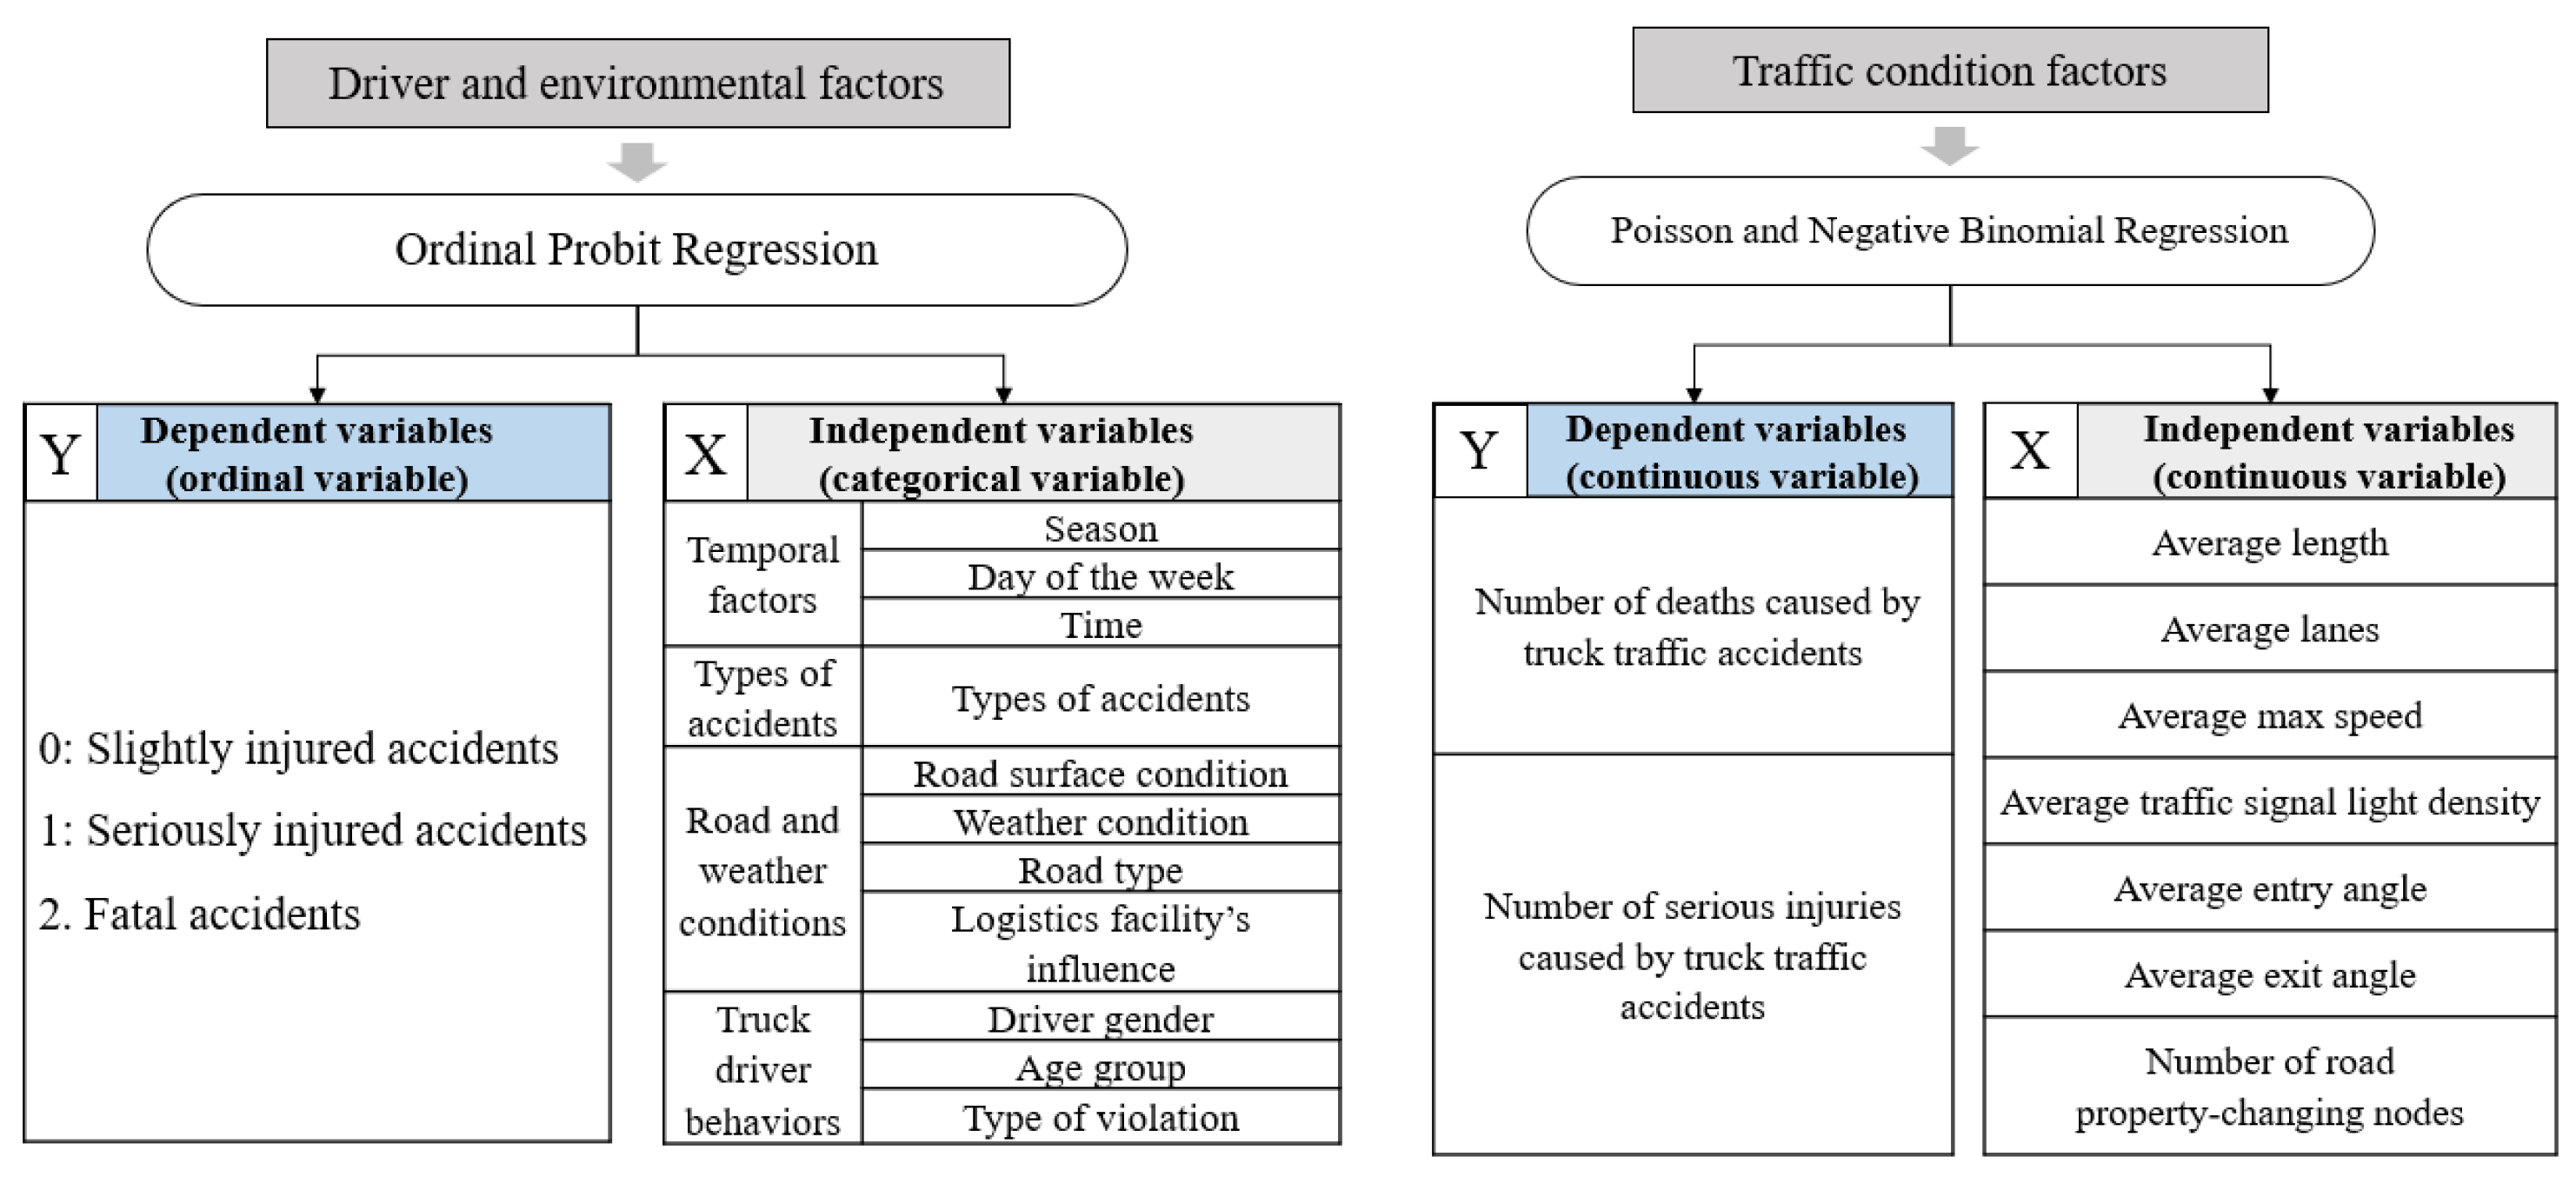
In this research, the factor analysis is divided into two parts: (1) using Ordinal Probit Regression to verify how temporal factors, types of accidents, road and weather conditions, and driver behaviors affect the severity of truck traffic accidents; (2) using Poisson and Negative Binomial Regression to identify how traffic condition factors affect the number of deaths and serious injuries caused by truck traffic accidents. The factors not only include the conventional items proposed in previous studies, but also contain additional aspects such as whether logistics facilities affect the severity of truck traffic accidents or not. As the importance and emergence of traffic safety issues in urban areas has increased, a comprehensive factor analysis on truck traffic accidents, such as this study, is required. The findings of this study will enable the government to implement traffic safety programs more efficiently.
2. Literature Review
Factor analysis of traffic accidents started with technical statistical analysis around 1980. Many researchers have studied the subject in various ways since then. The causes of traffic accidents are complicated, involving the interaction of a combination of factors such as the drivers, the vehicles, the weather condition, the traffic condition, and the way these interact [3]. When trucks are involved, the severity of the accident increases due to the stronger impulse [4]. In terms of driver factors, several studies presented that the decreasing of physical function makes the elder drivers react slowly in urgent situations [4,5]. However, Dong et al. [6] indicated younger drivers contribute to the frequency of truck-involved crashes. Different types of violations also show a significant influence on the truck traffic accident severity. Alcohol and illegal drugs are both dangerous behaviors and distractions such as work pressure, as well as inattention, also increase a driver’s injury level significantly [7]. Rezapur and Ksaibati [8] applied Multinomial and Ordinal Probit Regression to clarify how the different types of violations impact on truck traffic accident severity, and presented that driver distraction contributes to single-truck crashes. Given driving under server weather conditions is hard for drivers with regards to vision and vehicle handling, several studies proved that the weather condition significantly impacts truck traffic accidents. Foggy, rainy, or snowy weather has a higher probability of causing serious traffic accidents [6,9,10]. Truck freight transportation on the highway is more frequent in the nighttime to avoid traffic jams. However, drowsy driving leads to severe traffic accidents that usually happen at nighttime [11]. Behnood and Mannering [12] also indicated that dark areas with streetlights increase severe injury crash outcomes. As another important factor, the relationship between traffic condition and truck traffic accident severity is also mentioned frequently. Choi et al. [13] applied the traffic condition including speed, lane, curve, and other parameters as independent variables to analyze truck traffic accident severity that happens on the highway. As a result, speed was carried out as a significant variable. Cho et al. [14] used structural equation modeling (SEM) to develop different models for truck-involved and non-truck-involved accidents on highways, and found that the driver factor had a significant effect on increasing the severity of truck-involved accidents but not non-truck-involved accidents. Several studies have proven that the installation of road barriers can decrease the severity of truck traffic accidents on the highway [6,15]. Kopelias et al. [16], Islam and Hernandez [17], Lee and Li [18], and other studies have focused on the geometry and traffic condition factors in truck traffic accidents. However, most studies selected truck traffic accidents that happened on highways and rural ways to clarify the influence of geometry and traffic condition factors.
Overall, previous studies have applied drivers, vehicles, weather condition, traffic condition, and other elements as the independent variables to identify which indicators contribute to the severity of truck traffic accidents. In comparison to previous studies, this paper adds several parameters, such as the influence of the logistics facility’s location, and more detailed violation types. Furthermore, this study focuses on truck traffic accidents that happened in urban areas with more complicated traffic conditions.
3. Research Structure and Regression Model
3.1. Research Structure
This study aims to identify which factors significantly affect the severity of truck traffic accidents. As truck traffic accidents happen due to several factors interacting, we conducted a comprehensive analysis in two phases, as shown in Figure 2.

Figure 2.
Research structure.
In the first phase, the purpose was to identify which variables of the driver and environmental factors directly selected from the accident sites contributed to the severity of the truck traffic accidents. Given the dependent variable of accident severity showing an ordinal relation, the Ordinal Probit Regression was considered as the most suitable model to conduct in the first phase. According to the ‘Road Traffic Law’, slightly injured accidents are injuries that require treatment for more than 5 days and less than 3 weeks due to a traffic accident. Seriously injured accidents are those that require treatment for more than 3 weeks due to a traffic accident.
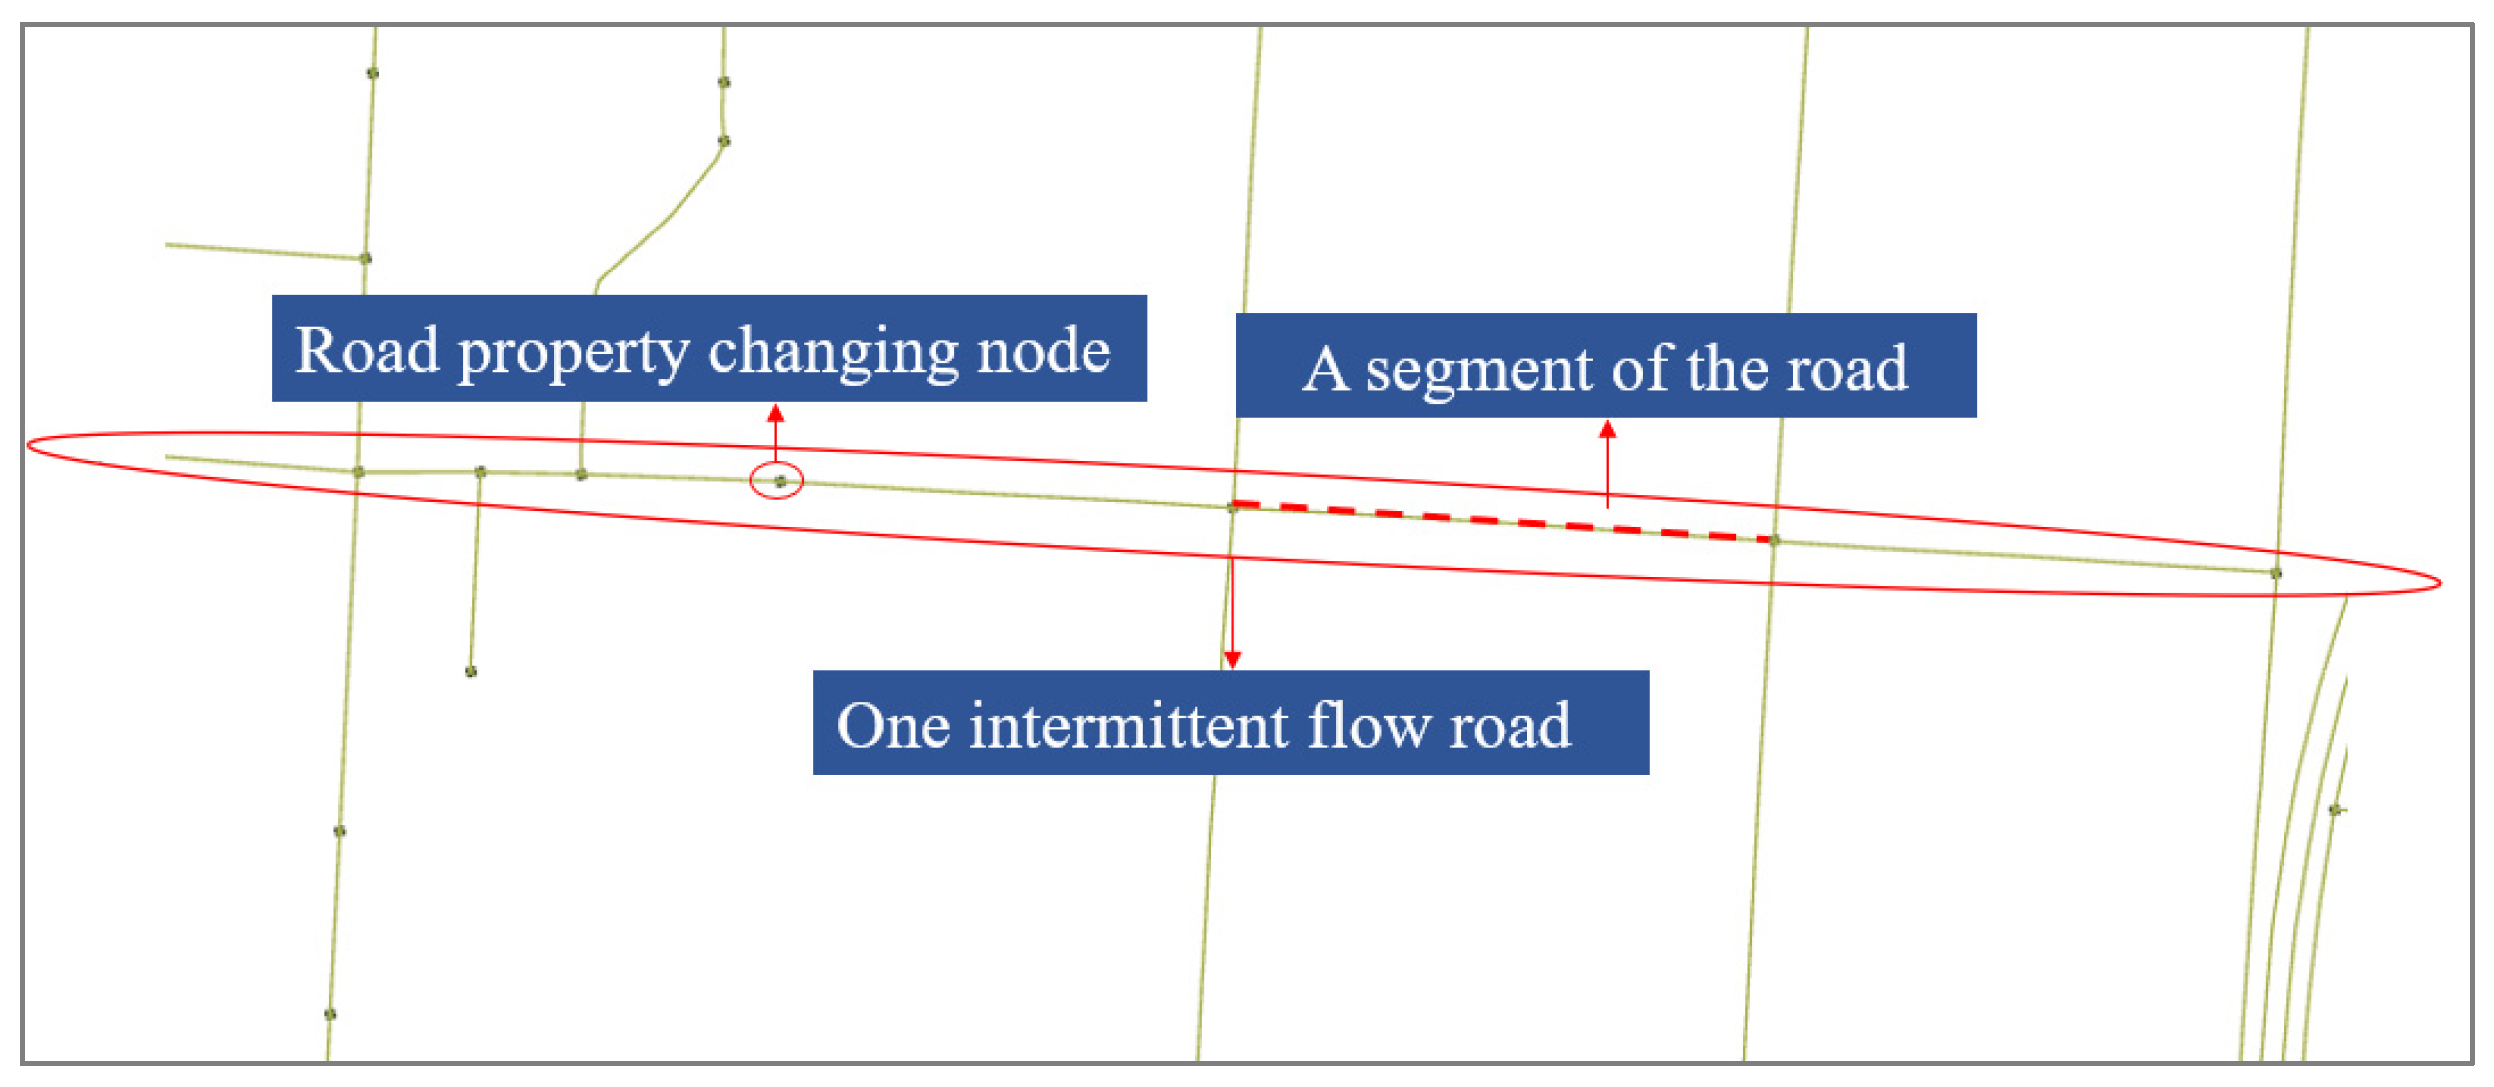
Since previous studies have demonstrated that the traffic condition factors are closely related to traffic accidents, the second phase of this study was to explore the relationship between urban traffic conditions and the severity of truck traffic accidents by considering the intermittent flow road sections as the observations. The dependent variable was the number of deaths and serious injuries caused by truck traffic accidents on an intermittent flow road. As shown in Figure 3, the independent variables acquired various attributes such as average length, average lanes, average maximum speed, and other traffic condition variables. Although traffic volume has been identified as an important factor affecting traffic accidents [13,19], this study focused on the truck accidents that happened on the intermittent flow roads in urban areas which have no traffic volume data. Therefore, the traffic volume was excluded from this study.
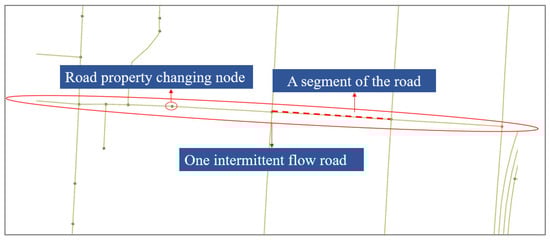
Figure 3.
Concept of an intermittent flow road.
3.2. Regression Model
3.2.1. Ordinal Probit Regression
Traditionally, the Poisson model, Logit model, Probit model, Negative Binomial model, and general linear model (various models such as generalized linear models) have been applied [20]. When analyzing variables that have characteristics of order or rank such as severity, Ordinal Probit Regression was commonly used in the previous studies. In this study, to analyze the factors that affected the severity of truck traffic accidents, the dependent variable was set as an accident grade with an order. An accident in which a slight injury appeared was designated as 0, an accident in which a serious injury appeared was 1, and lastly, an accident in which death appeared was presented as 2. In the case of general regression analysis, we were unable to identify the difference between the dependent variables y = 1 and y = 2, and the difference between y = 2 and y = 3. Therefore, there may be errors in the interpretation of the results using the general regression. To solve this limitation, the Ordinal Probit Regression is widely used. Yang et al. [21] assumed that Y represents the injury severity level, then a latent variable Y* is introduced as:
where X is the vector containing the full set values of explanatory variables, β is the vector of coefficients associated with the explanatory variables, and ε is a random error term following a standard normal distribution. The value of the dependent variable is then determined as:
where J is the number of injury severity levels (in this case, J = 3), and is the threshold parameter (cut-off point) to be estimated for each level. From the above, it can be determined that the probabilities of Y taking on each of the values j = 1, …, J are equal to:
3.2.2. Poisson and Negative Binomial Regression
As the most common model, Linear Regression is suitable for homoscedasticity. Analysis of probabilistic variances, such as the number of traffic accidents and the number of returning visitors, is not suitable for analysis with a general Linear Regression model. To solve this problem, Poisson and Negative Binomial Regression are introduced to interpret Discrete Random Variables.
The Poisson regression is a model that assumes that the expected value of the dependent variable following the Poisson distribution is explained by a linear combination of the independent variable [22].
where the log transformation form of , which is the expected value of the Poisson distribution as above, is formed by a linear combination of independent variables. In this case, the reason for using the log link function is that the Poisson distribution is always greater than 0. is expressed in the form of an exponential function of the independent variables as follows:
The estimation of the regression coefficient in the Poisson regression model mainly uses maximum likelihood estimation.
However, this Poisson Regression must satisfy the basic prerequisite that the variance and the mean are the same. In the case of the actual number of deaths or serious injuries, the overdispersion problem occurs where the variance is greater than the average. Since the Negative Binomial Regression equation starts from the assumption that the variance is greater than the mean, it is preferred to use it in the case of variance greater than the mean [22].
In this case, is a parameter representing overdispersion, and can be defined in the same way as the exponential average function shown in Equation (5). The log likelihood function for in the Negative Binomial Regression model is as below:
4. Model Estimation
4.1. Ordinal Probit Regression Analysis of Driver and Environmental Factors
4.1.1. Data Collection
In this study, the data of truck traffic accidents that happened in Incheon during 2017~2019 were collected from the Traffic Accident Analysis System (TAAS), which belongs to Korean Road Traffic Authority (KoROAD). KoROAD provides the per accident data with the information of all the driver and environmental factors considered in this study. However, the location information of each accident only appears by the administrative district, and the coordinated location information was not able to be obtained due to the ‘Privacy Act’.
Because the goal of this study was to analyze the factors affecting the severity of truck traffic accidents, only the accidents with injuries were considered. Furthermore, just 2% of accidents resulted in no injuries. According to the data, there were 2506 truck traffic accidents in Incheon between 2017 and 2019, resulting in 3614 injuries. The number of fatal, seriously injured, and slightly injured accidents were 67, 791, 1648, respectively. The comprehensive information of the descriptive statistics is shown in Table 1.

Table 1.
Descriptive statistics of truck traffic accidents in Incheon (2017–2019).
4.1.2. Definition of Logistics Facility’s Influence Area
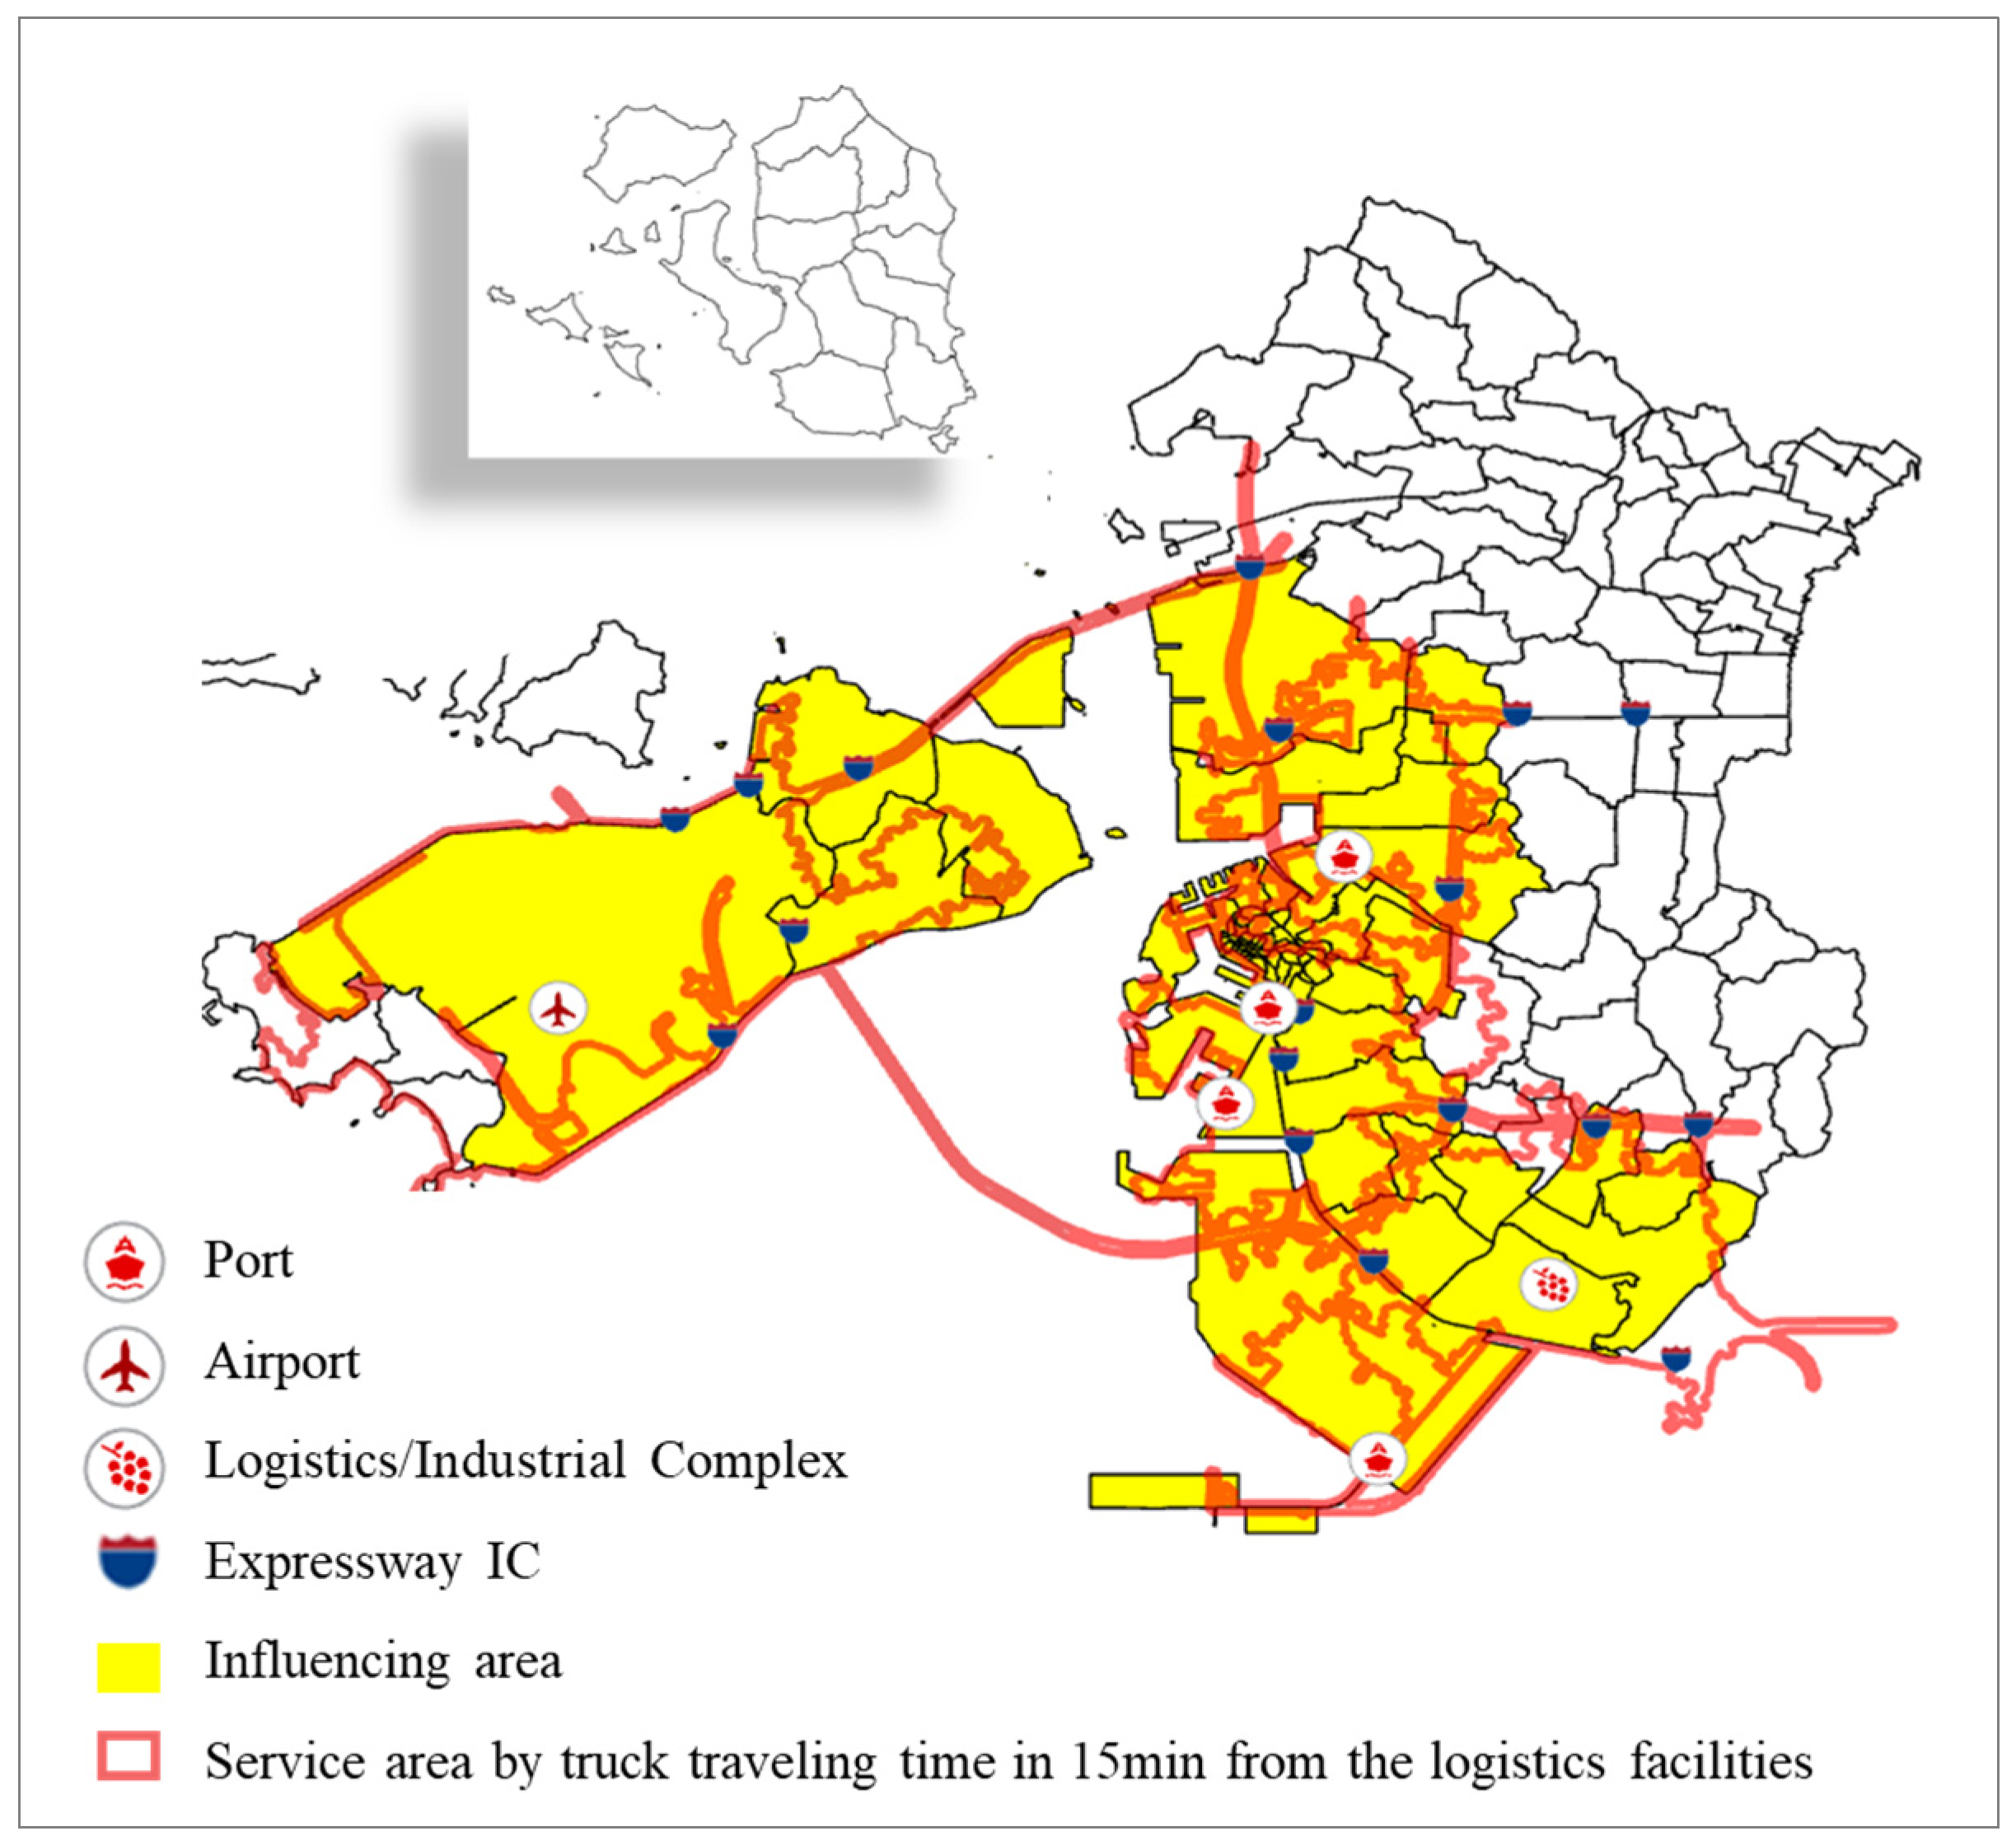
Large logistics facilities are believed to cause a significant increase in truck traffic. Incheon is a multi-model logistics city with large logistics facilities such as ports, airports, and logistics/industrial complexes. Higher truck traffic volume takes place in Incheon than in other cities. This study intended to examine whether the sphere of influence of large logistics facilities affects the severity of truck traffic accidents or not. Considering the characteristic that trucks depart from the logistics facility and enter the nearest expressway IC, in many cases, the sphere of influence was selected as shown in Figure 4.
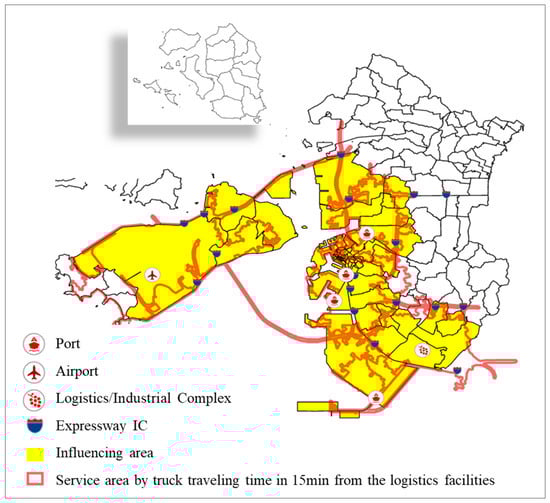
Figure 4.
Influencing area decision of logistics facilities.
4.1.3. Result of Driver and Environmental Factors
As mentioned above, in this Ordinal Probit Regression model, the dependent variable of the severity of truck traffic accidents was implemented as slightly injured accidents: 0; seriously injured accidents: 1; fatal accidents: 2. Since the significant value of the omnibus test was smaller than 0.001 which is below 0.05, this Ordinal Probit Regression model was acceptable. The model estimate results were as follows. The factors of ‘Time’, ‘Type of accidents’, ‘Logistics facility’s influence’, ‘Driver age group’, and ‘Type of violation’ appeared as affecting the severity of truck traffic accidents significantly with the values of significance being under 0.05.
According to the model estimate results (Table 2), ‘Nighttime’ was analyzed as the variable which might contribute to the severity of truck traffic accidents positively (B value: 0.482). As many studies have approved that driving at nighttime is more dangerous than the daytime due to the difficulty of vision, the necessity to take measures such as installing reflectors for traffic safety is also identified in this paper. In the ‘Type of accidents’, the ‘Single-vehicle’ was the riskiest type, even exceeding the type of ‘Vehicle to Pedestrian’. Most of the single-vehicle accidents happened due to drowsy driving and drunk driving, and these dangerous behaviors always lead to serious accidents. Restrictions on drunk driving and drowsy driving should be enhanced by the government. On the other hand, transportation companies have to ensure the drivers have enough break time. Given that the B value was 0.225, ‘Logistics facility’s influence’ appeared to have a positive effect on the severity of truck traffic accidents. Logistics facilities cause higher truck traffic volume that increases the risk of a traffic accident happening. Measures such as speed limitation need to be implemented on the roads nearby logistics facilities. In the ‘Driver age group’, only the age group of ‘Over 60’ showed a significant result, and the B value appeared with a minus pattern while the driver age increased. Recently, the education program has focused on aged drivers. However, younger drivers who lack truck driving experience may also need more attention. Lastly, ‘Lane violation’ and ‘Signal violation’ were brought out as the most pestilent types of violation with 0.458 and 0.822 B values. Strengthening the punishment on ‘Lane violation’ and ‘Signal violation’ has to be considered to reduce the risk of truck traffic accidents.
Table 2.
Estimate results of the driver and environmental factors.
Marginal effect analysis is widely used to calculate how much the significant factors increase the probability of more serious traffic accidents happening [23]. The marginal effect is an estimate of the change in accident severity due to the one unit increase in the independent variable through partial differentiation. Table 3 shows the results of the marginal effect analysis. ‘Nighttime’, ‘Vehicle to Pedestrian’, ‘Single–vehicle’, ‘Logistics facility’s influencing area’, ‘Lane violation’, and ‘Signal violation’ showed the probability of an increase in more serious truck accidents happening. However, the age of ‘Over 60’ presented an opposite pattern.
Table 3.
Marginal effect analysis.
4.2. Poisson and Negative Binomial Regression of Traffic Condition Factors
4.2.1. Data Collection
The purpose of this phase is to explain the causal relationship between the severity of truck traffic accidents and traffic condition factors. An intermittent flow road in Incheon will be considered as the observation. The number of deaths and the number of serious injuries caused by truck traffic accidents on an intermittent flow road were conducted as the dependent variables. The more deaths and serious injuries that happened, the higher the severity of the truck traffic accident on the intermittent flow road. The data of the Incheon truck traffic accidents were taken from TAAS. Excluding the detailed information that could not be confirmed, we took 2171 truck traffic accidents as subjects. The information on Incheon traffic conditions was collected from KTDB (2018).
In this section, take note that the dependent variables’ data were based on intermittent flow roads, whereas the independent variables’ data were based on segments of intermittent flow roads. Therefore, the independent variables are represented as average values. There were 688 intermittent flow roads with the traffic condition data available from KTDB in Incheon. Table 4 shows the variable description.
Table 4.
Information of the variables of traffic condition factors.
To avoid the collinearity problem among the independent variables, a correlation analysis was carried out, as shown in Table 5. The correlation (0.423) between average lanes and the number of road property-changing nodes was the highest. According to the correlation result, there were no collinearity problems in this model.
Table 5.
Correlations of independent variables.
4.2.2. Result of Traffic Condition Factors
Poisson and Negative Binomial Regression have been often used for studying topics with probabilistic characteristics such as traffic accident analysis. The difference between Poisson and Negative Binomial distribution is whether the mean is similar or lower than the variance of the dependent variable [24]. This can be verified through the one-sample Kolmogorov–Smirnov Test. According to the verification result (Table 6), the dependent variables had different distributions. In the number of deaths, the mean and variance values were 0.08 and 0.110. Given the Asymp. sig. was 1.000, which is greater than 0.05, the distribution of the number of deaths was able to be applied for Poisson Regression. On the other hand, the mean values were vastly lower than the variance values in the number of serious injuries. As all of the Asymp. sig. numbers were under 0.05, Negative Binomial Regression was better.
Table 6.
Result of one-sample Kolmogorov–Smirnov Test.
The goodness of fit for the two models is shown in Table 7. The model of the number of deaths expressed a Pearson Chi-Square with 474.816, and a Value/df with 0.698. The closer the model’s Value/df to 1.000, the better it is for the Poisson Regression model. The goodness of fit for the number of serious injuries model showed a Pearson Chi-Square with 721.034, and a Value/df with 1.060 (over 1.000).
Table 7.
Goodness of fit.
Since the significance values in both models were under 0.05, the results of the parameter estimates were significant statistically. As shown in Table 8, three of seven variables showed significant results in the number of deaths model. The independent variable of ‘Average lanes’, ‘Average max speed’, and ‘Number of road property-changing nodes’ present the significance values under 0.05. Given that all the B values of the three variables were positive, the dependent variable (Number of deaths) increased on the intermittent flow roads which keep more lanes, higher max speed, and more property-changing nodes. In the number of serious injuries model, the independent variables of ‘Average max speed’ and ‘Number of road property-changing nodes’ showed positive effects on the dependent variable (Number of serious injuries) rising significantly.
Table 8.
Result of parameter estimates.
An intermittent flow road with more lanes has a lot of traffic volume, probabilistically. Moreover, lane changes occur more frequently in multi-lanes. As lane violation increases the severity of truck traffic accidents mentioned previously, it is necessary to make efforts on lane separation. High-speed driving also promotes the severity of truck traffic accidents. Limiting the maximum speed on the accident black roads can prevent serious accident occurrences. The number of road property-changing nodes means the complexity of the traffic network. Policies to simplify the complexity of the traffic network (truck-only lane institution) on roads with a high large truck traffic volume have to be considered.
5. Conclusions
Since the fatality rate of truck accidents is twice as high as passenger car and bus accidents, researching the factors which contribute to the severity of truck traffic accidents is meaningful. This paper presented statistical analysis to clarify how drivers, environmental factors, and traffic condition factors affect the severity of truck traffic accidents in urban areas. The truck traffic accidents that happened in Incheon—which has large logistics facilities such as a port and an airport—was selected as the subject. In terms of driver and environmental factors, the Ordinal Probit Regression analysis presented that ‘Nighttime (9:00 p.m.–6:00 a.m.)’, ‘Vehicle–single’ and ‘Vehicle to Pedestrian’ accidents contributed to the truck traffic accident severity. In the logistics influencing area, truck traffic accidents had a higher possibility to be more serious than in the non-influencing area. The ‘Lane violation’ and ‘Signal violation’ also contributed to truck traffic accident severity significantly. In terms of the traffic condition factors, the number of lanes, the maximum speed, and the number of road property–changing nodes were found to be significant.
According to the statistical analysis results, this study presents several traffic safety policies, as below. For reducing the risk of driving at nighttime, it is necessary to expand the installation of devices that can assist drivers, such as a fatigue detection device, in trucks. Attaching reflective papers on the trucks and setting up reflective road signs at hazard spots are also effective methods. Since lane or signal violations and speeding increase the probability of a severe truck traffic accident, the National Police Agency has to strengthen the crackdown on illegal U-turns, signal violations, and speeding. Given that large-scale logistics facilities are the main places that generate truck traffic, many truck traffic accidents occur in the vicinity, and the severity of the accident worsens. Lowering the truck speed limitation and installing safety facilities on local roads near large-scale logistics facilities are necessary measures. In the case of Japan and the United States, dedicated truck lanes were introduced on arterial roads between logistics cities. According to the report of Kang (2019) from the Korea Research Institute, the United States predicted that it would reduce the occurrence of traffic accidents by 40% in the section where a dedicated truck-only lane was introduced. In Korean logistics cities, the establishment of a truck-only lane designation policy on the main access roads connecting large logistics facilities and highway ICs in urban areas has to be seriously considered.
However, the traffic safety problem is a complicated social issue that needs the relative departments to cooperate closely. Improving the truck transportation market structure to make a less stressful condition for truck drivers, such as by implementing diversified education programs, and strengthening truck traffic violation inspection, should also be widely considered.
This study identified the factors contributing to truck traffic accident severity in urban areas, and suggested safety policies accordingly. The result of this study is suggested to be well utilized in preparing a traffic safety policy in preparation for the continuous increase in truck traffic in urban areas. However, due to data collection limitations, the size and types of trucks were not considered in this study. It will be necessary to conduct a comparative analysis including truck size and type after improving the traffic accident data provision system in the future.
Author Contributions
Conceptualization, M.C. and H.L.; methodology, M.C., H.L. and S.C.; software, M.C.; resources, M.C. and L.Z.; data curation, M.C.; writing—original draft preparation, M.C. and L.Z.; writing—review and editing, M.C. and L.Z.; visualization, M.C.; supervision, H.L. and S.C.; All authors have read and agreed to the published version of the manuscript.
Funding
This work was supported by Incheon National University Research Grant in 2017.
Institutional Review Board Statement
Not applicable.
Informed Consent Statement
Not applicable.
Data Availability Statement
Publicly available datasets were analyzed in this study. This data can be found here: [http://taas.koroad.or.kr/], [https://www.ktdb.go.kr/eng/index.do], all accessed on 21 December 2021.
Conflicts of Interest
The authors declare no conflict of interest.
References
- Lee, J.S.; Jung, S.J.; Lee, C.S.; Huh, J.S. A study on plans for preventive measures in reducing commercial truck crashes. Korea Transp. Inst. 2016, 13, 43–50. [Google Scholar]
- Gyotong News. Available online: http://www.gyotongn.com/news/articleView.html?idxno=226132 (accessed on 21 December 2021).
- Khan, M.H.; Babar, T.S.; AHMED, I.; Babar, K.S.; ZIA, N. Road traffic accidents. Prof. Med. J. 2007, 14, 323–327. [Google Scholar] [CrossRef]
- Kang, C.M.; Chung, Y.S.; Chang, Y.J. Injury Severity Analysis of Truck–involved Crashes on Korean Freeway Systems using an Ordered Probit Model. J. Korean Soc. Civ. Eng. 2019, 39, 391–398. [Google Scholar]
- Kim, D.K.; Yoo, J.W.; Park, M.Y. Influential Factors on the Severity of Truck Crashes with Structural Equation Model. Korean J. Logist. 2012, 20, 53–62. [Google Scholar]
- Dong, C.; Richards, S.H.; Huang, B.; Jiang, X. Identifying the factors contributing to the severity of truck-involved crashes. Int. J. Inj. Control Saf. Promot. 2015, 22, 116–126. [Google Scholar] [CrossRef]
- Zhu, X.; Srinivasan, S. Modeling occupant-level injury severity: An application to large-truck crashes. Accid. Anal. Prev. 2011, 43, 1427–1437. [Google Scholar] [CrossRef] [PubMed]
- Rezapour, M.; Ksaibati, K. Application of multinomial and ordinal logistic regression to model injury severity of truck crashes, using violation and crash data. J. Mod. Transp. 2018, 26, 268–277. [Google Scholar] [CrossRef] [Green Version]
- Naik, B.; Tung, L.W.; Zhao, S.; Khattak, A.J. Weather impacts on single-vehicle truck crash injury severity. J. Saf. Res. 2016, 58, 57–65. [Google Scholar] [CrossRef] [PubMed]
- Dong, C.; Dong, Q.; Huang, B.; Hu, W.; Nambisan, S.S. Estimating factors contributing to frequency and severity of large truck–involved crashes. J. Transp. Eng. Part A Syst. 2017, 143, 04017032. [Google Scholar] [CrossRef]
- Rifaat, S.M.; Chin, H.C. Accident severity analysis using ordered probit model. J. Adv. Transp. 2007, 41, 91–114. [Google Scholar] [CrossRef]
- Behnood, A.; Mannering, F. Time-of-day variations and temporal instability of factors affecting injury severities in large-truck crashes. Anal. Methods Accid. Res. 2019, 23, 100102. [Google Scholar] [CrossRef]
- Choi, S.; Kim, M.; Oh, C.; Lee, K. Effects of weather and traffic conditions on truck accident severity on freeways. J. Korean Soc. Civ. Eng. 2013, 33, 1105–1113. [Google Scholar] [CrossRef] [Green Version]
- Cho, S.H.; Kim, D.K.; Kho, S.Y. Latent Factors of Severity in Truck-Involved and Non-Truck-Involved Crashes on Freeways. Int. J. Transp. Veh. Eng. 2017, 11, 920–927. [Google Scholar]
- Molan, A.M.; Moomen, M.; Ksaibati, K. The impact of traffic barrier geometric features on crash frequency and injury severity of non-interstate highways. J. Saf. Res. 2020, 75, 155–165. [Google Scholar] [CrossRef] [PubMed]
- Kopelias, P.; Papadimitriou, F.; Papandreou, K.; Prevedouros, P. Urban freeway crash analysis: Geometric, operational, and weather effects on crash number and severity. Transp. Res. Rec. 2007, 2015, 123–131. [Google Scholar] [CrossRef]
- Islam, M.B.; Hernandez, S. Modeling injury outcomes of crashes involving heavy vehicles on Texas highways. Transp. Res. Rec. 2013, 2388, 28–36. [Google Scholar] [CrossRef] [Green Version]
- Lee, C.; Li, X. Analysis of injury severity of drivers involved in single-and two-vehicle crashes on highways in Ontario. Accid. Anal. Prev. 2014, 71, 286–295. [Google Scholar] [CrossRef]
- Norros, I.; Kuusela, P.; Innamaa, S.; Pilli-Sihvola, E.; Rajamäki, R. The Palm distribution of traffic conditions and its application to accident risk assessment. Anal. Methods Accid. Res. 2016, 12, 48–65. [Google Scholar] [CrossRef]
- Lee, S.Y.; Han, S.J.; Chung, Y.S. Injury Severity of Freeway Crashes in Rainy Weather Using an Ordered Probit Model. J. Transp. Res. 2020, 27, 1–11. [Google Scholar]
- Zhang, Y.; Li, Z.B.; Liu, P.; Zha, L.T. Exploring contributing factors to crash injury severity at freeway diverge areas using ordered probit model. Procedia Eng. 2011, 21, 178–185. [Google Scholar]
- Nelder, J.A.; Wedderburn, R.W. Generalized linear models. J. R. Stat. Soc. Ser. A (Gen.) 1972, 135, 370–384. [Google Scholar] [CrossRef]
- Chung, Y. Injury severity analysis in taxi-pedestrian crashes: An application of reconstructed crash data using a vehicle black box. Accid. Anal. Prev. 2018, 111, 345–353. [Google Scholar] [CrossRef] [PubMed]
- Fridstrøm, L. Disaggregate accident frequency and risk modelling, A rough guide. Transp. Inst. 2015, 1403, 1–55. [Google Scholar]

Publisher’s Note: MDPI stays neutral with regard to jurisdictional claims in published maps and institutional affiliations. |
© 2022 by the authors. Licensee MDPI, Basel, Switzerland. This article is an open access article distributed under the terms and conditions of the Creative Commons Attribution (CC BY) license (https://creativecommons.org/licenses/by/4.0/).