Article

Experimental Francis Turbine Cavitation Performances of a Hydro-Energy Plant

1
College of Petroleum Engineering, Liaoning Shihua University, Fushun 113001, China
2
State Key Laboratory of Hydro-Power Equipment, Harbin Institute of Large Electric Machinery, Harbin 150040, China
3
Fujian Shuikou Power Generation Group Co., Ltd., Fuzhou 350004, China
*
Author to whom correspondence should be addressed.
These authors contributed equally to this work.
Sustainability 2022, 14(6), 3263; https://doi.org/10.3390/su14063263
Submission received: 29 December 2021 / Revised: 2 March 2022 / Accepted: 7 March 2022 / Published: 10 March 2022
(This article belongs to the Special Issue Renewable Energy: Sources, Conversion and Utilization)

Abstract

:
An investigation is conducted on the Francis turbine’s cavitation characteristics and its influence on system hydraulic stability using two experimental methods, namely the flow visualization and acoustic emission methods. The investigated turbine is of Francis type with a 15-blade runner and has a specific speed of 202 rpm and a rated head of 30 m. Having tested the machine under a wide range of cavitation conditions, the gap cavitation is the earliest to develop as the cavitation coefficient gradually decreases and has no obvious effect on the machine’s external performance characteristics. The airfoil cavitation follows and causes the increase and decrease in machine flow rate and head, respectively, showing its drag reduction effect, where, at the same time, the pressure pulsation amplitude gets to its peak value. There is also the formation of constant cavitation zones and the involvement of an unsteady surge close to the wall of the draft tube’s cone. Pushing the cavitation coefficient to even lower values, there is the formation of an annular cavitation zone, accompanied by a sharp drop in cone pressure pulsation amplitudes while the former drag reduction effect disappears. The trend of noise is basically the same as that of pressure fluctuation, which confirms its trustworthiness when it comes to cavitation occurrence detection within Francis turbines.

1. Introduction

Ensuring global energy access to all constitutes one of United Nations’ sustainable development goals [1]. At the same time, there is a global will to shift the energy generation dependence from fossil fuels to renewable energy sources such as solar, wind, and hydropower [2,3,4]. This is in line with the current global move to fight climate change by promoting the energy production through low-carbon combustion-free energy sources (LCCF) [5]. The utilization of LCCF energy sources has seen continuous growth, at least within the 21st century and is projected to grow further in the coming years [6]. As an example, through the European green deal, European countries expect a climate-neutral Europe by 2050, relying on different proposed measures, such as the adoption of LCCF energy sources among others [7]. Among the currently available renewable energy sources (RES), hydropower is the largest source of renewable electricity with its current global installed capacity of more than 1300 GW, and it is projected to grow by 60% in 2050 [8]. In an electrical power grid, hydropower plants display a great ability to flexibly operate hand in hand with the intermittent nature of RES-generated power (mostly solar and wind power), mainly acting as the balance recourse [9]. Indeed, as also mentioned by Jiao et al. [10], a high penetration of intermittent renewable energy sources in the power grid may lead to different incidents, such as a power outage or grid stability issues [11,12].
Owing to its ability to quickly change its operations from high to low power generation or vice versa, hydropower ranks among the most efficient means to deal with RES-inflicted grid instabilities [13,14]. In these plants, Francis turbines constitute roughly 60% of the worldwide installed capacity and are either used for base load generation or, as mentioned above, stabilization of electrical power grids [15]. In their daily operations, these machines may be obliged to operate under off-design conditions to synchronize their output with the grid or be forced into frequent start-stops beyond the machine nominal operating standards [16]. Under these conditions, the machine will endure different detrimental phenomena such as cavitation, draft tube vortex rope, and draft tube cavitation surge [17,18,19]. The occurrence of these phenomena within the machine undermines its operational efficiency, inducing detrimental pressure pulsations and resultant structural vibration and noise [20,21]. The latter may lead to the breakage of different machine components (runner blades or guide vanes) or the disruption of the whole plant in case of resonance with the natural frequency of the plant structure [22,23,24,25].
A Francis turbine operating under BEP (Best Efficiency Point) conditions exhibits an almost axial flow velocity at the runner outlet. Under off-design conditions, however, secondary flow structures develop within the machine flow channels, leading to the emergence of a tangential component of the water flow velocity at the runner outlet, which eventually gives birth to the draft tube vortex rope [26,27,28,29,30]. When the local pressure within the draft tube vortex core substantially drops, cavitation takes place, turning the initial draft tube swirling flow into a cavitating vortex rope [31,32]. The latter has been found to be very sensitive to the machine operating conditions. Under over-load conditions (Q > QBEP), an axisymmetric vortex rope is formed, possibly leading to a cavitation surge occurrence and, subsequently, high pressure pulsation amplitudes. On the other hand, a helical processing vortex rope is formed within the draft tube for part-load operating conditions (Q < QBEP) [33,34,35,36].
Speaking of cavitation specifically, Kamal et al. [37] emphasized that cavitation ranks among the highly detrimental phenomena that quickly degrade the turbine’s performance. Among its possible causes, Tiwari et al. [38] cited high flow speed, low local pressure, and abrupt change in flow direction as the most outstanding ones. Cavitation considerably affects the dynamic stability and the efficiency of the turbine and reduces its operational life span by inflicting damages and fatigue on the turbine structure due to involved structural vibrations and material erosion (surface pitting) [39,40,41,42]. Depending on the machine operating conditions, cavitation takes place at different locations within the turbine’s flow zone, such as the blade tip clearance, blade trailing edge, blade leading edge, inter-blade zone, and runner downstream zone [43,44,45,46]. In a study conducted by Sun et al. [47] on inter-blade cavitation dynamics within a Francis turbine, a negative flow incidence angle at the runner blade’s leading edge was identified as the main trigger of inter-blade cavitation inception and development. The inter-blade cavitation vortices were helical shapes, attached on the runner hub and extending towards the runner outlet zone, with a processing frequency equivalent to that of the runner rotation. In the same respect, Yamamoto et al. [48,49] confirmed that the runner inter-blade cavitating vortex development is somehow linked with flow recirculation that emerged within the vicinities of the runner hub under deep part-load conditions. An exploration of the cavitation development at the runner blade’s trailing edge under part-load conditions and its intensification with the cavitation number decrease has been performed by Liu et al. [50]. At the same time, they also explored the emergence of a draft tube cavitating vortex rope with a processing frequency falling within the range of 0.22–0.31 fn (fn: runner rotational frequency) under part-load conditions. This somehow implicates that, as mentioned in the above sections, part-load operating conditions are linked with the draft tube helical cavitating vortex rope emergence, where its cavitating core volume depends on the under-pressure level. In a study conducted by Iliescu et al. [51], the rope diameter was found to increase with the decrease of the Thoma cavitation number for a Francis turbine operating under 70% QBEP flow conditions. Almost similar effects of cavitation number variation on turbine cavitating behavior have been recorded by Decaix et al. [52], where, however, the over-load operating conditions (130% QBEP) were considered. With a continuous decrease in cavitation number, the cavitation volume increased both at the runner blade’s trailing edges and within the core of a draft tube axisymmetric cavitating vortex rope. The latter exhibited self-excited collapses and re-emergence behaviors for very low cavitation numbers, which generally leads to extremely high pressure pulsation amplitudes [53].
Speaking of pressure pulsation characteristics linked to the cavitating vortex rope procession, Marko et al. [54] has found that there is an obvious interdependence between the vortex rope structural rotations and the associated pressure pulsation characteristics. Cheng at al. [55], investigating the draft tube vortex rope strength under part-load conditions, used numerical and experimental testing methods to study draft tube flow dynamics under a wide range of part-load flow conditions. They found the machine operating flow conditions as the main parameter that influences draft tube vortex rope strengths. For the five investigated flow conditions, the vortex rope was non-existent for very low flow conditions, then eventually incepted and strengthened with the machine influx increase, reaching its strongest state under 88% QBEP conditions. At this point, the associated pressure pulsation amplitudes were the highest, while the corresponding pulsation frequency got transmitted throughout the whole flow passage, both in the upstream as the downstream flow zones. On the other hand, Yu at al. [56] identified two types of pulsations, one taking source from the vortex rope rotation itself, the other from the cavitation volume surge. With the decrease in cavitation number, pressure pulsations linked with the cavitation volume surge displayed a constant frequency with considerably increasing amplitudes. On the other hand, both the pulsation frequency and amplitudes slightly increased with cavitation number decrease for the case of pressure pulsations linked with vortex rope rotation. Escaler et al. [57], investigating the draft tube flow and pressure pulsation characteristics among others, experienced a vortex rope-associated instability under low load conditions, which eventually disappeared and reappeared under BEP and over BEP conditions, respectively. Maximum pressure pulsations were recorded under full load conditions, where, in a correspondent way, recorded amplitude modulations for acoustic emissions and vibrations were the highest.
As also shown in different works, there is a direct link between local cavitation development extent, field pressure pulsation characteristics, machine structural vibration, and local acoustic emissions [58,59]. This has led to many investigators taking both vibration and acoustic emission detection technics as reliable means to detect the cavitation development extent within different fluid systems [60,61,62].
Therefore, targeting to the analysis of cavitation occurrence within hydraulic turbines, recent studies have also focused on both these methods. Among others, Branko et al. [63] used the vibro-acoustic method to monitor and identify the early cavitation. The method consists of collecting the noise signal in the draft tube and comprehensively evaluating the associated cavitation degree. In the same respect, through model testing, Gruber et al. [64] collected cavitation vibration signals of the turbine at guide bearings and guide vanes and analyzed the envelope spectrum of signals in the range of 40–50 kHz. Dupont et al. [65] have used a cavitation noise detection method to study the cavitation development mechanism in a hydraulic turbine. Bourdon et al. [66] used the acceleration sensors to monitor cavitation noise of a Francis turbine, trying to find the relationship between the power spectrum of noise signal and cavitation intensity. Zhao et al. [67] adopted an energy method to study the cavitation noise of turbines. The level of cavitation at which the turbine operating efficiency started to decline has been determined. However, it was found that, unlike the machine efficiency, the developed power started to decline when the turbine cavitation level had already attained an advanced level.
As shown in the above discussed works, cavitation remains a detrimental phenomenon considerably affecting the safe operations of Francis turbines in different hydropower plants. In order to mitigate its occurrence or control its damaging levels, its development mechanism has to be accurately detected. This has been subject to continuous studies, where different cavitation detection technics have indeed been explored, as shown in the above literature. However, due to the complexity of turbine cavitation dynamics, each of the available technics have presented a certain level of accuracy, but many fail to satisfactorily dissect all involved development phases. Therefore, the usage of a multi-technique cavitation diagnosis approach may be more effective.
In this respect, the present article tries to study the turbine cavitation performance by gradually extracting the turbine cavitation development information using a combination of three different techniques, namely the synchronous flash imaging technology, time-passive technology of high-speed photography, and cavitation noise detection technology. A relationship between the cavitation coefficient and the machine’s external performance characteristics has been established, based on the determination of both the initial and critical cavitation coefficients and by visually capturing the onset and development process of cavitation. The experimental findings presented in this article provide support for the cavitation performance optimization for turbine runners.

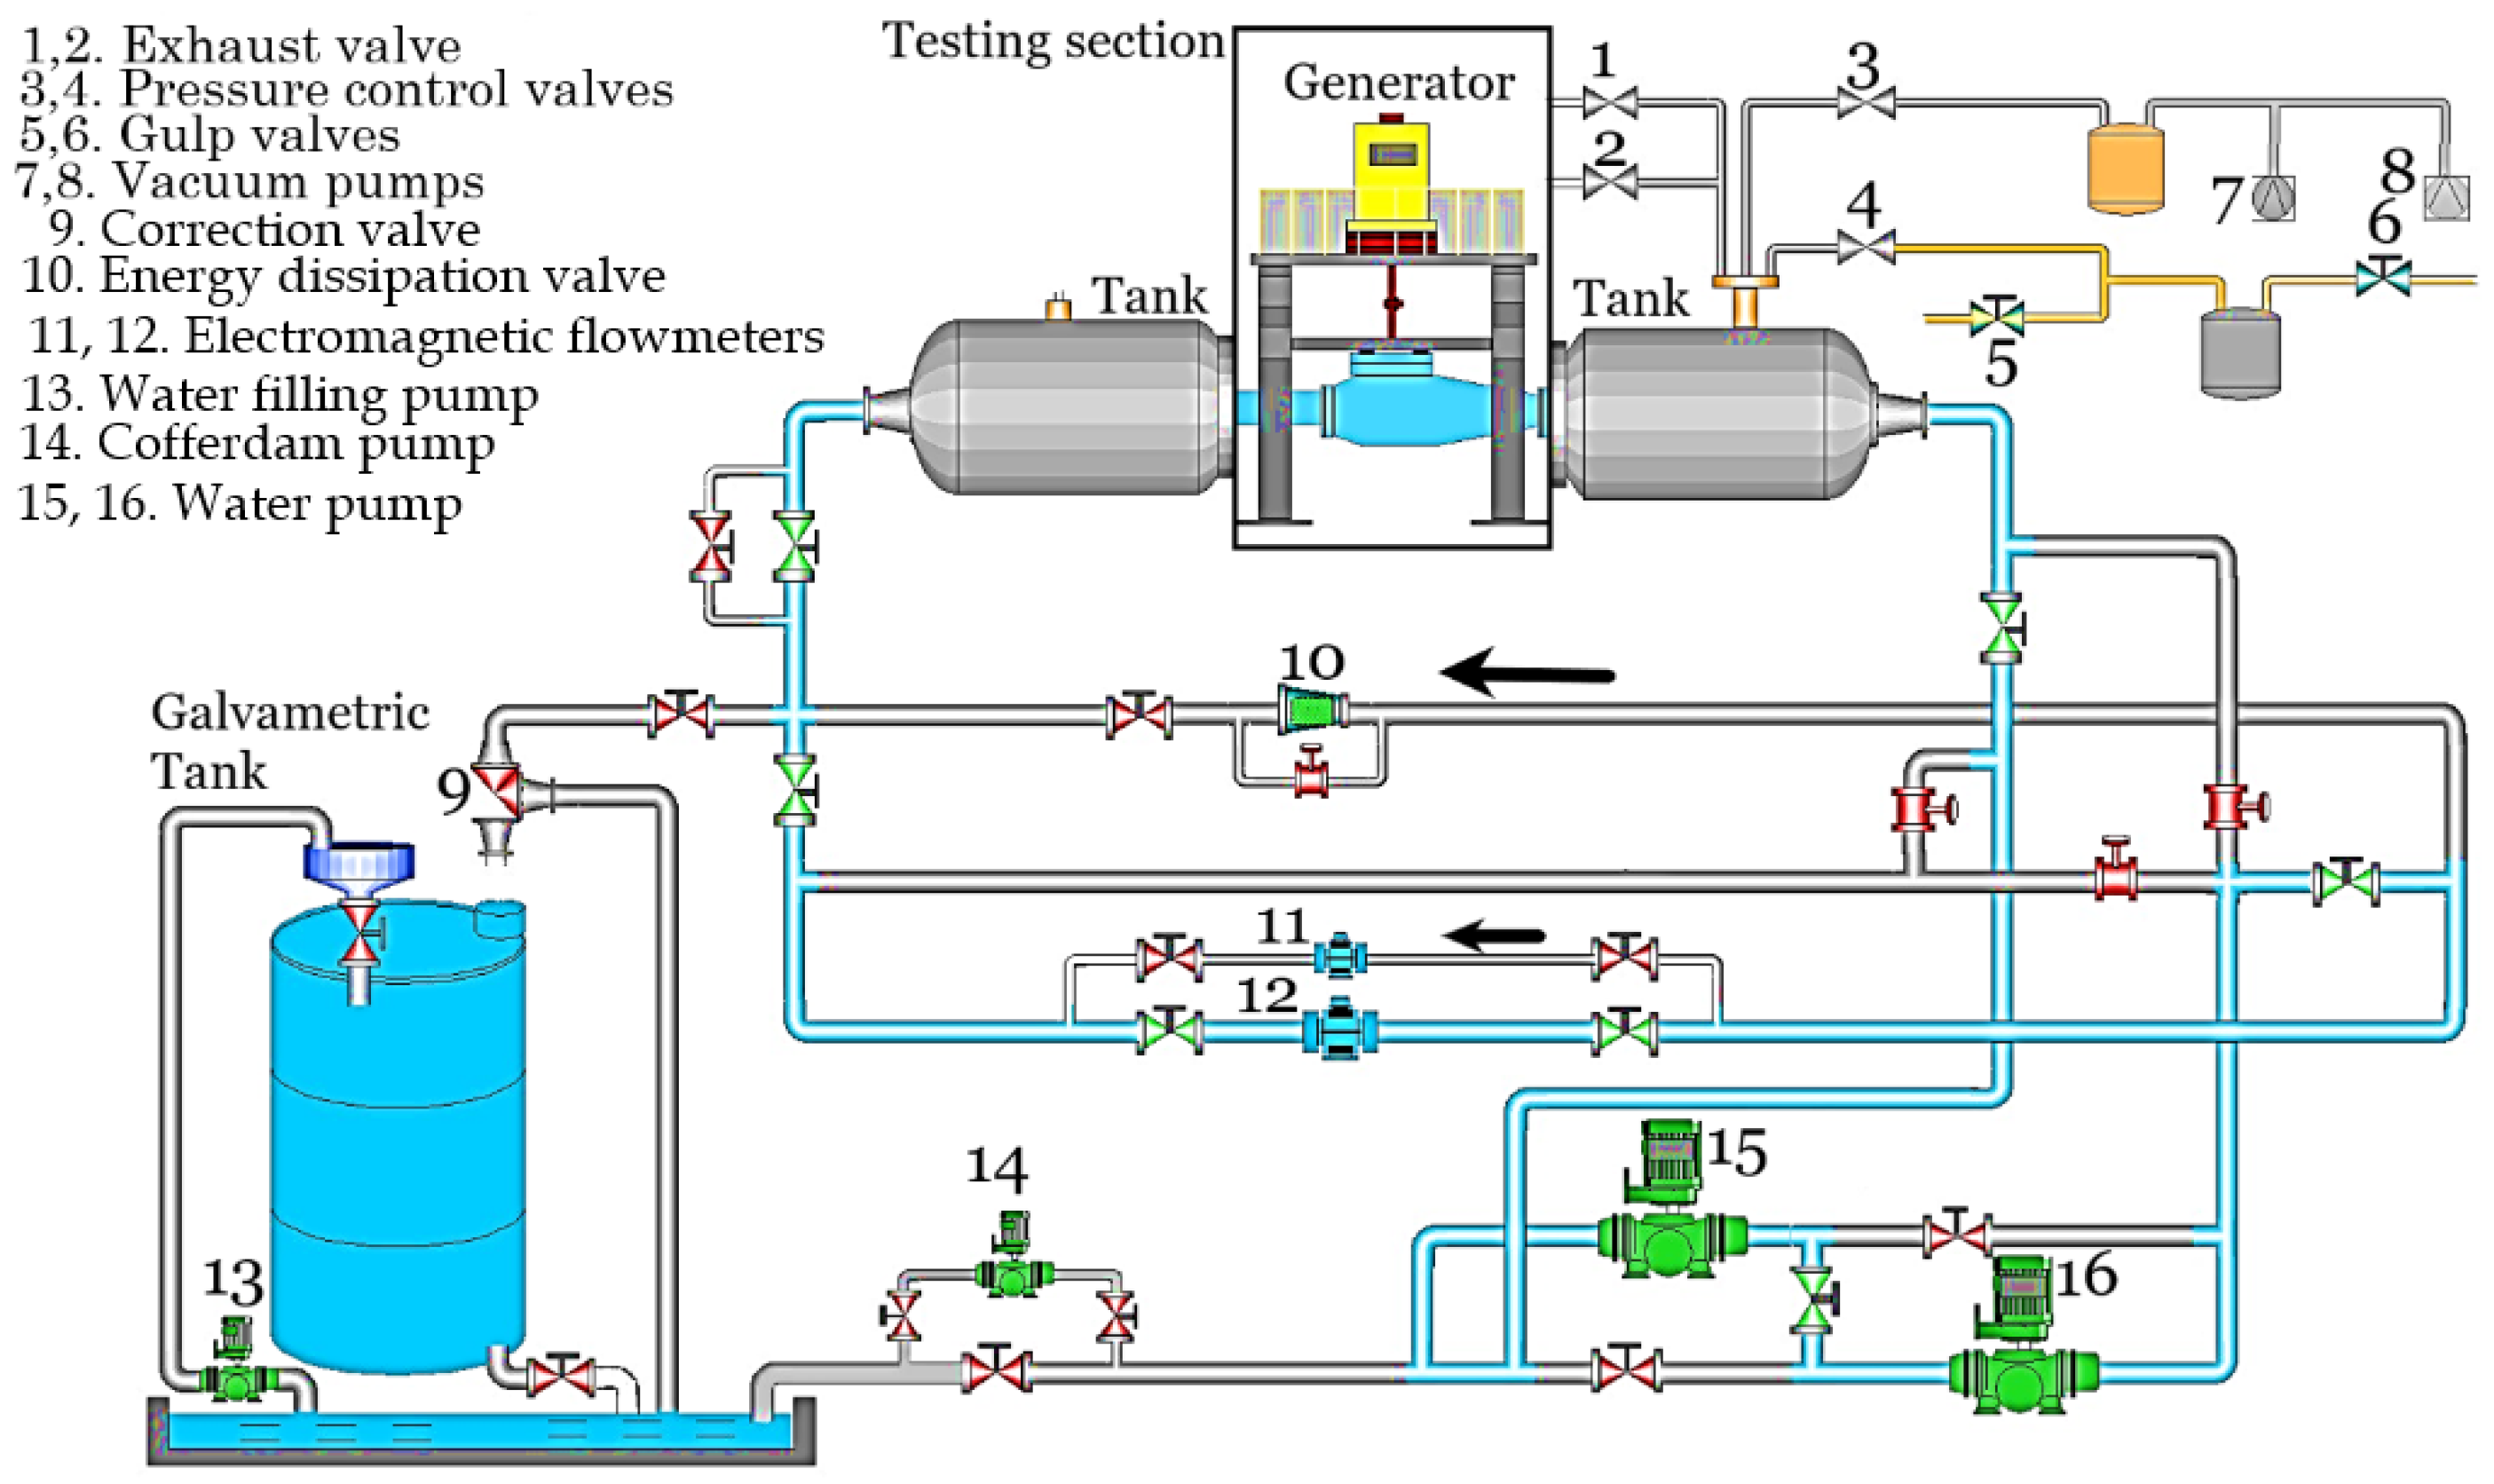
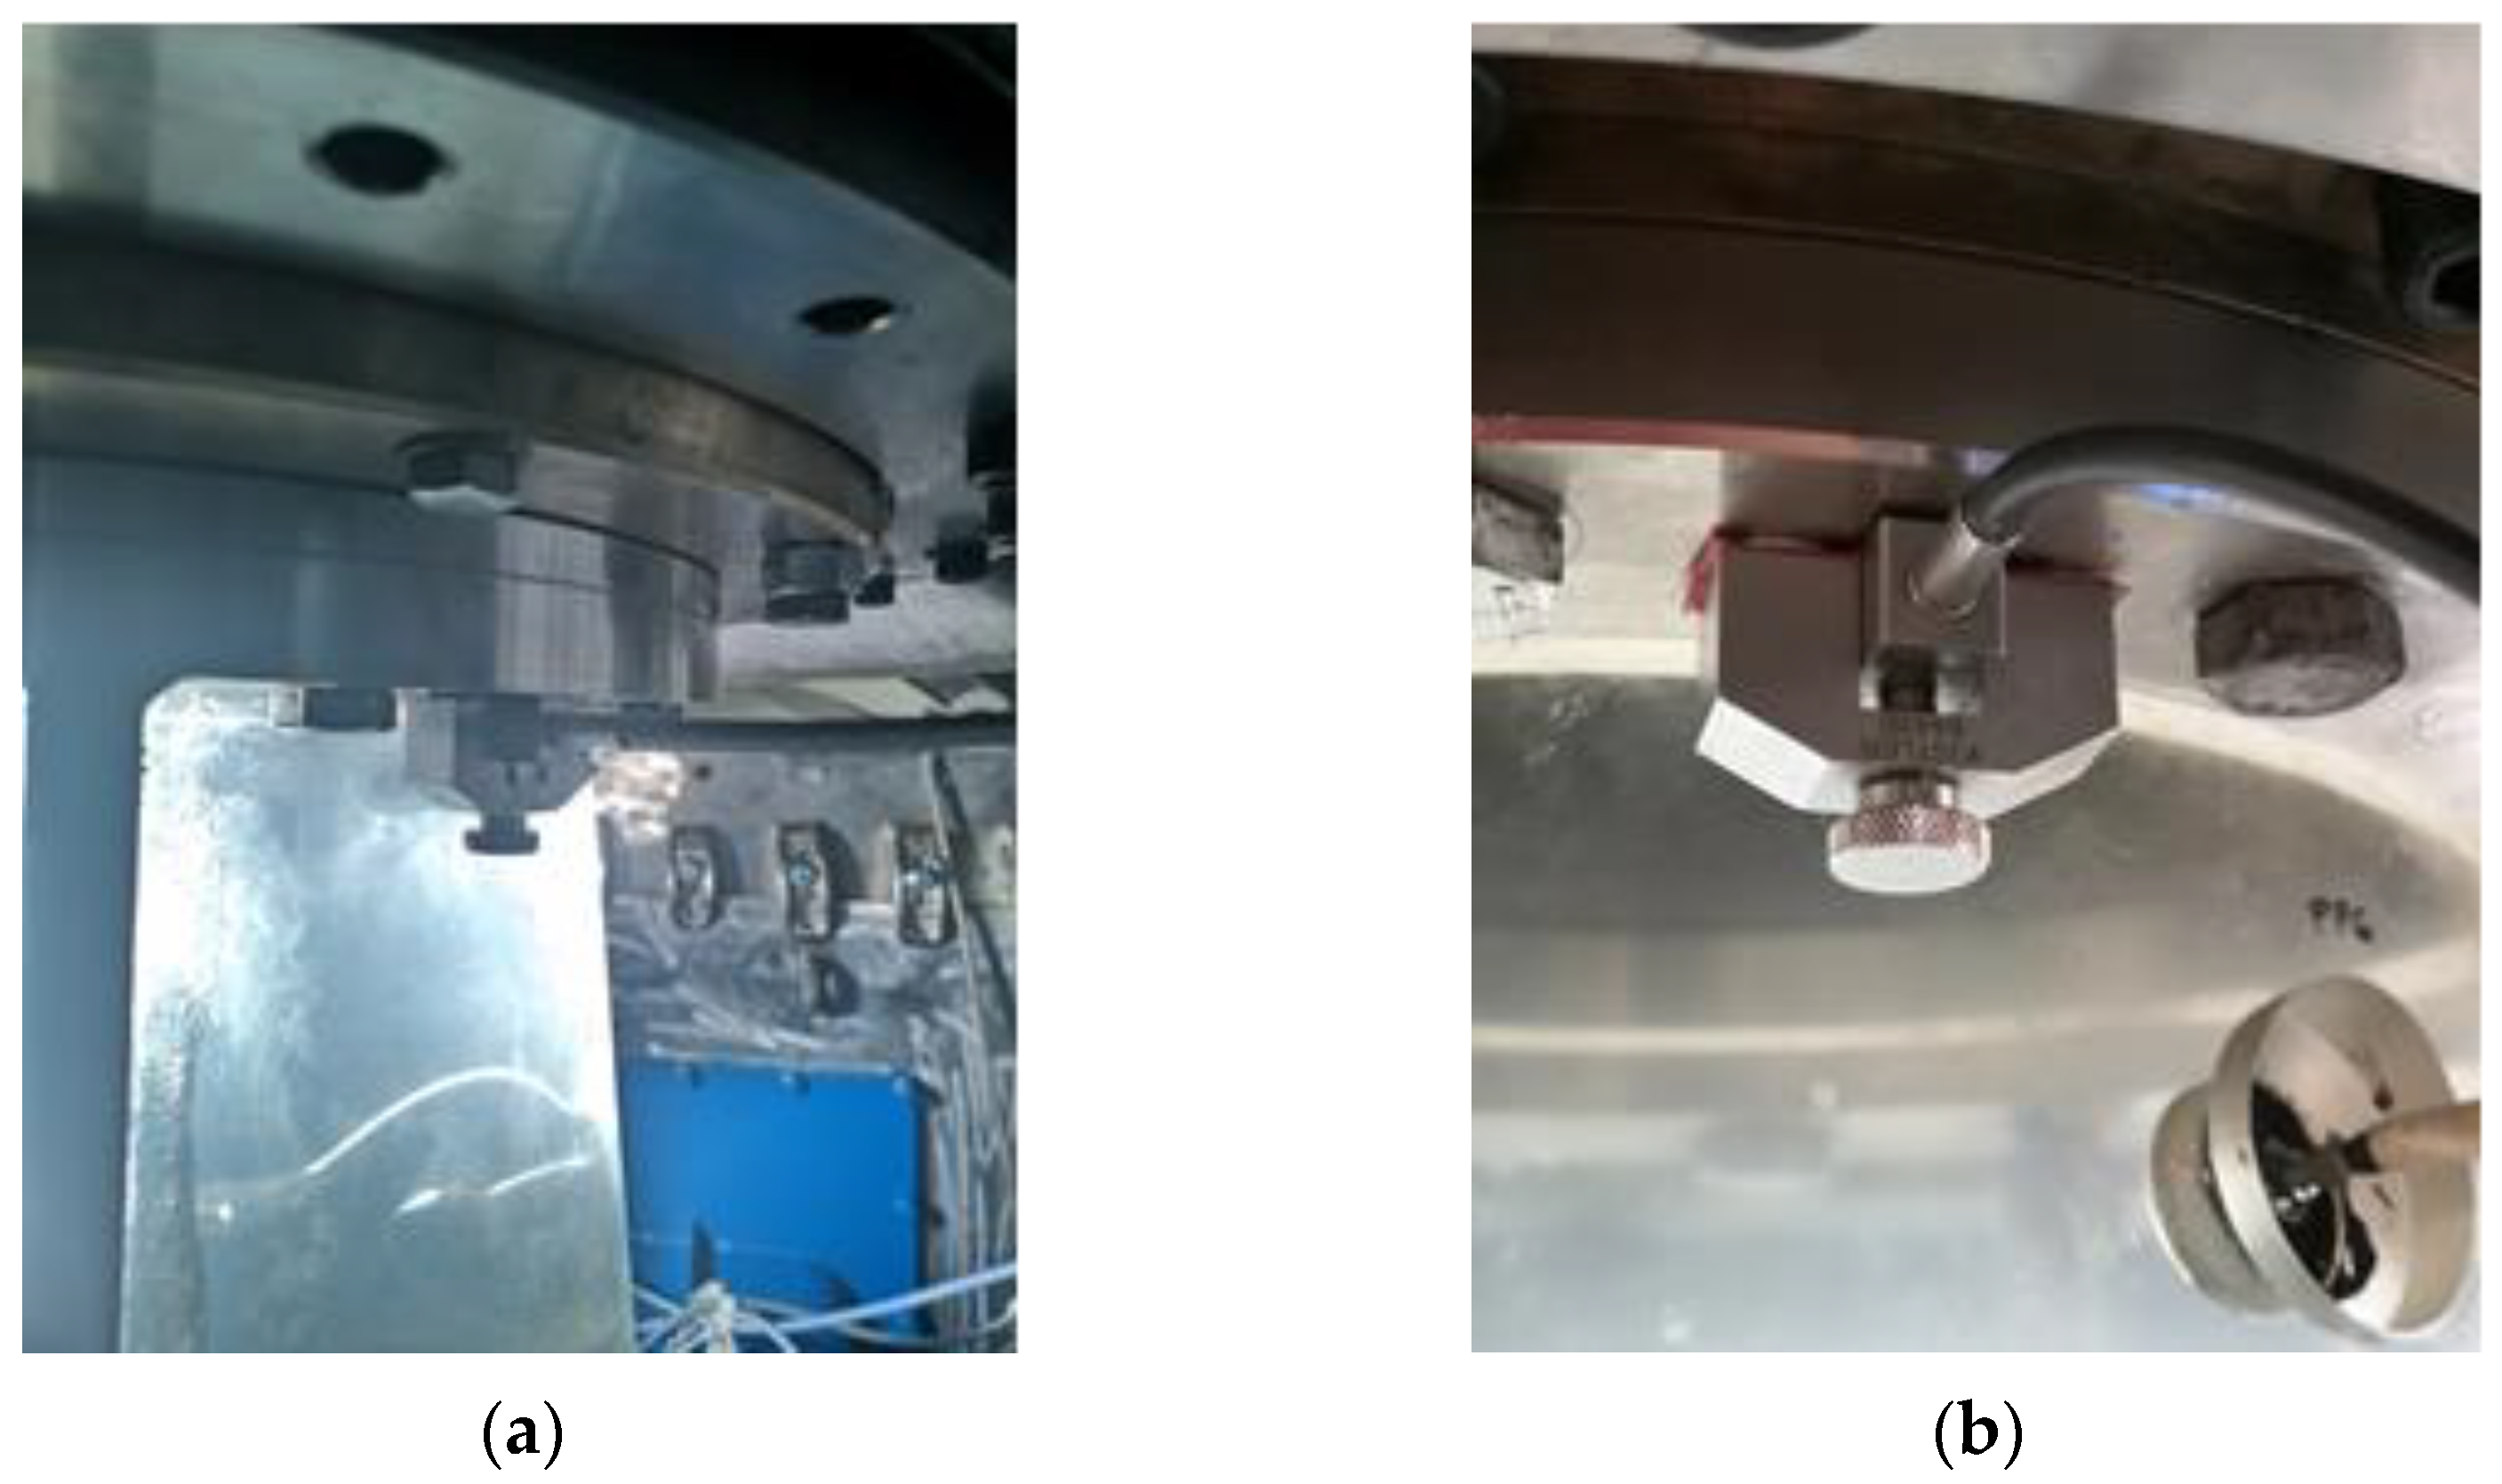
2. Materials and Methods

The test research was carried out on No. 5 Hydraulic Test Platform of Harbin Electric Corporation in Harbin, China. Figure 1a shows the turbine testing section with inlet and outlet pressure measurement zones marked. The tested turbine runner is of Francis type with a 420 mm diameter, 15 blades, a rated head of 30m, and a dynamic specific speed ( N s = n P 1 2 / H 5 4 ) of 202 rpm. The tested runner is shown in Figure 1b. This test platform can carry out conventional tests such as turbine efficiency, cavitation, runaway speed, and auxiliary tests such as pressure fluctuation, axial force, hydraulic moment of guide vane, etc. In addition, the flow visualization system of this platform can be used to observe the internal flow pattern of hydraulic machinery. The testing system operates in open mode during flow calibration and in closed mode during the performance test. The maximum test head Hmax is 40 m, and the maximum discharge Qmax is 2 m3/s. Among other characteristics of the test rig, the power and speed range of the generator are 350 kW and 0–3000 rpm, the power used pumps is 400 kW, the volume of flow calibration tanks is 160 m3, the volume of the main reservoir is 3000 m3, and the overall efficiency uncertainty is ≤0.20%. Figure 2 shows the schematic diagram of the hydraulic test platform. The experimental platform can measure the torque, flow rate, hydraulic specific energy, net suction elevation, pressure fluctuation, and other conventional hydraulic performances. Throughout the conducted tests, optical fiber endoscope and digital industrial camera are used to display the internal flow field, so as to observe the flow separation, initial cavitation, vortex rope, and other cavitation phenomena. The dimension of optical fiber endoscope used in this test is 10 mm × 300 mm × DOV50/80/90°, the diameter of the probe is 10 mm, the working length is 300 mm, and the fixed optical cable is 4 m.
At the same time, Kistler 8152 b, a high temperature acoustic sensor, is used to measure the noise signal. The sensor uses the pressure point crystal as the sensing element, which has high sensitivity and a wide frequency response range, where the maximum response frequency can reach 400 kHz. Kistler 5125 acoustic signal conditioner is used for signal conditioning. The conditioning unit can provide power for 8152 acoustic emission sensor and carry out high-frequency amplification.
Its internal built-in RMS converter can select the output signal and has a built-in filter to provide 1–1000 kHz filtering for the input signal. At last, the NIcDAQ data acquisition system was used to collect the data for further analysis (acquisition rate: 2.8 MS/s). The system is shown in Figure 3. In order to better capture the acoustic energy radiated to the surroundings by the bubble collapse within the runner inter-blade cavitation zones, the installation position of the sensor is selected as close as possible to the cavitation position of runner blade. According to the previous research, for a Francis turbine, the runner blade-attached cavitation usually appears near the runner shroud (the connections of blades and shroud are the first places where cavitation induces). Considering the installation features of the acoustic sensor, the sensor is installed on the flange near the runner outlet of the cone tube, and the specific installation position is shown in the Figure 4.

3. Results

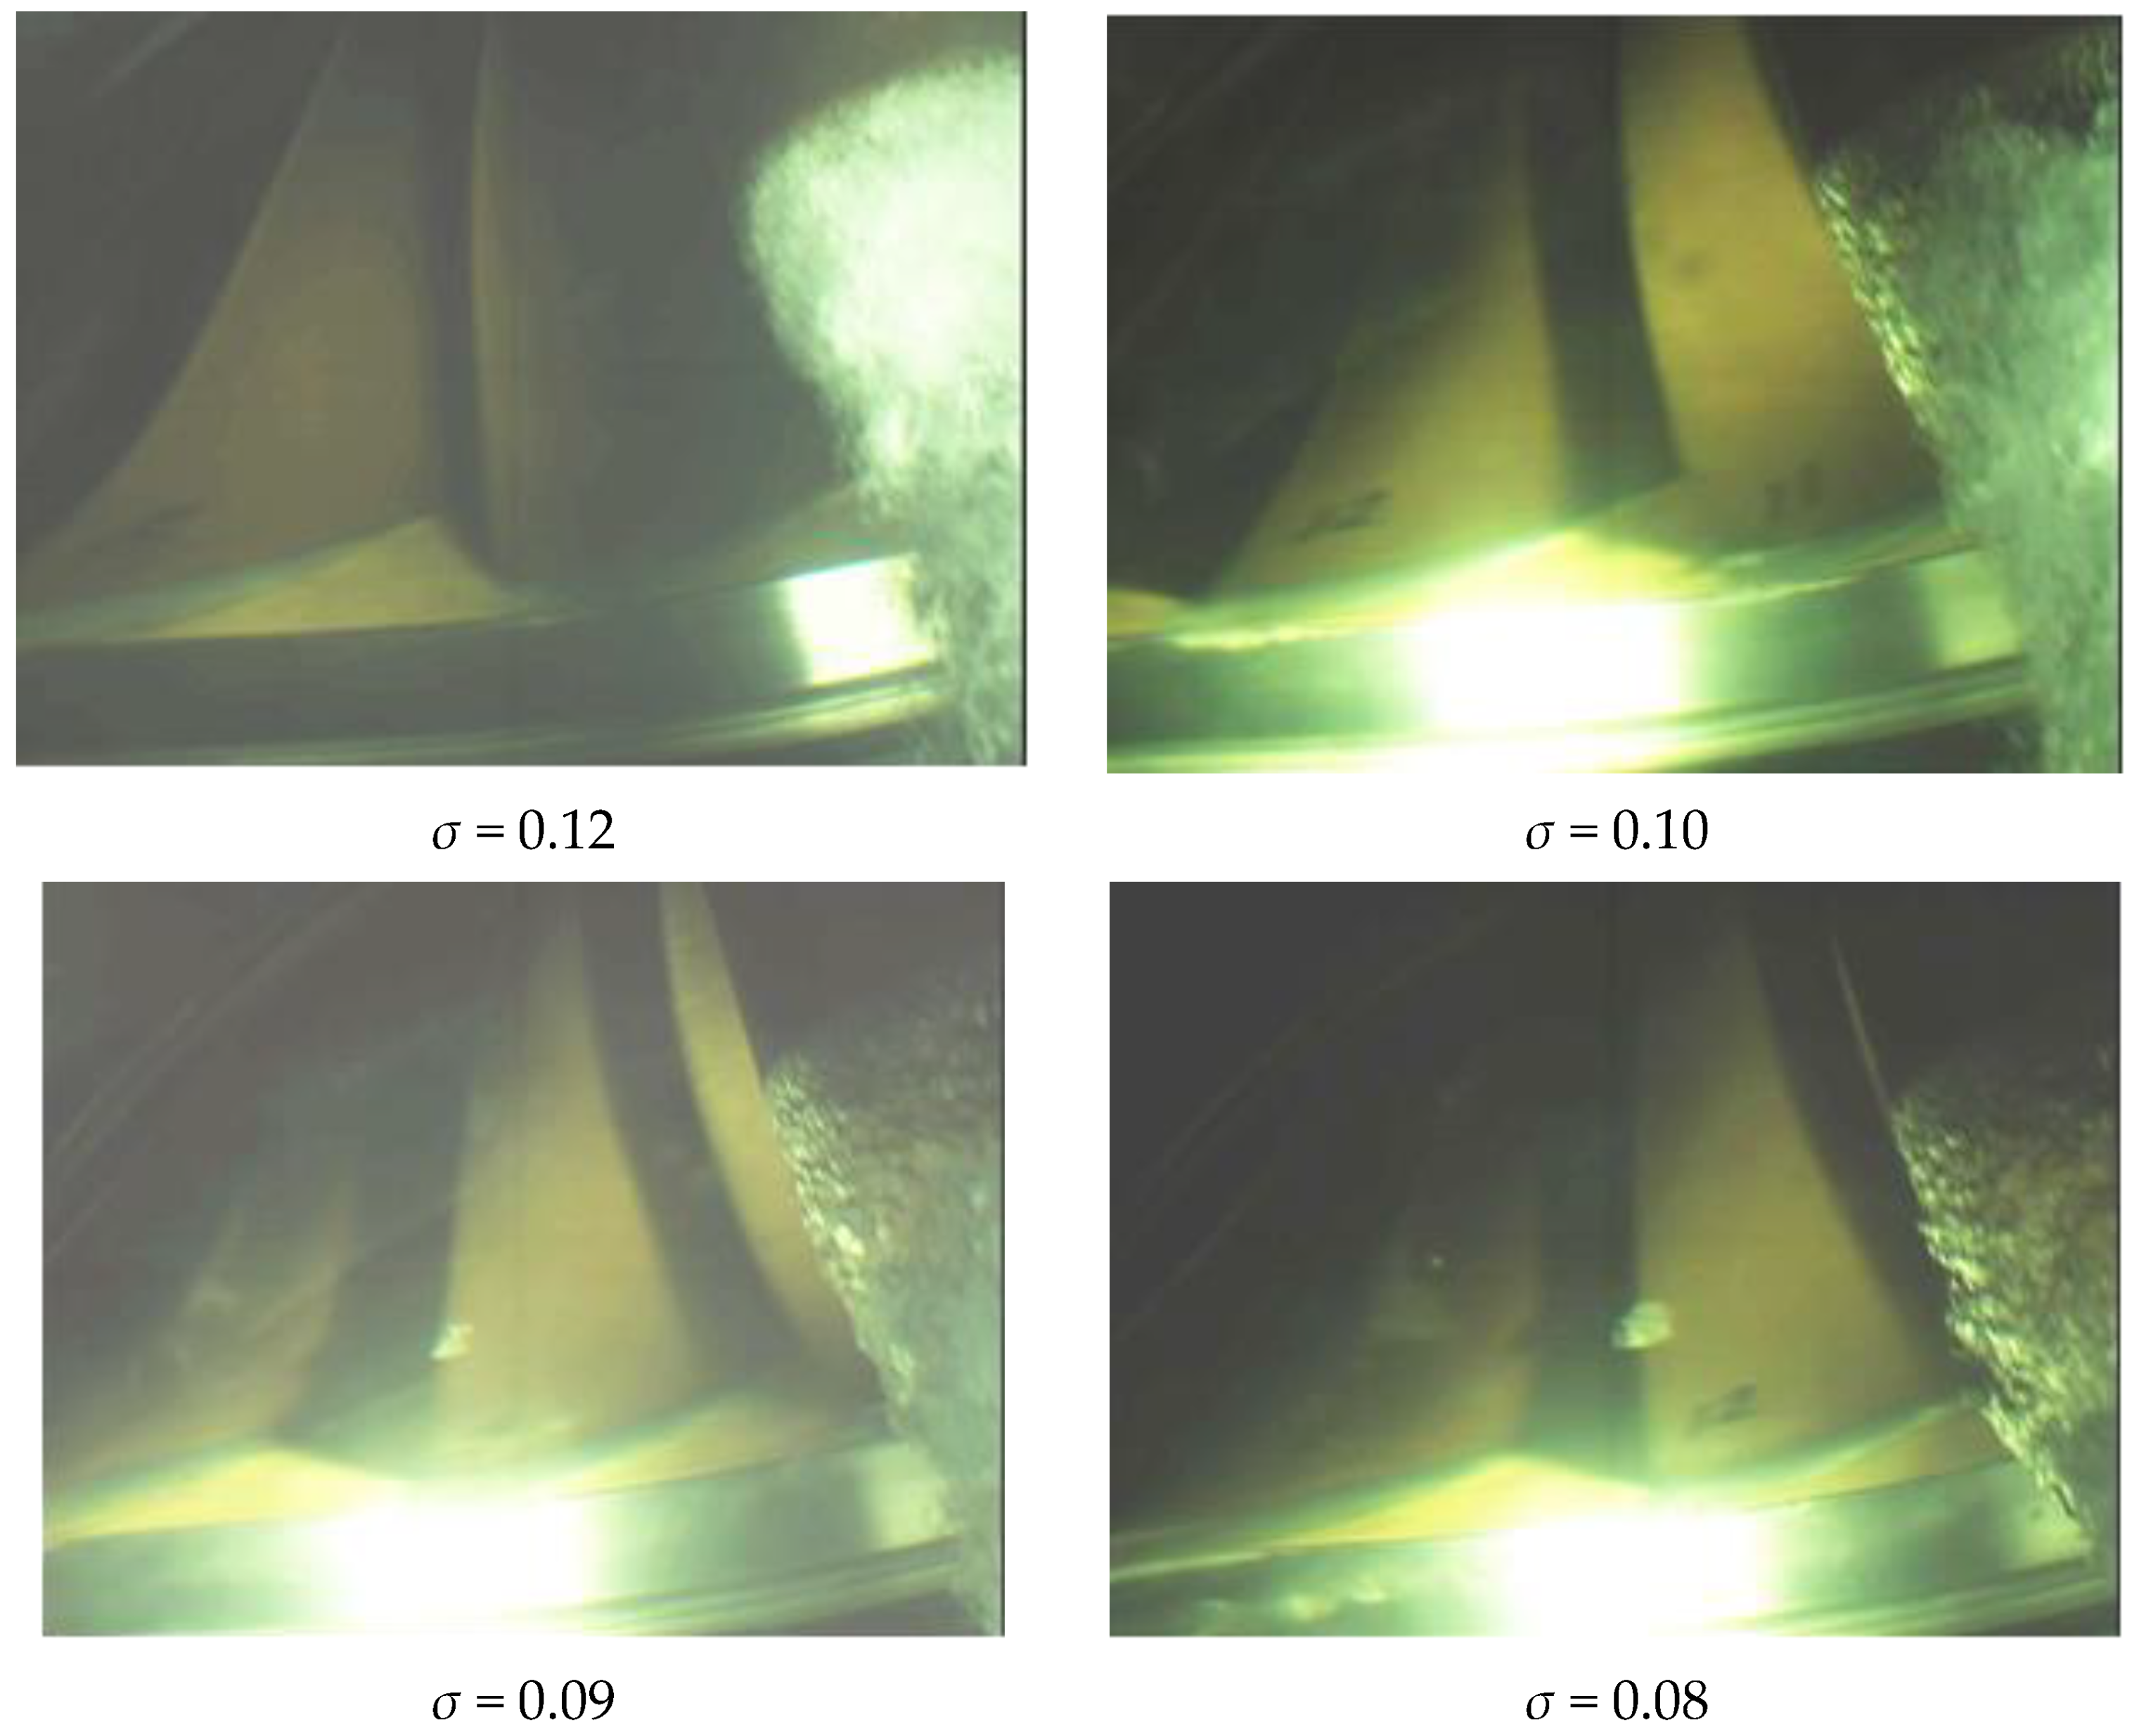
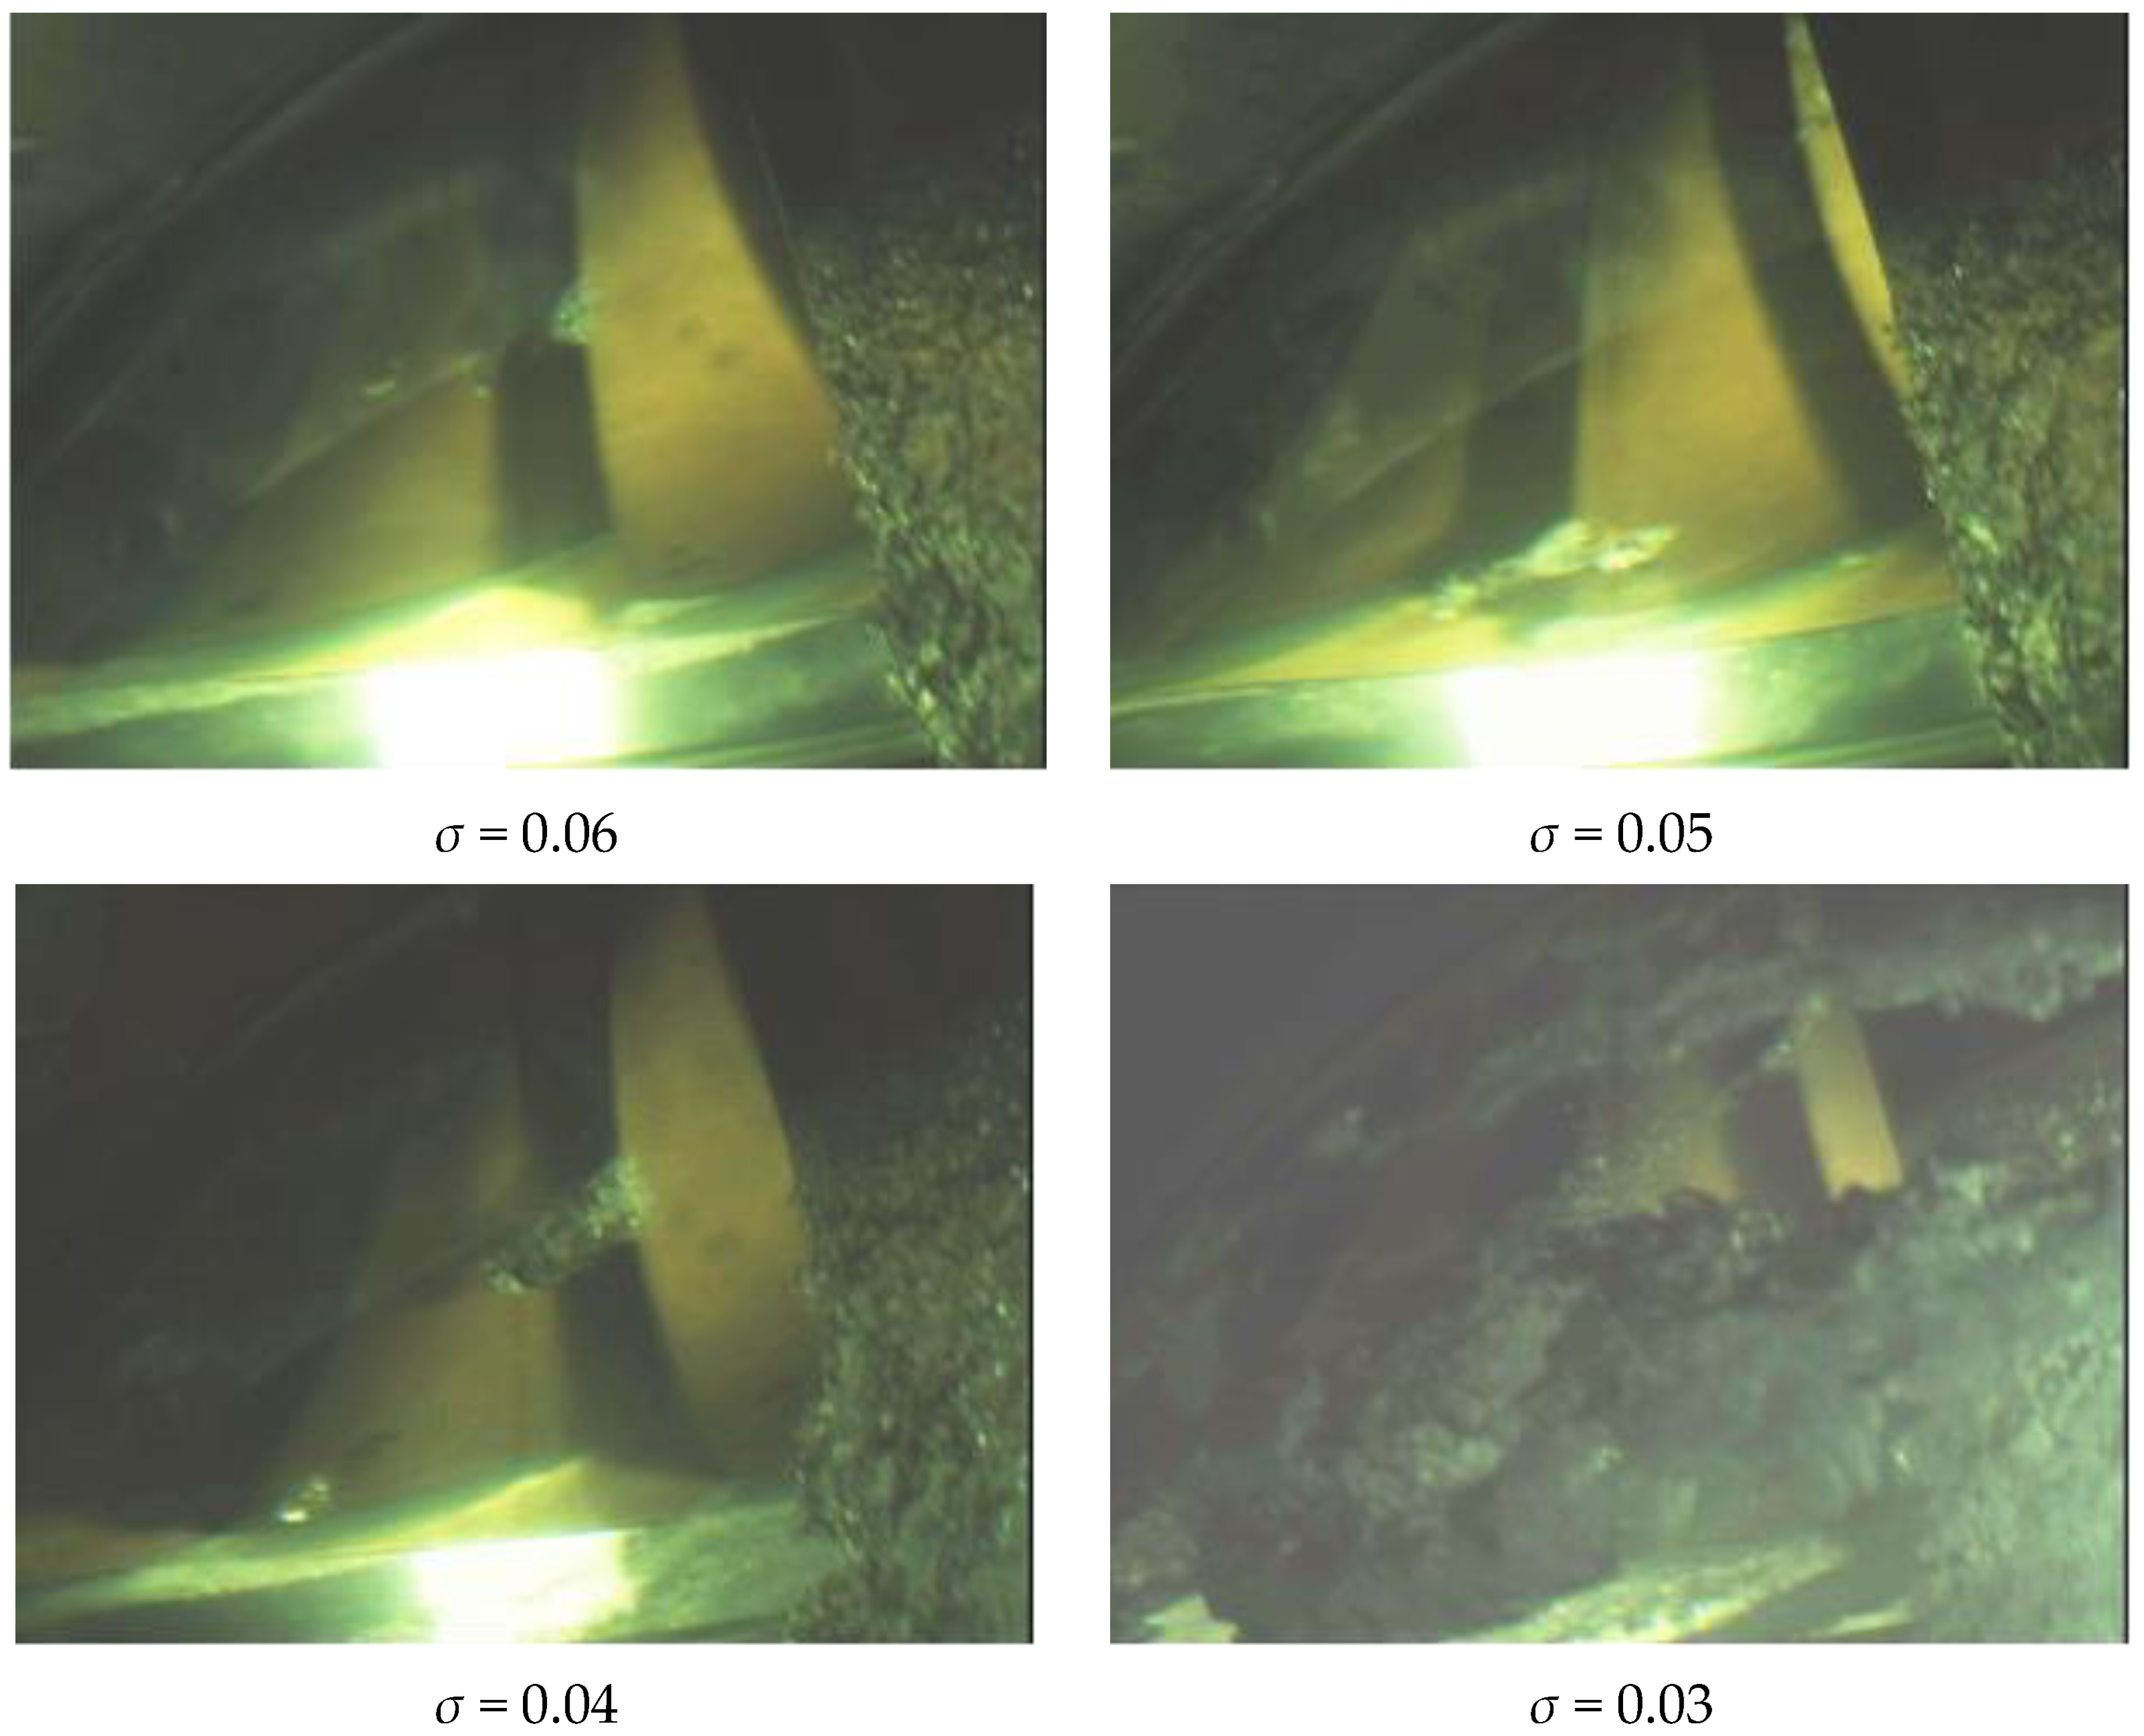
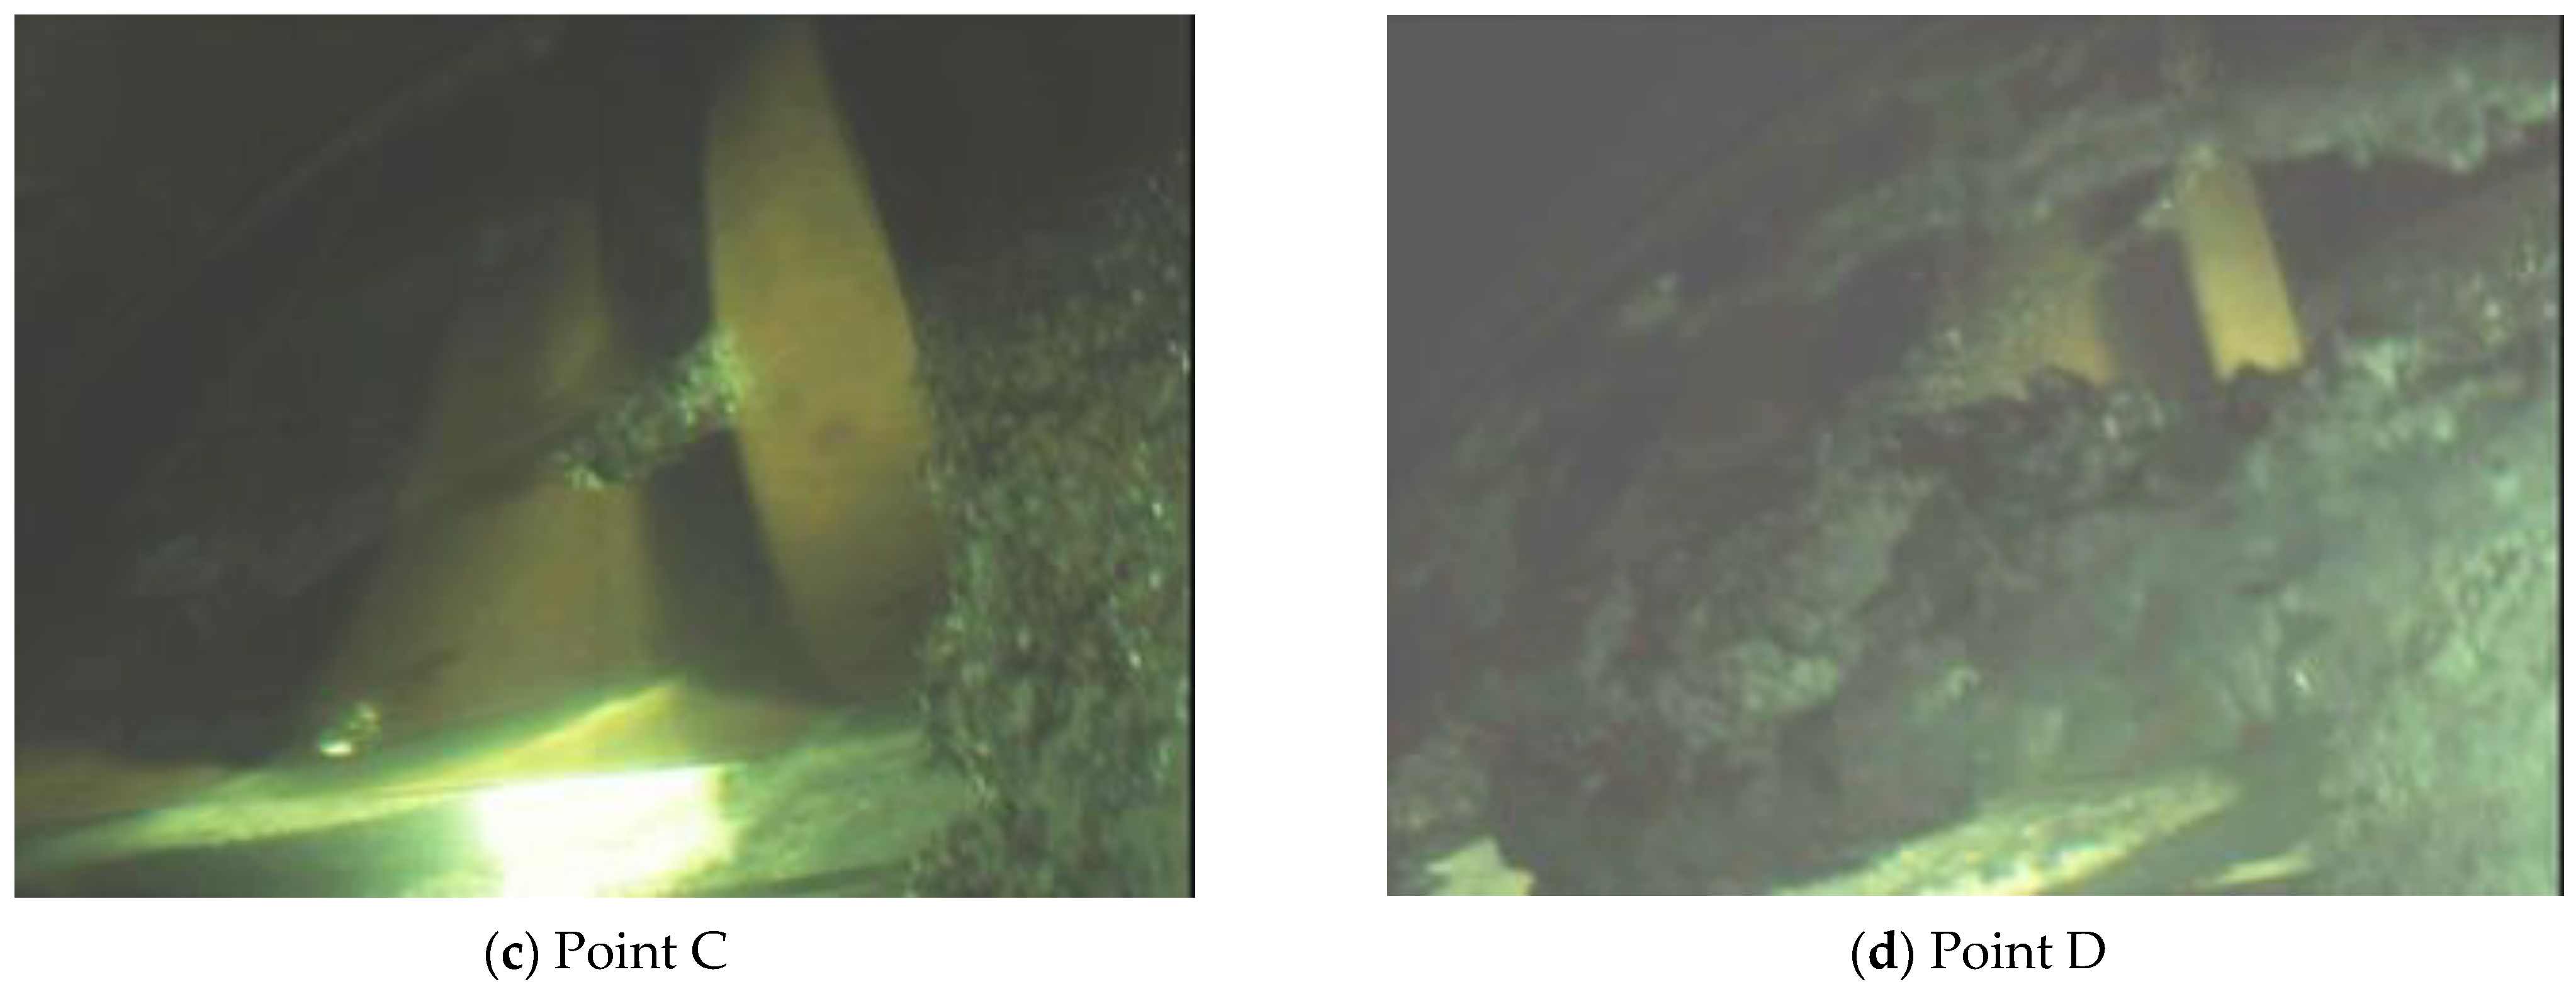
3.1. Cavitation Development and Its Influence on Hydraulic Stability

In this paper, the development of cavitation in the tested turbine model is studied, where the influence of cavitation on hydraulic stability is analyzed through the investigation of eventual changes in the machine’s external performance characteristics and pressure pulsation mode. Tests were conducted at a constant guide vane opening of 35.5° (rated condition).
The phenomenon in both Figure 5 and Figure 6 shows that: When the runner runs under the condition of high cavitation coefficient (σ > 0.13), there is no cavitation phenomenon. The cavitation number is defined as in Equation (1), where Pa, ρ, g, Qout, A2, Hm and Pv stand for draft tube outlet pressure, density, gravitational acceleration, outlet discharge, draft tube outlet cross-sectional area, water head, and vapor pressure, respectively. When the cavitation coefficient continues decreasing (sigma is about 0.12), the gap cavitation occurs at the gap between the runner and the lower ring. When the cavitation coefficient continues to decrease to about 0.1, the gap cavitation becomes more serious, and the cavitation phenomenon occurs at the runner blade outlet near the lower ring.
σ = P a + 0.5 ρ ( Q o u t A 2 ) 2 P v ρ g H m
Through observation and analysis, this cavitation phenomenon is due to the rapid change of blade outlet radius or soldering reasons. This local cavitation is the relatively stable zonal cavitation vortex all the time. When the cavitation coefficient decreases to 0.08, the obvious airfoil cavitation phenomenon begins to appear on the blade, and the cavitation vortices will disappear and collapse near the outlet of the blade soon after they are formed. When the cavitation coefficient decreases to 0.06, the typical airfoil cavitation phenomenon appears at different positions on different blades, and the cavitation vortices eventually present the following characteristics: Initially, the volume of cavitation vortices gradually increases. After reaching a certain level, it breaks into many small cavitation vortices. The latter eventually disappears after detaching from the blade surface and getting carried away in the flow direction.
When the cavitation coefficient decreases to 0.05, the above-described phenomenon reappears at different positions on more runner blades, where a large number of bubble vortices gradually develop, forming strip-shaped bubble vortices rotating in the opposite direction of runner rotation. These finally disappear and go to collapse in the runner channels. When the cavitation coefficient continues to decrease to 0.04, a large number of cavitation vortices emerges in the whole channel, and the formerly mentioned strip cavitation vortices gradually elongate and reach the flow zones near the lower ring of the runner displaying a downward trend, where, in addition, the noise caused by cavitation is intensified.
When the cavitation coefficient decreases to 0.03, the whole channel is covered by bubbles produced by various cavitation zones. When the cavitation coefficient continues to decrease to 0.04, a large number of cavitation vortices emerges in the whole channel, and the formerly mentioned strip cavitation vortices gradually elongate and reach the flow zones near the lower ring of the runner displaying a downward trend, where, in addition, the noise caused by cavitation is intensified. When the cavitation coefficient decreases to 0.03, the whole channel is covered by bubbles produced by various cavitation zones.
In addition, an unstable cavitation vortex is formed on the outside of the flow channel near the cone tube. With the turbine runner rotation, the strip-shaped cavitation vortex wraps the internal reverse cylindrical vortex in the flow channel and forms a surge near the cone tube wall, resulting in a sharp increase in the noise of the whole unit.
When the cavitation coefficient continues to decrease, cavitation bubbles cover the periphery of the whole cone wall, the surge phenomenon disappears, and the unit noise tends to weaken.
It can be seen from Figure 7a that the cavitation state at the junction of blade root and runner lower ring is strip-shaped, and the generated cavitation bubbles do not adhere to the blade surface but immediately leave the blade after generation. The same feature has been noticed in other recently conducted investigations [47,53,68]. From the comparison between the cavitation phenomenon in Figure 7a with cavitation at the blade outlet edge in Figure 7b, the cavitation bubbles generated at the outlet edge adhere to the blade surface after formation and flow with the blade profile obviously and continuously, while cavitation generated at the blade root is irregular and does not flow with the blade airfoil obviously. It can be concluded that the cavitation at the blade root is not airfoil cavitation; it is rather caused by the rapid change of the radius at the connection. This kind of cavitation can be avoided by optimizing the design of the blade connection zone. The local cavitation phenomenon can also be caused by the unsmooth (rough) blade surface due to welding problems, which can be improved by treating the blade joint and improving the smoothness of the joint.

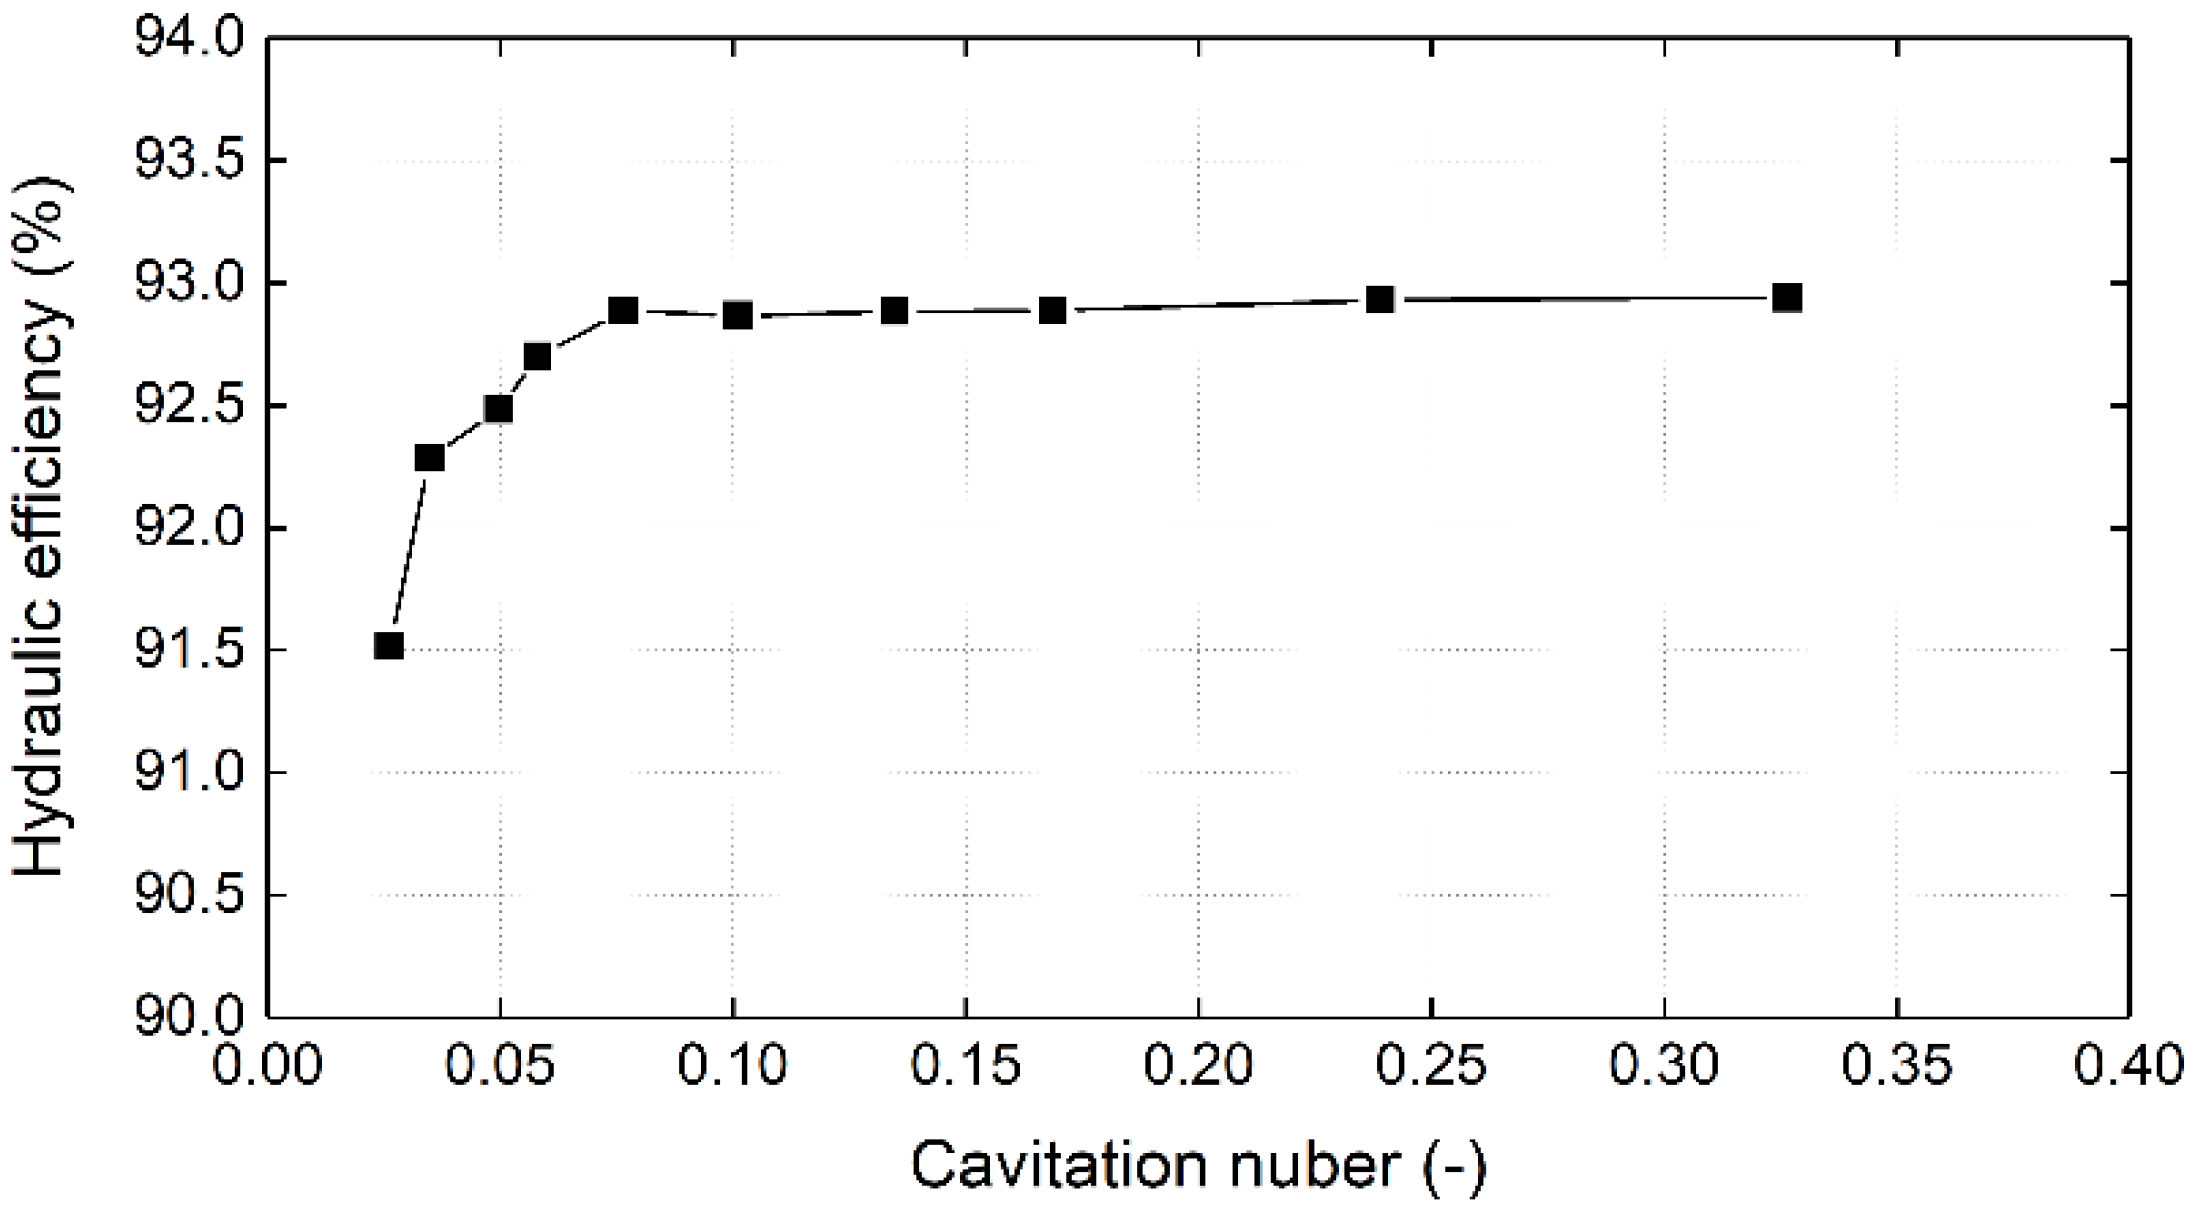
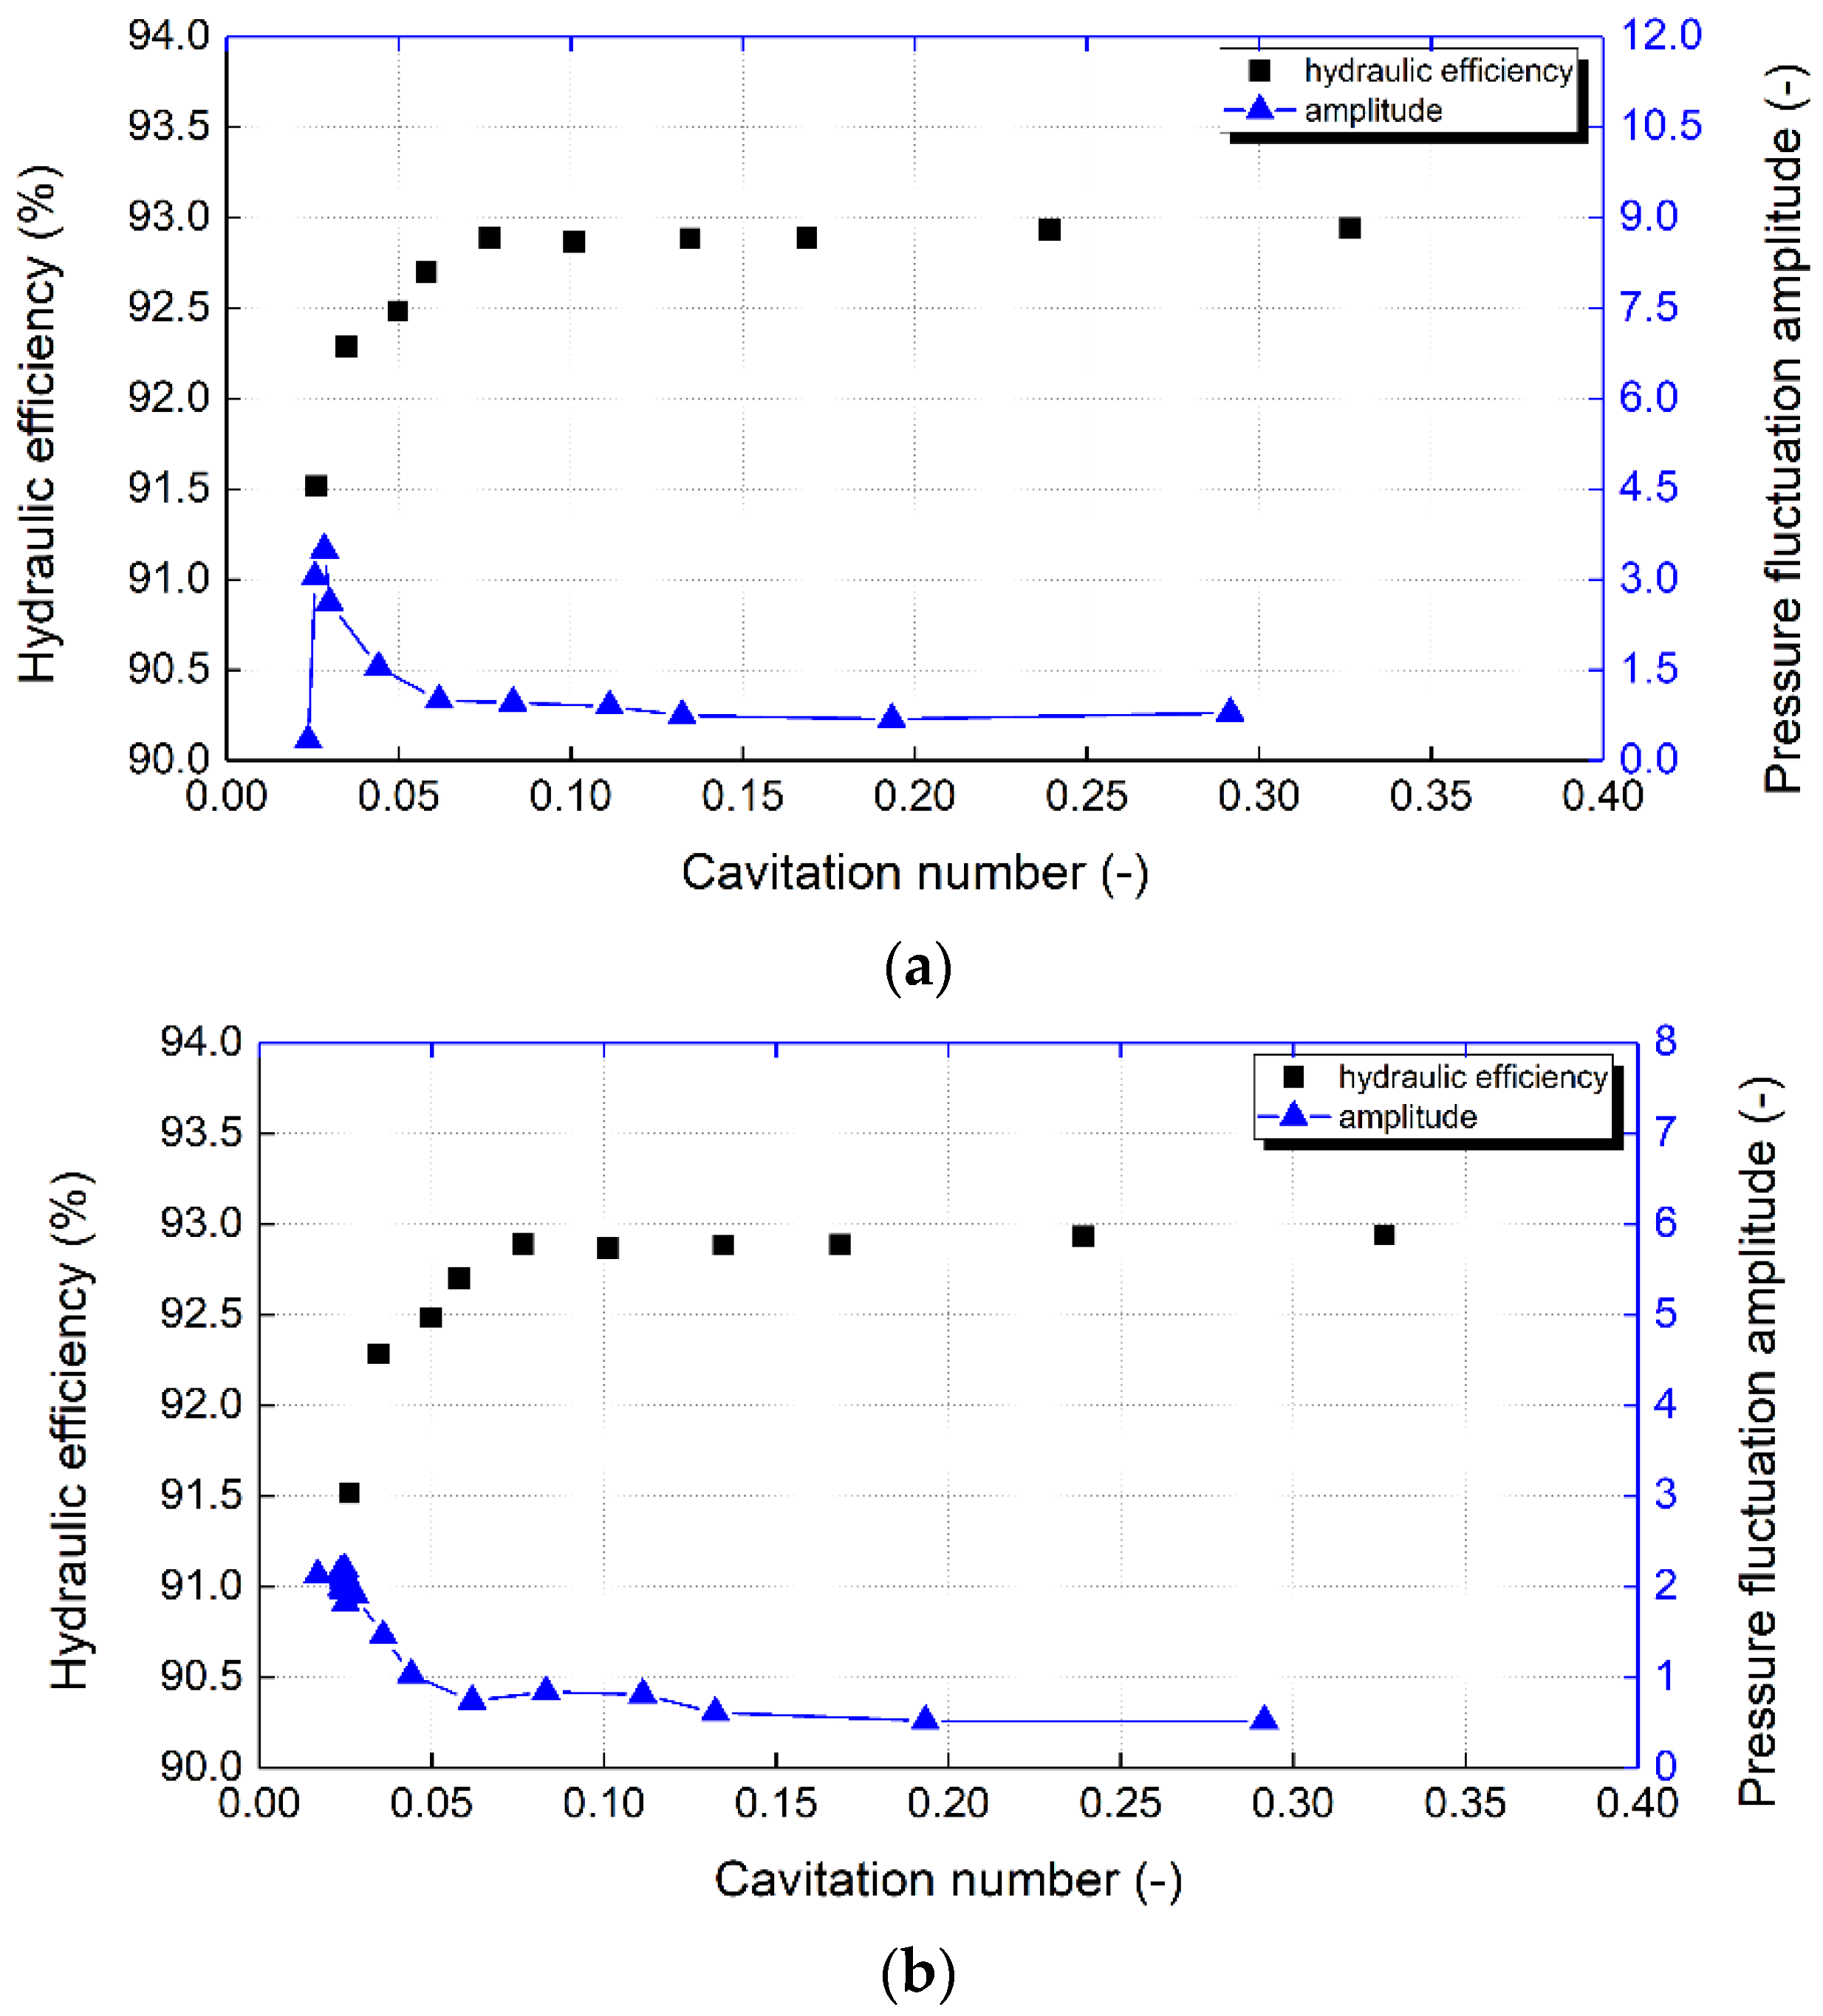
3.2. Influence of Cavitation Onset and Development on Turbine External Performance Characteristics

It can be seen from Figure 8 and Figure 9 that when the cavitation coefficient is between 0.08 and 0.32, the external performance characteristics of the turbine, such as the efficiency, flow rate, and water head, remain stable and do not change with the cavitation coefficient changes. Therefore, the clearance cavitation and local flow cavitation within the runner have no effect on the machine’s external performance characteristics.
When the cavitation coefficient is lower than 0.08, the efficiency of the model begins to decline. For cavitation coefficients in the range of 0.08–0.05, the machine flow rate presents an upward trend, gradually rising from 0.64 m3/s to 0.644 m3/s specifically as the cavitation coefficient decreased.
At this time, the hydraulic head presents a downward trend (30 m to 29.8 m), which indicates that the flow resistance gradually weakens with the decrease in cavitation coefficient. From the onset of airfoil cavitation (cavitation coefficient is 0.08) to its initial expansion phase (cavitation coefficient is 0.05), airfoil cavitation appeared in many blades, where, subsequently, bubbles also appeared in the same zones, which later began to leave the inter-blade flow zones being carried away with the fluid (Point A and Point C). With the cavitation coefficient’s further decrease to values below 0.04, a larger number of cavitation bubbles developed (Point B and Point C), triggering an increased resistance to the flow passage in the channel, which explains the downward and upward trends for the machine flow rate and hydraulic head, respectively, under these conditions.
In other words, during the test, with the decreasing cavitation coefficient, the changes in parameters such as efficiency, flow rate, head, and torque were observed. In the range of high cavitation coefficients, the flow rate, head, and efficiency did not remarkably change with the cavitation coefficient decrease. However, when cavitation incepted, the flow rate increased first then decreased, while the water head decreased and then increased. With the primary cavitation occurrence, the cavitation-induced bubbles adhered to the blade surface. With a further decrease of tailrace pressure, the resistance to the flow passage decreased, allowing the flow rate to correspondingly increase and the water head to consequently decrease. With further cavitation intensification, a large cavitation zone formed in the channel and blocked the fluid movement, resulting in the increased resistance to water flow, which in turn led to the decrease in the flow rate and subsequent water head increase.

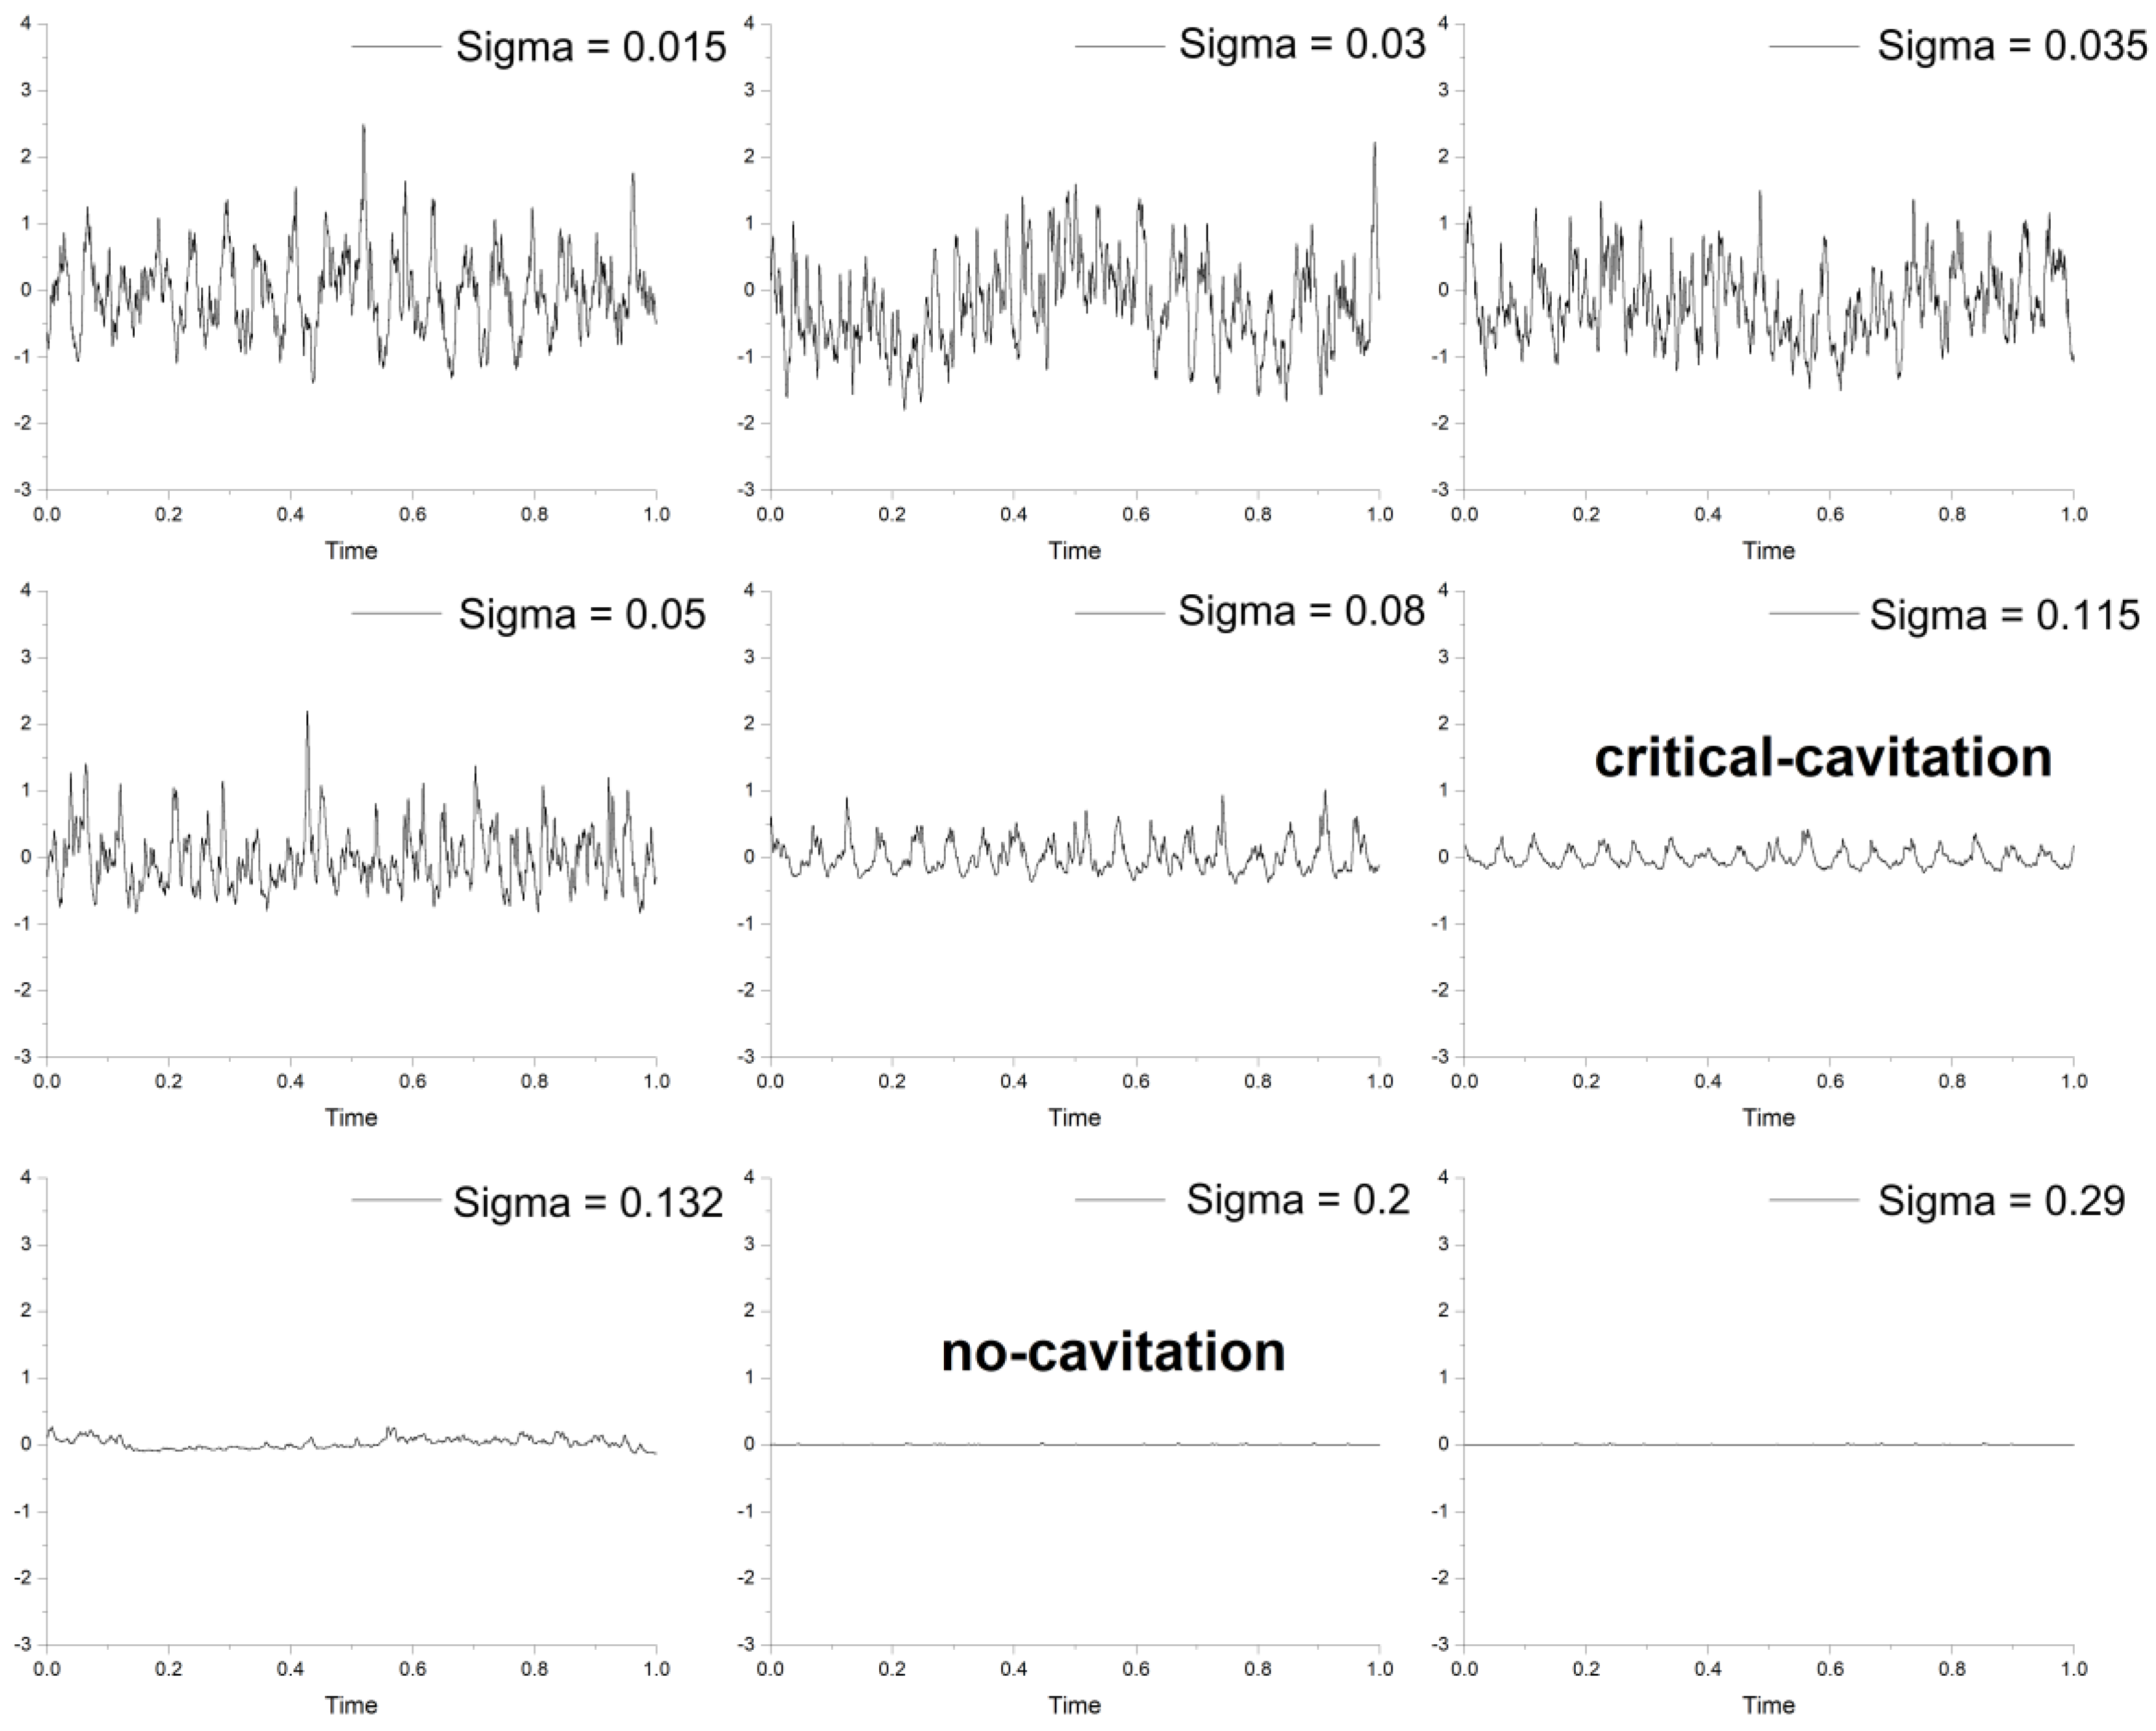
3.3. Influence of Turbine Cavitation on Its Pressure Pulsation Characteristics

Cavitation mainly occurs at the exit of the runner blade, and it becomes more and more serious with the decrease in the cavitation coefficient, which has a great influence on pressure pulsation characteristics of the draft tube’s cone and elbow flow zones. The pressure fluctuation test results (Figure 10) show that, when the cavitation coefficient is above 0.08, the amplitude of the pressure fluctuation basically does not change, which means that both the clearance cavitation and local cavitation of the runner have no effect on the draft tube pressure field characteristics. When the cavitation coefficient is between 0.06 and 0.08, the onset of airfoil cavitation takes place, and the pressure fluctuation increases slightly at both the cone and elbow tubes. When the cavitation coefficient decreases to between 0.03 and 0.06, the airfoil cavitation intensifies, giving rise to cavitation vortices which extend into the channel as the runner rotates. Under these conditions, cavitation volume gradually increases leading to eventual bubbles collapse. When the cavitation coefficient reaches 0.03, the whole channel is covered by cavitation bubbles just like in Figure 8. The amplitude of pressure fluctuations in the cone and elbow tubes keep raising. With a continuous decrease in the cavitation coefficient to values below 0.03, the periphery of the wall of the cone tube gets entirely covered by cavitation bubbles. At this point, the cavitation vortex boundaries tend to move downward from the cone toward the elbow zone, and the surge phenomenon disappears. Therefore, with the downward movement of the cavitation vortex boundary, pressure fluctuation levels within the draft tube’s cone zone sharply decreased, while that of elbow zone continuously rose.
This is further demonstrated in Figure 11. In this figure, the pressure fluctuation spectra at cone and elbow flow zones are shown. Under high cavitation coefficients conditions, the pressure pulsation spectrum at the elbow is dominated by a low frequency component (named f1 type) whose approximate value is 0.25 fn (fn: runner rotational frequency). In addition, there are other high-frequency components with smaller amplitudes (named f2 type) whose values are approximate harmonics of the blade passing frequency (BPF). Note that, considering a constant unitary speed n11 of 71.8 rpm, the blade passing frequency (BPF = 15 fn) is 246.45 Hz. With the decrease in the cavitation coefficient, the type f1 amplitude first fluctuates until the cavitation inception point. Afterward, its amplitude went through a continuous growth as the cavitation worsened.
As for type f2, pulsation amplitudes almost stabilized with the cavitation coefficient decrease until the cavitation inception point was reached. From this point onward, the pulsation amplitude slowly increased, and more high-frequency, low-amplitude components emerged and gradually occupied a wider range of frequencies as the cavitation worsened.
On the hand, the draft tube cone zone was dominated by multiple high-frequency components under non-cavitating conditions, while the formerly discussed f1 type frequency exhibited one of lowest pulsation amplitudes. With the decrease in cavitation coefficient, the amplitudes of high-frequency components almost stabilized while the occupied frequency range gradually narrowed until the cavitation inception point. From this point onward, type f1’s amplitude gradually increased to become the dominant frequency under σ = 0.039 conditions, before dropping to a considerably lower value under σ = 0.025 conditions.
As for the high-frequency components, with the gradual cavitation growth, their amplitudes globally increased and occupied a wider range of frequencies until σ = 0.039 operating conditions, before abruptly dropping to considerably lower values under σ = 0.025 conditions. It can therefore be seen that the evolution of pressure pulsation characteristics within the two flow zones in the draft tube (cone and elbow zones) reflects the same situation presented in Figure 10.

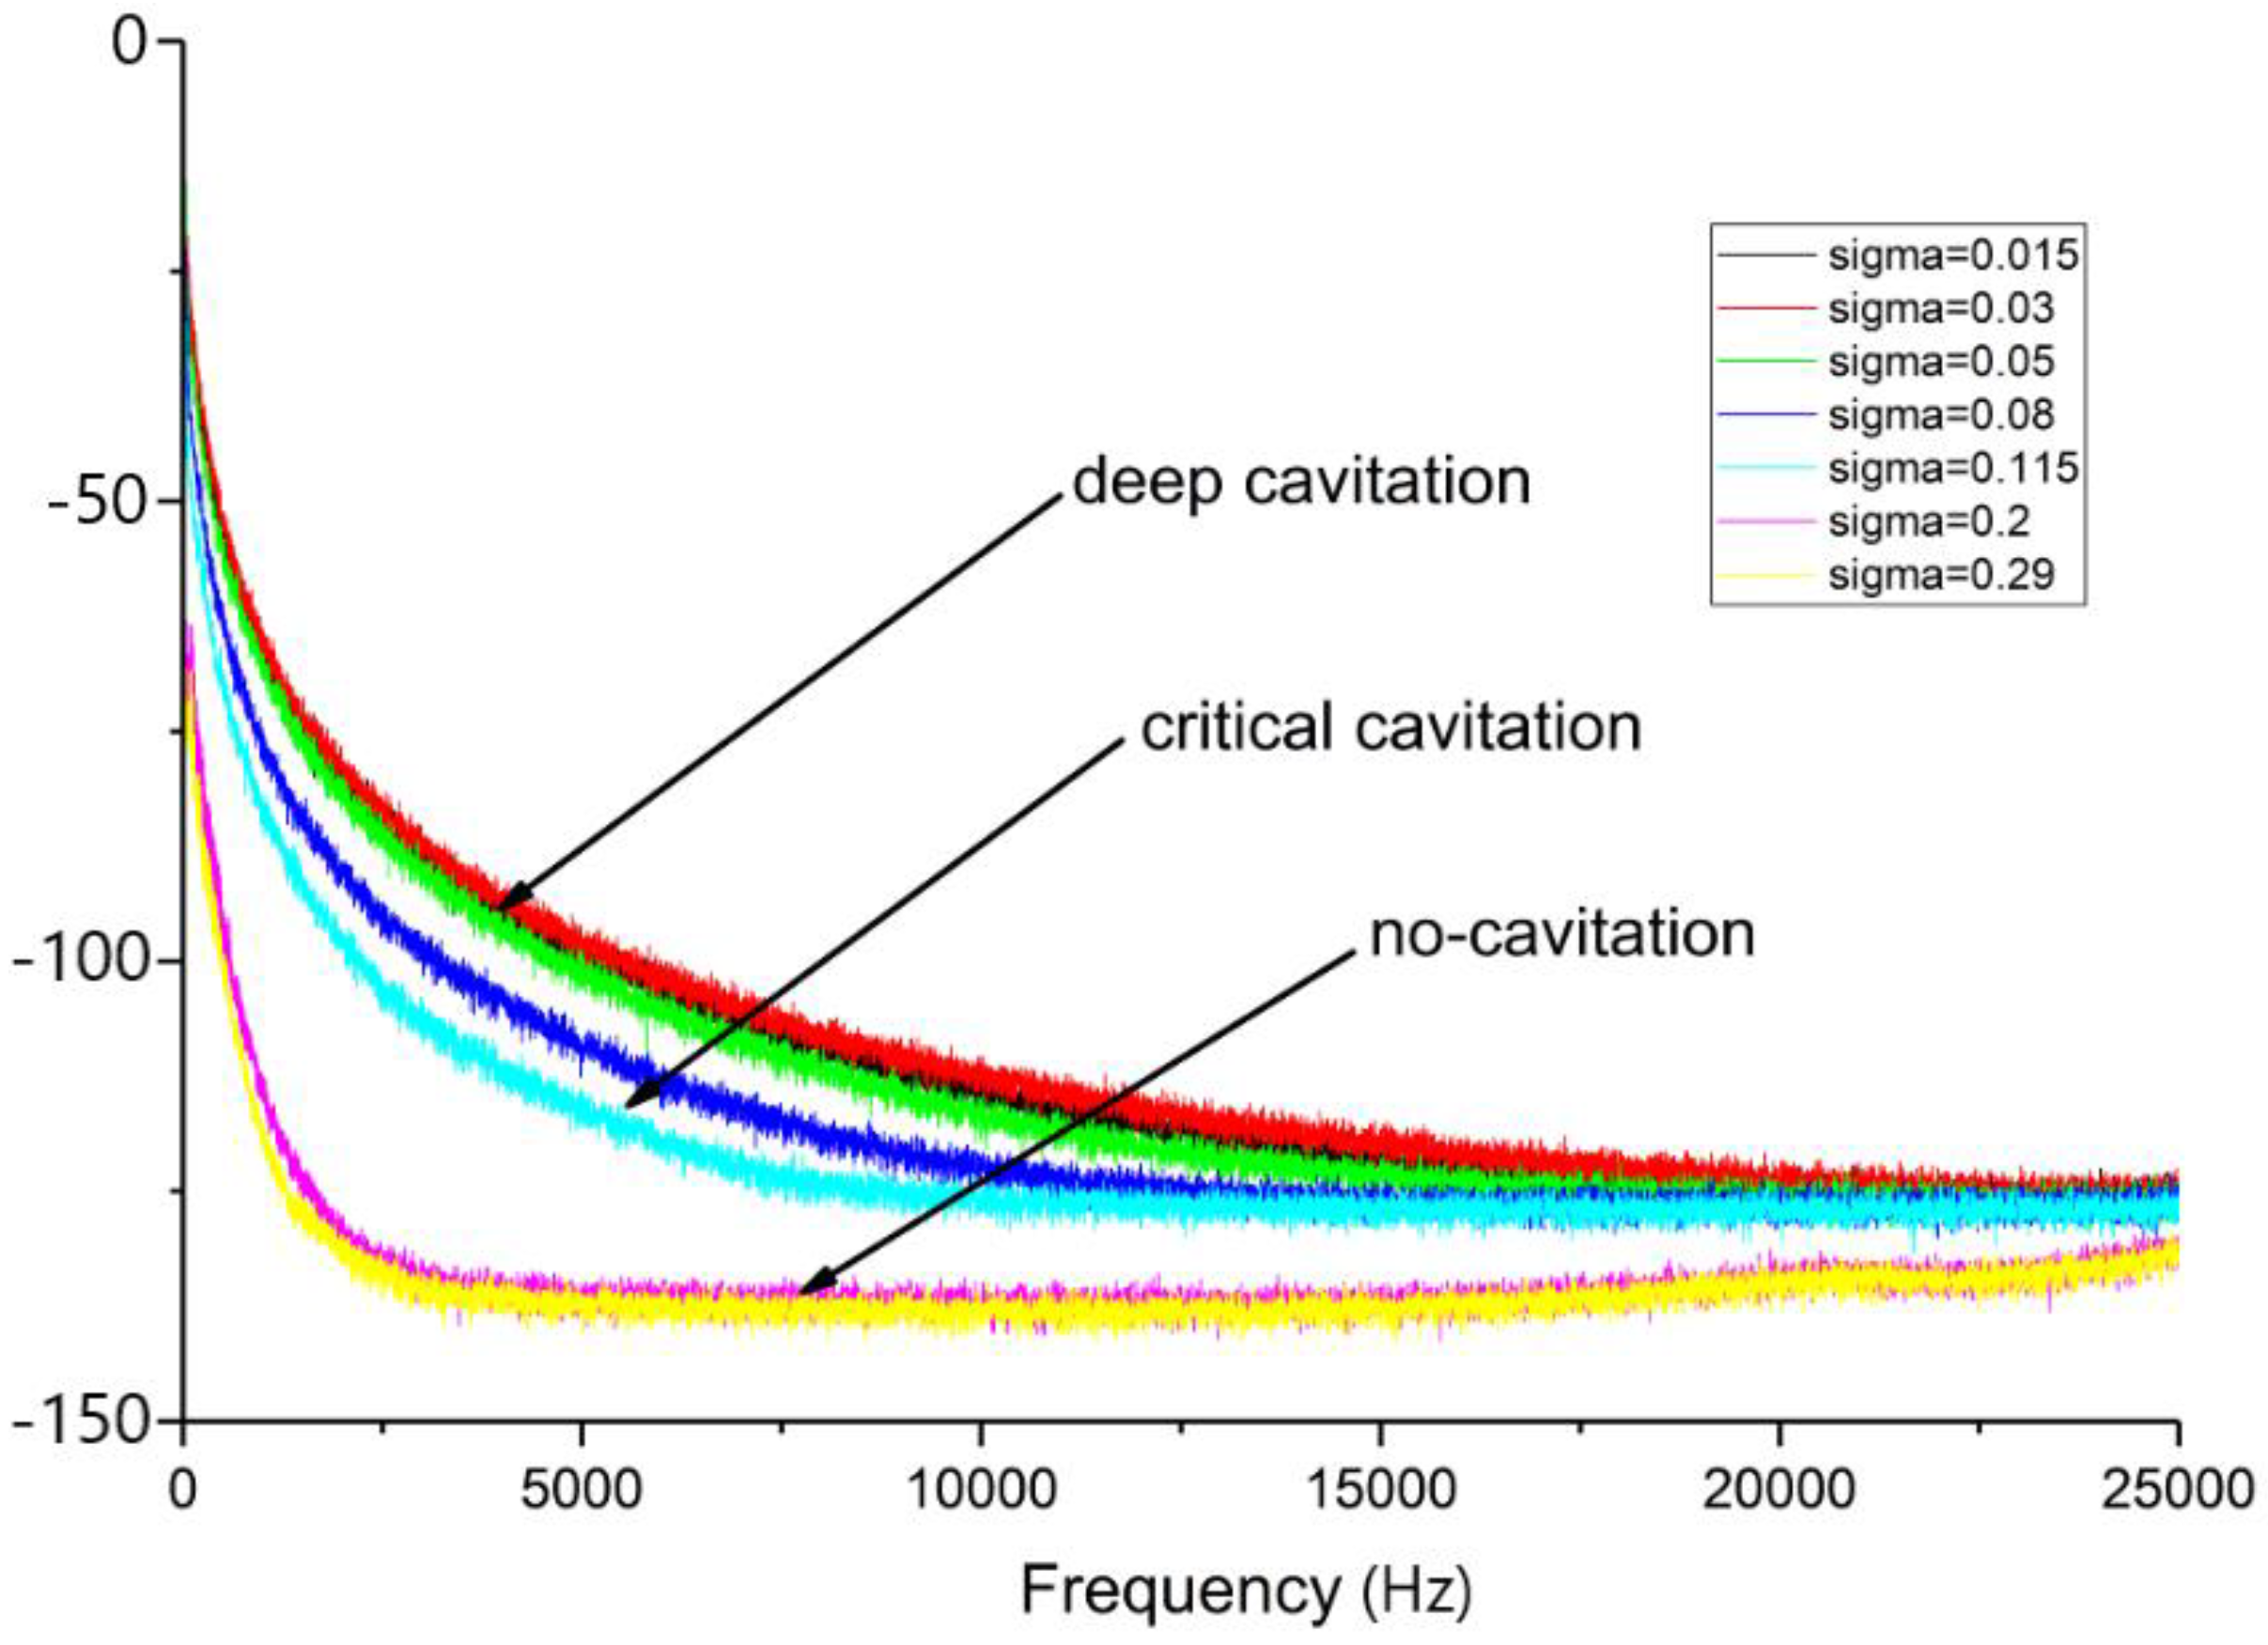
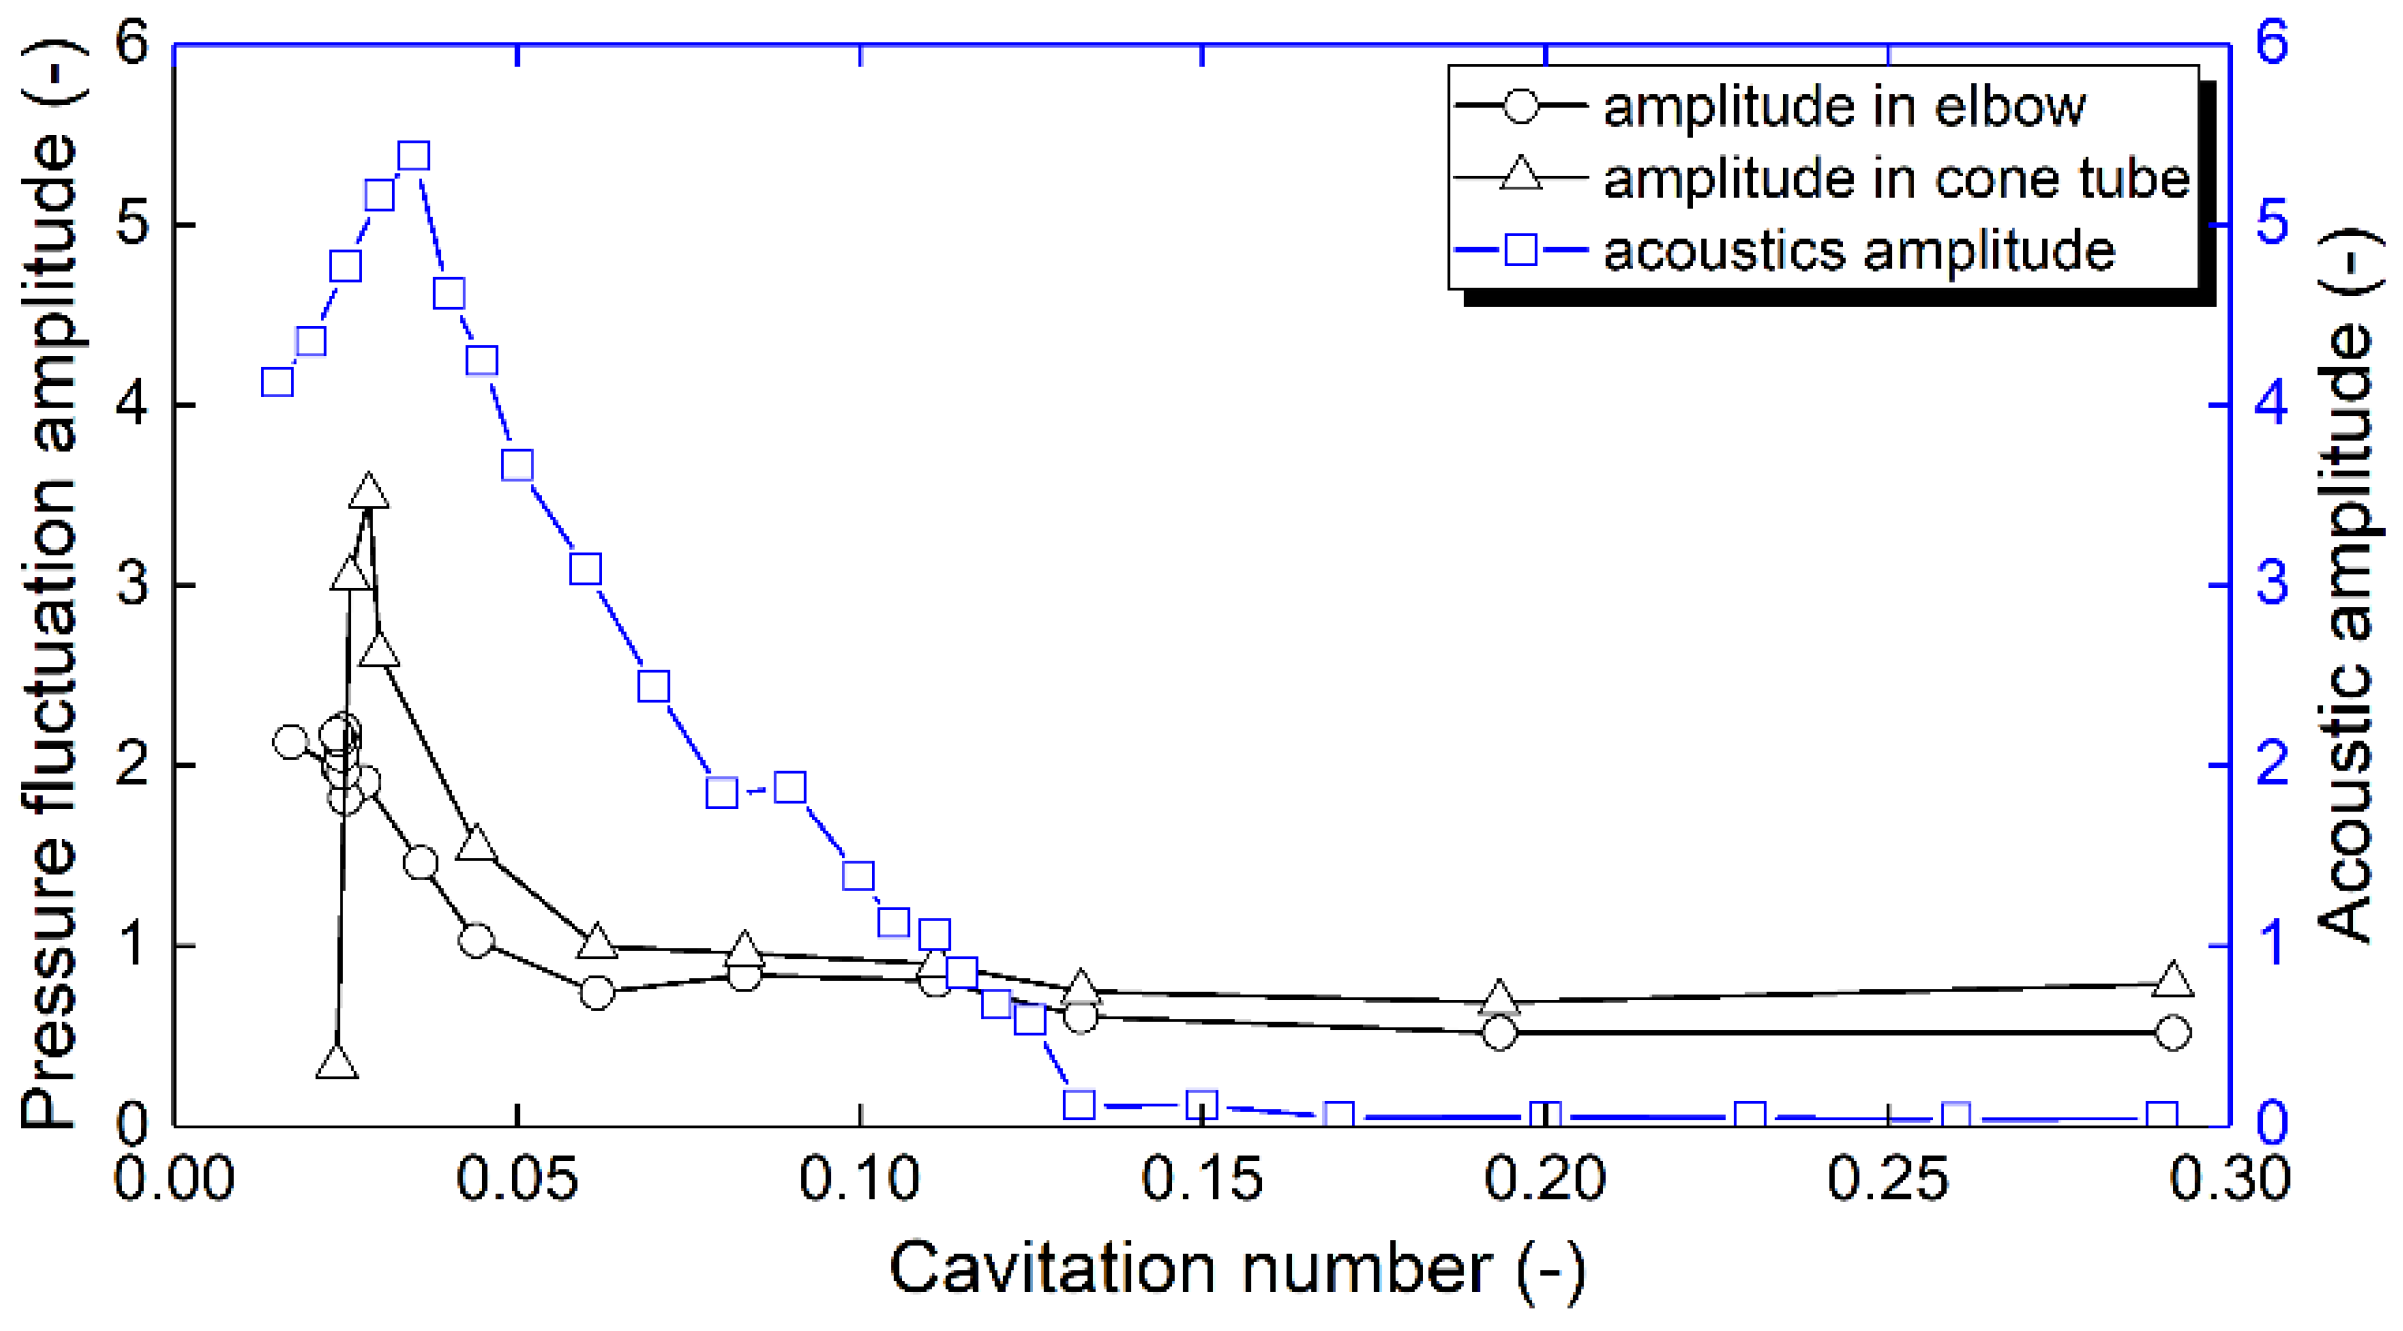
3.4. Relationship between Cavitation Development and Noise

Figure 12, Figure 13 and Figure 14 show the acoustic information at different cavitation coefficients. Figure 11 shows the peak-to-peak value, Figure 13 shows the time domain signal, while Figure 13 shows the frequency domain signal. According to the analysis results of pressure fluctuation and acoustic signal, it is found that the acoustic sensor has almost no response to the background noise and flow noise generated in the operation process of the tested machine before the blade cavitation occurs. The noise curve is basically flat, and there is no characteristic signal except the high-frequency electrical noise in the frequency analysis.
This is because, in the process of model turbine operation, when there is no cavitation, the background noise is basically less than 200 Hz signal, which mainly represents a low-frequency signal that can be filtered. In addition, during the operation of the model turbine, the background noise source is fixed, so the signal is stable. The noise is dominated by low-frequency energy, and the overall energy of the high-frequency component is weak.
When initial cavitation occurs, the high-frequency energy is increased, and the energy in the low-frequency region is also enhanced due to the generation of cavitation. The whole power spectral density curve is obviously separated from the trend of non-cavitation case. When cavitation continues to develop, the full band energy is enhanced, and the power spectral density curve is completely separated from the original non-cavitation curve group due to the large number of cavitation bubbles and eventual collapse on the runner blade surfaces. The energy of the runner blade is increased as large numbers of bubbles are generated and collapse, and the energy of the whole frequency band is enhanced. At this time, the power spectral density curve is completely separated from the original non-cavitation curve group, and the low-frequency energy enhancement effect is significant due to a large number of bubbles. However, with the continuous decrease of cavitation coefficient, the cavitation degree is gradually intensified, the number of bubbles attached to the blade surface is gradually increased, and the radius of the bubbles is also increased. After the bubbles collapse, a large number of pressure waves radiate into the water.
The cavitation noise signal from the acoustic sensor shows that the signal becomes violent, and the sound amplitude also increases. Through a comparative analysis between the results of acoustic signals and pressure fluctuation within the draft tube’s cone and elbow zones (see Figure 15), it can be seen that the acoustic phenomenon is just similar (consistent) with pressure fluctuations at the cone tube. When the gap cavitation occurs, the noise produced by cavitation bubbles begins to rise sharply.
When the cavitation coefficient decreases to a deep cavitation level, the whole flow channel is covered by cavitation bubbles, and unstable cavitation vortices are formed outside the runner flow channels near the draft tube cone zone. At this operating point, the noise of the whole unit reaches the maximum value. In a corresponding way, the pressure fluctuation of the cone tube also reaches the maximum value. However, when the developed cavitation vortex’s boundary moves downwards from the draft tube’s cone to the elbow zone as the cavitation coefficient decreases to values below 0.03, the noise and pressure fluctuations at the cone tube both decrease.

4. Conclusions

This paper studied the Francis turbine’s cavitation performance by analyzing its hydraulic performance, pressure fluctuation characteristics, and acoustic information using the experimental testing method. The high-speed visualization and acoustic capture techniques were used to get the required information about the machine flow dynamics and associated noise characteristics for a wide range of cavitation conditions. After a deep analysis of acquired test results, a number of concluding remarks have been drawn as follows:
(a)
Although the gap cavitation at the runner outlet and the local cavitation boosted by surface roughness of turbine components become more severe with the decrease of the cavitation coefficient, it has no obvious effect on the turbine performance parameters (efficiency, hydraulic head, and flow rate). When the airfoil cavitation develops, the occurred increase in flow rate and a correspondent hydraulic head decrease show that the cavitation phenomenon has a certain drag reduction effect on the flow. This drag reduction effect, however, disappears when the cavitation develops to deep cavitation state, which makes the flow rate decrease and hydraulic head increase.
(b)
The pressure pulsation at the cone and elbow tube is stable before the occurrence of airfoil cavitation, and it does not change with the change of the cavitation coefficient. When the airfoil cavitation just appears, both the turbine efficiency and the local pressure remarkably fluctuate, which again means that the airfoil cavitation affects the external characteristics of the turbine and its stability. When the cavitation gets serious, resulting in continuous cavitation zones formation and unsteady surge development near the wall of the draft tube’s cone, the pressure fluctuation within the same zone (draft tube’s cone zone) reaches the maximum. When the cavitation coefficient continues to decrease, a closed and stable annular cavitation zone is formed, which leads to the sharp drop of pressure fluctuation within the cone zone. On the other hand, the elbow tube presents a rising trend due to the gradual downward movement of the cavitation vortex boundary.
(c)
Through the analysis of acoustic data, it is shown that before cavitation occurs, the signal energy has no change and is in a low energy level. After cavitation occurs, cavitation bubbles develop and collapse more intensely. Therefore, the energy level of the whole signal changes step by step. The power spectral density shows that when cavitation has not occurred, the signal is dominated by low-frequency energy, and the overall energy of the high-frequency component is weak. When the incipient cavitation occurs, the high-frequency energy is increased, and the energy in the low-frequency region is also enhanced. The whole power spectral density curve is obviously away from the trend of non-cavitation. When cavitation continues to develop, there is a large number of cavitation bubbles on the runner blade, and the full band energy is enhanced. The trend of noise is basically the same as that of pressure fluctuation at the cone tube.

Author Contributions

Conceptualization, W.-T.S., W.Z. and Y.Z.; methodology, W.-T.S., W.Z., Y.Z., J.-Y.H. and M.B.; formal analysis, W.-T.S., W.Z., J.-Y.H., M.B. and X.-R.C.; writing—original draft, W.-T.S. and W.Z.; writing—review & editing, W.-T.S., W.Z., Y.Z. and M.B.; resources, W.-T.S. and W.Z.; supervision, W.-T.S. and W.Z.; funding acquisition, W.-T.S. All authors have read and agreed to the published version of the manuscript.

Funding

This research was funded by the National Natural Science Foundation of China (51976043), Liaoning Revitalization Talents Program (XLYC2007083), Liaoning Baiqianwan Talents Program (LNBQW2020Q0141), and Talent Scientific Research Fund of LSHU (2020XJJL-010).

Institutional Review Board Statement

Not applicable.

Informed Consent Statement

Not applicable.

Conflicts of Interest

The authors declare no conflict of interest.

References

  1. Liu, D.; Li, C.; Tan, X.; Lu, X.; Malik, O.P. Damping characteristics analysis of hydropower units under full operating conditions and control parameters: Accurate quantitative evaluation based on refined models. Appl. Energy 2021, 292, 116881. [Google Scholar] [CrossRef]
  2. Gøtske, E.K.; Victoria, M. Future operation of hydropower in Europe under high renewable penetration and climate change. iScience 2021, 24, 102999. [Google Scholar] [CrossRef] [PubMed]
  3. Selin Kocaman, A.; Abad, C.; Troy, T.J.; Tim Huh, W.; Modi, V. A stochastic model for a macroscale hybrid renewable energy system. Renew. Sustain. Energy Rev. 2016, 54, 688–703. [Google Scholar] [CrossRef] [Green Version]
  4. Binama, M.; Kan, K.; Chen, H.-X.; Zheng, Y.; Zhou, D.-Q.; Su, W.-T.; Ge, X.-F.; Ndayizigiye, J. A Numerical Investigation into the PAT Hydrodynamic Response to Impeller Rotational Speed Variation. Sustainability 2021, 13, 7998. [Google Scholar] [CrossRef]
  5. Briones-Hidrovo, A.; Uche, J.; Martínez-Gracia, A. Hydropower and environmental sustainability: A holistic assessment using multiple biophysical indicators. Ecol. Indic. 2021, 127, 107748. [Google Scholar] [CrossRef]
  6. Wang, H.; Ruan, J.; Wang, G.; Zhou, B.; Liu, Y.; Fu, X.; Peng, J. Deep Learning-Based Interval State Estimation of AC Smart Grids Against Sparse Cyber Attacks. IEEE Trans. Ind. Inform. 2018, 14, 4766–4778. [Google Scholar] [CrossRef]
  7. Victoria, M.; Zhu, K.; Brown, T.; Andresen, G.B.; Greiner, M. Early decarbonisation of the European energy system pays off. Nat. Commun. 2020, 11, 6223. [Google Scholar] [CrossRef]
  8. Rich, E. Hydropower Status Report; Henley, W., Ed.; International Hydropower Association (IHA) Central Office: London, UK, 2021. [Google Scholar]
  9. Trivedi, C.; Gandhi, B.; Michel, C.J. Effect of transients on Francis turbine runner life: A review. J. Hydraul. Res. 2013, 51, 121–132. [Google Scholar] [CrossRef]
  10. Jiao, P.H.; Chen, J.J.; Cai, X.; Wang, L.L.; Zhao, Y.L.; Zhang, X.H.; Chen, W.G. Joint active and reactive for allocation of renewable energy and energy storage under uncertain coupling. Appl. Energy 2021, 302, 117582. [Google Scholar] [CrossRef]
  11. Javaid, N.; Hafeez, G.; Iqbal, S.; Alrajeh, N.; Alabed, M.S.; Guizani, M. Energy Efficient Integration of Renewable Energy Sources in the Smart Grid for Demand Side Management. IEEE Access 2018, 6, 77077–77096. [Google Scholar] [CrossRef]
  12. Wang, H.; Lei, Z.; Zhang, X.; Zhou, B.; Peng, J. A review of deep learning for renewable energy forecasting. Energy Convers. Manag. 2019, 198, 111799. [Google Scholar] [CrossRef]
  13. Li, X.-B.; Binama, M.; Su, W.-T.; Cai, W.-H.; Muhirwa, A.; Li, B.; Li, F.-C. Runner blade number influencing RPT runner flow characteristics under off-design conditions. Renew. Energy 2020, 152, 876–891. [Google Scholar] [CrossRef]
  14. Binama, M.; Su, W.; Cai, W.; Li, F.; Wei, X.; Muhirwa, A.; Gong, R.; Wekesa, D.W. Investigation on reversible pump turbine flow structures and associated pressure field characteristics under different guide vane openings. Sci. China Technol. Sci. 2019, 62, 2052–2074. [Google Scholar] [CrossRef]
  15. Khozaei, M.H.; Favrel, A.; Masuko, T.; Yamaguchi, N.; Miyagawa, K. Generation of Twin Vortex Rope in the Draft-Tube Elbow of a Francis Turbine During Deep Part-Load Operation. J. Fluids Eng. 2021, 143, 101206. [Google Scholar] [CrossRef]
  16. Trivedi, C.; Iliev, I.; Dahlhaug, O.G. Numerical Study of a Francis Turbine over Wide Operating Range: Some Practical Aspects of Verification. Sustainability 2020, 12, 4301. [Google Scholar] [CrossRef]
  17. Sentyabov, A.V.; Minakov, A.V.; Platonov, D.V.; Dekterev, D.A.; Zakharov, A.V.; Semenov, G.A. Numerical Investigation of the Influence of Special Structures On Suppression of Pressure Pulsations in The Draft Tube of a High-Head Hydraulic Turbine. J. Eng. Phys. Thermophys. 2019, 92, 1489–1500. [Google Scholar] [CrossRef]
  18. Brezovec, M.; Kuzle, I.; Krpan, M.; Holjevac, N. Analysis and treatment of power oscillations in hydropower plant Dubrava. IET Renew. Power Gener. 2020, 14, 80–89. [Google Scholar] [CrossRef]
  19. Gomes, P.J., Jr.; Favrel, A.; Landry, C.; Nicolet, C.; Avellan, F. Measurements of Cavitation Compliance in the Draft Tube Cone of a Reduced Scale Francis Turbine Operating at Part Load. In Proceedings of the 10th International Symposium on Cavitation (CAV2018), Baltimore, MD, USA, 14–16 May 2018; Katz, J., Ed.; ASME Press: Baltimore, MD, USA, 2018; p. 6. [Google Scholar]
  20. Binama, M.; Kan, K.; Chen, H.-X.; Zheng, Y.; Zhou, D.; Su, W.-T.; Muhirwa, A.; Ntayomba, J. Flow instability transferability characteristics within a reversible pump turbine (RPT) under large guide vane opening (GVO). Renew. Energy 2021, 179, 285–307. [Google Scholar] [CrossRef]
  21. Favrel, A.; Müller, A.; Landry, C.; Yamamoto, K.; Avellan, F. Study of the vortex-induced pressure excitation source in a Francis turbine draft tube by particle image velocimetry. Exp. Fluids 2015, 56, 215. [Google Scholar] [CrossRef]
  22. Binama, M.; Su, W.-T.; Li, X.-B.; Li, F.-C.; Wei, X.-Z.; An, S. Investigation on pump as turbine (PAT) technical aspects for micro hydropower schemes: A state-of-the-art review. Renew. Sustain. Energy Rev. 2017, 79, 148–179. [Google Scholar] [CrossRef]
  23. Favrel, A.; Landry, C.; Müller, A.; Yamamoto, K.; Avellan, F. Hydro-acoustic resonance behavior in presence of a precessing vortex rope: Observation of a lock-in phenomenon at part load Francis turbine operation. In IOP Conference Series: Earth and Environmental Science; IOP Publishing: Bristol, UK, 2014; Volume 22, p. 032035. [Google Scholar]
  24. Pereira, J.G., Jr.; Favrel, A.; Andolfatto, L.; Landry, C.; Alligné, S.; Nicolet, C.; Avellan, F. Procedure for predicting part load resonance in Francis turbine hydropower units based on swirl number and local cavitation coefficient similitude. Mech. Syst. Signal Processing 2019, 132, 84–101. [Google Scholar] [CrossRef]
  25. Alligne´, S.B.; Nicolet, C.; Avellan, F.O. Identification of Francis Turbine Helical Vortex Rope Excitation by CFD and Resonance Simulation with the Hydraulic System. In Proceedings of the ASME-JSME-KSME 2011 Joint Fluids Engineering Conference, Hamamatsu, Japan, 24–29 July 2011; ASME Press: Hamamatsu, Japan, 2011; pp. 481–493. [Google Scholar]
  26. Harvey, J.K. Some observations of the vortex breakdown phenomenon. J. Fluid Mech. 1962, 14, 585–592. [Google Scholar] [CrossRef]
  27. Lucca-Negro, O.; O’Doherty, T. Vortex breakdown: A review. Prog. Energy Combust. Sci. 2001, 27, 431–481. [Google Scholar] [CrossRef]
  28. Escudier, M. Vortex breakdown: Observations and explanations. Prog. Aerosp. Sci. 1988, 25, 189–229. [Google Scholar] [CrossRef]
  29. Dörfler, P.; Sick, M.; Coutu, A. Low-Frequency Phenomena in Swirling Flow. In Flow-Induced Pulsation and Vibration in Hydroelectric Machinery: Engineer’s Guidebook for Planning, Design and Troubleshooting; Dörfler, P., Sick, M., Coutu, A., Eds.; Springer: London, UK, 2013; pp. 33–67. [Google Scholar]
  30. Zhang, R.-K.; Mao, F.; Wu, J.-Z.; Chen, S.-Y.; Wu, Y.-L.; Liu, S.-H. Characteristics and Control of the Draft-Tube Flow in Part-Load Francis Turbine. J. Fluids Eng. 2009, 131, 021101. [Google Scholar] [CrossRef]
  31. Franc, J.-P.D.; Avellan, F.; Belahadji, B.; Billard, J.-Y.; Briançon-Marjollet, L.; Fréchou, D.; Fruman, D.; Karimi, A.; Kueny, J.-L.; Michel, J.-M. La Cavitation: Mécanismes Physiques et Aspects Industriels; Presses Universitaires de Grenoble PUG: Grenoble, France, 1995. [Google Scholar]
  32. Favrel, A.; Müller, A.; Landry, C.; Gomes, J.; Yamamoto, K.; Avellan, F. Dynamics of the precessing vortex rope and its interaction with the system at Francis turbines part load operating conditions. In Journal of Physics: Conference Series; IOP Publishing: Bristol, UK, 2017; Volume 813, p. 012023. [Google Scholar]
  33. Yonezawa, K.; Konishi, D.; Miyagawa, K.; Avellan, F.; Doerfler, P.; Tsujimoto, Y. Cavitation surge in a small model test facility simulating a hydraulic power plant. Int. J. Fluid Mach. Syst. 2012, 5, 152–160. [Google Scholar] [CrossRef] [Green Version]
  34. Nishi, M.; Liu, S. An Outlook on the Draft-Tube-Surge Study. Int. J. Fluid Mach. Syst. 2013, 6, 33–48. [Google Scholar] [CrossRef] [Green Version]
  35. Müller, A.; Yamamoto, K.; Alligné, S.; Yonezawa, K.; Tsujimoto, Y.; Avellan, F. Measurement of the Self-Oscillating Vortex Rope Dynamics for Hydroacoustic Stability Analysis. J. Fluids Eng. 2015, 138, 021206. [Google Scholar] [CrossRef]
  36. Susan-Resiga, R.; Dan Ciocan, G.; Anton, I.; Avellan, F. Analysis of the Swirling Flow Downstream a Francis Turbine Runner. J. Fluids Eng. 2005, 128, 177–189. [Google Scholar] [CrossRef]
  37. Mustafa Kamal, M.; Abbas, A.; Kumar, R.; Prasad, V. The Cause and Control of Failure of Hydraulic Turbine Due to Cavitation: A Review. In Advances in Clean Energy Technologies; Baredar, P.V., Tangellapalli, S., Solanki, C.S., Eds.; Springer: Singapore, 2021; pp. 1099–1112. [Google Scholar]
  38. Tiwari, G.; Kumar, J.; Prasad, V.; Patel, V.K. Derivation of cavitation characteristics of a 3MW prototype Francis turbine through numerical hydrodynamic analysis. Mater. Today Proc. 2020, 26, 1439–1448. [Google Scholar] [CrossRef]
  39. Mohanta, R.K.; Chelliah, T.R.; Allamsetty, S.; Akula, A.; Ghosh, R. Sources of vibration and their treatment in hydro power stations—A review. Eng. Sci. Technol. Int. J. 2017, 20, 637–648. [Google Scholar] [CrossRef] [Green Version]
  40. Luo, Y.; Wang, Z.; Zhang, J.; Zeng, J.; Lin, J.; Wang, G. Vibration and fatigue caused by pressure pulsations originating in the vaneless space for a Kaplan turbine with high head. Eng. Comput. 2013, 30, 448–463. [Google Scholar] [CrossRef]
  41. Candel, I.; Bunea, F.; Dunca, G.; Bucur, D.M.; Ioana, C.; Reeb, B.; Ciocan, G.D. Detection of cavitation vortex in hydraulic turbines using acoustic techniques. In IOP Conference Series: Earth and Environmental Science; IOP Publishing: Bristol, UK, 2014; Volume 22, p. 052007. [Google Scholar]
  42. Chatenet, Q.; Tahan, A.S.; Fouladirad, M.; Gagnon, M.; Remy, E. Maintenance Strategies Comparison for Francis Turbine Runner Subjected to Cavitation. Sustainability 2021, 13, 10838. [Google Scholar] [CrossRef]
  43. Avellan, F. Introduction to Cavitation in Hydraulic Machinery. In Proceedings of the 6th International Conference on Hydraulic Machinery and Hydrodynamics, Timișoara, Romania, 21–22 October 2004; Politehnica University of Timișoara: Timisoara, Romania, 2004; pp. 11–22. [Google Scholar]
  44. Escaler, X.; Egusquiza, E.; Farhat, M.; Avellan, F.; Coussirat, M. Detection of cavitation in hydraulic turbines. Mech. Syst. Signal Process. 2006, 20, 983–1007. [Google Scholar] [CrossRef] [Green Version]
  45. Guo, Q.; Zhou, L.; Wang, Z.; Liu, M.; Cheng, H. Numerical simulation for the tip leakage vortex cavitation. Ocean Eng. 2018, 151, 71–81. [Google Scholar] [CrossRef]
  46. Celebioglu, K.; Altintas, B.; Aradag, S.; Tascioglu, Y. Numerical research of cavitation on Francis turbine runners. Int. J. Hydrog. Energy 2017, 42, 17771–17781. [Google Scholar] [CrossRef]
  47. Sun, L.; Guo, P.; Luo, X. Numerical investigation on inter-blade cavitation vortex in a Franics turbine. Renew. Energy 2020, 158, 64–74. [Google Scholar] [CrossRef]
  48. Yamamoto, K.; Müller, A.; Favrel, A.; Avellan, F. Experimental evidence of inter-blade cavitation vortex development in Francis turbines at deep part load condition. Exp. Fluids 2017, 58, 142. [Google Scholar] [CrossRef]
  49. Yamamoto, K.; Müller, A.; Favrel, A.; Avellan, F. Physical Mechanism of Interblade Vortex Development at Deep Part Load Operation of a Francis Turbine. J. Fluids Eng. 2019, 141, 111113. [Google Scholar] [CrossRef]
  50. Liu, S.; Zhang, L.; Nishi, M.; Wu, Y. Cavitating Turbulent Flow Simulation in a Francis Turbine Based on Mixture Model. J. Fluids Eng. 2009, 131, 051302. [Google Scholar] [CrossRef]
  51. Iliescu, M.S.; Ciocan, G.D.; Avellan, F. Analysis of the Cavitating Draft Tube Vortex in a Francis Turbine Using Particle Image Velocimetry Measurements in Two-Phase Flow. J. Fluids Eng. 2008, 130, 021105. [Google Scholar] [CrossRef]
  52. Decaix, J.; Müller, A.; Favrel, A.; Avellan, F.; Münch, C. URANS Models for the Simulation of Full Load Pressure Surge in Francis Turbines Validated by Particle Image Velocimetry. J. Fluids Eng. 2017, 139, 121103. [Google Scholar] [CrossRef]
  53. Krzemianowski, Z.; Steller, J. High specific speed Francis turbine for small hydro purposes-Design methodology based on solving the inverse problem in fluid mechanics and the cavitation test experience. Renew. Energy 2021, 169, 1210–1228. [Google Scholar] [CrossRef]
  54. Hoč Evar, M.; Širok, B.; Blagojevič, B.; Grabec, I. Experimental modeling of a cavitation vortex in the draft tube of a Francis turbine using artificial neural networks. J. Hydraul. Res. 2007, 45, 538–546. [Google Scholar] [CrossRef]
  55. Cheng, H.; Zhou, L.; Liang, Q.; Guan, Z.; Liu, D.; Wang, Z.; Kang, W. A method of evaluating the vortex rope strength in draft tube of Francis turbine. Renew. Energy 2020, 152, 770–780. [Google Scholar] [CrossRef]
  56. Yu, A.; Zou, Z.; Zhou, D.; Zheng, Y.; Luo, X. Investigation of the correlation mechanism between cavitation rope behavior and pressure fluctuations in a hydraulic turbine. Renew. Energy 2020, 147, 1199–1208. [Google Scholar] [CrossRef]
  57. Escaler, X.; Ekanger, J.V.; Francke, H.H.; Kjeldsen, M.; Nielsen, T.K. Detection of Draft Tube Surge and Erosive Blade Cavitation in a Full-Scale Francis Turbine. J. Fluids Eng. 2014, 137, 011103. [Google Scholar] [CrossRef] [Green Version]
  58. Rus, T.; Dular, M.; Širok, B.; Hočevar, M.; Kern, I. An Investigation of the Relationship Between Acoustic Emission, Vibration, Noise, and Cavitation Structures on a Kaplan Turbine. J. Fluids Eng. 2007, 129, 1112–1122. [Google Scholar] [CrossRef]
  59. Bajic, B. Multidimensional Diagnostics of Turbine Cavitation. J. Fluids Eng. 2002, 124, 943–950. [Google Scholar] [CrossRef]
  60. Battarra, M.; Mucchi, E. Incipient cavitation detection in external gear pumps by means of vibro-acoustic measurements. Measurement 2018, 129, 51–61. [Google Scholar] [CrossRef]
  61. Poddar, S.; Tandon, N. Detection of journal bearing vapour cavitation using vibration and acoustic emission techniques with the aid of oil film photography. Tribol. Int. 2016, 103, 95–101. [Google Scholar] [CrossRef]
  62. Požar, T.; Pirc, Ž.; Susič, E.; Petkovšek, R. Simplified detection of cavitation threshold in control valves. Appl. Acoust. 2020, 165, 107320. [Google Scholar] [CrossRef] [Green Version]
  63. Bajic´, B.; Keller, A. Spectrum Normalization Method in Vibro-Acoustical Diagnostic Measurements of Hydroturbine Cavitation. J. Fluids Eng. 1996, 118, 756–761. [Google Scholar] [CrossRef]
  64. Gruber, P.; Farhat, M.; Odermatt, P.; Etterlin, M.; Lerch, T.; Frei, M. The detection of cavitation in hydraulic machines by use of ultrasonic signal analysis. Int. J. Fluid Mach. Syst. 2015, 8, 264–273. [Google Scholar] [CrossRef] [Green Version]
  65. Dupont, P.; Caron, J.F.; Avellan, F.; Bourdon, P.; Lavigne, P.; Farhat, M.; Simoneau, R.; Dorey, J.M.; Archer, A.; Laperrousaz, E.; et al. Cavitation Erosion Prediction on Francis Turbines. Part 2 Model Tests and Flow Analysis. In Hydraulic Machinery and Cavitation; Cabrera, E., Espert, V., Martínez, F., Eds.; Springer: Dordrecht, The Netherlands, 1996; pp. 574–583. [Google Scholar]
  66. Bourdon, P.; Farhat, M.; Simoneau, R.; Pereira, F.; Dupont, P.; Avellan, F.; Dorey, J.M. Cavitation Erosion Prediction on Francis Turbines—Part 1 Measurements on the Prototype. In Hydraulic Machinery and Cavitation; Cabrera, E., Espert, V., Martínez, F., Eds.; Springer: Dordrecht, The Netherlands, 1996; pp. 534–543. [Google Scholar]
  67. Liu, Z.L.; Zhao, Y.; Guo, Q.B. An auto-test method based on acoustic theory of judging inception cavitation of runner blade of model Francis-turbine. In IOP Conference Series: Earth and Environmental Science; IOP Publishing: Bristol, UK, 2018; Volume 163, p. 012061. [Google Scholar]
  68. Trivedi, C.; Iliev, I.; Dahlhaug, O.G.; Markov, Z.; Engstrom, F.; Lysaker, H. Investigation of a Francis turbine during speed variation: Inception of cavitation. Renew. Energy 2020, 166, 147–162. [Google Scholar] [CrossRef]
Figure 1. Hydraulic Test Platform No. 5 of Harbin Electric Corporation. (a) Testing section. (b) Tested turbine runner.
Sustainability 14 03263 g001
Figure 2. Schematic diagram of the hydraulic testing platform.
Sustainability 14 03263 g002
Figure 3. Noise capture and acquisition system.
Sustainability 14 03263 g003
Figure 4. Installation of acoustic sensor. (a) Side view and (b) Closer view.
Sustainability 14 03263 g004
Figure 5. The hydraulic efficiency when cavitation number decreases.
Sustainability 14 03263 g005
Figure 6. Cavitation bubbles formation with the decreasing cavitation number (σ).
Sustainability 14 03263 g006aSustainability 14 03263 g006b
Figure 7. Cavitation development on the turbine runner blade. (a) Cavitation visualization at blade root. (b) Cavitation visualization at blade outlet.
Sustainability 14 03263 g007
Figure 8. Turbine external performance characteristics changes with cavitation development. (a) Flow rate change with cavitation. (b) Head change with cavitation.
Sustainability 14 03263 g008
Figure 9. Flow visualization of different operating points (ad).
Sustainability 14 03263 g009aSustainability 14 03263 g009b
Figure 10. Pressure fluctuation amplitudes (ΔH/H) within the draft tube: (a) within the cone tube, (b) within the elbow.
Sustainability 14 03263 g010
Figure 11. Pressure fluctuation frequency spectra at (a) cone tube and (b) elbow zones.
Sustainability 14 03263 g011
Figure 12. The peak-to-peak value of noise at different cavitation coefficients.
Sustainability 14 03263 g012
Figure 13. The acoustic time domain signal at different cavitation coefficients.
Sustainability 14 03263 g013
Figure 14. The acoustic frequency domain signal at different cavitation coefficients.
Sustainability 14 03263 g014
Figure 15. The comparison between noise and pressure fluctuation.
Sustainability 14 03263 g015
Publisher’s Note: MDPI stays neutral with regard to jurisdictional claims in published maps and institutional affiliations.

